
94% of researchers rate our articles as excellent or good
Learn more about the work of our research integrity team to safeguard the quality of each article we publish.
Find out more
ORIGINAL RESEARCH article
Front. Conserv. Sci., 27 January 2025
Sec. Animal Conservation
Volume 5 - 2024 | https://doi.org/10.3389/fcosc.2024.1503026
This article is part of the Research TopicNew Challenges and Perspectives in Conservation Breeding ProgramsView all 9 articles
 Morgan A. Maly1,2,3,4*
 Reade B. Roberts3Mia M. Keady5
 Anne Schmidt-Küntzel6Meagan Maxwell3
 Laurie Marker6Matthew Breen4
 Carly R. Muletz-Wolz2†
 Adrienne E. Crosier1†
The relationships between gut microbiota and animal health are an important consideration increasingly influential in the management of wild and ex situ endangered species, such as the cheetah (Acinonyx jubatus). To better understand these relationships, fresh fecal samples are currently required as a non-invasive alternative for the gut microbiome. Unfortunately, fresh samples are challenging to collect in the wild. This study had two aims: 1) to determine the optimal collection time point for cheetah feces after deposit in their native environment of Namibia as a guide for wild cheetah fecal microbiome studies; and 2) to compare the fecal microbiota of two ex situ cheetah populations (Front Royal, VA, USA and Otjiwarongo, Namibia), which also consume different diets. We collected eight fresh fecal samples from cheetahs in Namibia and allowed them to decompose for four days, taking subsamples each day. The fresh Namibian samples (n = 8) were also used in objective two for comparison to fresh USA cheetah samples (n = 8). All samples were analyzed for bacterial community diversity and composition using 16S rRNA gene amplicon sequencing. First, over a five-day sampling period in Namibia, subsamples 1-3 days post-fresh showed no changes in bacterial diversity or composition compared to fresh subsamples. Second, fresh ex situ cheetah samples under Namibian conditions had increased bacterial taxa, more phylogenetically diverse bacterial communities, and compositionally distinct microbiomes from cheetahs managed in human care in the USA. However, when bacterial ASVs were weighted by relative abundance, both populations shared 69% of their total bacterial sequences indicating a conserved cheetah microbiota between the two populations. We also found few differences in predictive functions of the fecal microbiota between the populations, where only one disease-related pathway was higher in the USA samples. Overall, our findings suggest that in dry season conditions (no recorded rainfall) in Namibia, fecals may be usable for up to three days after defecation for microbial ecology studies. There are significant differences between ex situ Namibian and USA populations, and we suggest further investigation into the influence of diet, host demographics, and environment on the gut microbiota and health of cheetahs.
Microbiome studies are becoming an essential part of conservation biology. There is a plethora of evidence supporting the role of gut microbiomes in wildlife health and survival (Bragg et al., 2020; Cabana et al., 2019; Sugden et al., 2020; Gillman et al., 2022; Redford et al., 2012; Clayton et al., 2018; Bragg et al., 2020). Many microbiome studies on non-domestic animals focus on ex situ individuals because it is easier to control experimental variables and ensure timely and accurate sample collection. However, to obtain a better understanding of the complex dynamics between hosts and their gut microbiomes it is also important to study animals in their natural habitat (Amato, 2013). The current gold standard for non-invasive gut microbiome studies is to collect fresh fecal samples to characterize fecal microbiota as a stand-in for gut microbiota. Unfortunately, collecting fresh feces in the wild is quite difficult for many elusive, dangerous, or far-ranging species, including the cheetah (Acinonyx jubatus).
Due to the difficulty in collecting fresh fecal samples, more studies are investigating the temporal stability of fecal microbiota post-defecation. These studies aim to characterize shifts in fecal microbiota once they are exposed to the environment and to identify the timepoint after which the fecal microbiota no longer represent that of a fresh sample. Many studies in various species found evidence for shifts in microbial diversity or composition within five or less days of excretion (Lafferty et al., 2022; Menke et al., 2015; Beckers et al., 2017; Wong et al., 2016), including our previous study on cheetahs in the USA that demonstrated changes after one day post excretion when in moist conditions (Maly et al., 2024). Other studies report no changes at all over the four days of their experiment (e.g., Tal et al., 2017). Because of the large variation in reported timelines of fecal microbial changes, there is no general rule for how fresh is ‘fresh enough’ in fecal microbiome studies. It is recommended that temporal experiments be performed for each new species (Menke et al., 2015), but we suggest that environmental conditions should also be considered (Maly et al., 2024). We therefore stipulate that our previous study on fecal microbiome stability may not be representative for the entire species as it was performed on ex situ cheetahs in a US facility, which may differ from the fecal microbial stability of cheetahs in their native environment. Before we can compare fecal microbiomes of wild and ex situ cheetahs through non-invasive collection, we need a better understanding of how long fecal samples remain stable in the arid and hot climate of Namibia, within the natural range of wild cheetahs.
While microbiome studies in the wild provide important clues for conservation, microbiomes are also relevant for ex situ wildlife. Recently, there has been concern for potential dysbiosis of managed animal microbiomes as gut flora can be shaped by management practices through biotic and abiotic factors such as diet (Bragg et al., 2020; Haworth et al., 2019; Gibson et al., 2019), administration of antibiotics and other veterinary care (He et al., 2018; Dahlhausen et al., 2018), exposure to humans and the built environment (Cheng et al., 2015; Hyde et al., 2016; Wan et al., 2016; West et al., 2019), reduced exposure to conspecifics (Tung et al., 2015), and higher density of animals that may not naturally be in proximity to each other (de Jonge et al., 2022; McKenzie et al., 2017). A high incidence of gastrointestinal (GI) diseases in managed cheetahs contributed to the majority (40-60%) of deaths and euthanasia in captivity between the 1980s and 2000s (Munson, 1993; Munson et al., 2005, 1999; Terio et al., 2018). Given its involvement in GI health and inflammatory responses in many other species, there is a growing interest in characterizing the gut microbiome of ex situ cheetahs in relation to these health issues. Lower microbial species diversity and increased temporal microbial variation have been reported in ex situ cheetahs suffering from GI distress, compared to those that are healthy (Becker et al., 2015). These findings are similar to reports comparing healthy and GI-inflamed domestic cats (Honneffer et al., 2014; Janeczko et al., 2008). Previous studies in cheetah gut microbiomes suggest there may be population differences across wild Namibian (Wasimuddin et al., 2017; Menke et al., 2014), European ex situ (Becker et al., 2014), and USA ex situ (Maly et al., 2024) cheetahs. These existing studies span a variety of collection, processing, and analytical methodologies, making it difficult to make direct comparisons.
In this study, our first objective was to determine how many days after defecation the fecal microbiota remained representative of a fresh fecal in managed cheetahs living in Namibia as a proxy for wild cheetah fecal microbiome sampling. Due to difficulty in collecting fresh fecal samples from the wild, collecting samples from cheetahs in a managed facility within their native home range offers a next-best opportunity. Cheetahs at the Cheetah Conservation Fund (CCF) in Namibia live in large outdoor-only enclosures and are exposed to the same environmental elements as those in the wild. Our second objective was to investigate the differences in fresh fecal microbiota between cheetahs in managed facilities in the USA compared to those in Namibia to understand the effects of environment and diet on the cheetah gut microbiome. We therefore utilized CCF and USA populations to learn more about environment and diet effects on the fecal microbiota.
We collected eight fresh fecal samples from wild-born cheetahs living at the CCF center in Otjiwarongo, Namibia. Cheetahs lived in outdoor-only enclosures with native trees and plants, as well as shade structures for cover. They were fed a raw diet of donkey and horse meat on the bone, with skin and small bones removed, and vitamin and mineral supplement powder rubbed onto the meat (Predator Powder, V-tech, Midrand, South Africa). Their feeding regime included one fasting day a week. Fresh water was available ad libitum. Cheetah ages ranged from 3-14.5 years and included both males and females. Fresh fecals were collected as observed over the course of four days between 9 am and 5 pm. All defecation events were witnessed and fecals removed from the enclosure within 30 minutes. Samples were placed in an adjacent area used as the experiment plot to allow ease of access for continued subsampling. We positioned a generic mesh window screen (Supplementary Figure S1) over the top of the feces to prevent dung beetles, and other animals from taking the remaining feces, but allowing other natural environmental exposure processes to occur. Each day, we removed a one-inch subsection from the end of the fresh fecal with a sterile scalpel and further subsampled the interior core of the one-inch piece with sterile forceps and a second sterile scalpel. The remainder of the feces was placed back in the experimental plot. The first subsample was considered Day 0 (fresh). The subsampling procedure was repeated every 24 h, for four consecutive days (Day 1 – 4) or until the feces ran out (Table 1). We recorded the maximum daily rainfall (cm), humidity (%), and temperatures (C) for each day of collection (Supplementary Table S1). Subsamples were placed in a -20°C freezer until processing.
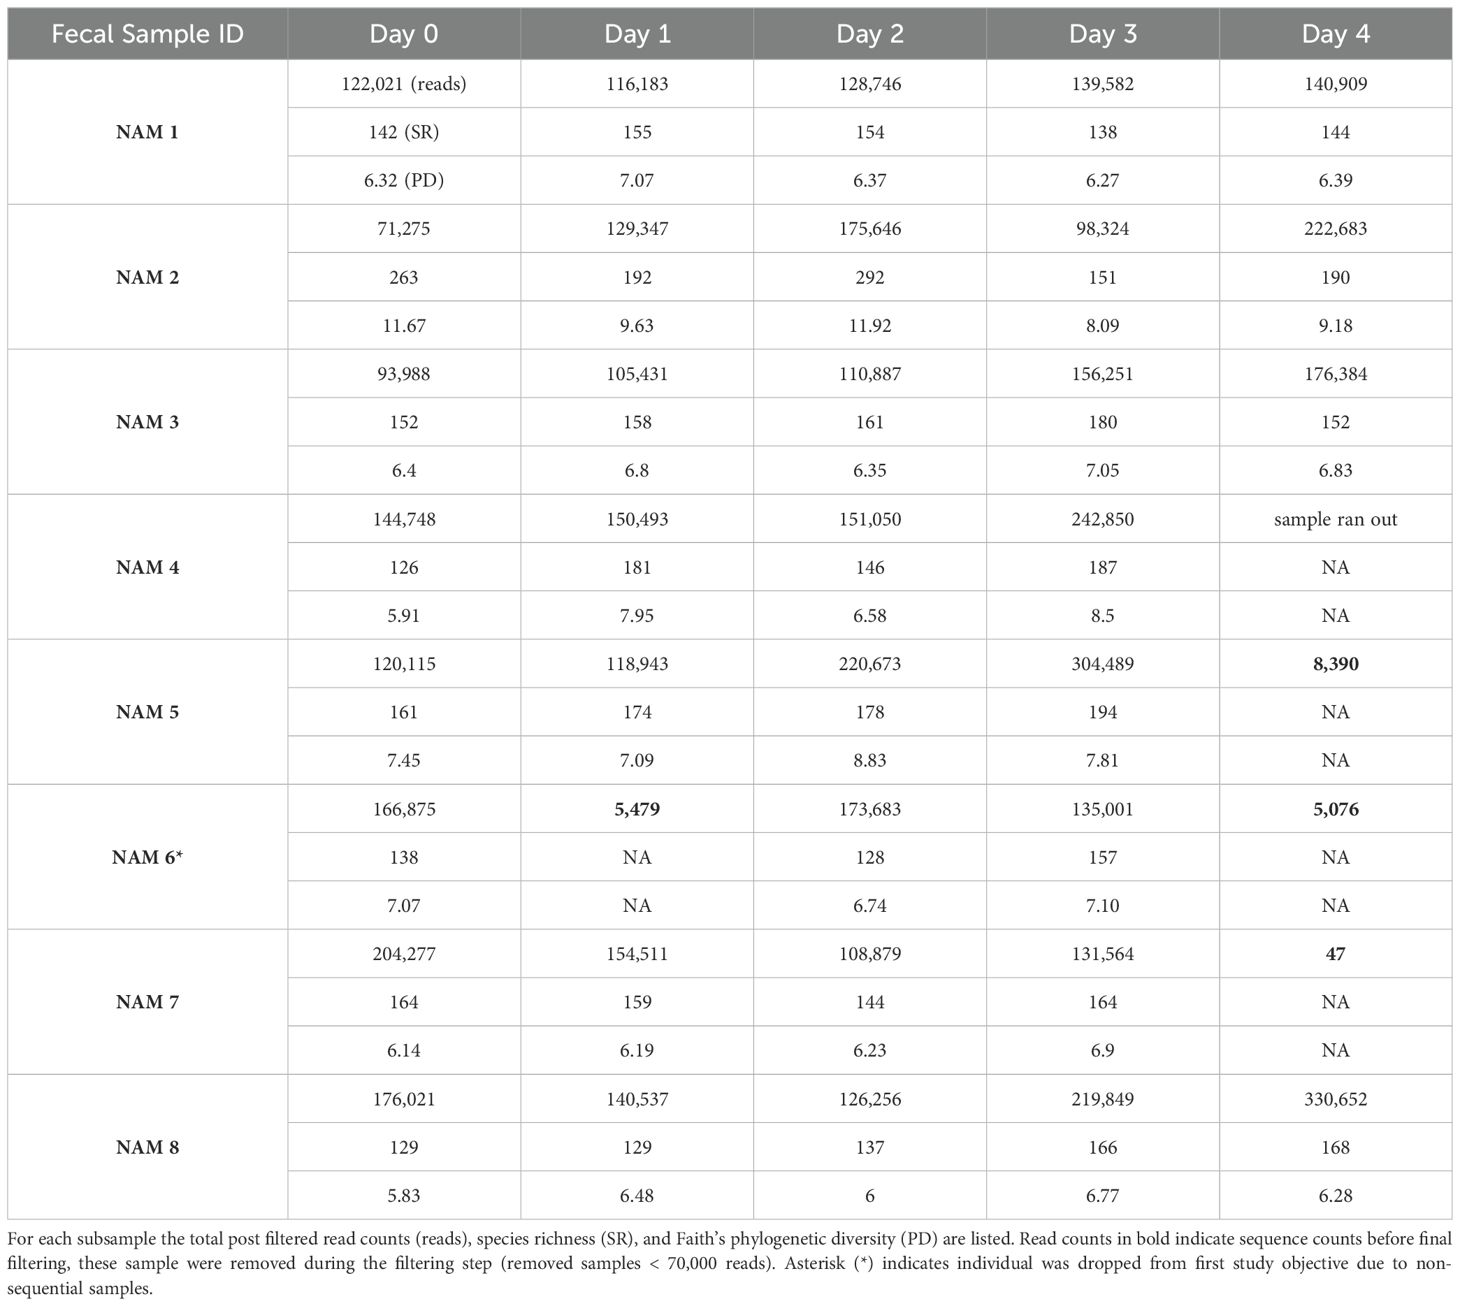
Table 1. Sample collection summary for each fecal sample series.
To compare the microbial ecology of two cheetah populations we used only the fresh subsamples from the above Namibian (NAM) collections (n = 8). In addition, we used eight fresh subsamples from a similar and previously published study collected from the Smithsonian’s National Zoo and Conservation Biology Institute (Front Royal, VA, USA) as described (Maly et al., 2024). Samples from the US-based study were renamed from the Aju (for Acinonyx jubatus) moniker (Aju1, Aju2, etc.) to USA (USA1, USA2, etc.) as in Maly et al. (2024). USA cheetahs lived in outdoor enclosures with access to indoor spaces. The diet for cheetahs at the USA institution was primarily a commercially available ground beef diet that includes beet pulp (Nebraska Premium Canine Diet, North Platte, NE, USA) with the addition of weekly whole rabbits (with fur) and horse bones that contain small amounts of meat and cartilage (~ 200g) but no skin or fur. Of the eight USA fecals collected, two were from adult (6 years old) females while the remaining six samples came from male and female pre-pubertal juveniles (~1 year old), though sex was not noted for these six individual samples.
DNA was extracted at the Namibia-based CCF Conservation Genetics Laboratory from 0.25 g frozen feces using the QIAamp PowerFecal DNA Kit (Qiagen, MD) following manufacturer’s instructions. For each batch of sample extractions, a negative control was included and carried alongside the other samples throughout the experiment, to identify potential extraction contaminants. Following extractions, DNA concentrations were measured with a nanophotometer (Implen NP80-Touch; Implen, Munich, Germany).
Fecal bacterial DNA was amplified following a previously published two-step polymerase chain reaction (PCR) protocol with dual-index paired-end Illumina sequencing (Keady et al., 2021). The PCR amplified the V4-V5 region of the 16S rRNA gene using universal primers 515F-Y (GTGYCAGCMGCCGCGGTAA) and 939R (CTTGTGCGGGCCCCCGTCAATTC) (Muletz Wolz et al., 2018). PCRs were performed in duplicate for each sample, including the negative extraction and PCR controls. To lower the risk of contamination during transit from Namibia to the USA, the PCR was performed at CCF and PCR products shipped on ice to the Center for Conservation Genomics (CCG), Smithsonian National Zoo and Conservation Biology Institute. Duplicate PCR products were combined before being purified with magnetic beads. After the first bead purification, samples were indexed with i5s and i7s, cleaned again, quantified, and pooled as specified in Keady et al. (2021). An agarose gel was run of the 16S rRNA library and the target band (~578 base pairs) was isolated and removed using a QIAquick Gel Extraction Kit (<ns/>28704, Qiagen, MD) and diluted to 4 nM. All samples were sequenced using an Illumina MiSeq (v3 chemistry: 2 x 300 bp kit) at CCG. For our second objective, to avoid any bias from sequencing, all Day 0 (fresh) sample libraries from USA and NAM collections were pooled and re-sequenced together on an Illumina MiSeq (v3 chemistry: 2 x 300 bp kit) at CCG.
Demultiplexed Illumina Miseq sequencing reads were imported into R version 4.0.3 (Team, 2022) using RStudio (v 2022.12.0 + 353). We utilized R package “dada2” version 1.16.0 (Callahan et al., 2017, 2016) to merge paired ends, remove chimeras, and filter out low quality reads (maxEE > 2). Filtered and merged sequences from two sequencing runs were combined to generate amplicon sequence variants (ASVs) and assign taxonomy using the Ribosomal Database Project [RDP (Wang et al., 2007)] 16S training set (set 16, release 11.5). A phylogenetic tree was built using Quantitative Insights Into Microbial Ecology 2 [vQIIME2-2020.8; (Bolyen et al., 2019)] using FastTree (Price et al., 2009). We imported the ASVs, taxonomy table, phylogenetic tree, and metadata into a phyloseq object (McMurdie and Holmes, 2013) for processing. We removed putative contaminant sequences using the combined Fisher method with a threshold of 0.1 in the R package “decontam” [v1.18.0 (Davis et al., 2018)]. We removed ten contaminant sequences and then filtered out singleton ASVs (ASVs that occur in only one sample), ASVs classified as Cyanobacteria, negative control samples, and low sequence count (< 71,275 reads) samples. After quality control and filtering, the sequencing depth variation (max/min) was 4.6 fold (max = 330,423, min =71,066).
For population comparisons, sequence reads from the fresh Namibian (NAM) and USA (USA) samples were combined into a phyloseq object after filtering and merging and were assigned taxonomy together using QIIME2 [vQIIME2-2020.8; (Bolyen et al., 2019)] using FastTree (Price et al., 2009). After taxonomy assignment, we split the phyloseq object in two based on location (NAM and USA) for decontam to remove contaminant sequences separately. While the two populations were indexed, prepped for sequencing, and sequenced in the same place (CCG) and on the same sequencing run, the samples were collected and extracted in different locations (CCF in Namibia and SCBI in USA) and may have different background contamination. The number of contaminants removed were three and one from the fresh NAM and USA samples, respectively. After decontam, data were merged back together into a final clean phyloseq object. After cleaning, we compared sequencing depth across samples. We found sequencing depth variation (max/min) was 26.3-fold between the highest sample and lowest sample (max =83,479, min =3,175). Based on current literature (Weiss et al., 2017), we rarefied all samples to the lowest sequencing depth (3,175).
Statistical analyses were performed in RStudio for R. Significance for all analyses was set to p < 0.05 and we adjusted p-values for multiple comparisons using Bonferroni. Analysis pipelines for characterizing microbial structure and composition were based on previous research (Muletz-Wolz et al., 2019a, 2019b; Keady et al., 2021; Bragg et al., 2020). For both, comparisons across sampling days and between two populations, we conducted two metrics of microbial diversity which included alpha diversity (within sample variation), beta diversity (between sample variation), and the changes in relative abundance at the ASV and Phyla levels. For comparisons of fresh samples by population we also predicted functional pathways based on marker gene sequences using PICRUSt2 and linear discriminant analyses effect size using LefSe.
Fecal ID NAM 6 was omitted from this objective, due to an incomplete series collection (Table 1). Relative abundance was measured using the package phyloseq (McMurdie and Holmes, 2013) using the function tax_glom() at the phyla level and merge_samples() function by Sample Day. Differential abundance among sample days was calculated with raw ASV counts using Multivariable Association in Population-scale Meta-omics Studies (MaAsLin2) software (Mallick et al., 2020, 2021). MaAsLin2 was performed on the ASV, family, and phylum levels. For the family and phylum levels, the full dataset was collapsed to the appropriate levels using the tax_glom() function in phyloseq. For all levels, the model included Sample Day as a fixed effect (reference category = Day 0) and Fecal.ID as a random effect, where max significance for Benjamini-Hochberg adjusted p values (q values) was set to > 0.05 and all other parameters were set to default.
We examined changes in microbial diversity over time (sample days) using two alpha diversity metrics, species richness (SR) and Faith’s phylogenetic diversity (PD). SR is the number of unique ASVs in a sample and PD measures the amount of biodiversity based on the phylogenetic relationships of the taxa and the total tree branch length of ASVs in a sample (Faith, 1992, 2018). Faith’s PD was calculated for each subsample with the R package “picante” (Kembel et al., 2010). Using the “lme4” R package (Bates et al., 2015), we performed mixed effects linear models, with SR or PD as the response variable, sample day as a fixed effect, and fecal ID as the random effect. SR and PD distributions met assumptions of normality (Shapiro-Wilk) and homoscedasticity (Levene).
To identify differences in community composition between subsamples across sampling days we measured Bray-Curtis (abundance weighted taxa), Jaccard (presence-absence of taxa), and unweighted UniFrac (presence-absence with inclusion of phylogenetic relationships of taxa) distances. We used PERMANOVAs (Anderson, 2017) in the package “pairwiseAdonis” (Martinez Arbizu, 2020) using the adonis2() function where Bray-Curtis, Jaccard, and unweighted Unifrac distances were the response variable, sample day was the explanatory variable and fecal ID was the random effect. Post hoc analyses were performed in the same package using the pairwise.adonis2() function and p-values adjusted using Bonferroni. To identify whether dispersion of microbiota composition differed among sample days we used PERMDISP from the package “vegan”, betadisper() function (Oksanen et al., 2022).
We measured SR and Faith’s PD between the two populations as defined above. Using the “lme4” R package (Bates et al., 2015), we performed linear models, with SR or PD as the response variable and Population (NAM, USA) as a fixed effect. SR and PD distributions met assumptions of normality and homoscedasticity (Levene). For beta diversity, we again used the same metrics as described above to identify microbial compositional differences between the two populations. We used PERMANOVAs (Anderson, 2017) in the package “pairwiseAdonis” where Bray-Curtis, Jaccard, and unweighted Unifrac distances were the response variable and population (NAM, USA) was the explanatory variable. To identify whether dispersion of microbiota composition differed between the populations we used PERMDISP from the package “vegan”, betadisper() function. Relative abundance was measured using the package phyloseq (McMurdie and Holmes, 2013) using the function tax_glom() at the phyla level and merge_samples() function by Population. We used ps_venn() function in the “MicEco” package (Russel, 2021) to identify unique and overlapping ASVs by population via raw counts and ASVs weighted by abundance (where ASVs with greater abundance carry a larger influence, weight = TRUE).
We used Linear Discriminant Analysis (LDA) Effect Size (LEfSe) (Segata et al., 2011) in the R package “microbiomeMarker” (Cao et al., 2022) to identify microbial taxonomies enriched in one of the two populations. The threshold minimum LDA score was set to 4 to filter out features with lower effect sizes and detect microbial features with potentially more biologically meaningful significant differences between the two cheetah populations.
To identify potential functional relevance of the microbial community differences between the two cheetah populations we used Phylogenetic Investigation of Communities by Reconstruction of Unobserved States 2 (PICRUSt2, Version 2.5.1; Douglas et al., 2020). We used the Kyoto Encyclopedia of Genes and Genomics (KEGG) database to assign predicted functions and metabolic networks of the bacterial communities (Caspi et al., 2016). Statistical analyses were performed in the Statistical Analysis of Taxonomic and Functional Profiles (STAMP v2.1.1) software (Parks et al., 2014) to identify significant functional KEGG groups at three classification levels between the two populations. We performed Wilcoxon tests to compare functional groups between the populations and adjusted p-values using the Benjamini-Hochberg false discovery rate (FDR) method to account for multiple hypothesis testing. Results were reported as the mean ± standard deviation of the proportion of sequences assigned to the category by population (USA or NAM). Significance was set to p < 0.05.
We obtained 5,031,818 high-quality sequences from 32 samples (Table 1). Individual NAM 6 was dropped from the degradation study because of low sequence yields in subsequent samples which led to non-consecutive sampling. The average number of sequences per sample was 157,244 (range 71,066 – 330,423). There were 576 ASVs from eight phyla including Firmicutes, Bacteroidetes, Fusobacteria, Actinobacteria, Proteobacteria and to a lesser extent (≤ 2 ASVs) Candidatus Saccharibacteria, Chloroflexi, and Deinococcus Thermus (Figure 1A). The seven fresh subsamples (Day 0) were used as the best representatives of the cheetah gut microbiota in our study, and they consisted of 193 ASVs from five Phyla including Firmicutes (41.2% pooled abundance, range across samples 28.4 - 69%, 114 ASVs), Bacteroidetes (28.1%, 3.6 - 46.9%, 34 ASVs), Fusobacteria (16.4%, 7 – 27.7%, 14 ASVs), Actinobacteria (11.4% 4.8-23%, 18 ASVs), and Proteobacteria (2.9%, 0.65 – 7.5%, 13 ASVs). Only the Phylum Actinobacteria was differentially abundant across days, with lower abundance in Day 4 compared to Day 0 (effect size = -1.64, standard error= 0.43, p.adj = 0.029). Within the Phylum Actinobacteria, no families or abundant ASVs were differentially abundant, suggesting that temporal decay is impacting only the higher-level taxonomic distribution and not one particular family within this phylum. Further, across all bacteria and sampling days, we did not detect any differentially abundant taxa at either the ASV or family level.
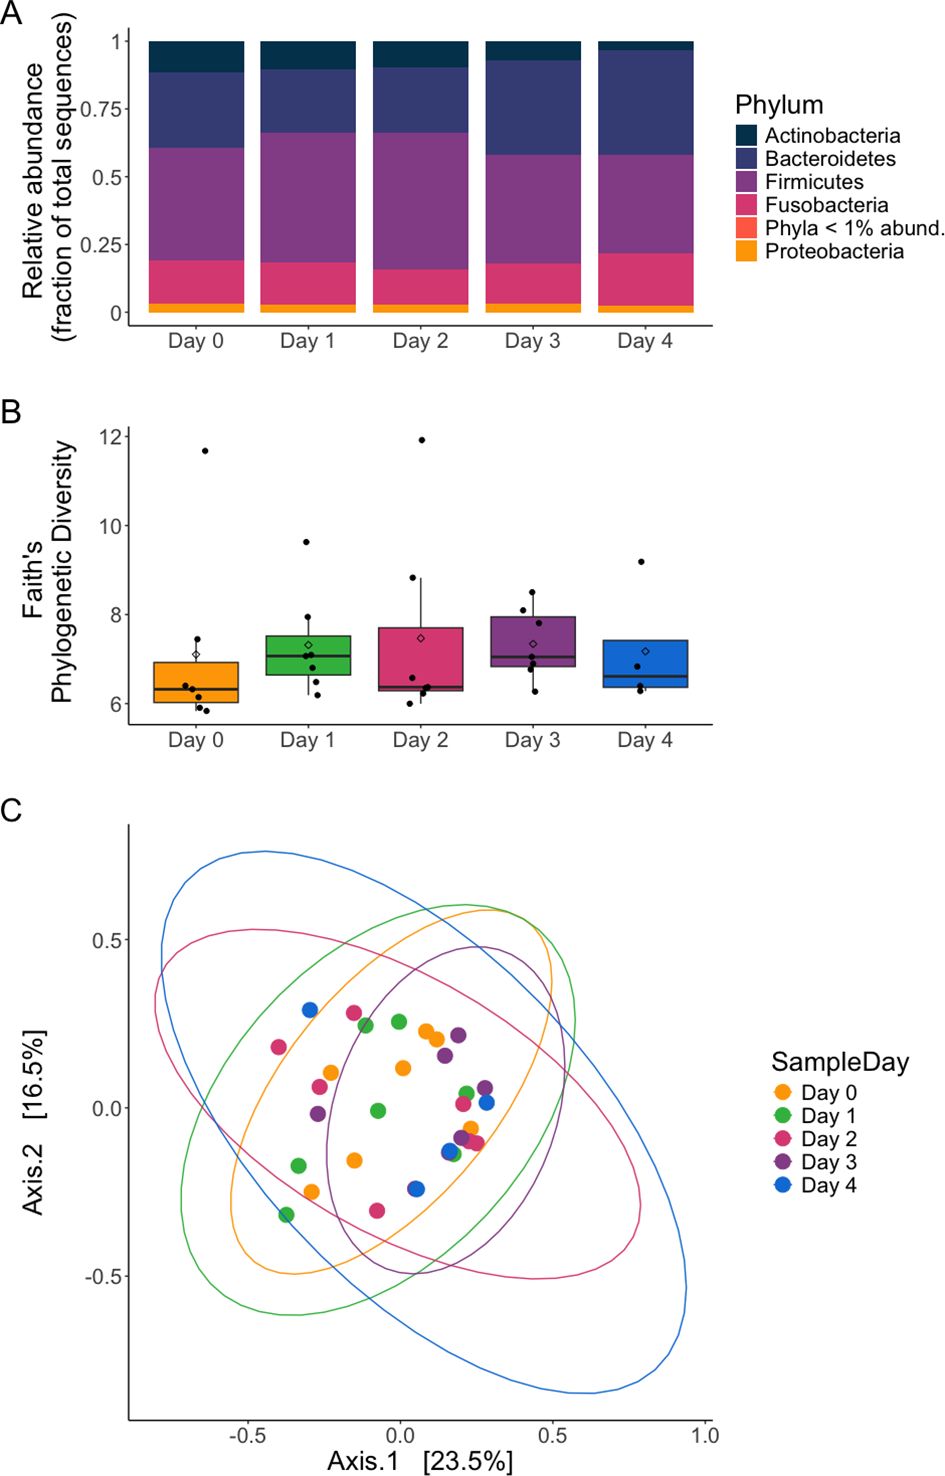
Figure 1. Namibian (NAM) cheetah fecal microbiota generally did not change from fresh sample day across any other sample day (colors) for (A) relative abundance (except for Actinobacteria), (B) alpha diversity (PD), or (C) beta diversity metrics. (A) Pooled relative abundance of dominant bacterial phyla in NAM cheetah feces by sample day (Days 0-3, n=8 samples each day; Day 4, n=4). Phyla with < 1% relative abundance were grouped together. Only Actinobacteria phylum were differentially abundant, with day 4 different from the other days. (B) Faith’s phylogenetic diversity (PD) for NAM feces did not change across sample days (C) Bray-Curtis dissimilarity by sample day; no later days (Days 1-4) were different from Day 0 (fresh).
Bacterial communities remained similar over time, with little variation between fresh fecal samples at Day 0 and subsequent days. Within samples (alpha diversity), both SR (Supplementary Figure S2A) and Faith’s PD (Figure 1B) remained similar across the fresh and the subsequent sample days (Table 1). Bacterial SR was 162.43 ± 46.71 (mean ± standard deviation) and PD was 7.10 ± 2.08 at Day 0 with minimal changes thereafter (GLMMs, SR: x2 = 0.7639, df = 4, p =0.943; PD: x2 = 0.958, df = 4, p =0.916). Similarly, microbial composition did not change between samples over time in presence absence measures (PERMANOVA Sample Day: Jaccard Pseudo-F4,27 = 0.5638, R2 = 0.07709, p = 0.064, UniFrac Pseudo-F4,27 = 0.4034, R2 = 0.05639, p = 0.194; Supplementary Figures S2B, C, respectively). Microbial composition did however vary over time for abundance weighted composition (PERMANOVA Sample Day: Bray-Curtis Pseudo-F4,27 = 0.9866, R2 = 0.12752, p = 0.009; Figure 1C); although in pairwise post hoc analyses, no days were significantly different from each other including all later sample days (Days 1-4) compared to Day 0 (post hoc Bray-Curtis p adj > 0.156). This indicates no two sample day comparisons show large enough differences to be considered significant and the global effect of the PERMANOVA may be driven by subtle differences undetected in the pairwise comparisons. Additionally, pairwise testing by nature uses smaller sample sizes which may limit power. Within group dispersion of community composition was similar across sample day groups (PERMDISP: Bray-Curtis p = 0. 754, Jaccard p = 0.257, unweighted Unifrac p =0.754).
In the comparison of fresh fecal samples from Namibia and the USA, we obtained a total of 50,800 high-quality sequences from 16 samples after rarefying by lowest sequence sum (3,176). There were 226 ASVs from six phyla including Firmicutes, Bacteroidetes, Fusobacteria, Actinobacteria, Proteobacteria, and Candidatus Saccharibacteria (Figure 2). None of the phyla were differentially abundant between the two populations (Wilcoxon rank test; all phyla p.adj > 0.62).
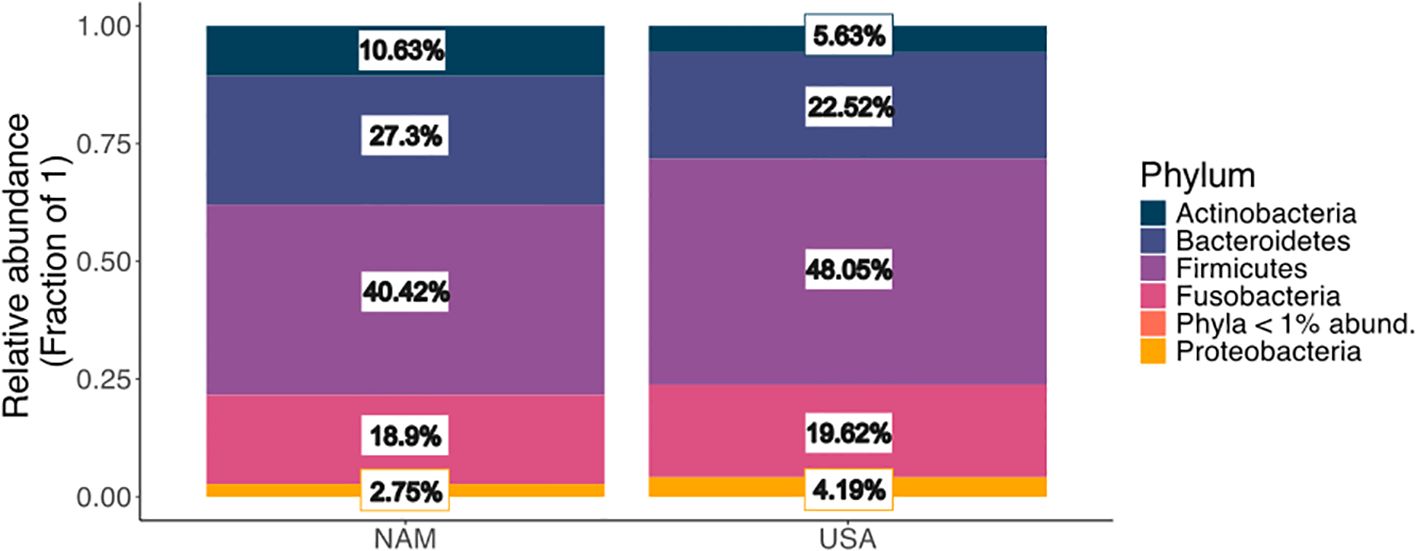
Figure 2. Pooled relative abundances (fraction of total sequences) of phyla for fresh fecals from ex situ NAM (n=8) and USA (n=8) cheetah populations. Phyla <1% abundant (Candidatus Saccharibacteria) for NAM and USA were too low to visually appear on plot but were 0% and 0.01%, respectively for each population.
Analysis of microbial community revealed differences in ASV diversity and composition between the two populations. Within group diversity measures were higher in the Namibian samples in both SR and PD (ANOVA; SR: F1,14 = 18.96, p = 0.0007 and PD: F1,14 = 29.79, p = 0.00008; Figure 3). SR for NAM was 88.4 ± 12.6 vs USA 64.5 ± 9.06 and PD for NAM was 4.97 ± 0.47 vs USA 4.01 ± 0.17. Between group microbial composition also varied by population (PERMANOVA; Bray-Curtis Pseudo-F1,14 = 5.1036, R2 = 0.267, p = 0.002; Jaccard Pseudo-F1,14 = 7.8492, R2 = 0.359, p = 0.001; Unweighted UniFrac Pseudo-F1,14 = 8.019, R2 = 0.364, p = 0.002; Figure 4). Dispersion of the samples within a group (Population) around the centroid were determined to be similar (p > 0.05) across populations (PERMDISP: Bray-Curtis p = 0. 498, Jaccard p = 0.397, unweighted Unifrac p =0.465).
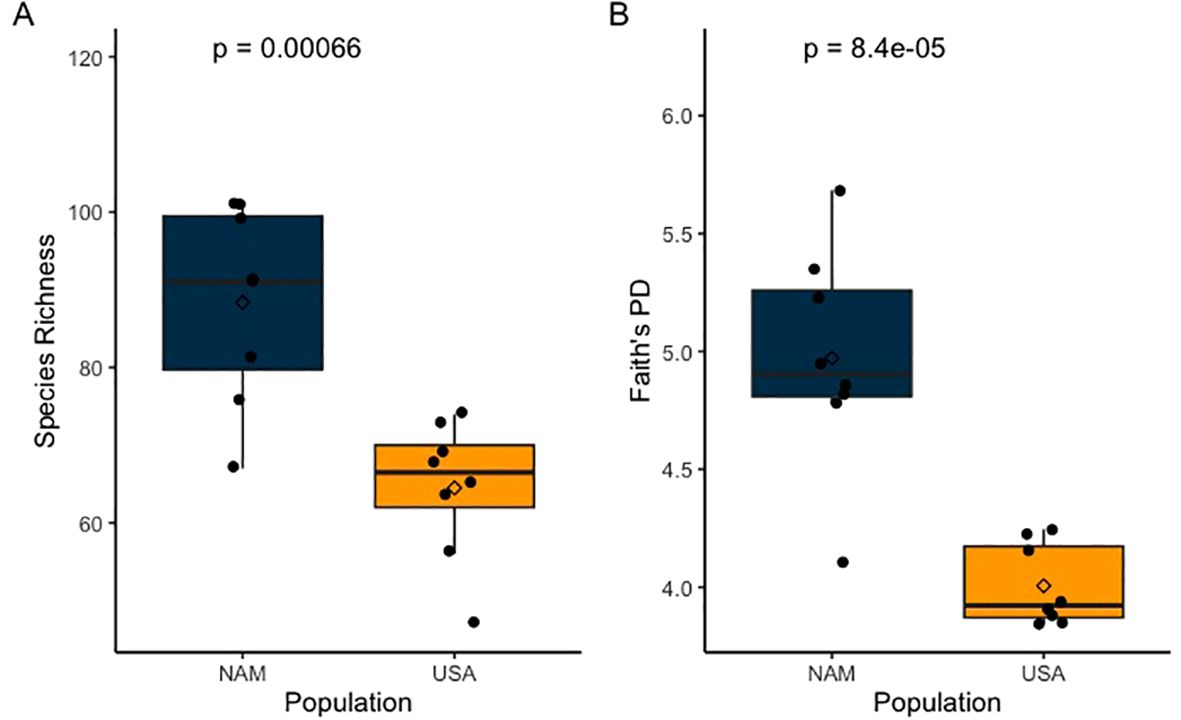
Figure 3. Box plots indicating fresh fecals from ex situ cheetahs in the USA (n = 8) exhibited lower (A) species richness (ANOVA, p = 0.00066) and (B) Faith’s phylogenetic diversity (PD) (ANOVA, p = 0.00008) compared to fresh fecals (n=8) from ex situ NAM cheetahs.
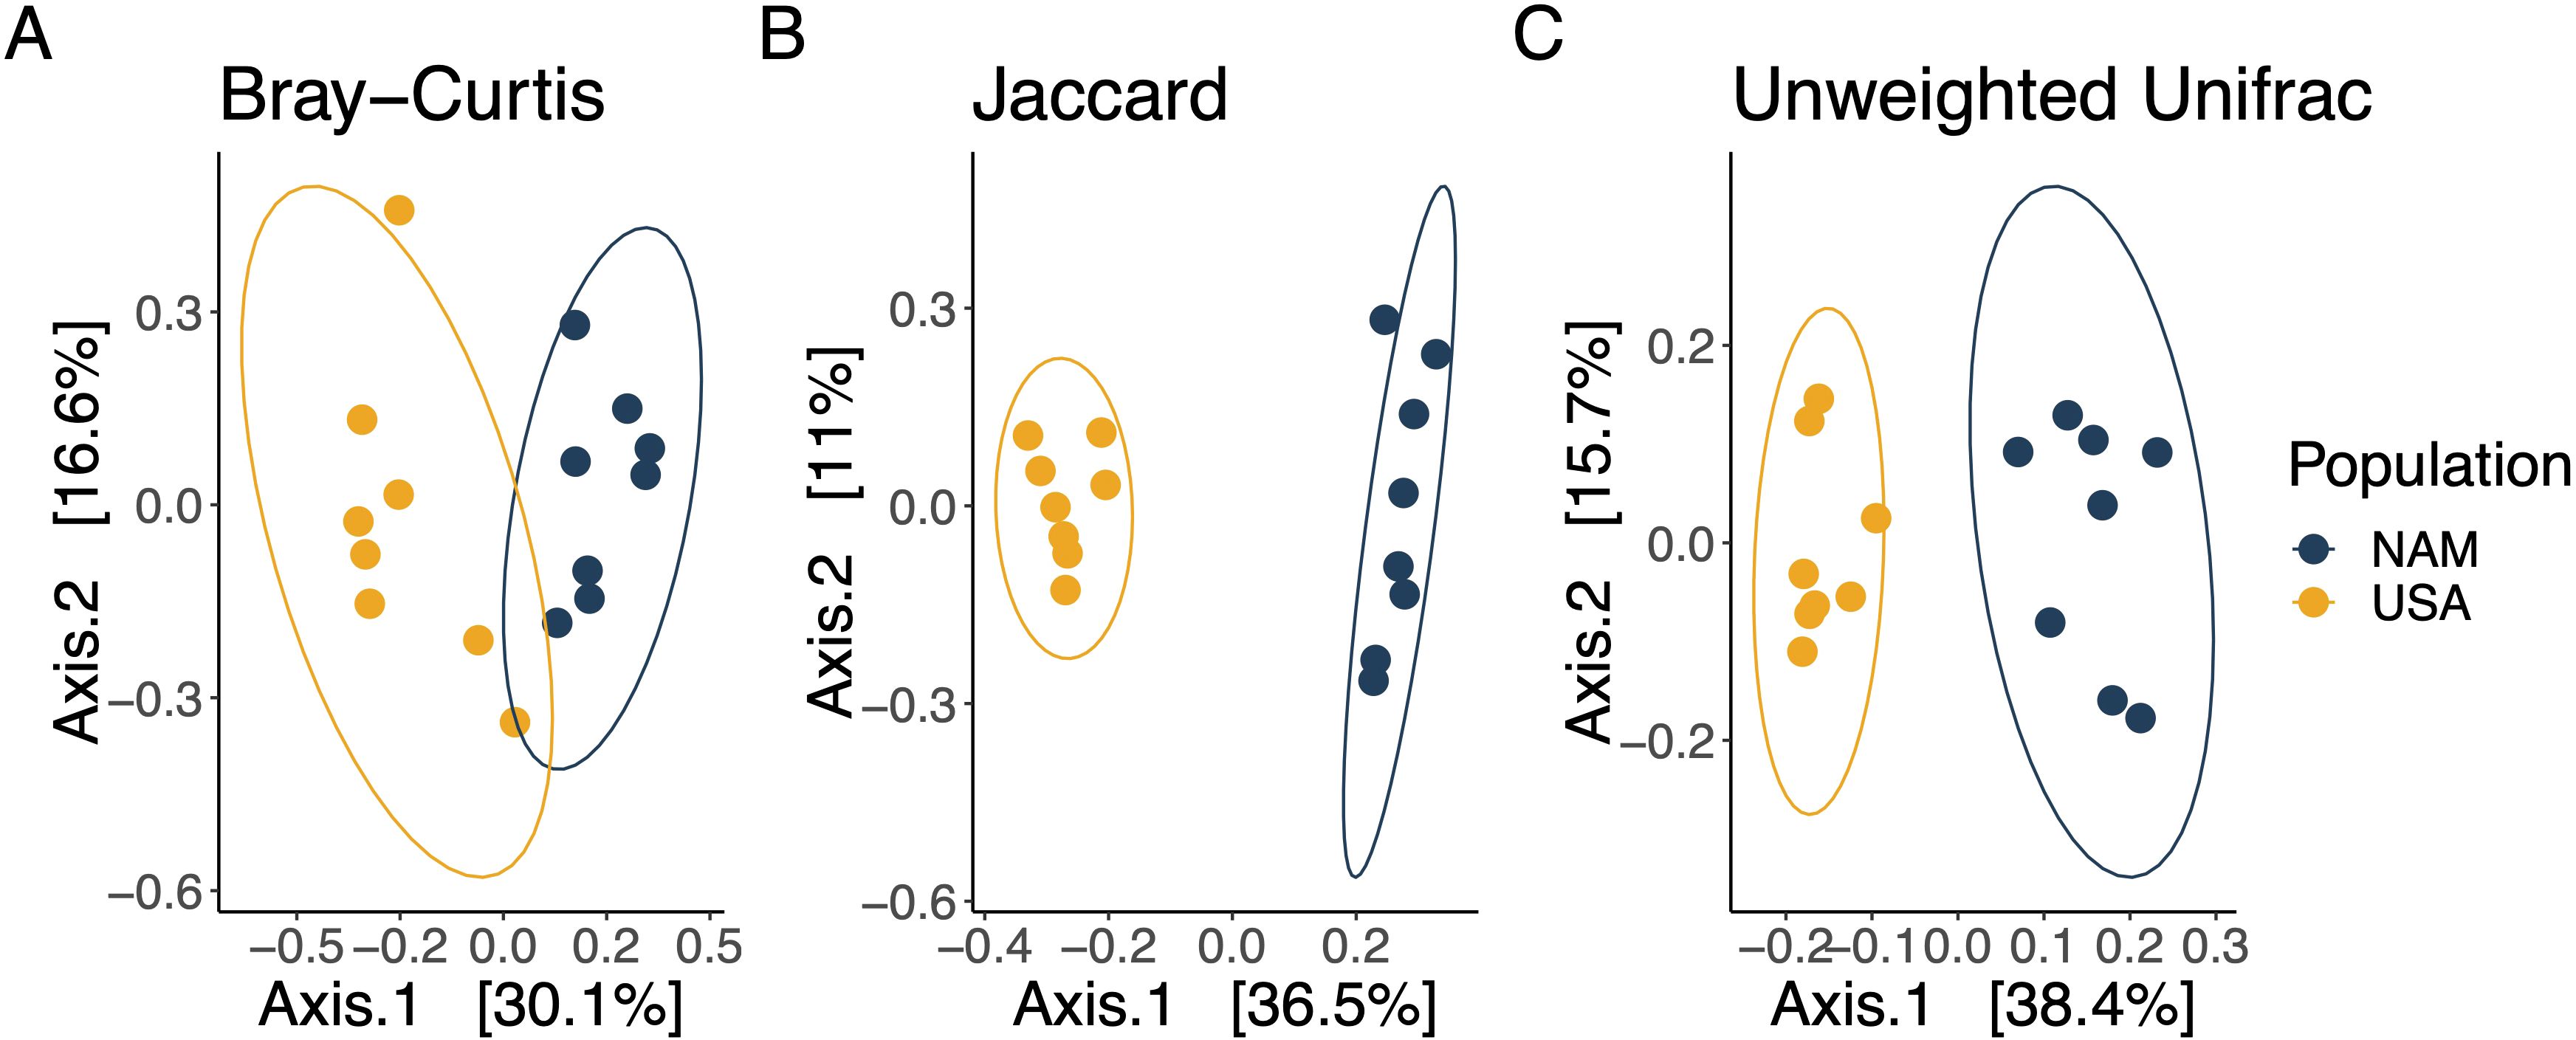
Figure 4. Principal coordinate analysis ordination plots show differences between the NAM and USA populations for (A) Bray-Curtis dissimilarity (p = 0.002), (B) Jaccard dissimilarity (p = 0.001), and (C) Unweighted UniFrac distances (p = 0.002) with 95% data ellipses by population. All p-values based on PERMANOVA models.
Overall, NAM samples had 104 ASVs not found in the USA samples, corresponding to 46% of the total number of unique 226 ASVs, while the USA had 54 unique ASVs (24%). The two populations shared 68 out of the total 226 ASVs (30%). When ASVs were weighted by abundance (number of sequences per ASV, where more abundant ASVs carry more weight), the proportion of total sequences (50,800 sequences) shared between the two populations increased to 69% (35,052 sequences from 68 ASVs). Whereas 20% of sequences (10,160 sequences from 104 ASVs) were unique to NAM samples alone, only 11% (5,588 sequences from 54 ASVs) were unique to USA samples.
Using LefSe LDA we found 26 specific taxa that were more common in either the NAM (21 taxa) or USA cheetahs (5 taxa; Figure 5A). Hierarchical clustering of samples based on abundance of these 26 taxa cleanly delineates NAM versus USA samples (Figure 5B). Taxa that were enriched in the Namibian samples belonged to three phyla, Actinobacteria (including Coriobacteriaceae Collinsella), Bacteroidetes (including Porphyromonadacea Barnesiella and Prevotellacea Alloprevotella), and Firmicutes (including Erysipelotrichaceae Faecalitalea, Lachnospiracea Ruminococcus2, Peptococcaceae Peptococcus, and Ruminococcacea Clostridium IV). The five taxa enriched in USA cheetahs were also found in the NAM cheetahs, but in lower amounts. By contrast, eight of the taxa present in the NAM cheetahs were missing completely from all of the USA samples (Figure 5B). These eight taxa were all members of Bacteroidetes (Prevotellaceae, Alloprevotella, Porphyromonadaceae, Barnesiella, and two unknown species in the Alloprevotella and Barnesiella genera) or Firmicutes (Faecalitalea and an unknown species in the Faecalitalea genus).
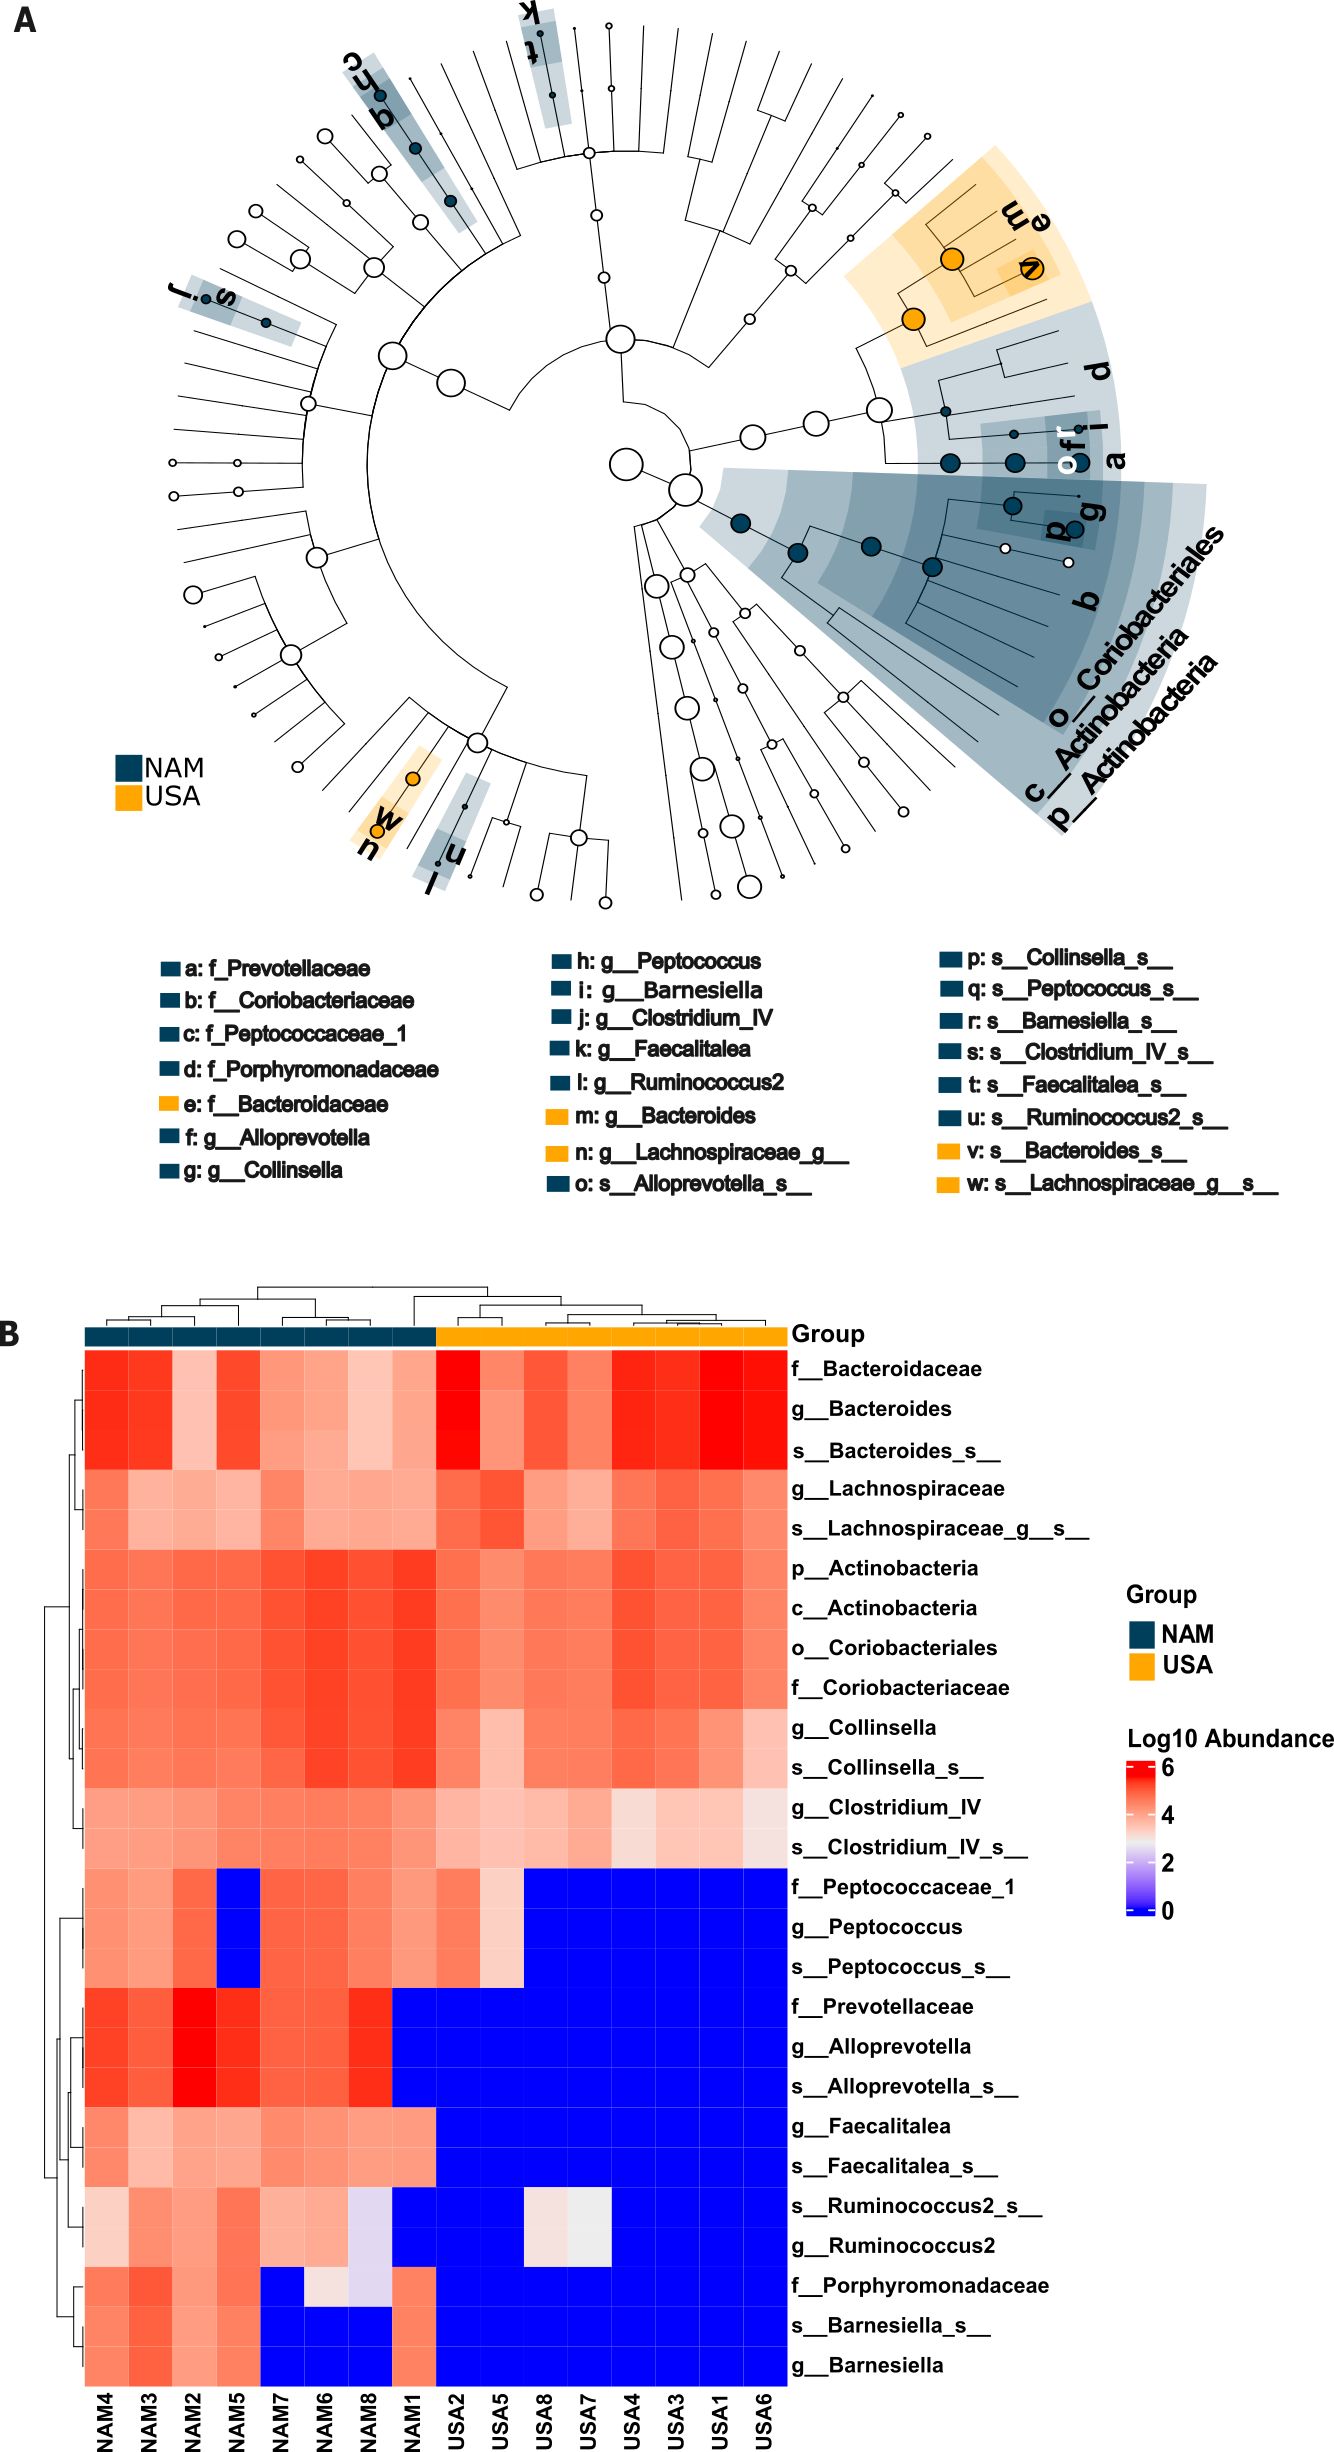
Figure 5. Linear Discriminant Analyses Effect Size (LDA LefSe) of bacterial taxa between NAM and USA ex situ cheetahs with LDA scores ≥ 4. Taxa are listed with a prefix indicating classification level (f = family, g = genus, s = species). Suffixes with blanks after the classification level (“_g:” or “_s:”) indicates an ASV group that could not be confidently classified as a specific genus or species within the highest level listed (ex,. s_Lachnospiraceae_g:s: indicates an unannotated species in an unannotated genus within the family Lachnospiraceae). (A) Cladogram depicting phylogenetic relationships of enriched taxa by population (blue = NAM, yellow = USA, white = no difference between populations) where higher order classifications are labeled on the figure and lower (family, genus, species) are labeled with a letter and a corresponding taxon in the key; (B) Heatmap of enriched taxa in rows with individual cheetah samples as columns. Samples are clustered by both taxa and sample similarities. Log10 Abundance is indicated by color where darker red is highly abundant (6) and dark blue is absent (0).
When looking at predictive functional analyses, metabolism was the highest predicted Level 1 KEGG Orthology (KO) category function of the microbiome, using PICRUST2 analyses in both populations (NAM 78.4% ± 0.01% and USA 78.6% ± 0.2%). None of the Level 1 KO categories differed between the two populations. For Level 2 KO category comparisons, USA samples had higher proportions of sequences that approached significance (p.adj <0.1) and were associated with lipid metabolism, parasitic infectious disease, and carbohydrate metabolism (Supplementary Figure S3; Wilcoxon test with Benjamini Hochberg corrected p-values; lipid metabolism: effect = 1.29, overlap = 0.06, p.adj = 0.054; Parasitic infectious disease: effect = 1.06, overlap = 0.13, p.adj = 0.076; Carbohydrate metabolism: effect = 1.04, overlap = 0.11, p.adj = 0.09). However, the total proportion of sequences attributed to these categories for both groups was small. Among the most specific categories, Level 3, there were no pathways that differed between the two cheetah populations (see Supplementary Materials for model outputs for all three levels).
Wildlife gut microbiomes are of increasing interest because of their roles in overall organismal health. Fresh fecal samples are regarded as the gold standard for gut microbiome studies but are difficult to collect from wild animals. Here we performed two studies to better understand 1) how fecal microbiota change over time when exposed to the natural environment of the cheetah in Namibia and 2) how ex situ cheetahs in a USA facility compare to these ex situ cheetahs in a Namibian facility which are housed in habitat native to cheetahs and were assessed as a stand-in for true in situ populations. In aim one we found the cheetah fecal microbiota was stable in the dry Namibian environment for three days post-defecation which lengthens the time scientists can collect fecals in the wild under similar conditions. In aim two, there were strong differences in fecal microbiota between the fresh Namibian samples and the fresh USA samples that may have functional metabolic and disease-related consequences. Despite these differences we also found evidence for a conserved cheetah microbiome between the two populations.
In our first aim, we found that after three days of exposure to the dry Namibian environment, cheetah fecals were still similar in microbial diversity, composition, and structure to fresh fecals. However, Actinobacteria relative abundance began to change by Day 4. These patterns of compositional stability are similar to domestic cat samples in tubes at room temperature (Tal et al., 2017) but longer than previously reported in ex situ cheetah fecals sampled during a hot (max daily temperatures 27-33°C, Supplementary Table S2) and wet (max cumulative rainfall over a five day study period 2.1 cm, average max daily humidity 98.7%) summer season in Virginia, USA (Maly et al., 2024). In our previous US-based cheetah study, there were shifts in bacterial composition in abundance weighted and presence-absence metrics that occurred by Day 2 post-deposit. There was no precipitation during the sampling period for the current study as opposed to the US based study which experienced heavy rain during temporal sampling. The arid (0 cm of rainfall, average max daily humidity 40.9%) climate during the dry season in Namibia may aid in stabilizing the post-defecation shifts of the fecal microbiota. Similarly, giraffe fecal microbiota composition was stable in the dry Namibian environment until rain occurred before day five sampling in the series (Menke et al., 2015). It is important to note that fecals left in the experiment plot were covered with screens to prevent the fecals from being taken by larger insects (e.g., dung beetles), small animals, etc., which may have offered additional protection against microbial alterations from these or other large insects and animals (Wong et al., 2016). However, by collecting the middle core of the fecal not exposed to the environment directly, we hoped to mitigate these caveats as much as possible. Our sample size was limited due to the nature of working with non-model endangered animals and while our study may benefit from increased sample size to account for potential variation among individuals, our sample size was similar to studies of a similar nature (Menke et al., 2015; Tal et al., 2017; Lafferty et al., 2022; Wong et al., 2016). Together, our data suggest that researchers sampling cheetahs in Namibia during the dry season can collect up to 3-day-old fecal samples, as a proxy for studying gut microbiota. If collecting during a time of higher moisture (e.g., rain), however, based on our previous work, it is likely the collection window is closer to around 24 hours (Maly et al., 2024).
Physical characteristics of the NAM samples over time were similar to those previously reported in ex situ US samples (Maly et al., 2024). In brief, fresh samples were wet and shiny, very dense, pungent, and exhibited frequent insect activity (see Supplementary Figures). By Day 1, a crust started to form but the outside was still a bit tacky and the inside of the fecal still contained some soft feces and moisture. Day 2 feces had well-formed crusts that appeared dark and were beginning to dry out, even on the inside. Days 3 and 4, most fecals, especially those that were not well-formed logs, were very dark and very dry.
Finally, our study timeline terminated after four days post fresh, but it may be useful to sample for an extended period to identify changes beyond four days to aid in assessing the age of fecals from the field when the deposit event was not witnessed. We were unable to determine fecal degradation day age indicators with the current study because there were so few microbial differences across four days.
We compared fresh samples of the above Namibian project with fresh samples at a US facility from a previous study (Maly et al., 2024). NAM and USA samples consisted of the same main five Phyla previously reported for cheetahs (Wasimuddin et al., 2017; Menke et al., 2014; Maly et al., 2024). All five Phyla were similar in abundance across both populations, exhibiting greater proportions of Firmicutes compared to Bacteroidetes. Though abundance data are not directly comparable between studies, it is noteworthy that the ex situ NAM and USA cheetahs in the current study had numerically lower abundances of Firmicutes [41.2% (time dataset NAM]/40.4% (combined dataset NAM) and 48.0% USA] compared to the wild cheetahs [56.2% (Menke et al., 2014) and 68.5% (Wasimuddin et al., 2017)] which corresponds to a trend seen in a study on bobcats, where those in zoos trended toward lower Firmicute abundance (p < 0.1) compared to wild bobcats (Eshar et al., 2019). Research in domestic cats shows Firmicutes were less abundant in obese compared to healthy weight individuals (Fischer et al., 2017; Ma et al., 2022). The individuals included in our study were not obese, however it is possible that ex situ cheetahs are less lean than their wild counterparts which may explain the lower Firmicute abundance, although other factors may be involved.
We discovered a high degree of variation in the fecal microbial diversity, composition, and structure between the two populations. We can assume the higher diversity of ex situ NAM fresh samples may be due to a variety of factors, including cheetah diet, demographics (age, sex, reproductive status), and environmental factors (climate and location). Since the scope of this study was not to define the effects of these differences, we did not control for them; however, some information appears relevant. Differences in food structure (minced vs whole prey mice) were responsible for significant differences in fermentation profiles in domestic cats, however they did not result in different alpha diversity estimates (D’Hooghe et al., 2024). The diet between the two facilities differed, with primarily donkey meat on the bone for the NAM vs commercial ground beef as the primary diet for USA; however, USA cheetahs were not fed solely minced commercial diet as they were given weekly whole prey items and bones. There is evidence that carcass diets contain higher amounts of non-digestible elements which obligate carnivores such as the cheetah, may have evolved to utilize as a source of dietary fiber (Depauw et al., 2013, 2012), and which may alter the gut microbiomes. Other important aspects that may influence the fecal microbiota include cheetah demographic data such as age (ranges, NAM: 3-14.5 years; USA: 1-6 years (Wasimuddin et al., 2017; Masuoka et al., 2017; Rojas et al., 2023), and sex (Wasimuddin et al., 2017)). Most evident of all, the two populations lived on different continents and the cheetahs and voided fecals were therefore exposed to different environmental conditions including but not limited to weather (Maly et al., 2024; Menke et al., 2015) and habitat (Gani et al., 2024) that likely also influenced the microbiota. Thus, a number of variables could be responsible for the differences we find between populations, and future studies comparing many populations are needed to determine their relative impact on cheetah microbiota.
Bacterial communities differed between the two populations in all measures of diversity and composition examined, with 26 taxa that were enriched in either NAM or USA samples. Interestingly, eight taxa were enriched in NAM samples but absent in the USA samples. A few of these taxa belong to the family Prevotellaceae, some of which are known carbohydrate and protein fermenters in humans (De Filippo et al., 2010; Aguirre et al., 2016). Prevotellaceae are part of the healthy domestic cat microbiome (Ganz et al., 2022). Domestic cats fed whole mice had enriched Prevotellaceae compared to those fed minced mice and were associated with food structure differences between minced and whole prey (D’Hooghe et al., 2024). Alloprevotella, a genus within Prevotellaceae, were enriched in NAM samples and absent in USA samples, and some members of this genus can hydrolyze gelatin from collagen and produce short chain fatty acid acetic acid and succinic acid (which can be metabolized into another SCFA, propionic acid) (Downes et al., 2013; Leaver et al., 1956). Another taxon enriched in the Namibian samples, Barnesiella, has been associated with reduced inflammation in asthma (Zhang et al., 2021) and allergic reactions (Vital et al., 2015). Interestingly, Barnesiella was also found to restrict the growth of an antibiotic-resistant bacteria in mice and humans (Ubeda et al., 2013). The presence of these microbes may play a role in the fewer incidences of symptoms related to GI inflammation (including gastritis) reported in these Namibian cheetahs Mangiaterra et al. (2022), but further research is needed to address their roles in the cheetah GI tract. Interestingly, we found 68 bacterial ASVs (30% of the microbiome) that were shared between the two populations, suggesting that while environment, diet, and demographics may impact the gut microbiota, there is still a conserved cheetah microbiome that likely plays critical functions in cheetah physiology regardless of associated extrinsic and intrinsic factors. Of those shared, ASV1, a Fusobacterium, was the most abundant and is an anaerobic protein fermenter (Mead, 1971) commonly found in domestic cat microbiomes, especially those consuming raw meat diets (Butowski et al., 2019).
PICRUSt2 analyses showed approximately 78% of all sequences in both populations were associated with metabolism. This was expected given the microbes reside in the gut where host and microbial metabolic processes take place to utilize digestive material. Across all levels and categories, only three KO pathways (all Level 2) approached significance between the two populations (Supplementary Tables 3-5). Two of these pathways were types of metabolism. Carbohydrate metabolism is likely higher in the USA samples due to the beet pulp in the commercial ground beef diet. Lipid metabolism was also higher in the USA samples. In domestic cats, multiple types of Level 3 lipid metabolism pathways were higher in cats with acute diarrhea (Bai et al., 2023). Two cheetahs in the USA population were experiencing acute diarrhea at the time of collection, which may at least partially explain these differences. Lastly, the finding that the USA cheetahs had higher proportions of bacterial pathways related to parasite infection was unexpected. The USA cheetahs received monthly parasitic preventatives including Ivermectin for helminths and Frontline (Boehringer Ingelheim, Ingelheim, Germany) for ticks and fleas, so their parasite load should be relatively low. In contrast, NAM cheetahs were regularly monitored for parasites and prescribed treatment only when necessary. It is important to note, that these sequences are based on predicted gene content of the bacteria found in the samples from the two populations and not direct sampling for parasites. These differences may be due to the presence of bacteria that simply carry genes that are known to be involved in pathways of parasitic infectious disease but are not a direct indication of parasite presence. In general, these PICRUSt2 data provide an estimation of the bacterial functional production in the cheetah gut microbiome.
Based on these data, we recommend future studies focus on the microbiome, transcriptome, and metabolome of managed and wild cheetahs to better understand their relationship with host genetics and physiology, diet, and environment. Our main recommendation is to focus on the relationship with diet, particularly in managed cheetahs. We suggest studies to manipulate the cheetah diet in a controlled setting to determine whether the inclusion of non-digestible animal fibers alter the microbiome and metabolome, and at what proportion these dietary fibers produce changes in the microbiota. There are multiple prey species options for carnivores in managed care, but in many cases single-species origin diets are standard. It would be of interest to know if the diversity of animal species in the diet influences the microbiome, metabolome, or susceptibility to GI disease. Additionally, to improve our knowledge on the etiology of GI disease in cheetahs, we recommend an initial direct comparison of cheetahs with and without chronic gastritis. Further, we suggest controlled longitudinal studies on cheetahs starting at cub stage and following them over the course of their life. If animals in the longitudinal studies are fed diets with different levels of non-digestible animal fiber, they should help determine if fiber levels lead to differences in the microbiome and metabolome that may in turn offer protective effects against GI disease.
In conclusion, our data suggest cheetah fecals from the dry season (no rain) in Namibia are acceptable for microbiota collection for up to three days post defecation. This is longer than in our previous study where cheetah fecals exposed to rain and more humid conditions were only stable for 24 hours. These data suggest moisture is an important component to consider for fecal collections when utilized as a proxy for the gut microbiome. We hypothesize these patterns will apply to other members of the Felidae family, and perhaps even other large obligate carnivores under the same climatic conditions, but we recommend additional time series studies to confirm these predictions in new species or environments. These data will provide greater access to cheetah and other large carnivore fecals and reduce costs for sampling efforts, offering an extended period for non-invasive fecal collection. In the second aim we identified differences in fecal microbiota diversity, composition, enriched taxa, and predictive functional relevance between two ex situ cheetah populations. While we were unable to control for or determine which factors were responsible, it does provide evidence that warrants further investigation into managed cheetah gut microbiomes and diet. Many of the differentially abundant taxa between the two populations have known clinical relevance in the gastrointestinal tract, being key taxa to examine in relation to GI health that is negatively influencing captive cheetah husbandry and breeding success. We recommend future studies to assess the functional effects of ex situ diet type on cheetah microbiomes and metabolomes to improve cheetah welfare and breeding program success.
The datasets presented in this study can be found in online repositories. The names of the repository/repositories and accession number(s) can be found below: https://www.ncbi.nlm.nih.gov/bioproject/, BioProject PRJNA1160820. The data and code for aim one are available on Dryad: https://doi.org/10.5061/dryad.sn02v6xdq, and for aim two: https://doi.org/10.5061/dryad.jm63xsjm5. Additionally, the code and data are available on GitHub: https://github.com/Malytherin/CheetahFecalStability_Namibia and https://github.com/Malytherin/Comparing.Fresh.Fecals_NAMvUSA.
Ethical approval was not required for the studies involving animals in accordance with the local legislation and institutional requirements because collection of non-invasive fecal material is exempt from IACUC approval. Sample collection was performed under the permit number 2018051701 at the Cheetah Conservation Fund (Namibian-based Research Institute RCIV00122018). For USA cheetahs, written informed consent was obtained from the owners for the participation of their animals in this study. Written informed consent was obtained from the owners for the participation of their animals in this study.
MAM: Conceptualization, Data curation, Formal analysis, Funding acquisition, Investigation, Methodology, Project administration, Resources, Validation, Visualization, Writing – original draft, Writing – review & editing. RR: Funding acquisition, Methodology, Project administration, Supervision, Visualization, Writing – review & editing, Formal analysis, Resources. MK: Data curation, Formal analysis, Methodology, Validation, Visualization, Writing – review & editing. AS-K: Methodology, Writing – review & editing, Conceptualization, Project administration, Resources, Supervision. MM: Writing – review & editing, Methodology, Data curation, Formal analysis, Visualization. LM: Project administration, Resources, Supervision, Writing – review & editing. MB: Funding acquisition, Supervision, Writing – review & editing. CM-W: Conceptualization, Formal analysis, Funding acquisition, Investigation, Methodology, Project administration, Resources, Supervision, Visualization, Writing – review & editing, Data curation, Validation. AC: Conceptualization, Funding acquisition, Project administration, Resources, Supervision, Writing – review & editing.
The author(s) declare that financial support was received for the research, authorship, and/or publication of this article. Funding for this research was provided by grants from Conservation Nation, Smithsonian Scholarly Studies, Smithsonian Women’s Committee and the Triangle Center for Evolutionary Medicine (TriCEM). Conservation Nation provided funding for travel to and from Cheetah Conservation Fund in Namibia, and materials and reagents for collecting and processing samples in Namibia. Smithsonian Scholarly Studies and Women’s Committee provided funds for equipment purchases for processing samples, stipend support for MAM, and material and supplies for sample processing and analyses. TriCEM provided funds for materials and reagents used in sample processing and sequencing.
The authors would like to thank SNZCBI animal care staff, especially Amber Dedrick and Adri Kopp, and the CCF animal care staff, especially Becky Johnston and Eli Walker, for assistance in fecal and metadata collections. CCF genetics laboratory staff, especially Julia Zumbroich, for assistance in laboratory preparation. We would also like to thank Nancy McInerney at the CCG lab at SNZCBI for assistance with library prep and sequencing.
The authors declare that the research was conducted in the absence of any commercial or financial relationships that could be construed as a potential conflict of interest.
The author(s) declare that no Generative AI was used in the creation of this manuscript.
All claims expressed in this article are solely those of the authors and do not necessarily represent those of their affiliated organizations, or those of the publisher, the editors and the reviewers. Any product that may be evaluated in this article, or claim that may be made by its manufacturer, is not guaranteed or endorsed by the publisher.
The Supplementary Material for this article can be found online at: https://www.frontiersin.org/articles/10.3389/fcosc.2024.1503026/full#supplementary-material
Supplementary Figure 1 | Mesh window screens were placed over top of fecals to prevent dung beetles and other animals from removing them from the plot. (A) Window screen placed over fecal sample; (B) Screen mesh from the windowpane still allowed sun, precipitation, and small bug activity but kept out larger insects and animals; (C) Experimental plot for degrading fecal samples.
Supplementary Figure 2 | (A) Alpha and (B, C) beta diversity measures for NAM fecal samples across sample day (colors). (A) Species richness (SR) did not differ by sample day (GLMM: x2 = 0.6343, df = 4, p = 0.959). (B) Jaccard and (C) unweighted Unifrac distances did not differ by sample day (PERMANOVA Sample Day: Jaccard Pseudo-F4,22 = 0.4545, R2 = 0.07632, p = 0.24, UniFrac Pseudo-F4,22 = 0.4595, R2 = 0.07711, p = 0.099).
Supplementary Figure 3 | Proportions of sequences for Level 2 KEGG Ortholog predicted functional pathways (A) lipid metabolism (Wilcoxon rank test, effect = 1.29, overlap = 0.06, p.adj = 0.54), (B) parasitic infectious disease (Wilcoxon rank test, effect = 1.06, overlap = 0.13, p.adj = 0.076), and (C) carbohydrate metabolism (effect = 1.04, overlap = 0.11, p.adj = 0.09). Color indicates population where blue is Namibian (NAM) and yellow is US (USA) cheetahs. Outliers are indicated by points.
Aguirre M., Eck A., Koenen M. E., Savelkoul P. H., Budding A. E., Venema K. (2016). Diet drives quick changes in the metabolic activity and composition of human gut microbiota in a validated in vitro gut model. Res. Microbiol. 167, 114–125. doi: 10.1016/j.resmic.2015.09.006
Amato K. R. (2013). Co-evolution in context: the importance of studying gut microbiomes in wild animals. Microbiome Sci. And Med. 1, 10–29. doi: 10.2478/micsm-2013-0002
Anderson M. J. (2017). Permutational multivariate analysis of variance (Permanova). Wiley Statsref: Stat Refernce Online. 1–15. doi: 10.1002/9781118445112.stat07841
Bai H., Liu T., Wang S., Gong W., Shen L., Zhang S., et al. (2023). Identification of gut microbiome and metabolites associated with acute diarrhea in cats. Microbiol. Spectr. 11, e0059023. doi: 10.1128/spectrum.00590-23
Bates D., Mächler M., Bolker B., Walker S. (2015). Fitting linear mixed-effects models using lme4. J. Stat. Software 67, 1–48. doi: 10.18637/jss.v067.i01
Becker A. A., Hesta M., Hollants J., Janssens G. P., Huys G. (2014). Phylogenetic analysis of faecal microbiota from captive cheetahs reveals underrepresentation of bacteroidetes and bifidobacteriaceae. BMC Microbiol. 14, 43. doi: 10.1186/1471-2180-14-43
Becker A. A., Janssens G. P., Snauwaert C., Hesta M., Huys G. (2015). Integrated community profiling indicates long-term temporal stability of the predominant faecal microbiota in captive cheetahs. PloS One 10, e0123933. doi: 10.1371/journal.pone.0123933
Beckers K. F., Schulz C. J., Childers G. W. (2017). Rapid regrowth and detection of microbial contaminants in equine fecal microbiome samples. PloS One 12, e0187044. doi: 10.1371/journal.pone.0187044
Bolyen E., Rideout J. R., Dillon M. R., Bokulich N. A., Abnet C. C., Al-Ghalith G. A., et al. (2019). Reproducible, interactive, scalable and extensible microbiome data science using qiime 2. Nat. Biotechnol. 37, 852–857. doi: 10.1038/s41587-019-0209-9
Bragg M., Freeman E. W., Lim H. C., Songsasen N., Muletz-Wolz C. R. (2020). Gut microbiomes differ among dietary types and stool consistency in the captive red wolf (Canis rufus). Front. Microbiol. 11, 590212. doi: 10.3389/fmicb.2020.590212
Butowski C. F., Thomas D. G., Young W., Cave N. J., Mckenzie C. M., Rosendale D. I., et al. (2019). Addition of plant dietary fibre to A raw red meat high protein, high fat diet, alters the faecal bacteriome and organic acid profiles of the domestic cat (Felis catus). PloS One 14, e0216072. doi: 10.1371/journal.pone.0216072
Cabana F., Clayton J. B., Nekaris K. A. I., Wirdateti W., Knights D., Seedorf H. (2019). Nutrient-based diet modifications impact on the gut microbiome of the javan slow loris (Nycticebus javanicus). Sci. Rep. 9, 4078. doi: 10.1038/s41598-019-40911-0
Callahan B. J., Mcmurdie P. J., Holmes S. P. (2017). Exact sequence variants should replace operational taxonomic units in marker-gene data analysis. Isme J. 11, 2639–2643. doi: 10.1038/ismej.2017.119
Callahan B. J., Mcmurdie P. J., Rosen M. J., Han A. W., Johnson A. J., Holmes S. P. (2016). Dada2: high-resolution sample inference from illumina amplicon data. Nat. Methods 13, 581–583. doi: 10.1038/nmeth.3869
Cao Y., Dong Q., Wang D., Zhang P., Liu Y., Niu C. (2022). Microbiomemarker: an R/bioconductor package for microbiome marker identification and visualization. Bioinformatics 38, 4027–4029. doi: 10.1093/bioinformatics/btac438
Caspi R., Billington R., Ferrer L., Foerster H., Fulcher C. A., Keseler I. M., et al. (2016). The metacyc database of metabolic pathways and enzymes and the biocyc collection of pathway/genome databases. Nucleic Acids Res. 44, D471–D480. doi: 10.1093/nar/gkv1164
Cheng Y., Fox S., Pemberton D., Hogg C., Papenfuss A. T., Belov K. (2015). The tasmanian devil microbiome-implications for conservation and management. Microbiome 3, 76. doi: 10.1186/s40168-015-0143-0
Clayton J. B., Al-Ghalith G. A., Long H. T., Tuan B. V., Cabana F., Huang H., et al. (2018). Associations between nutrition, gut microbiome, and health in A novel nonhuman primate model. Sci. Rep. 8, 11159. doi: 10.1038/s41598-018-29277-x
D'Hooghe S. M. J., Bosch G., Sun M., Cools A., Hendriks W. H., Becker A., et al. (2024). How important is food structure when cats eat mice? Br. J. Nutr. 131, 369–383. doi: 10.1017/S0007114523002039
Dahlhausen K. E., Doroud L., Firl A. J., Polkinghorne A., Eisen J. A. (2018). Characterization of shifts of koala (Phascolarctos cinereus) intestinal microbial communities associated with antibiotic treatment. Peerj 6, E4452. doi: 10.7717/peerj.4452
Davis N. M., Proctor D. M., Holmes S. P., Relman D. A., Callahan B. J. (2018). Simple statistical identification and removal of contaminant sequences in marker-gene and metagenomics data. Microbiome 6, 226. doi: 10.1186/s40168-018-0605-2
De Filippo C., Cavalieri D., Di Paola M., Ramazzotti M., Poullet J. B., Massart S., et al. (2010). Impact of diet in shaping gut microbiota revealed by A comparative study in children from europe and rural africa. Proc. Natl. Acad. Sci. U.S.A. 107, 14691–14696. doi: 10.1073/pnas.1005963107
de Jonge N., Carlsen B., Christensen M. H., Pertoldi C., Nielsen J. L. (2022). The gut microbiome of 54 mammalian species. Front. Microbiol. 13, 886252. doi: 10.3389/fmicb.2022.886252
Depauw S. B., Hesta G., Whitehouse-Tedd M., Hendriks K., Kaandorp W. H., Janssens J. (2012). Fermentation of animal components in strict carnivores: A comparative study with cheetah fecal inoculum. J. Anim. Sci. 90, 2540–2548. doi: 10.2527/jas.2011-4377
Depauw S., Hesta M., Whitehouse-Tedd K., Vanhaecke L., Verbrugghe A., Janssens G. P. J. (2013). Animal fibre: the forgotten nutrient in strict carnivores? First insights in the cheetah. J. Of Anim. Physiol. And Anim. Nutr. 97, 146–154. doi: 10.1111/j.1439-0396.2011.01252.x
Douglas G. M., Maffei V. J., Zaneveld J. R., Yurgel S. N., Brown J. R., Taylor C. M., et al. (2020). Picrust2 for prediction of metagenome functions. Nat. Biotechnol. 38, 685–688. doi: 10.1038/s41587-020-0548-6
Downes J., Dewhirst F. E., Tanner A. C. R., Wade W. G. (2013). Description of alloprevotella rava gen. Nov., sp. Nov., isolated from the human oral cavity, and reclassification of prevotella tannerae moore et al. 1994 As alloprevotella tannerae gen. Nov., comb. Nov. Int. J. Syst. Evol. Microbiol. 63, 1214–1218. doi: 10.1099/ijs.0.041376-0
Eshar D., Lee C., Weese J. S. (2019). Comparative molecular analysis of fecal microbiota of bobcats (Lynx rufus) and domestic cats (Felis catus). Can. J. Vet. Res. 83 (1), 42–49.
Faith D. P. (1992). Systematics and conservation: on predicting the feature diversity of subsets of taxa. Cladistics 8, 361–373. doi: 10.1111/j.1096-0031.1992.tb00078.x
Faith D. P. (2018). Phylogenetic diversity and conservation evaluation: perspectives on multiple values, indices, and scales of application. Phylogenetic Diversity. doi: 10.1007/978-3-319-93145-6
Fischer M. M., Kessler A. M., Kieffer D. A., Knotts T. A., Kim K., Wei A., et al. (2017). Effects of obesity, energy restriction and neutering on the faecal microbiota of cats. Br. J. Nutr. 118, 513–524. doi: 10.1017/S0007114517002379
Gani M., Mohd-Ridwan A. R., Sitam F. T., Kamarudin Z., Selamat S. S., Awang N. M. Z., et al. (2024). Habitat shapes the gut microbiome diversity of malayan tigers (Panthera tigris jacksoni) as revealed through metabarcoding 16s rrna profiling. World J. Microbiol. Biotechnol. 40, 111. doi: 10.1007/s11274-023-03868-x
Ganz H. H., Jospin G., Rojas C. A., Martin A. L., Dahlhausen K., Kingsbury D. D., et al. (2022). The kitty microbiome project: defining the healthy fecal "Core microbiome" In pet domestic cats. Vet. Sci. 9. doi: 10.3390/vetsci9110635
Gibson K. M., Nguyen B. N., Neumann L. M., Miller M., Buss P., Daniels S., et al. (2019). Gut microbiome differences between wild and captive black rhinoceros - implications for rhino health. Sci. Rep. 9, 7570. doi: 10.1038/s41598-019-43875-3
Gillman S. J., Mckenney E. A., Lafferty D. J. R., Moore B. (2022). Human-provisioned foods reduce gut microbiome diversity in american black bears (Ursus americanus). J. Of Mammalogy 103, 339–346. doi: 10.1093/jmammal/gyab154
Haworth S. E., White K. S., Cote S. D., Shafer A. B. A. (2019). Space, time and captivity: quantifying the factors influencing the fecal microbiome of an alpine ungulate. FEMS Microbiol. Ecol. 95. doi: 10.1093/femsec/fiz095
He F., Zhai J., Zhang L., Liu D., Ma Y., Rong K., et al. (2018). Variations in gut microbiota and fecal metabolic phenotype associated with Fenbendazole and Ivermectin Tablets by 16S rRNA gene sequencing and LC/MS-based metabolomics in Amur tiger. Biochem. Biophys. Res. Commun. 499, 447–453. doi: 10.1016/j.bbrc.2018.03.158
Honneffer J. B., Minamoto Y., Suchodolski J. S. (2014). Microbiota alterations in acute and chronic gastrointestinal inflammation of cats and dogs. World J. Gastroenterol. 20, 16489–16497. doi: 10.3748/wjg.v20.i44.16489
Hyde E. R., Navas-Molina J. A., Song S. J., Kueneman J. G., Ackermann G., Cardona C., et al. (2016). The oral and skin microbiomes of captive komodo dragons are significantly shared with their habitat. Msystems 1. doi: 10.1128/mSystems.00046-16
Janeczko S., Atwater D., Bogel E., Greiter-Wilke A., Gerold A., Baumgart M., et al. (2008). The relationship of mucosal bacteria to duodenal histopathology, cytokine mrna, and clinical disease activity in cats with inflammatory bowel disease. Veterinary Microbiol. 128, 178–193. doi: 10.1016/j.vetmic.2007.10.014
Keady M. M., Prado N., Lim H. C., Brown J., Paris S., Muletz-Wolz C. R. (2021). Clinical health issues, reproductive hormones, and metabolic hormones associated with gut microbiome structure in african and asian elephants. Anim. Microbiome 3, 85. doi: 10.1186/s42523-021-00146-9
Kembel S. W., Cowan P. D., Helmus M. R., Cornwell W. K., Morlon H., Ackerly D. D., et al. (2010). Picante: R tools for integrating phylogenies and ecology. Bioinformatics 26, 1463–1464. doi: 10.1093/bioinformatics/btq166
Lafferty D. J. R., Gillman S. J., Jeakle L. K., Roell B. J., Mckenney E. A. (2022). Mink (Neovison vison) fecal microbiomes are influenced by sex, temperature, and time postdefecation. J. Of Mammalogy 103, 316–327. doi: 10.1093/jmammal/gyab140
Leaver F., Stjernholm R., Wood H. (1956). The role of succinate as A precursor of propionate in the propionic acid fermentation. J. Bacteriol 72, 142–152. doi: 10.1128/jb.72.2.142-152.1956
Ma X., Brinker E., Graff E. C., Cao W., Gross A. L., Johnson A. K., et al. (2022). Whole-genome shotgun metagenomic sequencing reveals distinct gut microbiome signatures of obese cats. Microbiol. Spectr. 10, E0083722. doi: 10.1128/spectrum.00837-22
Mallick H., Rahnavard A., Mciver L. J. (2020). “Maaslin 2: multivariable association,” in Population-scale meta-omics studies. 1.18.0 (R/Bioconducter). Available online at: http://huttenhower.sph.harvard.edu/maaslin2
Mallick H., Rahnavard A., Mciver L. J., Ma S., Zhang Y., Nguyen L. H., et al. (2021). Multivariable association discovery in population-scale meta-omics studies. PloS Comput. Biol. 17, E1009442. doi: 10.1371/journal.pcbi.1009442
Maly M. A., Crosier A. E., Keady M. M., Roberts B. R., Breen M., Muletz Wolz C. R. (2024). Stability of fecal microbiota during degradation in captive cheetahs in the us. Microbiome And Host. 2. doi: 10.1530/MAH-23-0022
Mangiaterra S., Schmidt-Kuntzel A., Marker L., Di Cerbo A., Piccinini R., Guadagnini D., et al. (2022). Effect of A probiotic mixture in captive cheetahs (Acinonyx jubatus) with gastrointestinal symptoms-A pilot study. Anim. (Basel) 12. doi: 10.3390/ani12030395
Martinez Arbizu P. (2020). Pairwiseadonis: pairwise multilevel comparison using adonis. (R package version 0.4.1). Available online at: https://github.com/pmartinezarbizu/pairwiseAdonis/tree/master
Masuoka H., Shimada K., Kiyosue-Yasuda T., Kiyosue M., Oishi Y., Kimura S., et al. (2017). Transition of the intestinal microbiota of cats with age. PloS One 12, e0181739. doi: 10.1371/journal.pone.0181739
McKenzie V. J., Song S. J., Delsuc F., Prest T. L., Oliverio A. M., Korpita T. M., et al. (2017). The effects of captivity on the mammalian gut microbiome. Integr. Comp. Biol. 57, 690–704. doi: 10.1093/icb/icx090
McMurdie P. J., Holmes S. (2013). Phyloseq: an R package for reproducible interactive analysis and graphics of microbiome census data. PloS One 8, e61217. doi: 10.1371/journal.pone.0061217
Mead G. C. (1971). The amino acid-fermenting clostridia. J. Gen. Microbiol. 67, 47–56. doi: 10.1099/00221287-67-1-47
Menke S., Meier M., Sommer S., Bunce M. (2015). Shifts in the gut microbiome observed in wildlife faecal samples exposed to natural weather conditions: lessons from time-series analyses using next-generation sequencing for application in field studies. Methods In Ecol. And Evol. 6, 1080–1087. doi: 10.1111/mee3.2015.6.issue-9
Menke S., Wasimuddin, Meier M., Melzheimer J., Mfune J. K., Heinrich S., et al. (2014). Oligotyping reveals differences between gut microbiomes of free-ranging sympatric Namibian carnivores (Acinonyx jubatus, canis mesomelas) on a bacterial species-like level. Front. Microbiol. 5, 526. doi: 10.3389/fmicb.2014.00526
Muletz-Wolz C. R., Fleischer R. C., Lips K. R. (2019a). Fungal disease and temperature alter skin microbiome structure in an experimental salamander system. Mol. Ecol. 28, 2917–2931. doi: 10.1111/mec.2019.28.issue-11
Muletz-Wolz C. R., Kurata N. P., Himschoot E. A., Wenker E. S., Quinn E. A., Hinde K., et al. (2019b). Diversity and temporal dynamics of primate milk microbiomes. Am. J. Primatol 81, e22994. doi: 10.1002/ajp.v81.10-11
Muletz Wolz C. R., Yarwood S. A., Campbell Grant E. H., Fleischer R. C., Lips K. R. (2018). Effects of host species and environment on the skin microbiome of plethodontid salamanders. J. Anim. Ecol. 87, 341–353. doi: 10.1111/jane.2018.87.issue-2
Munson L. (1993). Diseases of captive cheetahs (Acinonyx jubatus): results of the cheetah research council pathology survey 1989-1992. Zoo Biol. 12, 105–124. doi: 10.1002/zoo.1430120110
Munson L., Nesbit J. W., Meltzer D. G. A., Colly L. P., Bolton L., Kriek N. P. (1999). Diseases of captive cheetahs (Acinonyx jubatus jubatus) in South Africa: A 20-year retrospective survey. J. Zoo Wildl Med. 30 (3), 342–347.
Munson L., Terio K. A., Worley M., Jago M., Bagot-Smith A., Marker L. (2005). Extrinsic factors significantly affect patterns of disease in free-ranging and captive cheetah (Acinonyx jubatus) populations. J. Wildl Dis. 41, 542–548. doi: 10.7589/0090-3558-41.3.542
Oksanen J., Simpson G., Blanchet F., Kindt R., Legendre P., Minchin P., et al. (2022). Vegan: community ecology package. (R package version 2.6-4). Available online at: http://CRAN.R-project.org/package=vegan
Parks D. H., Tyson G. W., Hugenholtz P., Beiko R. G. (2014). Stamp: statistical analysis of taxonomic and functional profiles. Bioinformatics 30, 3123–3124. doi: 10.1093/bioinformatics/btu494
Price M. N., Dehal P. S., Arkin A. P. (2009). Fasttree: computing large minimum evolution trees with profiles instead of A distance matrix. Mol. Biol. Evol. 26, 1641–1650. doi: 10.1093/molbev/msp077
Redford K. H., Segre J. A., Salafsky N., Martinez Del Rio C., Mcaloose D. (2012). Conservation and the microbiome. Conserv. Biol. 26, 195–197. doi: 10.1111/j.1523-1739.2012.01829.x
Rojas C. A., Marks S. L., Borras E., Lesea H., Mccartney M. M., Coil D. A., et al. (2023). Characterization of the microbiome and volatile compounds in anal gland secretions from domestic cats (Felis catus) using metagenomics and metabolomics. Sci. Rep. 13, 19382. doi: 10.1038/s41598-023-45997-1
Segata N., Izard J., Waldron L., Gevers D., Miropolsky L., Garrett W. S., et al. (2011). Metagenomic biomarker discovery and explanation. Genome Biol. 12, r60. doi: 10.1186/gb-2011-12-6-r60
Sugden S., Sanderson D., Ford K., Stein L. Y., St Clair C. C. (2020). An altered microbiome in urban coyotes mediates relationships between anthropogenic diet and poor health. Sci. Rep. 10, 22207. doi: 10.1038/s41598-020-78891-1
Tal M., Verbrugghe A., Gomez D. E., Chau C., Weese J. S. (2017). The effect of storage at ambient temperature on the feline fecal microbiota. BMC Vet. Res. 13, 256. doi: 10.1186/s12917-017-1188-z
Team R. C. (2022). R: A language and environment for statistical computing (Vienna, Austria: R Foundation For Statistical Computing).
Terio K. A., Mitchell E., Walzer C., Schmidt-Küntzel A., Marker L., Citino S. (2018). Diseases impacting captive and free-ranging cheetahs. Cheetahs: Biol. Conserv. 349–364. doi: 10.1016/B978-0-12-804088-1.00025-3
Tung J., Barreiro L. B., Burns M. B., Grenier J. C., Lynch J., Grieneisen L. E., et al. (2015). Social networks predict gut microbiome composition in wild baboons. Elife 4. doi: 10.7554/eLife.05224.023
Ubeda C., Bucci V., Caballero S., Djukovic A., Toussaint N. C., Equinda M., et al. (2013). Intestinal microbiota containing barnesiella species cures vancomycin-resistant enterococcus faecium colonization. Infect. Immun. 81, 965–973. doi: 10.1128/IAI.01197-12
Vital M., Harkema J. R., Rizzo M., Tiedje J., Brandenberger C. (2015). Alterations of the murine gut microbiome with age and allergic airway disease. J. Immunol. Res. 2015, 892568. doi: 10.1155/2015/892568
Wan X., Ruan R., Mclaughlin R. W., Hao Y., Zheng J., Wang D. (2016). Fecal bacterial composition of the endangered yangtze finless porpoises living under captive and semi-natural conditions. Curr. Microbiol. 72, 306–314. doi: 10.1007/s00284-015-0954-z
Wang Q., Garrity G. M., Tiedje J. M., Cole J. R. (2007). Naive bayesian classifier for rapid assignment of rrna sequences into the new bacterial taxonomy. Appl. Environ. Microbiol. 73, 5261–5267. doi: 10.1128/AEM.00062-07
Wasimuddin, Menke S., Melzheimer J., Thalwitzer S., Heinrich S., Wachter B., et al. (2017). Gut microbiomes of free-ranging and captive Namibian cheetahs: diversity, putative functions and occurrence of potential pathogens. Mol. Ecol. 26, 5515–5527. doi: 10.1111/mec.2017.26.issue-20
Weiss S., Xu Z. Z., Peddada S., Amir A., Bittinger K., Gonzalez A., et al. (2017). Normalization and microbial differential abundance strategies depend upon data characteristics. Microbiome 5, 27. doi: 10.1186/s40168-017-0237-y
West A. G., Waite D. W., Deines P., Bourne D. G., Digby A., Mckenzie V. J., et al. (2019). The microbiome in threatened species conservation. Biol. Conserv. 229, 85–98. doi: 10.1016/j.biocon.2018.11.016
Wong K., Shaw T. I., Oladeinde A., Glenn T. C., Oakley B., Molina M. (2016). Rapid microbiome changes in freshly deposited cow feces under field conditions. Front. Microbiol. 7, 500. doi: 10.3389/fmicb.2016.00500
Keywords: ex situ carnivores, cheetah, non-invasive sampling, microbial stability, gut microbiome, Namibia
Citation: Maly MA, Roberts RB, Keady MM, Schmidt-Küntzel A, Maxwell M, Marker L, Breen M, Muletz-Wolz CR and Crosier AE (2025) Fecal microbiota is more stable during degradation and more diverse for ex situ cheetahs in Namibia compared to the USA. Front. Conserv. Sci. 5:1503026. doi: 10.3389/fcosc.2024.1503026
Received: 27 September 2024; Accepted: 12 December 2024;
Published: 27 January 2025.
Edited by:
Eliana Pintus, Czech University of Life Sciences Prague, CzechiaReviewed by:
Ronald Jan Corbee, Utrecht University, NetherlandsCopyright © 2025 Maly, Roberts, Keady, Schmidt-Küntzel, Maxwell, Marker, Breen, Muletz-Wolz and Crosier. This is an open-access article distributed under the terms of the Creative Commons Attribution License (CC BY). The use, distribution or reproduction in other forums is permitted, provided the original author(s) and the copyright owner(s) are credited and that the original publication in this journal is cited, in accordance with accepted academic practice. No use, distribution or reproduction is permitted which does not comply with these terms.
*Correspondence: Morgan A. Maly, bWFseUB1d2FsdW1uaS5jb20=
†These authors have contributed equally to this work and share senior authorship
Disclaimer: All claims expressed in this article are solely those of the authors and do not necessarily represent those of their affiliated organizations, or those of the publisher, the editors and the reviewers. Any product that may be evaluated in this article or claim that may be made by its manufacturer is not guaranteed or endorsed by the publisher.
Research integrity at Frontiers
Learn more about the work of our research integrity team to safeguard the quality of each article we publish.