 Harry D. Jonas1*
 Heather C. Bingham2
 Nathan J. Bennett1,3,4
 Stephen Woodley5
 Ryan Zlatanova1
 Emily Howland2Elise Belle6Jasmin Upton2
 Bex Gottlieb2
 Vignesh Kamath2
 Janeth Lessmann2
 Giacomo Delli7
 Grégoire Dubois8
 Gabby Ahmadia1
 Joachim Claudet9
 Carly Cook10Johana Deza1Kirsten Grorud-Colvert11
 Georgina Gurney12Christopher J. Lemieux13Lucia Ruiz1
- 1World Wildlife Fund, Washington, DC, ;United States
- 2UN Environment Programme World Conservation Monitoring Centre, Cambridge, ;United Kingdom
- 3People and the Ocean Specialist Group, Commission on Environmental, Economic and Social Policy, International Union for the Conservation of Nature, Gland, ;Switzerland
- 4Institute for the Oceans and Fisheries, University of British Columbia, Vancouver, BC, ;Canada
- 5World Commission on Protected Areas, IUCN, Chelsea, QC, ;Canada
- 6WCMC Europe, 26 rue d’Edimbourg, 1050 Bruxelles, ;Belgium
- 7Arcadia SIT S.r.l., Vigevano, ;Italy
- 8Joint Research Centre of the European Commission, Ispra, ;Italy
- 9National Center for Scientific Research, PSL Université Paris, CRIOBE, CNRS-EPHE-UPVD, Paris, ;France
- 10School of Biological Sciences, Monash University, Clayton, VIC, ;Australia
- 11Department of Integrative Biology, Oregon State University, Corvallis, OR, ;United States
- 12College of Arts, Society and Education, James Cook University, Townsville, QLD, ;Australia
- 13Department of Geography and Environmental Studies, Wilfrid Laurier University, Waterloo, ON, ;Canada
Other effective area-based conservation measures (OECMs) are sites outside of protected areas that deliver the effective, long-term conservation of biodiversity. Both protected areas and OECMs contribute to the implementation of the Global Biodiversity Framework’s Target 3, which calls for the conservation of 30% of marine, terrestrial and inland water areas by 2030. This paper provides the first global assessment of the contribution of OECMs to GBF Target 3. Between 2019 and 2023, 820 sites in nine countries and territories were reported to the World Database on OECMs, covering 1.9 million km2 of the Earth’s surface and, in the terrestrial realm, contributing over 1% to the 30% coverage target. Notably, over 50% of reported OECMs are under governance by governments and less than 2% are governed by Indigenous peoples and local communities. In countries and territories that have reported OECMs, a far greater proportion of OECMs than protected areas are under shared governance (40.9% compared to 2.5%), and collaborative governance is the most common governance sub-type among reported OECMs. This paper finds that almost 30% of the 820 reported OECMs overlap with identified Key Biodiversity Areas, which are one global classification of areas of particular importance for biodiversity. With Target 3’s pressing deadline of 2030, there is an urgent need to scale up understanding and local to national engagement with the OECM framework, ensuring that it fulfills its potential to recognize diverse forms of equitable governance and effective conservation.
1 Introduction
In December 2022, Parties to the Convention on Biological Diversity (CBD) adopted the Kunming-Montreal Global Biodiversity Framework (GBF), which contains four long-term global goals for the conservation, and sustainable and equitable use, of ecosystems and biodiversity by 2050, and twenty-three global targets for action in the more immediate term by 2030 (Convention on Biological Diversity, 2022). Target 3 calls for the conservation of at least 30% of terrestrial, inland water, coastal and marine areas globally through “well-connected systems of protected areas and other effective area-based conservation measures, recognizing Indigenous and traditional territories.”
The inclusion of “other effective area-based conservation measures” (OECMs) in this high-profile target has placed the OECM framework in the global spotlight. In doing so, it has raised hopes that the framework will enable better recognition and support for a broader array of managed areas that safeguard biodiversity. It has also intensified scrutiny of what counts towards Target 3 and how to ensure sites are equitably governed and effectively managed (MacKinnon et al., 2015; Jonas et al., 2017, 2021; Alves-Pinto et al., 2021; Claudet et al., 2022; Lemieux et al., 2022; Gurney et al., 2021, 2023; Cook, 2023; Hoesen et al., 2023).
The term ‘other effective area-based conservation measures’ first appeared in Target 3’s predecessor, Aichi Biodiversity Target 11 (Convention on Biological Diversity (CBD), 2010). It was defined in 2018 by Parties to the CBD as: “A geographically defined area other than a Protected Area, which is governed and managed in ways that achieve positive and sustained long-term outcomes for the in situ conservation of biodiversity with associated ecosystem functions and services and where applicable, cultural, spiritual, socio–economic, and other locally relevant values” (Convention on Biological Diversity (CBD), 2018).
The CBD also sets out 4 criteria and 26 sub-criteria for identifying OECMs. The criteria are:
1. Area is not currently recognised as a protected area.
2. Area is governed and managed.
3. Area achieves sustained and effective contribution to in situ conservation of biodiversity.
4. Associated ecosystem functions and services are supported, and cultural, spiritual, socio-economic and other locally relevant values are respected.
While the CBD stipulates that a protected area (PA) should have biodiversity conservation as a primary objective (CBD, 1992), the OECM framework recognises sites that are effectively generating long-term biodiversity outcomes irrespective of their objectives (IUCN-WCPA Task Force on OECMs, 2019). In this way, the OECM framework provides a mechanism for recognising the conservation benefits of areas that would not meet the global criteria for PA recognition. For example, such areas could include those with the primary objective of preserving cultural values or spiritual values. While this demonstrates an important difference between PAs and OECMs, they also share similarities. Like PAs, OECMs are area-based, long-term measures that can be governed by government agencies, private individuals and sectoral actors, Indigenous peoples and local communities, or through shared arrangements (i.e., the IUCN governance types; Borrini-Feyerabend et al., 2013). Diverse kinds of sites can potentially meet the OECM criteria, including Indigenous territories, wise use wetlands, riparian reserves, forestry set-asides, managed rangelands, sacred and cultural sites, fisheries closures, restricted areas bordering cables or pipelines, military areas and war graves (Cook, 2024).
As per CBD Decision 14/8, OECMs are intended to complement PAs by “contributing to the coherence and connectivity of protected area networks, as well as in mainstreaming biodiversity into other uses in land and sea, and across sectors” (Convention on Biological Diversity (CBD), 2018), while maintaining and supporting relevant cultural practices and values across landscapes, seascapes, and river basins (IUCN-WCPA Task Force on OECMs, 2019). The OECM framework might also offer a way to recognise the conservation efforts of diverse groups and organizations (Jonas et al., 2017; Gurney et al., 2021). While it was expected that governments would recognise many OECMs under their own governance, it was also anticipated that many sites governed by Indigenous peoples, local communities and private actors would meet the CBD criteria, through rights-based processes, thus diversifying the recognized contributions to global conservation efforts (Jonas et al., 2017; IUCN-WCPA Task Force on OECMs, 2019). This was expected to be of particular benefit in countries where Indigenous peoples and local communities typically prefer their lands not to be recognised as PAs due to national legislation or policies that could undermine their customary practices.
Despite the growing level of analysis of the OECM framework (Cook, 2023), there has not yet been a global assessment of the contribution of OECMs to GBF Target 3, nor of the characteristics of the sites being identified and reported. Recognizing this gap, in this paper, we examine the sites that have been reported to the World Database on OECMs (WD-OECM; UNEP-WCMC and IUCN, 2023), assessing their spatial contributions to Target 3 alongside the ways in which they are being governed and managed. This paper provides an update on a preliminary analysis of the WD-OECM (WWF-US, 2022), refining the methodology used and adding further analyses. Readers should note that this paper presents an early snapshot based on OECMs reported by a small number of countries and territories. While it is the most complete analysis currently available, our collective understanding of OECMs is likely to change rapidly as more countries work to identify them in the build up to 2030. We were unable to access comprehensive datasets on the effectiveness of reported OECMs in conserving biodiversity. This is a significant gap and highlights an area of research and scaled-up reporting that should be undertaken in the future.
The paper’s methods are based upon those used in the Protected Planet Report series (UNEP-WCMC and IUCN, 2021) to track progress against Target 3 (and, historically, against Aichi Biodiversity Target 11), and cover several indicators included in the GBF Monitoring Framework. Noting that only nine countries and territories have reported data to date, by aligning with the Protected Planet Report series and GBF Monitoring Framework, this paper provides early insights into OECMs’ contributions to achieving key aspects of Target 3 using methods similar to those proposed for official reporting, including relating to:
1. The 30% coverage target;
2. Areas of importance for biodiversity;
3. Ecological representation;
4. Ecological connectivity;
5. Equitable governance; and
6. Management objectives.
In this paper, OECMs and PAs are referred to collectively as ‘area-based conservation measures’ or ‘protected and conserved areas’. We compare OECM and PA data to understand the relative contributions of these two approaches to Target 3 in countries where both have been reported, and conclude with a discussion of the implications of our findings.
2 Materials and methods
The methods selected for this paper are based upon those used in the Protected Planet Report series to track progress against Target 3 (and, historically, against Aichi Biodiversity Target 11), and cover several indicators included in the GBF Monitoring Framework (1. coverage (the headline indicator); 2. coverage of areas of Key Biodiversity Areas, ecological representation, and equitable governance (all of which are currently proposed as disaggregations of the headline indicator (CBD, Subsidiary Body on Scientific, Technical and Technological Advice, 2024)); 3. connectivity calculated using ProtConn (a component indicator; Saura et al., 2017, 2018, 2019)). The chosen approach means that the paper’s methods are similar to those proposed for use in official reporting. While other datasets and methodologies exist for assessing the aspects of Target 3 covered here - including at national level - this paper focuses on globally-consistent analyses covered in the Monitoring Framework. For consistency with the Protected Planet Report series, the paper prioritizes indicators previously used in that series in cases where the Monitoring Framework lists more than one approach. Indicators covered in the Monitoring Framework are supplemented in this paper by analyses that provide further insights into the OECM data (proportion and coverage of OECMs with primary, secondary and ancillary conservation objectives, coverage of Ecologically or Biologically Significant Marine Areas (EBSAs), and proportion, coverage and size of OECMs under different governance types).
A preliminary version of several of the analyses presented here was published in WWF-US, 2022 using an earlier version (April 2022) of the WD-OECM. This paper refines the methodology used to create the 2022 report and adds additional analyses (connectivity and coverage of EBSAs).
Our analysis is based on the release of the February 2023 World Database on Protected Areas (WDPA) and World Database on OECMs (WD-OECM; UNEP-WCMC and IUCN, 2023). Since the analysis was completed, OECMs have been added for several other countries (Protected Planet Report 2024: UNEP-WCMC and IUCN, forthcoming).
The data covers countries and ‘territories’, the latter of which are administrative units associated with a state. In this analysis, the one territory that has reported OECMs is Guernsey, a British Crown Dependency. For national boundaries, a dataset combining Exclusive Economic Zones (VLIZ (Flanders Marine Institute), 2014) and terrestrial country boundaries (National Geospatial-Intelligence Agency) was used. A simplified version of this layer has been published in Nature Scientific Data journal (Brooks et al., 2016). For the connectivity analysis, the Global Administrative Unit Layers (GAUL), revision 2015 (2017-02-02), was used.
For count statistics (those not involving spatial analysis), PAs with the status “Proposed” or “Not Reported” have been excluded (there were no OECMs yet with either status). For statistics derived from spatial analysis, we removed PAs with the English designation “UNESCO-MAB Biosphere Reserve” and PAs and OECMs represented by point data with no reported area. The UNESCO Man and Biosphere Reserves (MAB) sites reported to the WDPA were excluded from the analysis on the basis that the MAB sites currently in the WDPA include buffer and transition zones that in many cases are not protected areas. MAB Core areas are usually PAs designated at a national level and are therefore generally accounted for in our calculations. MAB sites reported as OECMs have been included, as these have been identified by the reporting parties as meeting the OECM definition. Point data with a reported area have been buffered as a circle to that reported area. Buffered points have been included in spatial analyses in line with standard Protected Planet methodologies, but readers should note that the inclusion of point data increases the level of uncertainty in the results, in particular when the WDPA/WD-OECM is overlaid with other datasets. Readers should bear this in mind when interpreting the results of the KBA, EBSA and ecoregion analyses.
All spatial analyses use dissolved versions of the WDPA and WD-OECM to prevent double-counting of overlapping areas. For spatial analyses involving both PAs and OECMs, areas of overlap between the two have been counted as PAs only. Areas have been calculated in the Mollweide projection. For the ecoregion analysis, the dissolved WDPA and WD-OECM datasets were intersected with datasets on terrestrial ecoregions (Dinerstein et al., 2017) and marine ecoregions and pelagic provinces (Spalding et al., 2007; 2012). For the KBA analysis, the dissolved WDPA and WD-OECM datasets were intersected with the March 2023 World Database on KBAs (BirdLife International, 2023); for the analysis of the contribution to coverage of KBAs, only KBAs represented by polygons were used. KBAs are areas important for biodiversity for all taxa and ecosystems, regardless of conservation designation. Sites qualify as global KBAs if they meet one or more of 11 criteria, clustered into five higher level categories: threatened biodiversity, geographically restricted biodiversity, ecological integrity, biological processes, and irreplaceability. The global database on KBAs contains over 16,000 sites, making it the largest and most comprehensive data set on areas of importance for biodiversity. For the EBSA analysis, the dissolved WDPA and WD-OECM datasets were intersected with the global EBSA dataset (Secretariat of the Convention on Biological Diversity, 2023a).
Global and national coverage statistics were calculated using the methodology available on Protected Planet (https://www.protectedplanet.net/en/resources/calculating-protected-area-coverage). All other spatial analyses involved an additional step in which the datasets used were clipped to national boundaries. Sections of OECMs erroneously falling in neighboring countries were not counted in the results.
Statistics that summarize sites according to mean area or variation in area are based on the GIS_AREA field and are derived from polygons only. The WDPA and WD-OECM include some PAs and OECMs with multiple zones. In these cases, each zone has its own tabular data. For count statistics involving tabular fields where the data differs between different zones of a single PA or OECM, the data associated with the largest zone has been used. An exception is the GIS_AREA field, where the data has instead been summed to provide a total area for the PA or OECM.
The percentage of land per country or territory that is both protected and connected was calculated for PAs with and without OECMs. This was done using the ‘Protected Connected’ indicator (ProtConn; Saura et al., 2017, 2018, 2019), which is calculated through network analysis, with the Probability of Connectivity and the Equivalent Connected Area as the underlying metrics. ProtConn considers the spatial arrangement, size and coverage of OECMs and PAs, excluding those under 1km2. It accounts for the land area that can be reached within OECMs and PAs and the land that is reachable through the connections between OECMs and PAs. Two OECMs or PAs are considered connected when their minimum distance is lower than the median dispersal distance considered. For this analysis, ProtConn was calculated for a median dispersal distance of 10 km. Land Cover statistics were computed using Copernicus LC 100m, 2019, with aggregation of forest-related classes.
3 Results
3.1 Coverage: global and national extent of reported OECMs
As of February 2023, a total of 820 sites are reported on the World Database on OECMs across nine countries and territories, namely Algeria, Canada, Colombia, the Kingdom of Eswatini, Guernsey, Morocco, Peru, Philippines and South Africa (Figure 1). These OECMs currently cover 1,949,484 km2 of the world’s surface, an area approximately the size of Saudi Arabia (although in theory OECMs and PAs should not overlap spatially, an additional 99,040 km2 is within both OECMs and PAs, bringing the total global area of reported OECMs above 2 million km2). Six hundred and twenty-six OECMs account for 1,590,379 km2 of terrestrial land and inland water coverage, and 194 OECMs account for 359,105 km2 coverage of coastal and marine waters. The 5 OECMs currently reported by Algeria are also the five largest OECMs reported to date, accounting for almost 60% of the world’s OECM coverage.
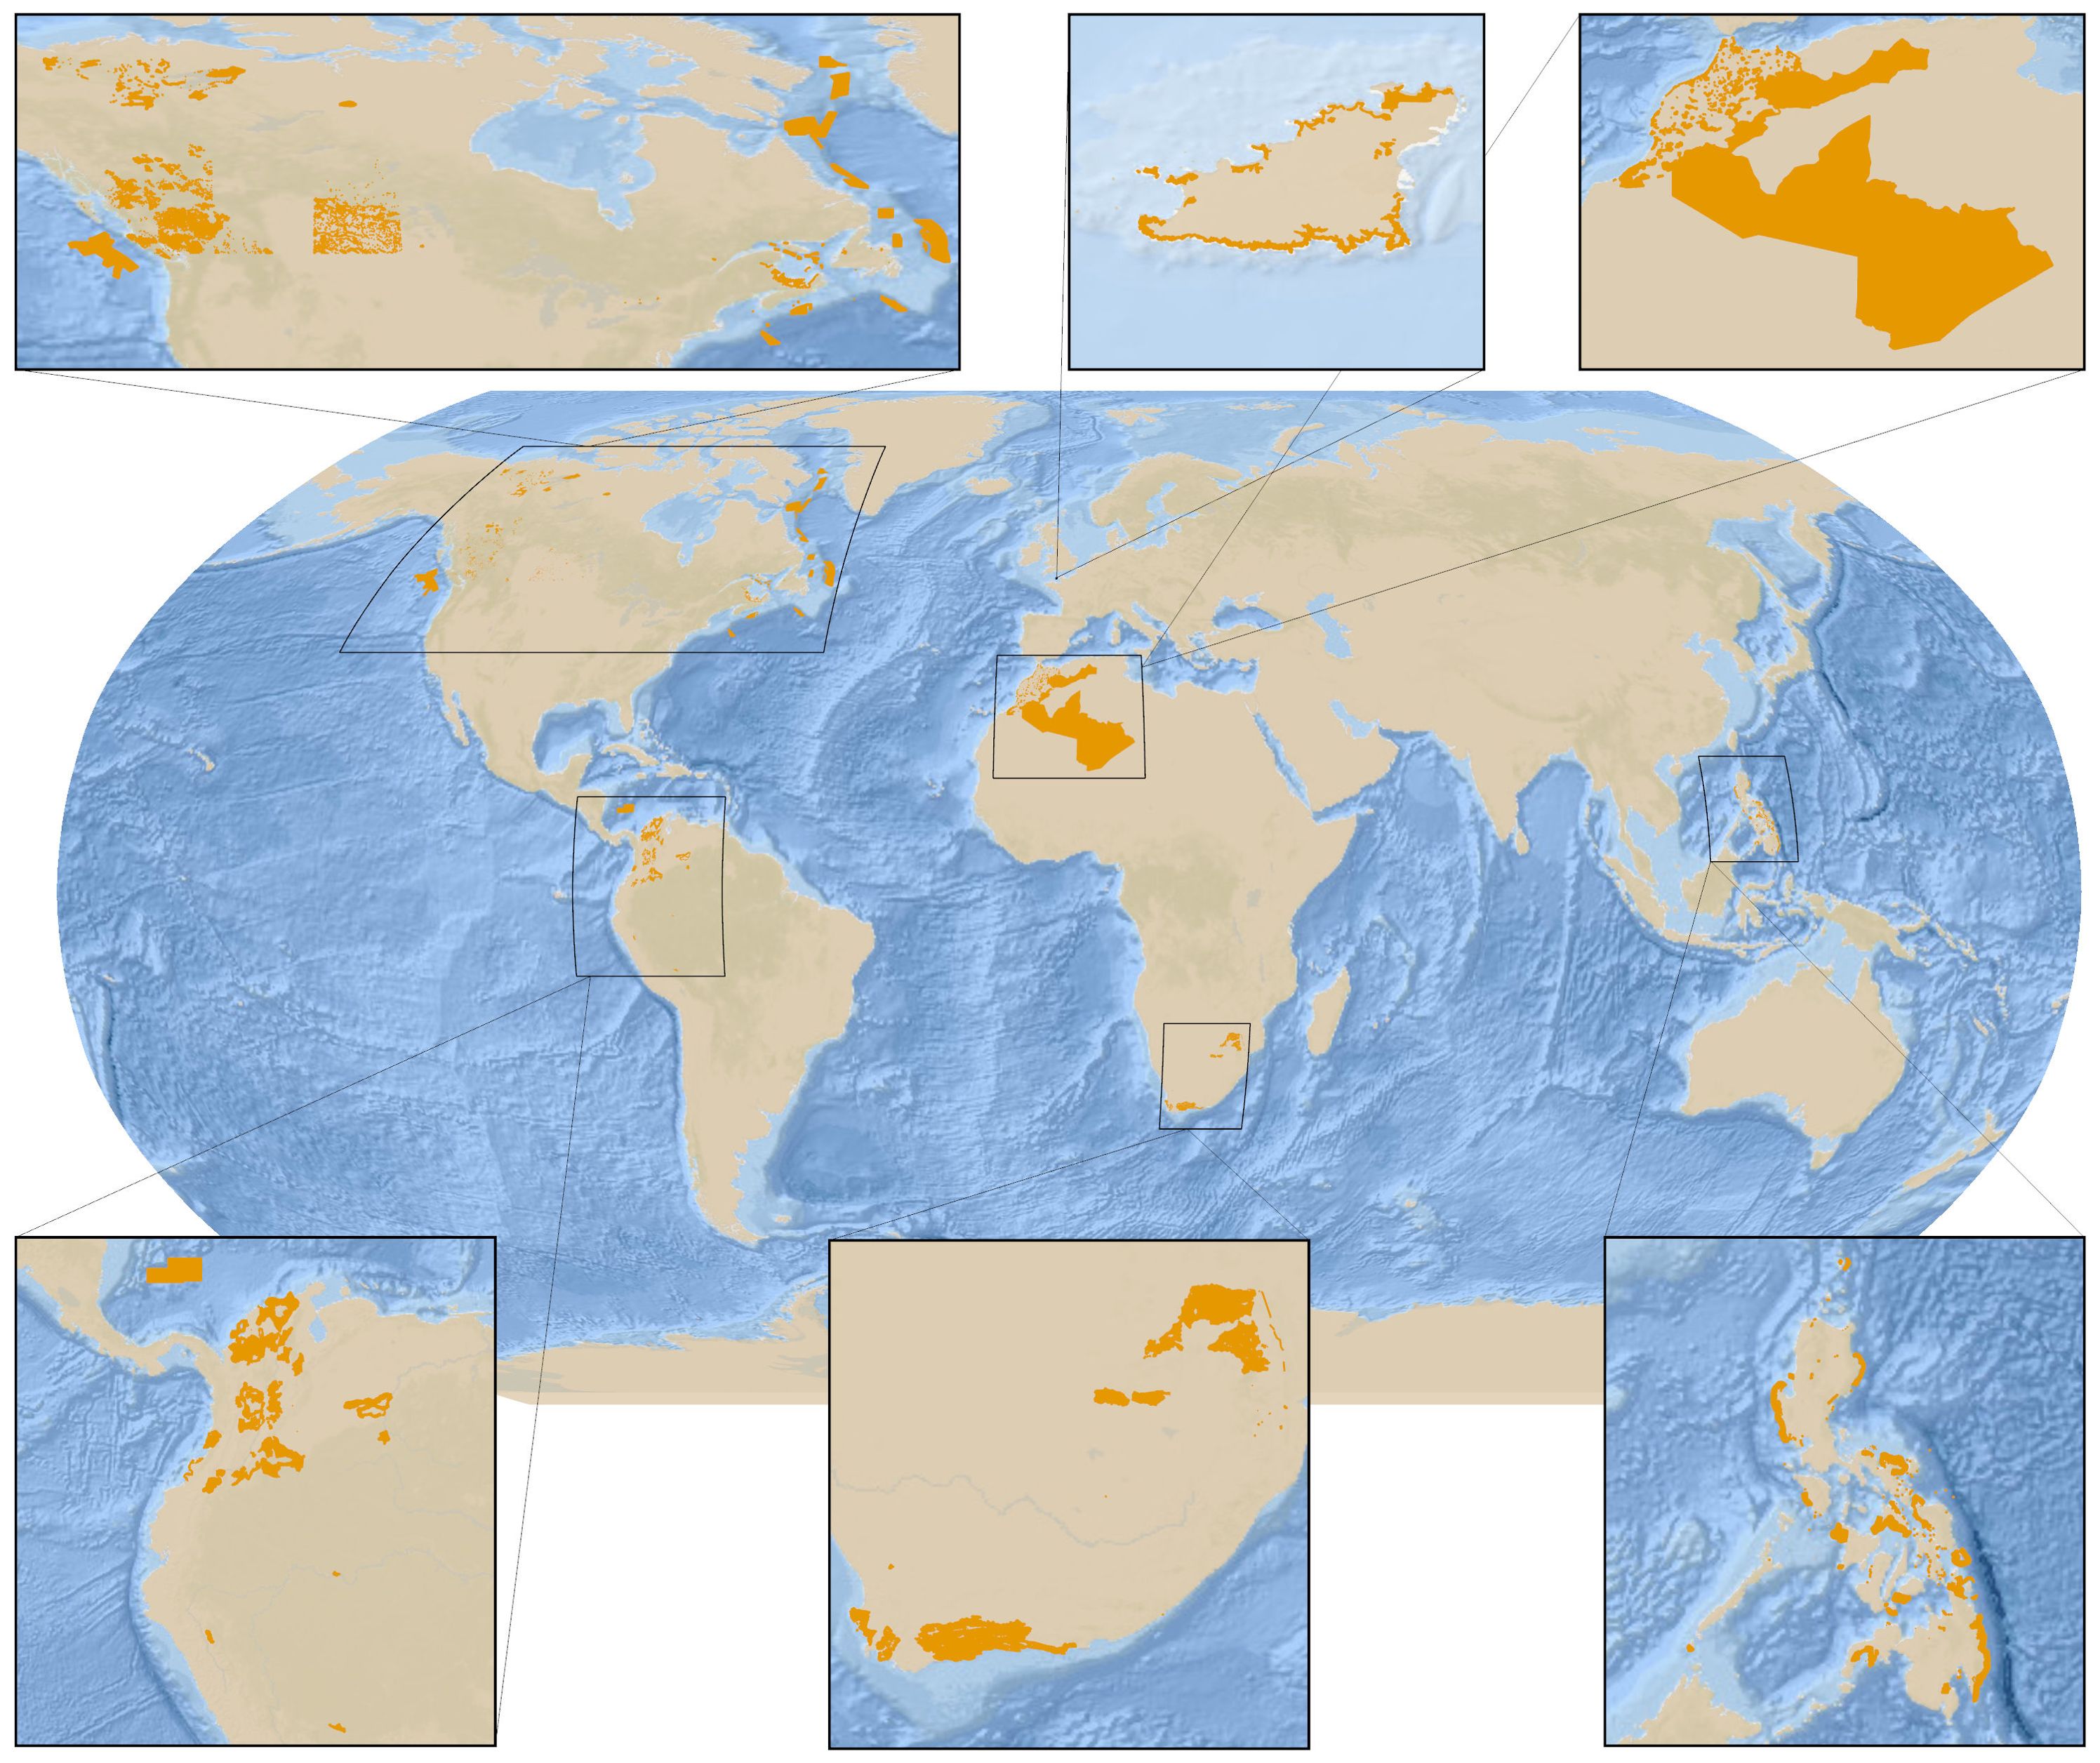
Figure 1. Other effective area-based conservation measures (OECMs) reported to the World Database on OECMs as of February 2023 (UNEP-WCMC and IUCN, 2023). The boundaries and names shown and the designations used on this map do not imply official endorsement or acceptance by the United Nations. Service layer Credits: World Ocean Base: OceanWise, Esri, Garmin, NaturalVue.
There are vastly more reported PAs than reported OECMs, covering a much greater area (almost 300,000 sites across 244 countries and territories, covering 29,581,563 km2 in the ocean and 21,319,046 km2 on land as of February 2023 (UNEP-WCMC and IUCN, 2023)). However the reported OECMs to date nevertheless have an impact on global coverage statistics. Despite just five years having passed since the CBD agreed a definition for OECMs (Convention on Biological Diversity (CBD), 2018), as of February 2023 the addition of OECMs already increases global terrestrial coverage of PAs and OECMs from 15.80% with PAs only to 16.98% when reported OECMs are included (UNEP-WCMC and IUCN, 2023). The increase was sufficiently pronounced by 2021 that the latest Protected Planet Report was able to conclude that the numeric element of Aichi Biodiversity Target 11’s 17% terrestrial and inland water coverage was achieved (UNEP-WCMC and IUCN, 2021).
For a few countries, OECMs contribute substantially to terrestrial coverage of area-based conservation. The most notable increases are in Morocco and Algeria, where OECMs now vastly surpass the coverage provided by PAs, contributing over 90% of the total area-based conservation coverage of these countries. Although GBF Target 3’s 30% coverage target is a global target and national targets vary, identifying and reporting data on OECMs has meant that these two countries have already exceeded 30% coverage on land (Figure 2). In Guernsey (a small island and a self-governing British Crown Dependency), OECMs now outnumber PAs and exceed them in terms of terrestrial coverage.
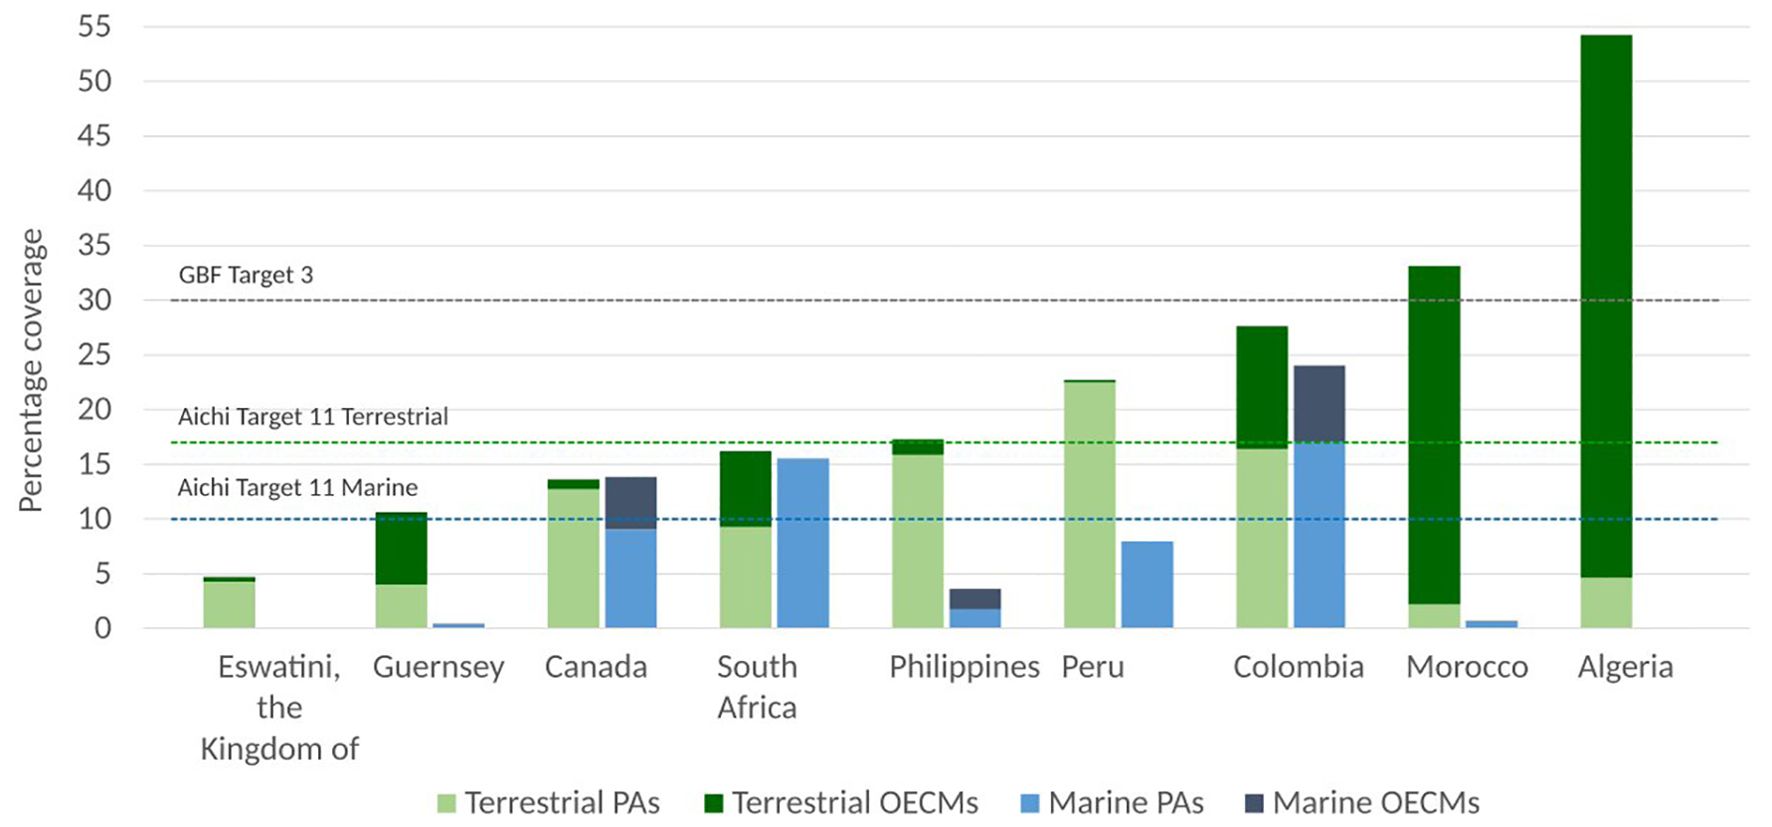
Figure 2. Contribution of OECMs and PAs to terrestrial and marine coverage in countries and territories with reported OECMs, February 2023 (UNEP-WCMC and IUCN, 2023). Horizontal lines representing global targets are shown for context, but national targets will vary.
In the marine realm, currently reported OECMs have raised the global coverage figures by only 0.1 percentage points. But this small global change obscures a major increase at the national level for some countries. For example, in the Philippines, OECMs now account for over half of the marine area within area-based conservation measures. In Canada, OECMs raise marine coverage from 9.1% to 13.9%, and in Colombia, they raise marine coverage from 17.1% to 24.0%.
While in some cases the increases in marine and terrestrial coverage result from the reporting of many small to medium OECMs (e.g., in Morocco and the Philippines), they result from a small number of large OECMs being reported in other jurisdictions (e.g., in Algeria and South Africa).
3.2 Coverage of areas of particular importance for biodiversity
Target 3 has a focus on “areas of particular importance for biodiversity”. For this analysis we use coverage of KBAs and EBSAs as two global classifications of areas of importance of biodiversity, in line with previous studies (Donald et al., 2019) and aligning with the GBF Monitoring Framework in the case of KBAs. The total area of overlap between reported OECMs and Key Biodiversity Areas (KBAs) is 150,221.9 km2. Over a quarter (29.3% (n = 233)) of reported OECMs overlap with a KBA, providing additional coverage of KBAs above that provided by PAs in all countries and territories with reported OECMs (excludes points with no reported area). The percentage of KBAs with heightened coverage from OECMs varies markedly between countries and territories, reaching 91.0% (n = 60) of all KBAs in Morocco (Figure 3). OECMs overlap with 62 KBAs that fall entirely outside PAs (within the boundaries of those countries and territories). The coverage provided to KBAs by OECMs is substantial in many cases; most notably in 15 KBAs with at least 99% OECM coverage across South Africa, Algeria, Colombia, and Morocco.
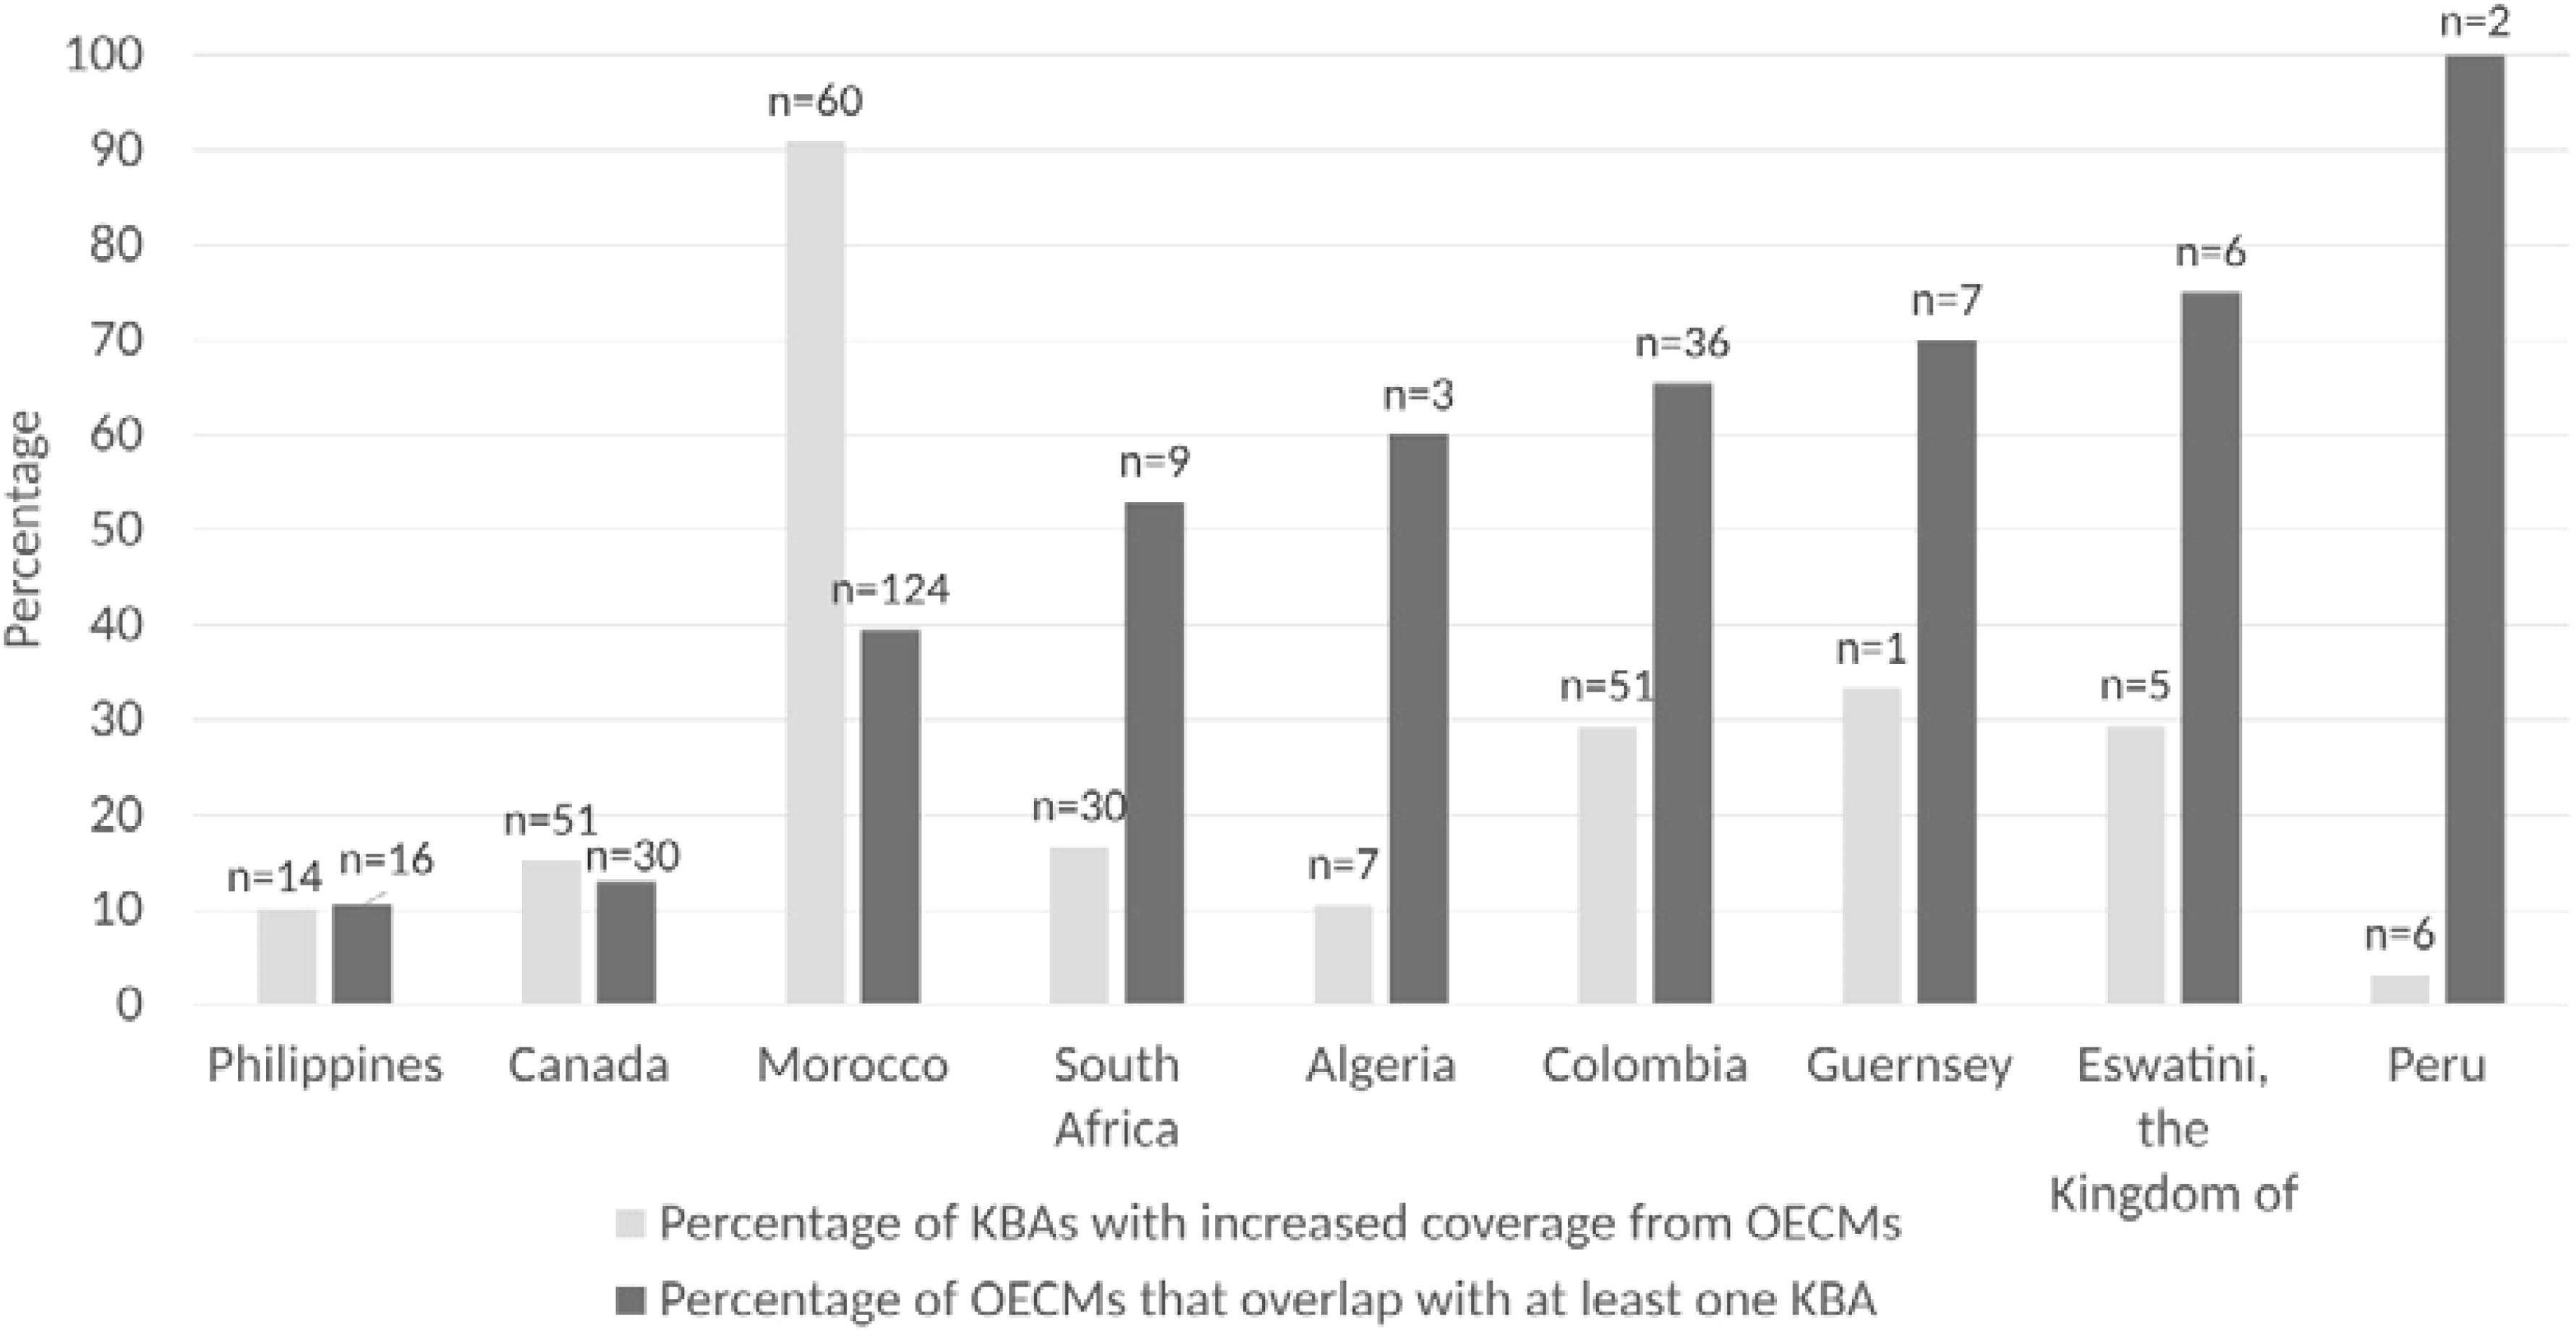
Figure 3. Percentage of Key Biodiversity Areas with increased coverage by OECMs, and percentage of reported OECMs that overlap with at least one KBA, broken down by country or territory, February 2023 (UNEP-WCMC and IUCN, 2023; BirdLife International, 2023).
In six countries and territories, over 50% of reported OECMs overlap with a KBA, providing one indication of the biodiversity values of these national OECM systems. These countries and territories are South Africa (9 of 17 OECMs overlap with a KBA), Algeria (3 of 5 OECMs overlap with KBAs), Colombia (36 of 55 OECMs overlap with KBAs), Guernsey (7 of 10 OECMs overlap with KBAs), the Kingdom of Eswatini (6 of 8 OECMs overlap with KBAs) and Peru (2 of 2 OECMs overlap with KBAs).
Ecologically or Biologically Significant Marine Areas (EBSAs) are areas that support the healthy functioning of oceans and the services they provide (Secretariat of the Convention on Biological Diversity, 2023b). Specific to the ocean, EBSAs provide a standardized approach for identifying areas of the ocean having special biological or ecological significance. In four countries (Canada, Colombia, Philippines and South Africa), OECMs provide coverage to EBSAs beyond that provided by PAs. This coverage is minimal (<10 km2) in all cases except four: Sulu-Sulawesi Marine Ecoregion in the Philippines (OECM coverage of 9,307 km2), Talud Continental Superior del Magdalena (900 km2) and Talud Continental Superior del Sinú (120 km2), both in Colombia, and Cape Canyon and Surrounds (South Africa) (124 km2) and Benguela Upwelling System (126 km2), both in South Africa. However, in the case of South Africa, the large size of these two EBSAs means that the coverage provided by OECMs is under 1%.
In contrast, OECMs provide a notable contribution to the percentage coverage of EBSAs in Colombia. Talud Continental Superior del Magdalena (which is fully within Colombian national waters) has no coverage from PAs, but 10.0% coverage from OECMs. Talud Continental Superior del Sinú (also fully within Colombian national waters) increases from 32.5% coverage with PAs only to 41.4% coverage when OECMs are considered. Within the waters of the Philippines, OECMs increase the percentage coverage of the Sulu-Sulawesi Marine Ecoregion EBSA from 9.5% with PAs only to 14.6%.
3.3 Ecological representation
OECMs contribute to ecological representation by increasing coverage of at least two ecoregions in all countries and territories where OECMs have been reported. In Morocco, OECMs contribute to an increase of coverage for all six terrestrial ecoregions. OECMs provide additional coverage of at least 1% to marine ecoregions or pelagic provinces in three countries and territories (Figure 4). Across the nine countries and territories, OECMs provide additional coverage of at least 1% in a total of 72 terrestrial ecoregions and 17 marine ecoregions and pelagic provinces.
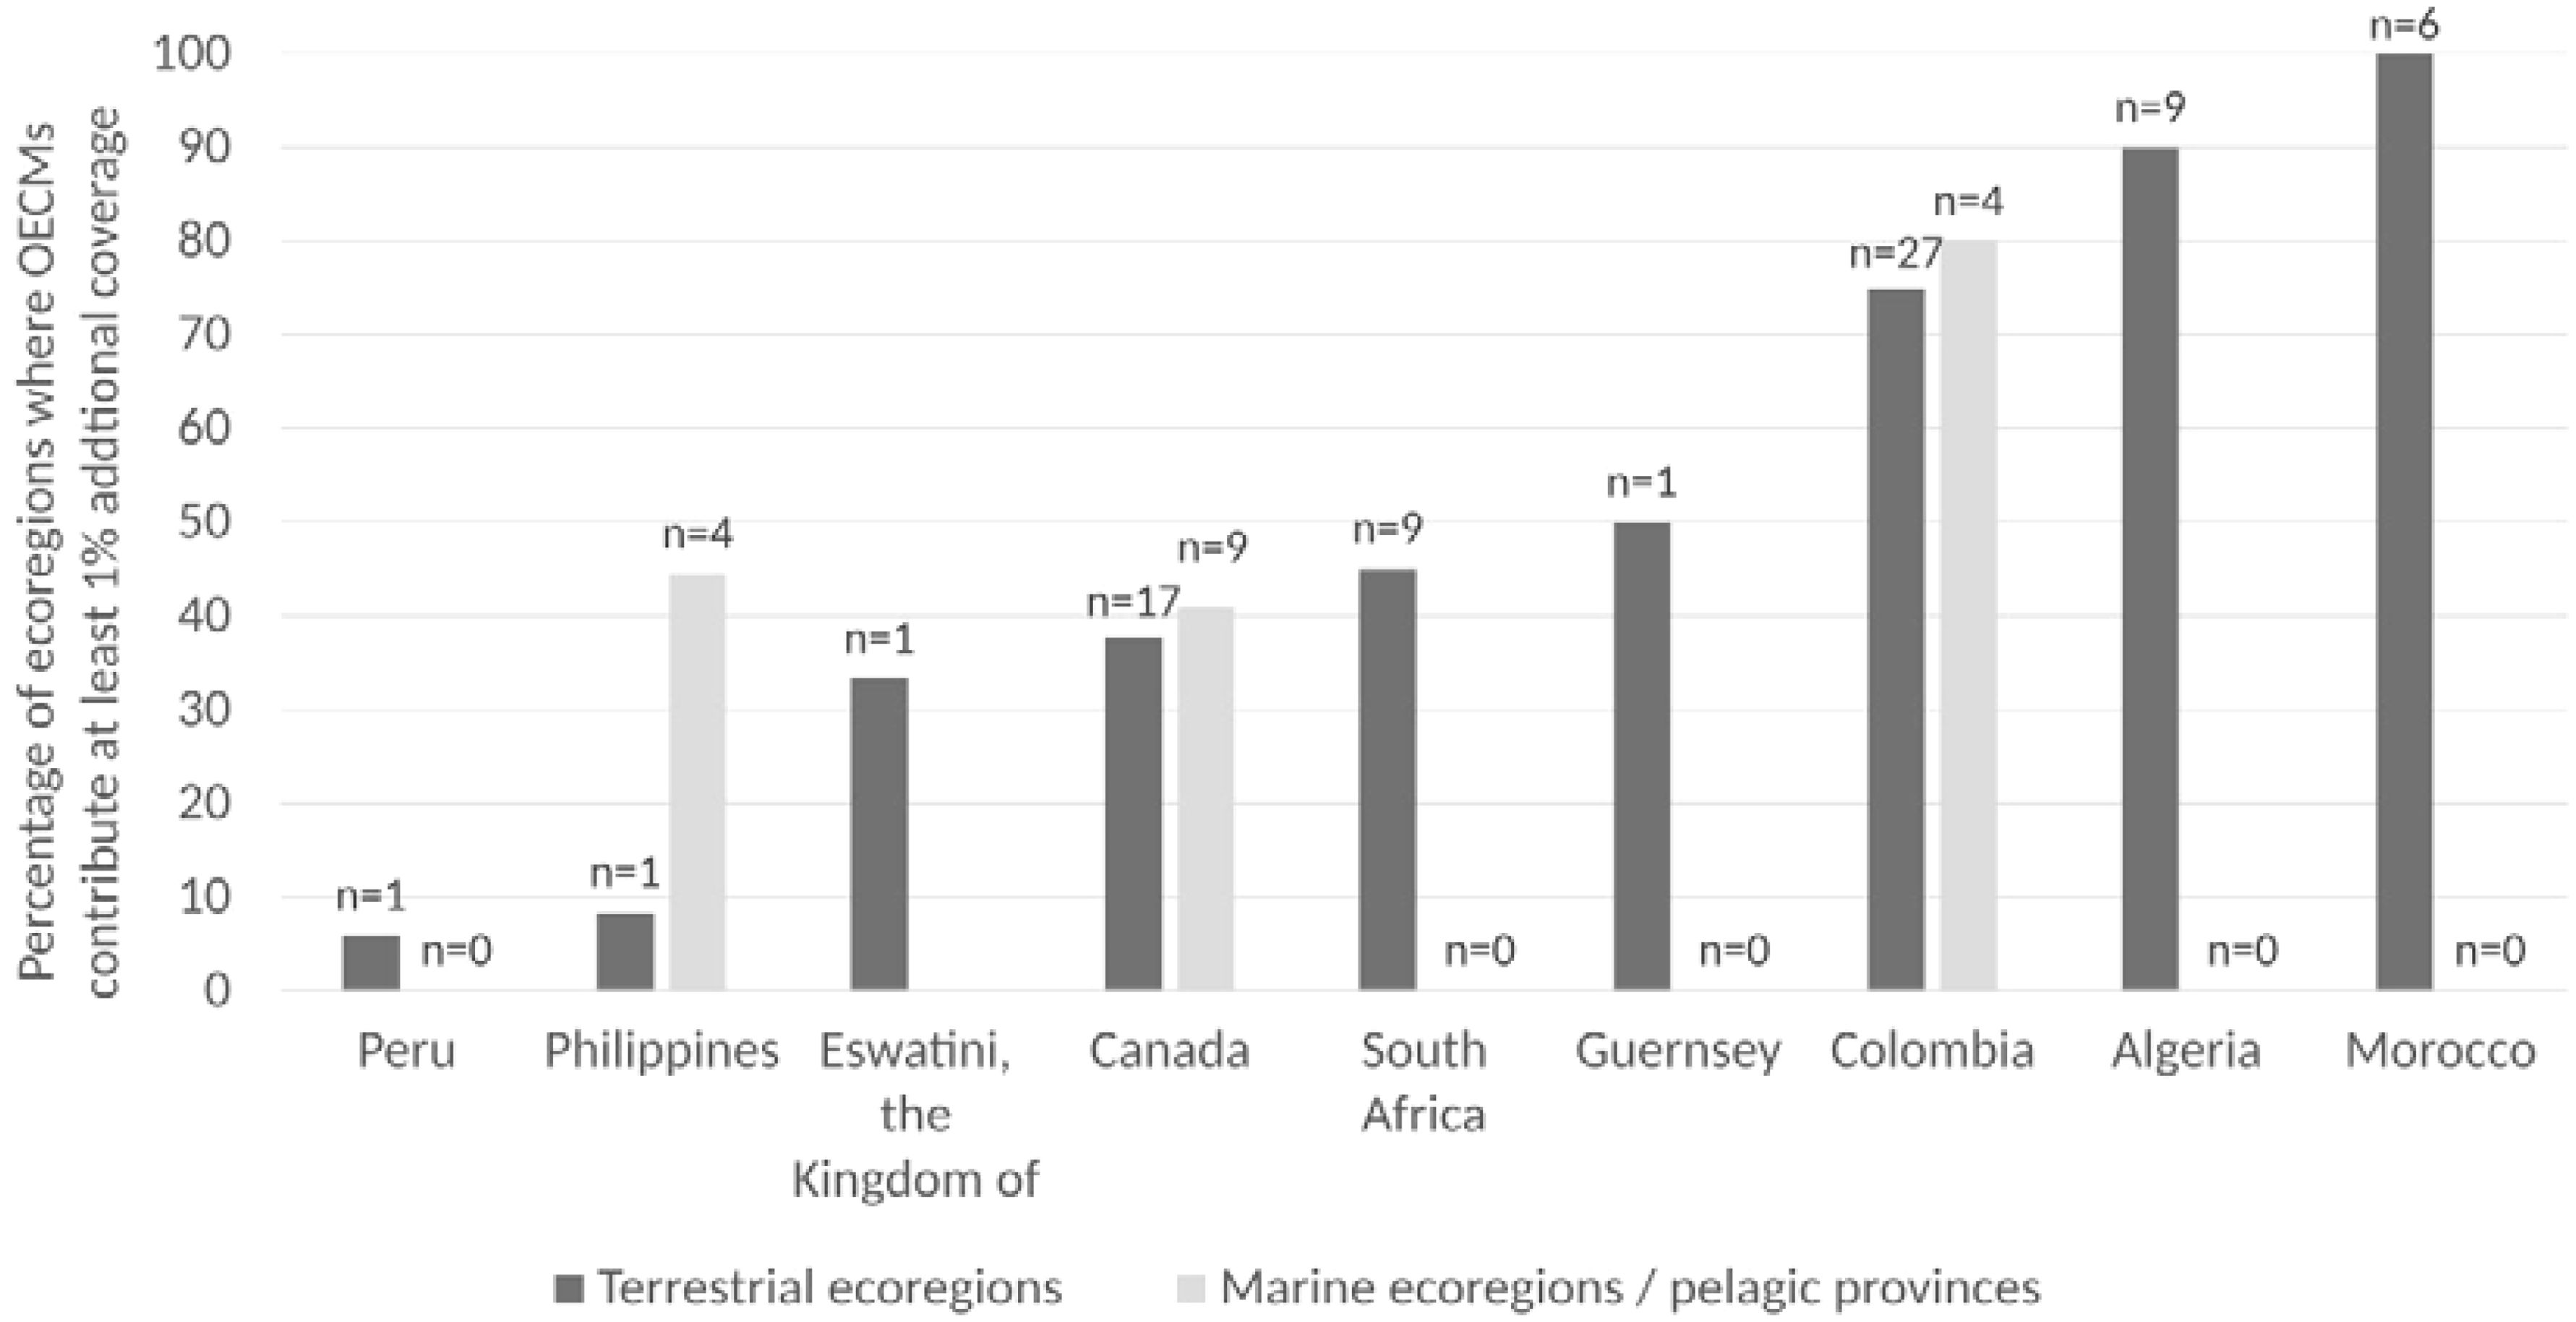
Figure 4. Percentage of terrestrial and marine ecoregions/pelagic provinces with increased conserved area coverage of at least 1% due to reported OECMs, broken down by country or territory, February 2023 (UNEP-WCMC and IUCN, 2023; Dinerstein et al., 2017; Spalding et al., 2012; 2007). In Morocco, there has been an increase in coverage in all of the country’s terrestrial ecoregions as a result of OECMs.
OECMs add coverage to 19 ecoregions and pelagic provinces that receive very little or no coverage (<2% within the borders of the countries and territories assessed) from PAs. The increase is dramatic in some cases: OECMs raise the coverage of Morocco’s Mediterranean Dry Woodlands and Steppe ecoregion from 0.03% to 66.1%. They also raise the coverage of Canada’s California Current pelagic province from 0.1% to 45.5%. In Algeria, OECMs increase the coverage of the South Sahara Desert and Sahelian Acacia Savanna ecoregions from zero to 77.8% and 99.8%, respectively.
While there are other interpretations, if Target 3’s element on ecological representation is taken to mean that 30% coverage of each ecoregion should be aimed for, then OECMs have contributed to achieving coverage goals at the ecoregion level. In 20 distinct terrestrial ecoregions across five countries, OECMs have provided additional coverage resulting in at least 30% total coverage within country borders from PAs and OECMs. Three marine ecoregions or pelagic provinces have achieved 30% coverage within national waters due to the added coverage provided by OECMs (Table 1).
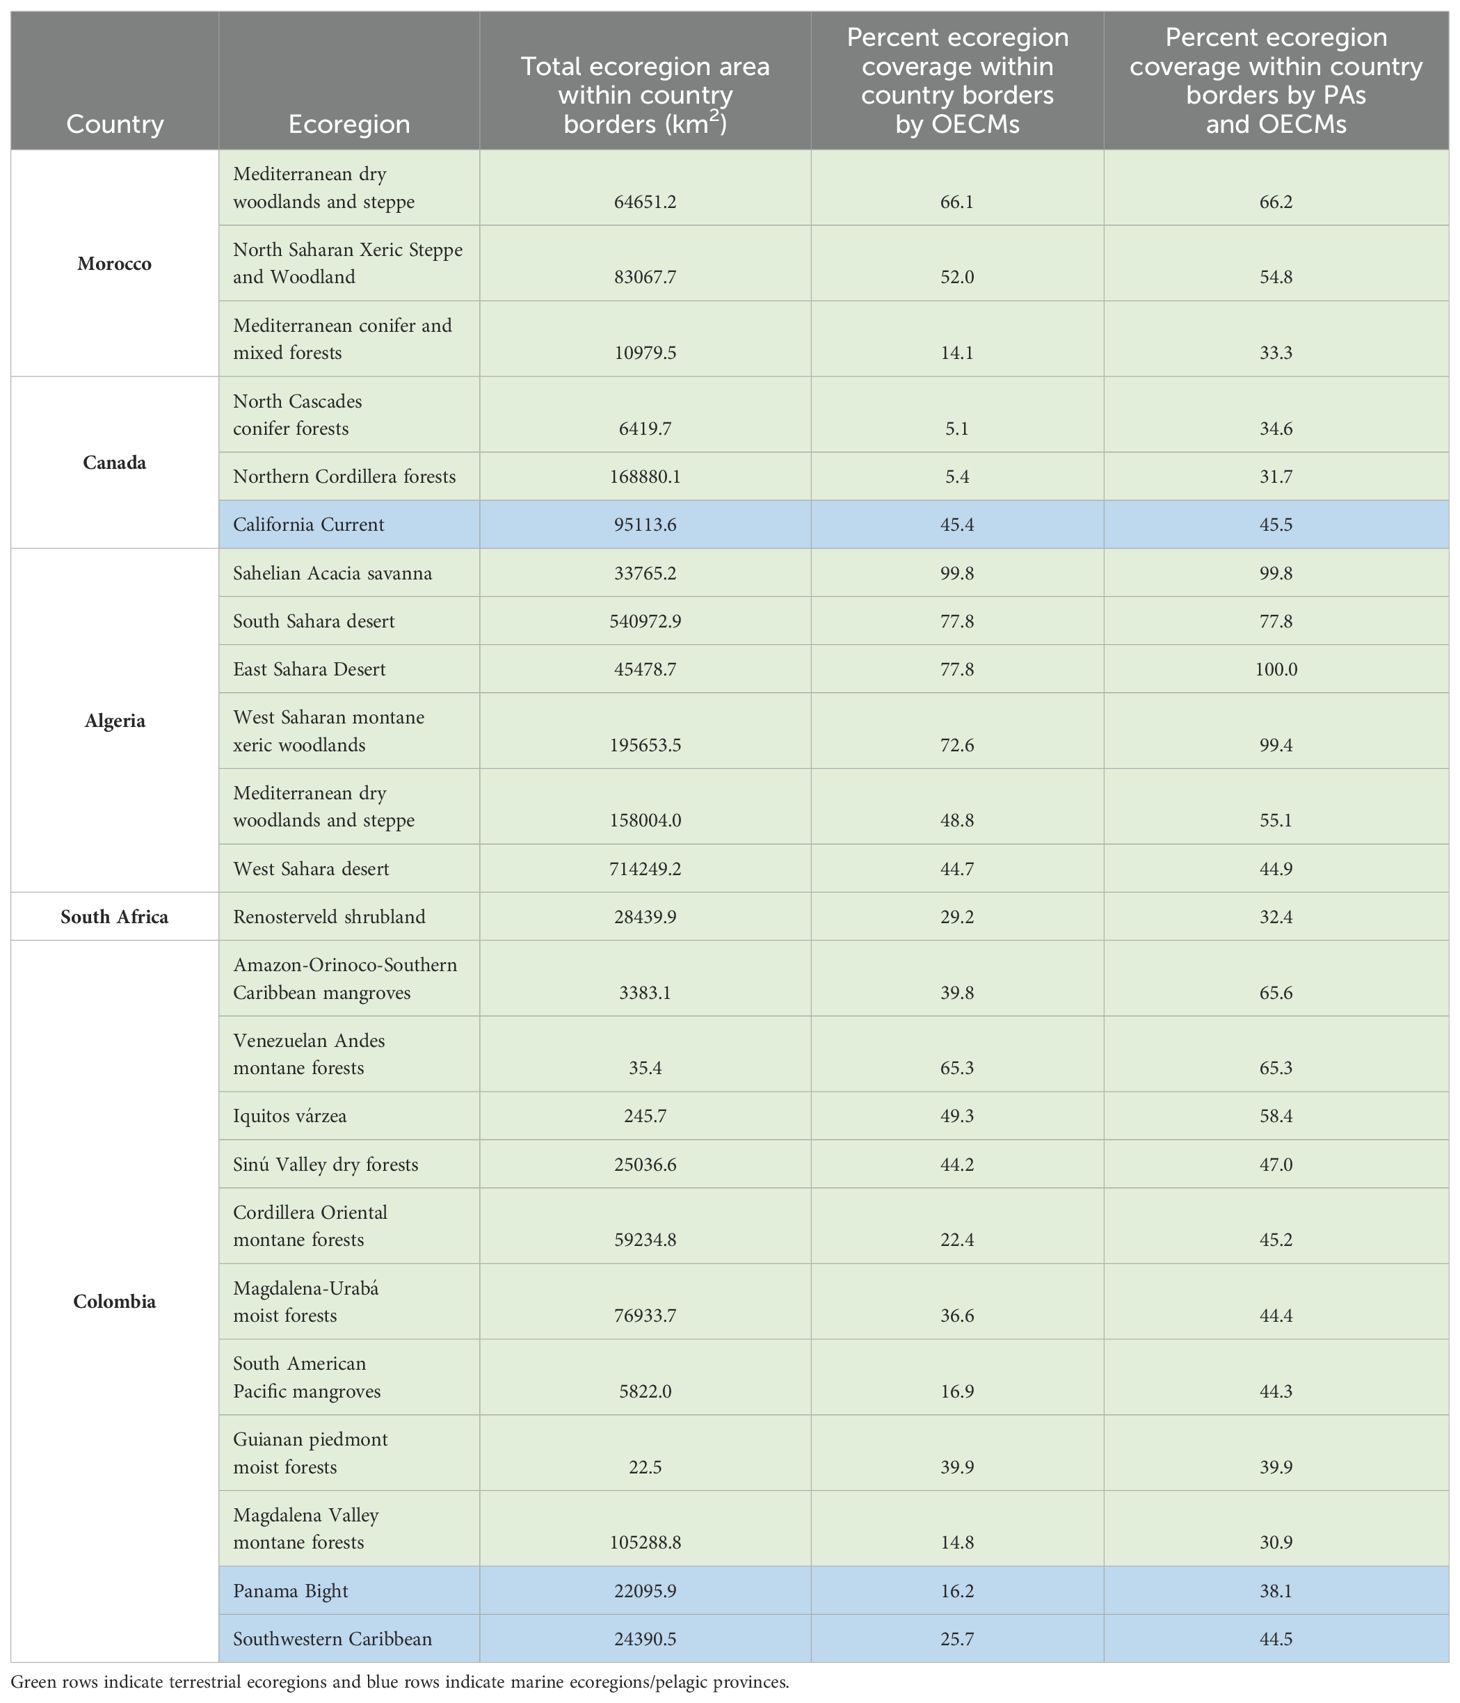
Table 1. Ecoregions where OECMs have provided additional coverage resulting in at least 30% total coverage within country borders from PAs and OECMs.
Importantly, OECMs also provide greater than ten percentage points of additional coverage to nine priority terrestrial ecoregions (as defined by Olson and Dinerstein, 2002) within country borders. Most notably, OECMs raise the coverage of the Mediterranean Forests, Woodlands and Scrub priority ecoregion from 1.4% to 27.1% in Morocco, and from 6.8% to 35.7% in Algeria. In Colombia, the coverage of the Chocó-Darién Moist Forests priority ecoregion is increased from 7.6% to 28.3%.
3.4 Well-connected systems
OECMs contribute to increased coverage, and increases in coverage will often result in increases in connectivity according to proximity-based analyses such as the ProtConn analysis presented here. The extent to which these increases in connectivity equate to real conservation outcomes depends upon the effectiveness of the PAs and OECMs in the network, and upon the biodiversity values of the land being connected.
For a few countries and territories, notably Algeria, Morocco and Guernsey, recognising OECMs has led to a significant increase in connected systems of terrestrial protected and conserved areas (Figure 5). The most substantial increase is in Morocco, where OECMs increase the amount of land that is connected and protected by 30 times. In Algeria, OECMs increase the percentage of protected and connected land 15 times, with almost half the country now protected and connected (49.4%). Importantly though, this finding is closely linked to the large size of the OECMs. In Colombia, the percentage is more than doubled, and in Guernsey it is more than quadrupled. However, in five of the nine countries and territories, including Guernsey, the amount of land that is connected and protected remains below 10% despite the inclusion of OECMs. This analysis also assessed the land cover types of lands within OECMs, finding that two thirds of the area covered has ‘bare/sparse vegetation’.
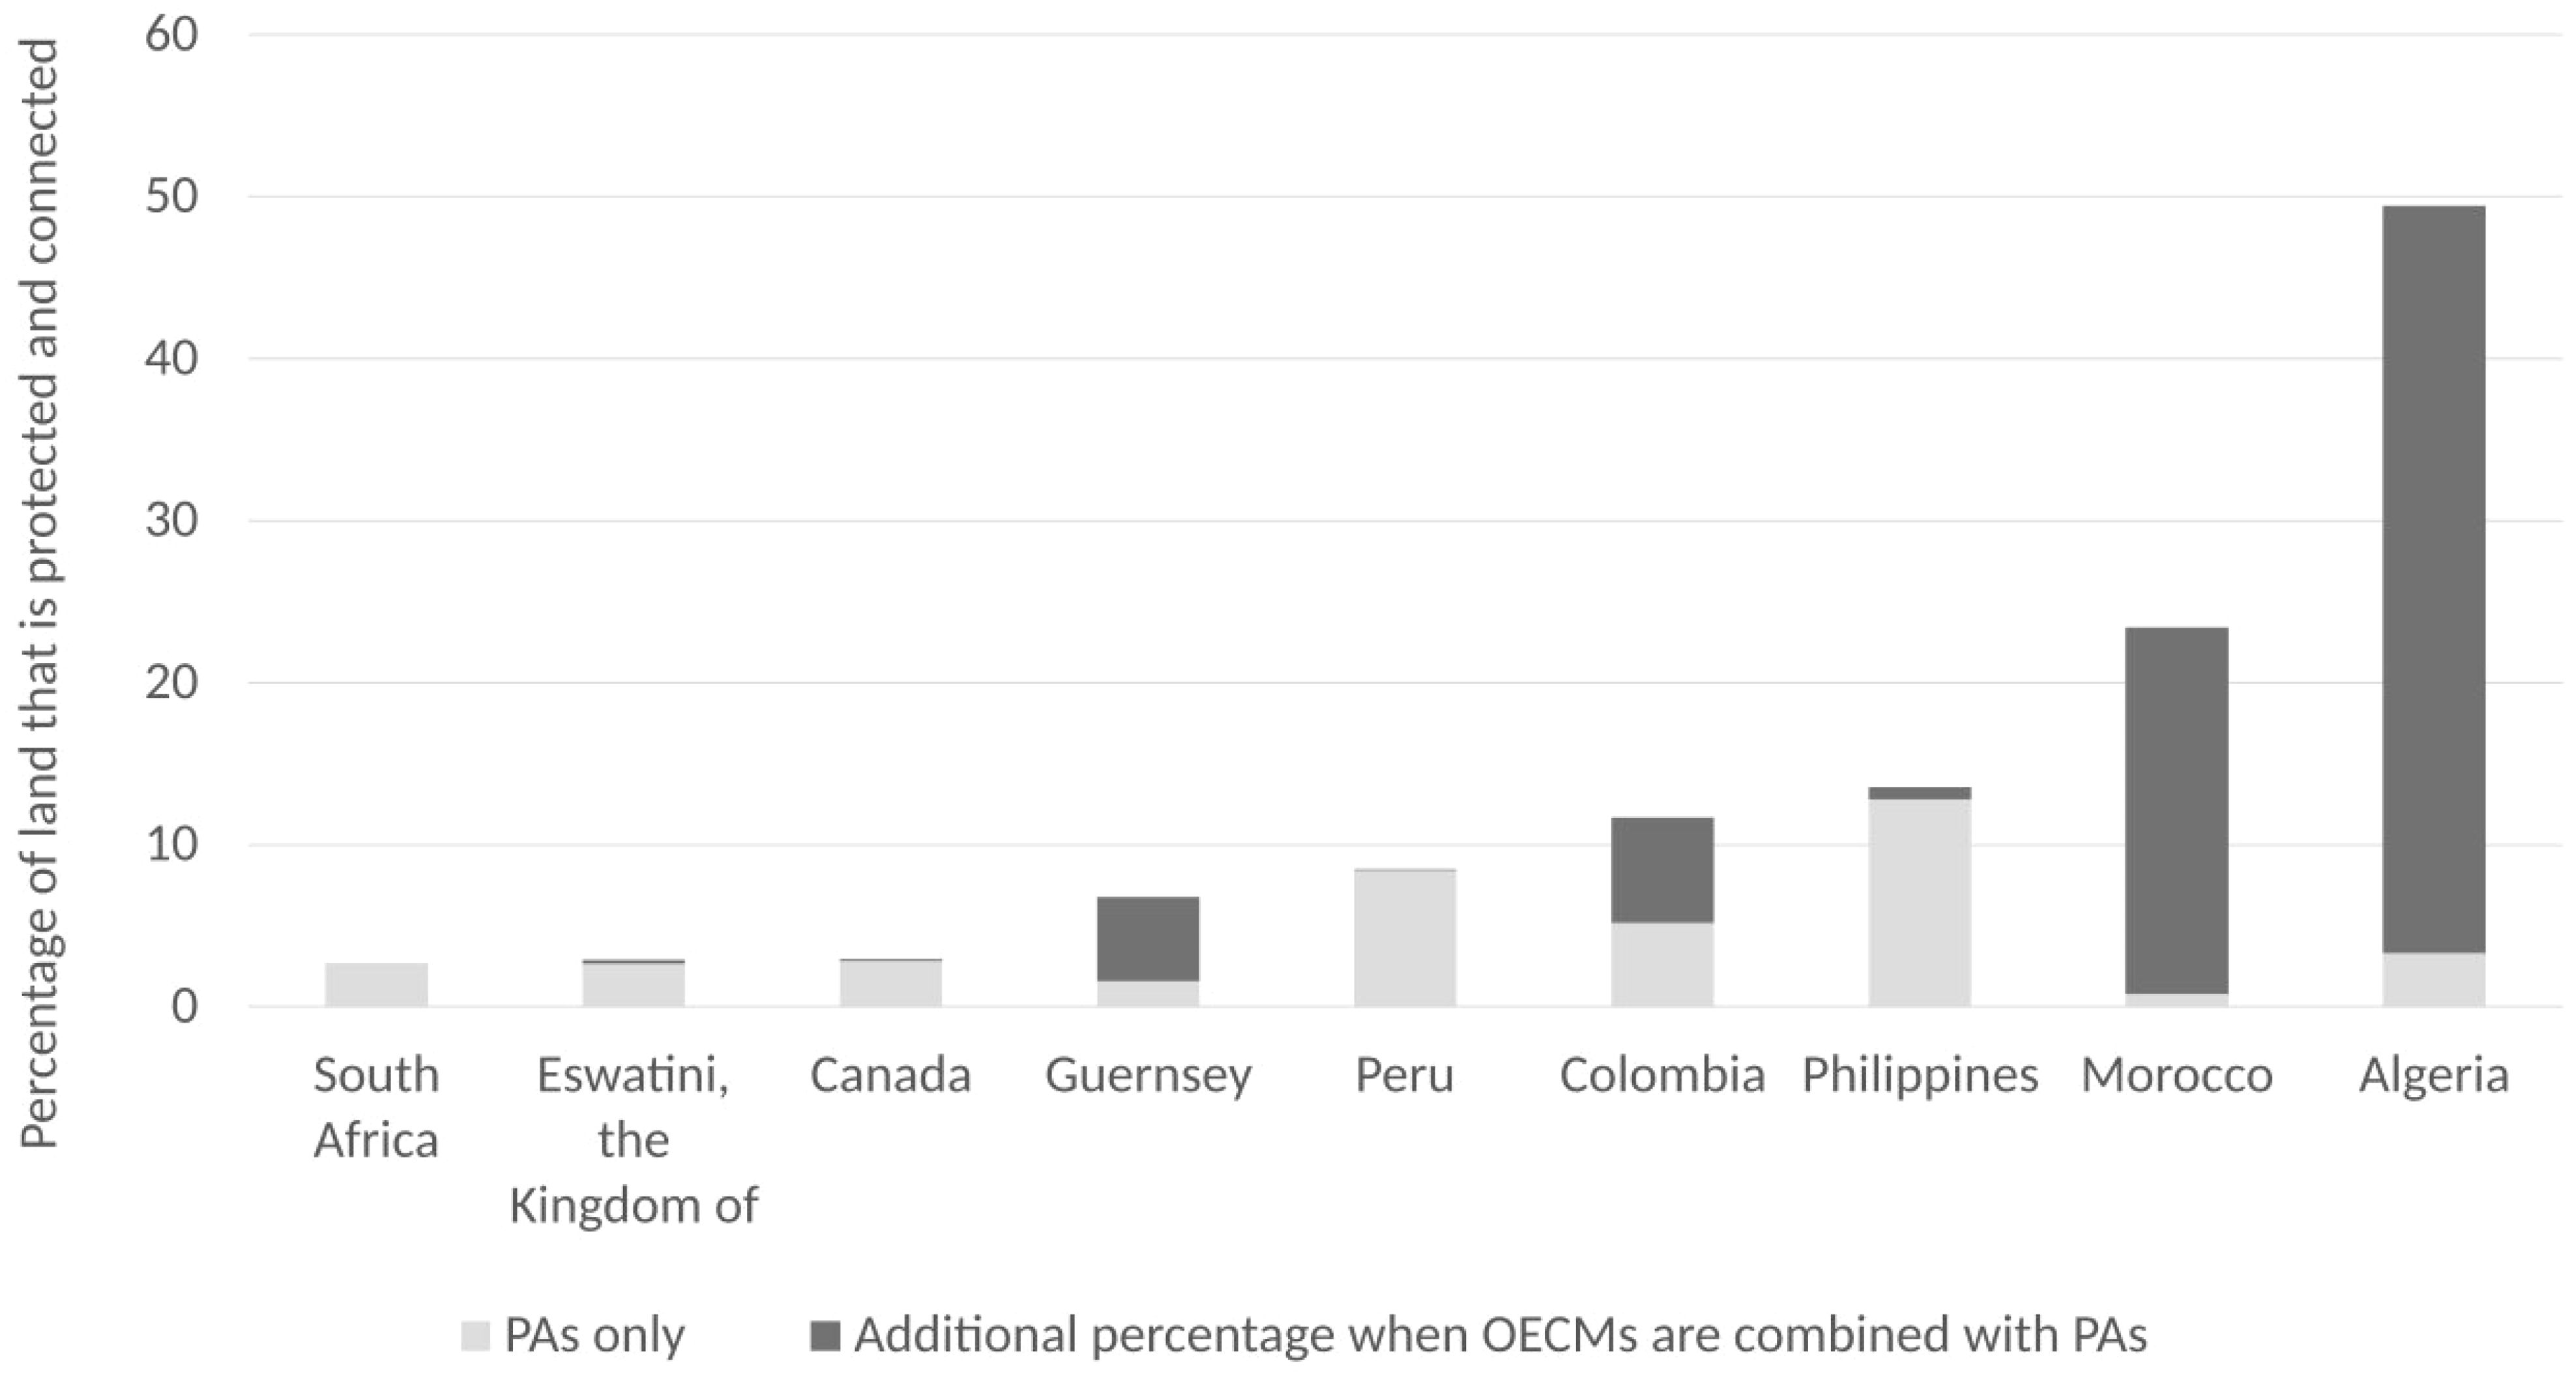
Figure 5. Percentage of land that is protected and connected by protected areas, and the additional percentage that is protected and connected when OECMs and protected areas are combined, February 2023 (UNEP-WCMC and IUCN, 2023).
3.5 Governance diversity
OECMs have been reported with all four of the main IUCN governance types (see Introduction; 31 OECMs do not have a reported governance type). Within the countries and territories assessed, a far higher proportion of OECMs than PAs have shared governance (OECMs: 40.9% (n = 335), PAs: 2.5% (n = 346)) and a higher proportion are under the governance of Indigenous peoples and local communities, though the proportions are low for both (OECMs: 1.3% (n = 11), PAs: 0.4% (n = 59)).
More PAs than OECMs are under private governance in these countries and territories (OECMs: 2.4% (n = 20), PAs: 28.0% (n = 3,801)). 51.6% (n = 423) of reported OECMs are under government governance, compared to 68.2% (n = 9,267) of PAs in these countries and territories. At the level of governance sub-types, collaborative governance (a sub-type of shared governance) is the most common among the OECMs currently reported, exceeding both the proportion and number of PAs under this governance type in the same countries and territories (OECMs: 40.4% (n = 331), PAs: 2.4% (n = 323).
In terms of total global extent, almost three quarters of the area covered by OECMs is under the governance of federal or national ministries or agencies (74.5%; 1,452,156 km2). OECMs under collaborative governance cover 15.6% (303,952 km2) of the total area covered by OECMs, and sites under the governance of non-profit organizations or sub-national ministries and agencies account for 4.4% (85,446 km2) and 5.0% (97,464 km2) of the total OECM extent, respectively. The remaining coverage is a mosaic of other governance sub-types, including overlapping types, which together account for less than 0.5% (9,881 km2) of the total area. These figures are heavily influenced by Algeria’s five very large OECMs, all of which are under the governance of federal or national ministries or agencies and which cover 1,153,164 km2. If these OECMs are not considered, the area under collaborative governance slightly exceeds the area under the governance of federal or national ministries or agencies (38.2% vs 37.6%).
Additional results relating to governance type are reported in Supplementary Information.
3.6 Management objectives
Among the reported OECMs, 41.3% (n = 339) have conservation as a primary management objective and 27.2% (n = 223) have conservation as a secondary objective. For the remaining OECMs, no information on management objectives has been reported (31.5% (n = 258)). No OECMs have been reported as having ancillary conservation outcomes, where conservation outcomes are generated via objectives that are not in the first instance related to biodiversity, such as closing an area for sacred or military reasons.
In terms of coverage, conservation is a primary objective across 70.6% of the area covered by reported OECMs globally. As with governance type, this figure is largely influenced by the large OECMs in Algeria, all of which have conservation as a primary objective. In four of the nine countries and territories (Algeria, Colombia, Peru and the Philippines), conservation is the primary objective across the entirety (or almost the entirety) of the area covered by OECMs.
Globally, OECMs with conservation as a secondary objective account for only 6.0% of the total area covered by OECMs, but variation can be seen between different countries and territories. In the case of Morocco, conservation is a secondary objective across most of the area covered by OECMs. Globally, 23.1% of the area covered by OECMs does not have associated data on management objectives, and this data is lacking for all OECMs in three of the nine countries and territories (Canada, Guernsey, and South Africa).
4 Discussion
The centrality of OECMs within the Global Biodiversity Framework’s Target 3 appears to be incentivising governments and other actors to identify and report OECMs towards the 2030 deadline. We have analyzed the characteristics of the sites within the World Database on OECMs to understand the contribution of the OECM framework to the ‘30x30’ target to date. Our analysis of the data provides a number of important insights, which we summarize below and extrapolate from to highlight implications and make recommendations relating to the identification, reporting and monitoring of OECMs.
4.1 Coverage
Even with only nine countries reporting, OECMs contribute substantially to the coverage of area-based conservation systems in several countries and territories, and, more marginally, globally. As with protected areas, the diversity of size across OECMs suggests that they may play a role in conserving biodiversity across large landscapes and seascapes as well as smaller habitats.
4.2 Governance
We found that the majority of reported OECMs are governed by government agencies, followed by OECMs under shared governance. Collaborative governance (a sub-type of shared governance) is, however, the most common governance sub-type among reported OECMs. The proportion of OECMs reported as under shared governance is also much higher than that of PAs under this governance type in the same countries and territories. Although the proportion is considerably smaller, there are also OECMs reported under the governance of Indigenous peoples and local communities, and private governance. While still notable, the trend towards government governance is less strong than among protected areas at the global level, of which 85.8% are recorded as under government governance in the WDPA. These preliminary results suggest that the OECM framework may enable the identification of sites governed by government agencies and in shared arrangements that cannot be reported as PAs, increasing the diversity of actors considered to be engaged in conservation, although the actors involved in the shared governance arrangements are not reported.
These are very early results and they should be interpreted as such. They do not yet support the expectation that the OECM framework will become a means to enable biodiversity conservation led by Indigenous peoples and local communities to be better recognized and supported (Jonas et al., 2017; Gurney et al., 2021; Dawson et al., 2021). Given the origin of the concept of OECMs was to bring greater recognition to other governance types delivering long-term conservation outcomes beyond protected areas, especially Indigenous and local communities (Jonas et al., 2014), we are surprised that these early results were still skewed heavily to governance by government. This may be the result of a number of factors.
First, the low numbers of reported OECMs governed by Indigenous peoples, local communities and private actors (while proportionally higher than those for PAs) could be related to the longstanding problem of under-reporting of non-government PAs (Corrigan et al., 2016; Bingham et al., 2017). Second, it is not always possible to discern the involvement of Indigenous peoples and local communities in governance from the data on governance type in the WD-OECM, meaning that these groups may be involved in governance across more OECMs than is immediately apparent. For example, the Philippines has reported 117 Locally-managed Marine Protected Areas - a designation generally considered to be associated with governance by Indigenous peoples and local communities - with a range of governance types, none of which directly reference Indigenous peoples or local communities. Third, the processes in the nine countries and territories which have reported OECMs have been largely state-led, which has promoted an early focus on sites wholly or partly governed by state agencies. Fourth, the adoption of the definition of an OECM and agreement of the Global Biodiversity Framework are recent occurrences, with only a small number of countries and territories engaging with the OECM framework to date. Few Indigenous peoples, local communities and private actors have been introduced to or had time to explore the pros and cons of the framework. This includes actors assessing how the reporting of their sites will benefit them. Finally, this result might also reflect Indigenous peoples’, local communities’ and some private entities’ concerns that recognition processes could result in the imposition of external worldviews and undermine the rights and self-determination of existing governing actors (Jonas et al., 2017; Gurney et al., 2021, 2023). Given that protected areas and other forms of conservation have sometimes displaced indigenous and local communities (Bennett et al., 2015; Bavinck et al., 2017), there may be concerns that designation of a managed area as an OECM could similarly result in negative social outcomes.
4.3 Management objectives
OECMs can be managed for biodiversity conservation (primary conservation), in ways that deliver secondary conservation outcomes (secondary conservation), or for objectives unrelated to the area’s biodiversity (ancillary conservation). We found that the majority of reported OECMs had conservation as a primary objective, though the management objective was not reported for almost a third of all sites. This result is unexpected. It was assumed that the majority of OECMs would arise though secondary or ancillary conservation. Areas with a primary conservation objective reported as OECMs were considered to be a likely exception to the rule during the development of the OECM framework (Jonas et al., 2018). These findings contradict this assumption. These trends require further analysis, including inquiring into why areas with a primary conservation objective have not been reported as protected areas. The fact that so many sites have no reported data for this field underscores the point that without reliable data, sites’ qualities cannot be fully assessed and their contributions to Target 3 will remain uncertain.
4.4 Areas important for biodiversity
The results suggest that many OECMs, when globally mapped, are contributing to the conservation of areas that are important for biodiversity. The contributions made by OECMs already reported appear to be substantial in some cases, e.g. where they cover otherwise unprotected KBAs and EBSAs. This is a reason for optimism about the potential for OECMs to contribute meaningfully to conservation of biodiversity. While we found varying degrees of overlap between reported OECMs and KBAs, a separate study found that many KBAs may be governed in ways that could meet the OECM criteria if assessed (Donald et al., 2019). The capacity for OECMs to expand protection of KBA is therefore larger than currently available data estimate. However, because there is variation across countries and territories in the extent of overlap between OECMs and KBAs, there is still a need for continued attention to planning systems of PAs and OECMs that conserve important areas for biodiversity. While we found that the majority of reported OECMs do not overlap with a KBA, this does not, however, necessarily indicate a lack of biodiversity value. KBAs and EBSAs are not the only measures of biodiversity importance; other metrics exist (for example, national governments might use their own systems for identifying areas with high species richness or locally important species populations, or might use systematic conservation planning to create networks of protected and conserved areas that together have high biodiversity importance). The lack of data on whether such values have been identified, and what they are, is a major gap affecting our ability to interpret the data in the WD-OECM. While countries are already invited to provide such information when reporting on their OECMs, greater uptake of this option is needed.
4.5 Ecological representation and connectivity
While the observed increases in coverage of individual ecoregions may be beneficial for the conservation of those ecoregions, true ecological representation requires all ecoregions to have adequate coverage for their biodiversity values to be conserved. While significant increases in coverage of single ecoregions may drive some countries’ overall coverage above 30%, it is essential to note that this should not prevent further efforts to improve coverage of other ecoregions that remain under-represented. Similarly, ecoregions vary substantially in their biodiversity values. Target 3 will not be fully achieved at national or global levels if efforts are directed towards high coverage of lower-biodiversity ecoregions at the expense of higher-biodiversity ecoregions.
The connectivity analysis provided further evidence that biodiversity values need greater attention in the process of recognising OECMs. It revealed that, while several countries and territories have more connected conservation networks as a result of recognising OECMs, these gains in connectivity may not always equate to substantial biodiversity benefits. This is because more than two thirds of the land covered by recognised OECMs is located in areas that are described as ‘bare/sparse vegetation’. While the conservation of ecosystems within this land cover type is beneficial in cases where important biodiversity values have been identified, a disproportionate focus on such ecosystems at the expense of others could hinder the implementation of the ‘ecologically representative’ aspect of Target 3. More specific data on the identified biodiversity values within OECMs with these land cover types would therefore be valuable.
4.6 Realm and biome
Our research shows that most OECMs have been designated in terrestrial rather than marine environments, with many large areas (larger than PAs on average) being identified in a very short time period. This extremely rapid increase in OECM coverage with limited information on attention to effectiveness is concerning and could indicate the realization of fears that CBD Parties might use the OECM framework to meet CBD commitments without actually contributing to biodiversity conservation (Claudet et al., 2022). Efforts being undertaken at the global level to support Parties in reporting on effectiveness will, over time, help to clarify the extent to which these concerns are justified.
While many of the results presented here are encouraging, their validity hinges on two important points: 1. whether the OECMs contributing to those results are located in areas with biodiversity value, and 2. whether those OECMs are effectively conserving their biodiversity values - as required by the CBD’s definition and criteria of an OECM. The first point is particularly relevant to the results on connectivity and ecological representation, where the increases seen will only result in positive conservation outcomes if the OECMs cover areas with important biodiversity values. The second point is equally crucial and of relevance to all results, because demonstration of conservation outcomes is central to the OECM criteria. To date, Parties have not had a clear mechanism to report on biodiversity values or effectiveness at the global level. Ongoing changes to reporting mechanisms will provide greater clarity in the run-up to 2030. In the meantime, focus must be maintained on all elements of Target 3, with clear messaging that the Target will only have been achieved if each element is implemented through “effectively conserved … systems of protected areas and other effective area-based conservation measures, while recognizing Indigenous and traditional territories” (Convention on Biological Diversity, 2022; emphasis added).
This focus on all elements of the target is vital, since from the available data it cannot yet be concluded that any of the countries and territories have implemented them comprehensively. This is an important reminder that, while identifying and recognising OECMs may help countries to meet their global commitments, it is unlikely to be sufficient in the absence of other conservation actions. Instead, identifying OECMs provides countries with a clearer understanding of the current status of their area-based conservation systems - including whether those systems are well-connected, ecologically representative, covering important areas, equitable and effective. The crucial next step for most countries will be to use this understanding to prioritize action to strengthen networks of protected and conserved areas, to promote equitable governance, effective management and conservation outcomes. This next step is essential if protected and conserved areas are to provide the additive conservation benefits needed to halt and reverse biodiversity loss.
4.7 Limitations and future research
The factors that limited our research relate to major gaps in the data being collected on OECMs that will be important to understanding progress in the future. First, we cannot confirm that any of the sites that have been reported as OECMs were effective at conserving biodiversity over the long term at the time of reporting, or since then. Similarly, data on the condition or quality of the site’s governance, including the extent to which the sites are equitably governed and effectively managed (Leverington et al., 2010; Dawson et al., 2018) is also deficient. Only two OECMs can be confirmed to have undergone a systematic evaluation of their long-term in situ biodiversity conservation outcomes: Disko Fan Conservation Area and Lophelia Coral Conserved Area, both in Canada and both marine areas (Cook, 2023); none can be confirmed to have been assessed from a rights-based or social perspective.
Second, we were unable to assess if the reported OECMs met all the criteria outlined in CBD Decision 14/8 or if Parties used the guidance documents based on these criteria, specifically the IUCN OECM Assessment Tool (Jonas et al., 2023) or the FAO Handbook (FAO, 2022). Third, while initial comparisons have been made with PAs in the same countries and territories, the limited quantity of reported OECM data requires these comparisons to be interpreted with caution. When further OECMs are reported, the trends that are currently being seen may be altered.
Our analysis reveals some gaps that would benefit from research, including: the kinds of shared governance arrangements that are being reported as OECMs; why so few Indigenous peoples, local communities and private entities have yet engaged (or been supported to engage by national governments) with the framework; why so many sites that have a primary conservation objective are being reported as OECMs rather than as PAs; how to appropriately assess the governance equity and long-term conservation effectiveness of different types of governance and management arrangements (government-led, shared, private, Indigenous and locally-led) in the context of OECMs, also compared to other types of area-based conservation measures; and how they are impacting local populations (noting the need for sex-disaggregated data) both positively and negatively. Documenting specific OECM case studies around the world will help us to better understand them as social-ecological systems, their governance structures, the different uses and strategies for activities taking place, the benefits and incentives that different governance authorities see in the OECM framework, and the processes that were undertaken to identify, report and monitor them (Cook, 2024). The more participatory this research, the more likely it is to have validity and generate reciprocal learning between stewards of biodiversity and members of the research community.
As the OECM framework is rolled out more widely, the need for such research will become all the more important. Most urgent will be filling the data gap on the outcomes of recognizing and managing sites as OECMs. Whether positive outcomes - both social and biodiversity-related - are materializing is the key question that cannot yet be answered by the global data. Over the next few years, there is an immediate need to gather, share and learn from data that can help us answer these questions.
4.8 Recommendations
We make five recommendations to support the further identification, reporting and monitoring of OECMs, with a focus on the biodiversity of sites and equity considerations, to promote accountability in the implementation of the GBF. Based on the availability of data, we do not make recommendations related to the non-biodiversity values of OECMs.
We recommend that:
1. Government agencies, non-state rightsholders and stakeholders seek opportunities to collaborate according to rights-based approaches in the identification, reporting and monitoring of OECMs across the full range of governance types.
2. Government agencies and other relevant actors record information on whether identified OECMs have been screened using agreed CBD criteria (CBD Decision 14/8), including which screening tool was used, and report this information to the WD-OECM.
3. Government agencies and other relevant actors record information on the specific biodiversity values of identified OECMs, and report this information to the WD-OECM.
4. Government agencies and other relevant actors make use of the new reporting system being developed within Protected Planet to report more meaningful data on the quality of governance, management and conservation outcomes of OECMs.
5. Organizations engaged in providing guidance on OECMs advise government agencies and other relevant actors on how frequently OECMs should be monitored and/or reassessed, as well as how to ensure the capacity needed for such monitoring. There is a corresponding need for training on decision support tools across a growing and diverse conservation sector.
CBD Decision 14/8 and Target 3 of the Global Biodiversity Framework put a specific emphasis on OECMs and protected areas being effective area-based conservation measures, i.e, delivering biodiversity outcomes over the long term (Jonas et al., 2021). Furthermore, the GBF and associated CBD decisions state that responsibility and transparency in planning, monitoring, reporting, and review are needed. In this context, this paper highlights the potential of OECMs to contribute to Target 3 and the broader aims of the GBF. It also illuminates the challenges of verifying whether or not reported OECMs are meeting the criteria established by the CBD, in particular around conservation effectiveness and equity considerations. The recommendations are intended to address these issues and reinforce accountability to the Kunming-Montreal Global Biodiversity Framework in support of OECMs in Target 3.
Data availability statement
Publicly available datasets were analyzed in this study. This data can be found here: https://www.protectedplanet.net/en, https://wdkba.keybiodiversityareas.org, https://www.cbd.int/ebsa/, https://www.marineregions.org/, https://shoreline.noaa.gov/data/datasheets/wvs.html.
Author contributions
HJ: Conceptualization, Funding acquisition, Supervision, Writing – original draft, Writing – review & editing. HB: Data curation, Formal analysis, Methodology, Software, Visualization, Writing – original draft, Writing – review & editing. NB: Conceptualization, Writing – original draft, Writing – review & editing. SW: Methodology, Writing – original draft, Writing – review & editing. RZ: Project administration, Writing – review & editing. EH: Data curation, Formal analysis, Methodology, Software, Writing – original draft, Writing – review & editing. EB: Data curation, Formal analysis, Methodology, Software, Writing – original draft, Writing – review & editing. JU: Data curation, Formal analysis, Methodology, Software, Writing – original draft, Writing – review & editing. BG: Data curation, Formal analysis, Methodology, Software, Writing – original draft, Writing – review & editing. VK: Data curation, Formal analysis, Methodology, Software, Writing – original draft, Writing – review & editing. JL: Data curation, Formal analysis, Methodology, Software, Writing – original draft, Writing – review & editing. GD: Writing – review & editing. GiD: Writing – review & editing. GrA: Writing – review & editing. JC: Writing – review & editing. CC: Writing – review & editing. JD: Writing – review & editing. KG: Writing – review & editing. GG: Writing – review & editing. CL: Writing – review & editing. LR: Writing – review & editing.
Funding
The author(s) declare financial support was received for the research, authorship, and/or publication of this article. The Sall Family Foundation funded the cost of the journal fee for this paper.
Acknowledgments
K. MacKinnon passed away during the writing of this paper. The authors pay tribute to K. MacKinnon’s life work, including her work on OECMs since 2016. The authors thank the following individuals for their comments and support: E. Lee, S. Mahajan, D. Marnewick, R. Naidoo, P. Pacheco, M. Rao, R. Shaw, and C. Weaver.
Conflict of interest
The authors declare that the research was conducted in the absence of any commercial or financial relationships that could be construed as a potential conflict of interest.
Publisher’s note
All claims expressed in this article are solely those of the authors and do not necessarily represent those of their affiliated organizations, or those of the publisher, the editors and the reviewers. Any product that may be evaluated in this article, or claim that may be made by its manufacturer, is not guaranteed or endorsed by the publisher.
Supplementary material
The Supplementary Material for this article can be found online at: https://www.frontiersin.org/articles/10.3389/fcosc.2024.1447434/full#supplementary-material
Supplementary Figure S1 | Size distribution of OECMs and PAs per governance type in the nine countries and territories with reported OECMs, February 2023 (UNEP-WCMC and IUCN, 2023). Wider sections of the violin plot represent a higher density of OECMs or PAs at that size, while narrower sections represent a lower density. The dotted line represents the median. Totals (n) are derived from polygon data only and will therefore differ from the figures given in the text, which also include point data (see methodology).
References
Alves-Pinto H., Geldmann J., Jonas H., Maioli V., Balmford A., Latawiec A. E., et al. (2021). Opportunities and challenges of other effective area-based conservation measures (OECMs) for biodiversity conservation. Perspect. Ecol. Conserv. 19, 115–120. doi: 10.1016/j.pecon.2021.01.004
Bavinck M., Berkes F., Charles A., Esteves Dias A. C., Doubleday N., Nayak P., et al. (2017). The impact of coastal grabbing on community conservation: A global reconnaissance. Maritime Stud. 16, 8. doi: 10.1186/s40152-017-0062-8
Bennett N. J., Govan H., Satterfield T. (2015). Ocean grabbing. Mar. Policy 57, 61–68. doi: 10.1016/j.marpol.2015.03.026
Bingham H., Fitzsimons J. A., Redford K. H., Mitchell B. A., Bezaury-Creel J., Cumming T. L. (2017). Privately protected areas: Advances and challenges in guidance, policy, and documentation. PARKS 23. doi: 10.2305/IUCN.CH.2014.PARKS
BirdLife International (2023). World database of key biodiversity areas. Available online at: https://wdkba.keybiodiversityareas.org/login (Accessed on April 15, 2023).
Borrini-Feyerabend G., Pimbert M., Farvar M. T., Kothari A., Renard Y., Jaireth H., et al. (2013). Sharing power: A global guide to collaborative management of natural resources. Earthscan.
Brooks T. M., Akçakaya H. R., Burgess N. D., Butchart S. H. M., Hilton-Taylor C., Hoffmann M., et al. (2016). Analysing biodiversity and conservation knowledge products to support regional environmental assessments. Sci. Data 3, 160007.
CBD (1992). Convention on biological diversity. Available online at: https://www.cbd.int/convention/text/.
CBD, Subsidiary Body on Scientific, Technical and Technological Advice (2024). Guidance on using the indicators of the monitoring framework of the Kunming-Montreal Global Biodiversity Framework. Twenty-sixth meeting (Nairobi: UNEP), 13–18.
Claudet J., Ban N. C., Blythe J., Briggs J., Darling E., Gurney G. G., et al. (2022). Avoiding the misuse of other effective area-based conservation measures in the wake of the blue economy. One Earth 5, 969–974. doi: 10.1016/j.oneear.2022.08.010
Convention on Biological Diversity (CBD) (2010). Aichi biodiversity targets. Available online at: https://www.cbd.int/sp/targets/.
Convention on Biological Diversity (CBD) (2018). Decisions adopted by the conference of the parties to the convention on biological diversity. Decision 14/8 on protected areas and other effective area-based conservation measures.
Cook C. (2023). Progress developing the concept of other effective area-based conservation measures. Conserv. Biol., e14106. doi: 10.1111/cobi.14106
Cook C. N. (2024). Diverse approaches to protecting biodiversity: The different conservation measures discussed as possible other effective area-based conservation measures. Conserv. Lett., e13027. doi: 10.1111/conl.13027
Corrigan C., Bingham H., Broome N. P., Hay-Edie T., Tabanao G., Kingston N. (2016). Documenting local contributions to Earth’s biodiversity heritage: The Global Registry. PARKS 22. doi: 10.2305/IUCN.CH.2014.PARKS
Dawson N., Martin A., Danielsen F. (2018). Assessing equity in protected area governance: approaches to promote just and effective conservation. Conserv. Lett. 11, e12388. doi: 10.1111/conl.12388
Dawson N. M., Coolsaet B., Sterling E. J., Loveridge R., Gross-Camp N. D., Wongbusarakum S., et al. (2021). The role of indigenous peoples and local communities in effective and equitable conservation. Ecol. Soc. 26, 19. doi: 10.5751/ES-12625-260319
Dinerstein E., Olson D., Joshi A., Vynne C., Burgess N. D., Wikramanayake E., et al. (2017). An ecoregion-based approach to protecting half the terrestrial realm. BioScience 67, 534–545. doi: 10.1093/biosci/bix014
Donald P. F., Buchanan G. M., Balmford A., Bingham H., Couturier A. R., de la Rosa G. E. Jr., et al. (2019). The prevalence, characteristics and effectiveness of Aichi Target 11’s “other effective area-based conservation measures” (OECMs) in Key Biodiversity Areas. Conserv. Lett. 12, e12659. doi: 10.1111/conl.12659
FAO (2022). A handbook for identifying, evaluating and reporting other effective area-based conservation measures in marine fisheries. (Rome, Italy).
Gurney G., Adams V., Alvarez-Romero J., Claudet J. (2023). Area-based conservation: Taking stock and looking ahead. One Earth 6, 98–104. doi: 10.1016/j.oneear.2023.01.012
Gurney G. G., Darling E. S., Ahmadia G. N., Agostini V. N., Ban N. C., Blythe J., et al. (2021). Biodiversity needs every tool in the box: use OECMs. Nature 595, 646–649. doi: 10.1038/d41586-021-02041-4
Hoesen J., Bagshaw D., Elliott J., Haas C. A., Kelly J., Lazaruk H., et al. (2023). Assessing the effectiveness of potential protected areas and OECMs in conserving biodiversity against subsurface resource extraction impacts. Biol. Conservation 283 110134. doi: 10.1016/j.biocon.2023.110134
IUCN-WCPA Task Force on OECMs (2019). Recognising and reporting other effective area-based conservation measures. (Gland, Switzerland).
Jonas H. D., Ahmadia G. N., Bingham H. C., Briggs J., Butchart S. H. M., Cariño J., et al. (2021). Equitable and effective area-based conservation: Towards the conserved areas paradigm. Parks 27. doi: 10.2305/IUCN.CH.2021PARKS-27-1en
Jonas H. D., Barbuto V., Jonas H. C., Kothari A., Nelson F. (2014). New steps of change: Looking beyond protected areas to consider other effective area-based conservation measures. Parks 20. doi: 10.2305/IUCN.CH.2014.PARKS
Jonas H. D., Lee E., Jonas H. C., Matallana-Tobon C., Wright K. S., Nelson F., et al. (2017). Will “other effective area-based conservation measures” increase recognition and support for ICCAs. Parks 23, 63–78. doi: 10.2305/IUCN.CH.2014.PARKS
Jonas H. D., MacKinnon K., Dudley N., Hockings M., Jessen S., Laffoley D., et al. (2018). Other effective area-based conservation measures: from aichi target 11 to the post-2020 biodiversity framework. PARKS 24, 9–16. doi: 10.2305/IUCN.CH.2014.PARKS
Jonas H. D., MacKinnon K., Marnewick D., Wood P. (2023). Site-level tool for identifying other effective area-based conservation measures (OECMs). First edition. IUCN WCPA Technical Report Series No. 6. Gland, Switzerland: IUCN.
Lemieux C. J., Kraus D. T., Beazley K. F. (2022). Running to stand still: The application of substandard OECMs in national and provincial policy in Canada. Biol. Conserv. 275, 109780. doi: 10.1016/j.biocon.2022.109780
Leverington F., Costa K. L., Pavese H., Lisle A., Hockings M. (2010). A global analysis of protected area management effectiveness. Environ. Manage. 46, 685–698. doi: 10.1007/s00267-010-9564-5
MacKinnon D., Lemieux C. J., Beazley K., Woodley S., Helie R., Perron J., et al. (2015). Canada and Aichi Biodiversity Target 11: Understanding ‘other effective area-based conservation measures’ in the context of the broader target. Biodiversity Conservation 24, 3559–3581. doi: 10.1007/s10531-015-1008-3
National Geospatial-Intelligence Agency World Vector Shoreline. Available online at: https://shoreline.noaa.gov/data/datasheets/wvs.html.
Olson D. M., Dinerstein E. (2002). The Global 200: Priority ecoregions for global conservation. Ann. Missouri Botanical Garden 89, 199–224. doi: 10.2307/3298564
Saura S., Bastin L., Battistella L., Mandrici A., Dubois G. (2017). Protected areas in the world’s ecoregions: How well connected are they? Ecol. Indicators. 76, 144–158. doi: 10.1016/j.ecolind.2016.12.047
Saura S., Bertzky B., Bastin L., Battistella L., Mandrici A., Dubois G. (2018). Protected area connectivity: Shortfalls in global targets and country-level priorities. Biol. Conserv. 219, 56–67. doi: 10.1016/j.biocon.2017.12.020
Saura S., Bertzky B., Bastin L., Battistella L., Mandrici A., Dubois G. (2019). Global trends in protected area connectivity from 2010 to 2018. Biol. Conserv. 238, 108183. doi: 10.1016/j.biocon.2019.07.028
Secretariat of the Convention on Biological Diversity (2023b). Background on the EBSA process. Available online at: https://www.cbd.int/ebsa/about.
Secretariat of the Convention on Biological Diversity (2023a). Ecologically or biologically significant marine areas (EBSAs) spatial dataset. Available online at: https://www.cbd.int/ebsa/.
Spalding M., Agostini V., Rice J., Grant S. (2012). Pelagic provinces of the world: A biogeographic classification of the world’s surface pelagic waters. Ocean Coast. Management. 60, 19–30. doi: 10.1016/j.ocecoaman.2011.12.016
Spalding M. D., Fox H. E., Allen G. R., Davidson N., Ferdaña Z. A., Finlayson M., et al. (2007). Marine ecoregions of the world: A bioregionalization of coastal and shelf areas. BioScience 57, 573–583. doi: 10.1641/B570707
UNEP-WCMC and IUCN (2021). Protected Planet Report 2020 (Cambridge, UK: UNEP). Available at: https://livereport.protectedplanet.net/.
UNEP-WCMC and IUCN (2023). Protected Planet: The World Database on Protected Areas (WDPA) (Cambridge, UK: UNEP-WCMC and IUCN). Available at: www.protectedplanet.net.
VLIZ (Flanders Marine Institute) (2014). Maritime Boundaries Geodatabase, version 8. Available online at: https://www.marineregions.org/.
Keywords: global biodiversity framework, 30x30, target 3, other effective area-based conservation measures, protected areas, equitable conservation, effective conservation, reporting
Citation: Jonas HD, Bingham HC, Bennett NJ, Woodley S, Zlatanova R, Howland E, Belle E, Upton J, Gottlieb B, Kamath V, Lessmann J, Delli G, Dubois G, Ahmadia G, Claudet J, Cook C, Deza J, Grorud-Colvert K, Gurney G, Lemieux CJ and Ruiz L (2024) Global status and emerging contribution of other effective area-based conservation measures (OECMs) towards the ‘30x30’ biodiversity Target 3. Front. Conserv. Sci. 5:1447434. doi: 10.3389/fcosc.2024.1447434
Received: 11 June 2024; Accepted: 30 August 2024;
Published: 03 October 2024.
Edited by:
Xingli Giam, The University of Tennessee, Knoxville, United StatesReviewed by:
Isaac Eckert, McGill University, CanadaCarly Cowell, Botanic Gardens Conservation International, United Kingdom
Copyright © 2024 Jonas, Bingham, Bennett, Woodley, Zlatanova, Howland, Belle, Upton, Gottlieb, Kamath, Lessmann, Delli, Dubois, Ahmadia, Claudet, Cook, Deza, Grorud-Colvert, Gurney, Lemieux and Ruiz. This is an open-access article distributed under the terms of the Creative Commons Attribution License (CC BY). The use, distribution or reproduction in other forums is permitted, provided the original author(s) and the copyright owner(s) are credited and that the original publication in this journal is cited, in accordance with accepted academic practice. No use, distribution or reproduction is permitted which does not comply with these terms.
*Correspondence: Harry D. Jonas, aGFycnkuam9uYXNAd3dmdXMub3Jn