 Sebastian Schneider
 Lorenzo von Fersen
 Paul Wilhelm Dierkes
- 1Bioscience Education and Zoo Biology, Goethe University Frankfurt, Frankfurt am Main, Germany
- 2Behavioral Ecology and Conservation Lab, Nuremberg Zoo, Nuremberg, Germany
The population sizes of manatees in many regions remain largely unknown, primarily due to the challenging nature of conducting visual counts in turbid and inaccessible aquatic environments. Passive acoustic monitoring has shown promise for monitoring manatees in the wild. In this study, we present an innovative approach that leverages a convolutional neural network (CNN) for the detection, isolation and classification of manatee vocalizations from long-term audio recordings. To improve the effectiveness of manatee call detection and classification, the CNN works in two phases. First, a long-term audio recording is divided into smaller windows of 0.5 seconds and a binary decision is made as to whether or not it contains a manatee call. Subsequently, these vocalizations are classified into distinct vocal classes (4 categories), allowing for the separation and analysis of signature calls (squeaks). Signature calls are further subjected to clustering techniques to distinguish the recorded individuals and estimate the population size. The CNN was trained and validated using audio recordings from three different zoological facilities with varying numbers of manatees. Three different clustering methods (community detection with two different classifiers and HDBSCAN) were tested for their suitability. The results demonstrate the ability of the CNN to accurately detect manatee vocalizations and effectively classify the different call categories. In addition, our study demonstrates the feasibility of reliable population size estimation using HDBSCAN as clustering method. The integration of CNN and clustering methods offers a promising way to assess manatee populations in visually challenging and inaccessible regions using autonomous acoustic recording devices. In addition, the ability to differentiate between call categories will allow for ongoing monitoring of important information such as stress, arousal, and calf presence, which will aid in the conservation and management of manatees in critical habitats.
1 Introduction
In recent years, there has been a remarkable increase in interest and scientific research in the field of animal bioacoustics, largely driven by the proliferation of innovative technologies that allow more accurate and comprehensive data collection in the study of animal vocalizations. This advancement, coupled with the availability of high-quality recording equipment at low cost, has greatly increased the accessibility of bioacoustic research, fostering inclusivity across scientific communities and enabling a more comprehensive understanding of animal communication (Erbe and Thomas, 2022). In addition, the study of animal bioacoustics is becoming increasingly important in species conservation projects, as the analysis of animal vocalizations can be used for animal population estimation (Marques et al., 2013). Animals in human care, particularly in zoological facilities, provide an invaluable opportunity to systematically study and understand various aspects of their behavior, communication modalities and physiological characteristics (Rose and Riley, 2021). The controlled conditions within zoological facilities facilitate the careful study of individual behavior and the identification and analysis of vocalizations, allowing a detailed examination of communication patterns.
Manatees possess a wide array of sounds crucial for communication and social interactions. As initially noted by Bengtson and Fitzgerald (1985), manatees demonstrate increased vocalization during social engagements, particularly in interactions between parents and offspring. These vocalizations, as highlighted by Hartman (1979), serve the purpose of maintaining close acoustic contact between mother and calf, proving particularly vital during brief separations experienced by mother-calf pairs. Various studies have revealed that the song repertoires of all subspecies appear to be very similar (Nowacek et al., 2003). Although the studies provide different classification schemes ranging from two to six call types, the descriptions of the overall structures of the repertoires were very similar (Brady et al., 2020).
Brady et al. (2020) identified five distinct call types within the Florida manatee (Trichechus manatus latirostris) vocal repertoire: the tonal squeak, the hill-shaped high squeak, the noisy squeal, the two-toned chirp, and the combinatory squeak-squeal. Intriguingly, specific vocalizations among manatees exhibit cross-species and subspecies occurrence. As per Reyes-Arias et al. (2023), within the geographic diversity in manatee vocal repertoires, specific calls are consistent across populations, subspecies, and diverse geographic locations. The study compared the vocalizations of wild West Indian manatees from Florida (Trichechus manatus latirostris) and Antillean manatees (Trichechus manatus manatus) from Belize and Panama. Squeaks, high squeaks and squeals were observed in all examined populations. Their findings shed light on the existence of shared vocalizations between these groups and show a remarkable consistency in acoustic communication despite differences in habitats, genetic backgrounds, and geographical dispersion. In another study, Brady et al. (2023) studied the vocalization patterns of manatees in two different habitats off St. George’s Caye in Belize. Using recordings collected over 19 days, they analyzed 3,262 calls to examine differences in call rates, types and environmental influences between sites. While call rates did not differ significantly between sites, the number of calls decreased on consecutive days. Sound calls decreased after sunset, which correlates with the increasing presence of boats. These results suggest differentiated patterns of activity influenced by environmental factors. There is also evidence that the sex and age of the individual affects the vocalizations of Antillean manatees (Sousa-Lima et al., 2008). Typically, female vocalizations have a longer duration, a higher fundamental frequency, and a lower peak frequency. In contrast, calf vocalizations tend to have higher values for these attributes than adult vocalizations. These results shed light on the different vocal characteristics influenced by sex, age and individuality and highlight the potential of acoustic features to distinguish and categorize manatee vocalizations. Overall, all these studies show variations in the vocal repertoire of manatees, but also many similarities.
Individual or group vocalizations are playing an increasingly important role in acoustic monitoring, in addition to their communicative function. Factheu et al. (2023) used and compared three methods for monitoring African manatees: visual point scan, 360° sonar scan and passive acoustic monitoring (PAM). The results showed that passive acoustic had the highest detection rate, followed by 360° sonar and then visual point scan. Which habitats manatees visit and when and where they stay can be answered using this PAM method. PAM methods are now also used to count animals in abundance estimation studies. Especially for aquatic mammals such as vaquitas (Rojas-Bracho and Jaramillo-Legoretta, 2009; Gerrodette et al., 2011) or harbour porpoises (Jacobson et al., 2017), the total population can be validly estimated based on the registered echolocation clicks.
Another way to count animals by their vocalizations would be for each individual to emit a so-called signature call. For several species, it has been shown that clustering algorithms can discriminate these signature calls based on acoustic features and thus reliably estimate the number of individuals (Adi et al., 2010; Kershenbaum et al., 2013; Linhart et al., 2022; Schneider et al., 2022). There are two studies that provide convincing evidence that the calls of Amazonian and Antillean manatees are individually different (Sousa-Lima et al., 2002, 2008). A further study by Dietrich et al. (2022) supports this assumption. Although the number of animals (3) was small, two animals showed a high stability of their chirp calls over a period of one year. This confirms the results of the studies by Sousa et al. and fulfils the requirements for a possible count of the animals. Acoustic features were extracted to distinguish the individuals. The duration of the calls as well as the fundamental frequency and the harmonics proved to be effective (Sousa-Lima et al., 2002, 2008; Dietrich et al., 2022). A method based on bioacoustics would be possible, especially in areas where the water conditions do not permit any other counting options. There are already publications showing that clustering algorithms have the potential to correctly estimate the number of individuals in a manatee group (Castro et al., 2016; Merchan et al., 2019). To think in this direction, it would make sense to develop an automatic recognition and classification of the calls relevant for individual recognition.
Studies have already shown that manatee calls can be reliably detected using deep learning methods (Merchan et al., 2020; Rycyk et al., 2022). So far, call detection using artificial intelligence (AI) can provide information about the frequency and temporal occurrence of vocalizations in general. However, because current AI solutions can only distinguish the sounds of a manatee from background noise, they cannot infer the frequency of specific calls or the behaviors and conditions associated with those calls. To make better use of the recognized vocalizations, it makes sense to classify them according to the different call types. For example, the increased occurrence of certain vocalizations can provide important information about the presence of calves (Hartman, 1979; Brady et al., 2022). When estimating population size in an area using clustering methods, it is necessary to use only one particular call, as otherwise the different calls of the vocal repertoire would also be clustered. This is where the deep learning method presented here comes in, allowing the classification of the different manatee call types. This makes it possible to separate specific signature calls of manatees and use them to determine population size using clustering algorithms. However, clustering of manatee calls to determine population size has only been tested on single groups with a certain number of individuals or with vocalizations preselected by humans with optimal conditions (high signal quality and reliable assignment to the individual) which favors a data set with well distinguishable clusters and do not represent the total number of individuals in an area (Castro et al., 2016; Merchan et al., 2019). In nature, it is of crucial importance that less ideal vocalizations must often be used to accurately estimate the population size. In addition, the setting of certain parameters of the clustering algorithms and also the extracted acoustic features influence the clustering result (Wadewitz et al., 2015; Schneider et al., 2022). It is therefore necessary to have a method that is robust and works reliably for different group sizes and under different conditions without the need to adjust parameters and acoustic characteristics.
The aim of this study is to present a method that can reliably process and analyze a large amount of data under different conditions. The goal is to detect manatee vocalizations in long-term recordings, classify them according to 4 known categories of manatee calls, and then estimate the population size using the signature calls via a robust clustering method. For this purpose, different conditions and several cluster methods were tested. The automated analysis has the advantage that larger amounts of data can be analyzed, increasing the chance of detecting all individuals in an area. In addition, recordings can be analyzed over time to monitor changes in population size, animal activity, and potentially the appearance of offspring.
2 Methods
2.1 Data collection
Audio data from manatees (Trichechus manatus manatus) were collected in 3 different zoos, Nuremberg Zoo (June and July 2023), Wroclaw Zoo (August 2023) and Duisburg Zoo (March 2023). In Nuremberg, a new manatee joined the group in July (previously 3 individuals, then 4), which made it possible to evaluate under the same conditions but with different group sizes. In Wroclaw there were 5 individuals at the time of recording and in Duisburg 2. A SoundTrap ST300 HF – Compact Recorder (Ocean Instruments, Auckland, New Zealand) was used for audio recordings. Recordings from Nuremberg Zoo and Burgers’ Zoo Arnhem made between 2019 and 2022 with the HTI 96 MIN hydrophone (High Tech Inc., MS, USA) were used to train the initial CNN models. The recordings were made at different sampling rates between 44.1 and 288 kHz. Therefore, all recordings were down sampled to 44.1 kHz. The recordings were divided into training, validation, and test data sets. For training and validation, 30.5 hours of audio material were evaluated, generating datasets with a total of 1270 vocalizations. The distribution of training and validation data sets is shown in Table 1. To test the CNN, another 15 hours of audio material with a total of 768 recognized vocalizations were evaluated by human and by the CNN. To determine the activity phases of the manatees, 4 x 24h audio recordings were analyzed, in which a total of 5108 vocalizations were found by the CNN.
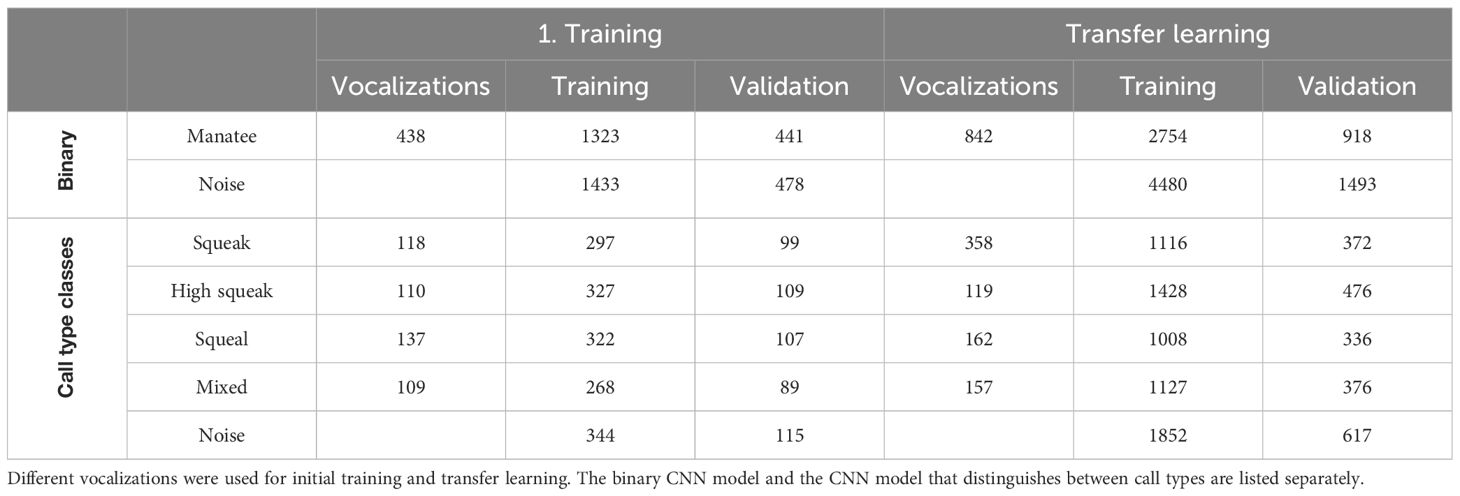
Table 1 Number of vocalizations used and amount of data generated by augmentation and windowing for training and validation of CNN models.
2.2 CNN
A deep learning method for automatic detection and classification of manatee calls was developed using the convolutional neural network architecture EfficientNetB3 (Tan and Le, 2019), which has been proven to achieve state-of-the-art accuracy in vision classification tasks, while being smaller and faster than comparable models (Hahn-Klimroth et al., 2021). Tensorflow was used as a framework. Python version 3.10.9 was used as the programming language. The EfficientNet architecture was modified only slightly by adding a dropout layer with a dropout rate of 0.3, applying batch normalization, and using the rectified linear function as the activation function. To improve the model, we included a learning rate reduction on plateau, which reduces the learning rate by a factor of 0.7 when a metric has stopped improving. The Adam algorithm was used as the optimizer with an initial learning rate of 0.001. As input for both training and prediction, 0.5 second audio clips are used. When evaluating long-term audio recordings, the recording is divided into 0.5 second segments that overlap by 75%. Thus, every 0.125 seconds, a 0.5 second segment is classified. The training of the CNN networks was done with 40 epochs and a batch size of 16 samples. For training, randomly selected audio clips are augmented to increase the robustness of the model and to compensate for unbalanced classes (Stowell, 2022). For this purpose, vocalizations from classes with less data are augmented several times in order to balance the amount of data. Audio waveform augmentations are used to stretch or compress the signal on the time axis without changing pitch, add noise, increase or decrease gain, or mute a randomly selected portion of the signal. In the spectrogram fractions of frequencies are masked. Whether and which augmentations are used is randomly selected. It is also possible to apply multiple augmentations to a clip or none.
2.2.1 Data preparation
There is no consensus in the literature as to which spectrogram representation is best suited for training a deep learning model, with a linear or mel-scaled representation often being preferred (Stowell, 2022). This is why some studies take advantage of multiple spectrogram representations of the same audio signal by “stacking” a series of spectrograms into a multichannel input signal (Thomas et al., 2020; Stowell, 2022; Xie et al., 2022). To take advantage of this multichannel input signal, the audio signals are transformed into four different time-frequency representations. For this purpose, a linearly scaled and a Mel-scaled spectrogram are created and normalized using per-channel energy normalization (PCEN) and decibel scaling (dB-scaling). This results in 4 different time-frequency representations, which show the characteristics of the vocalizations in different ways (Figure 1).
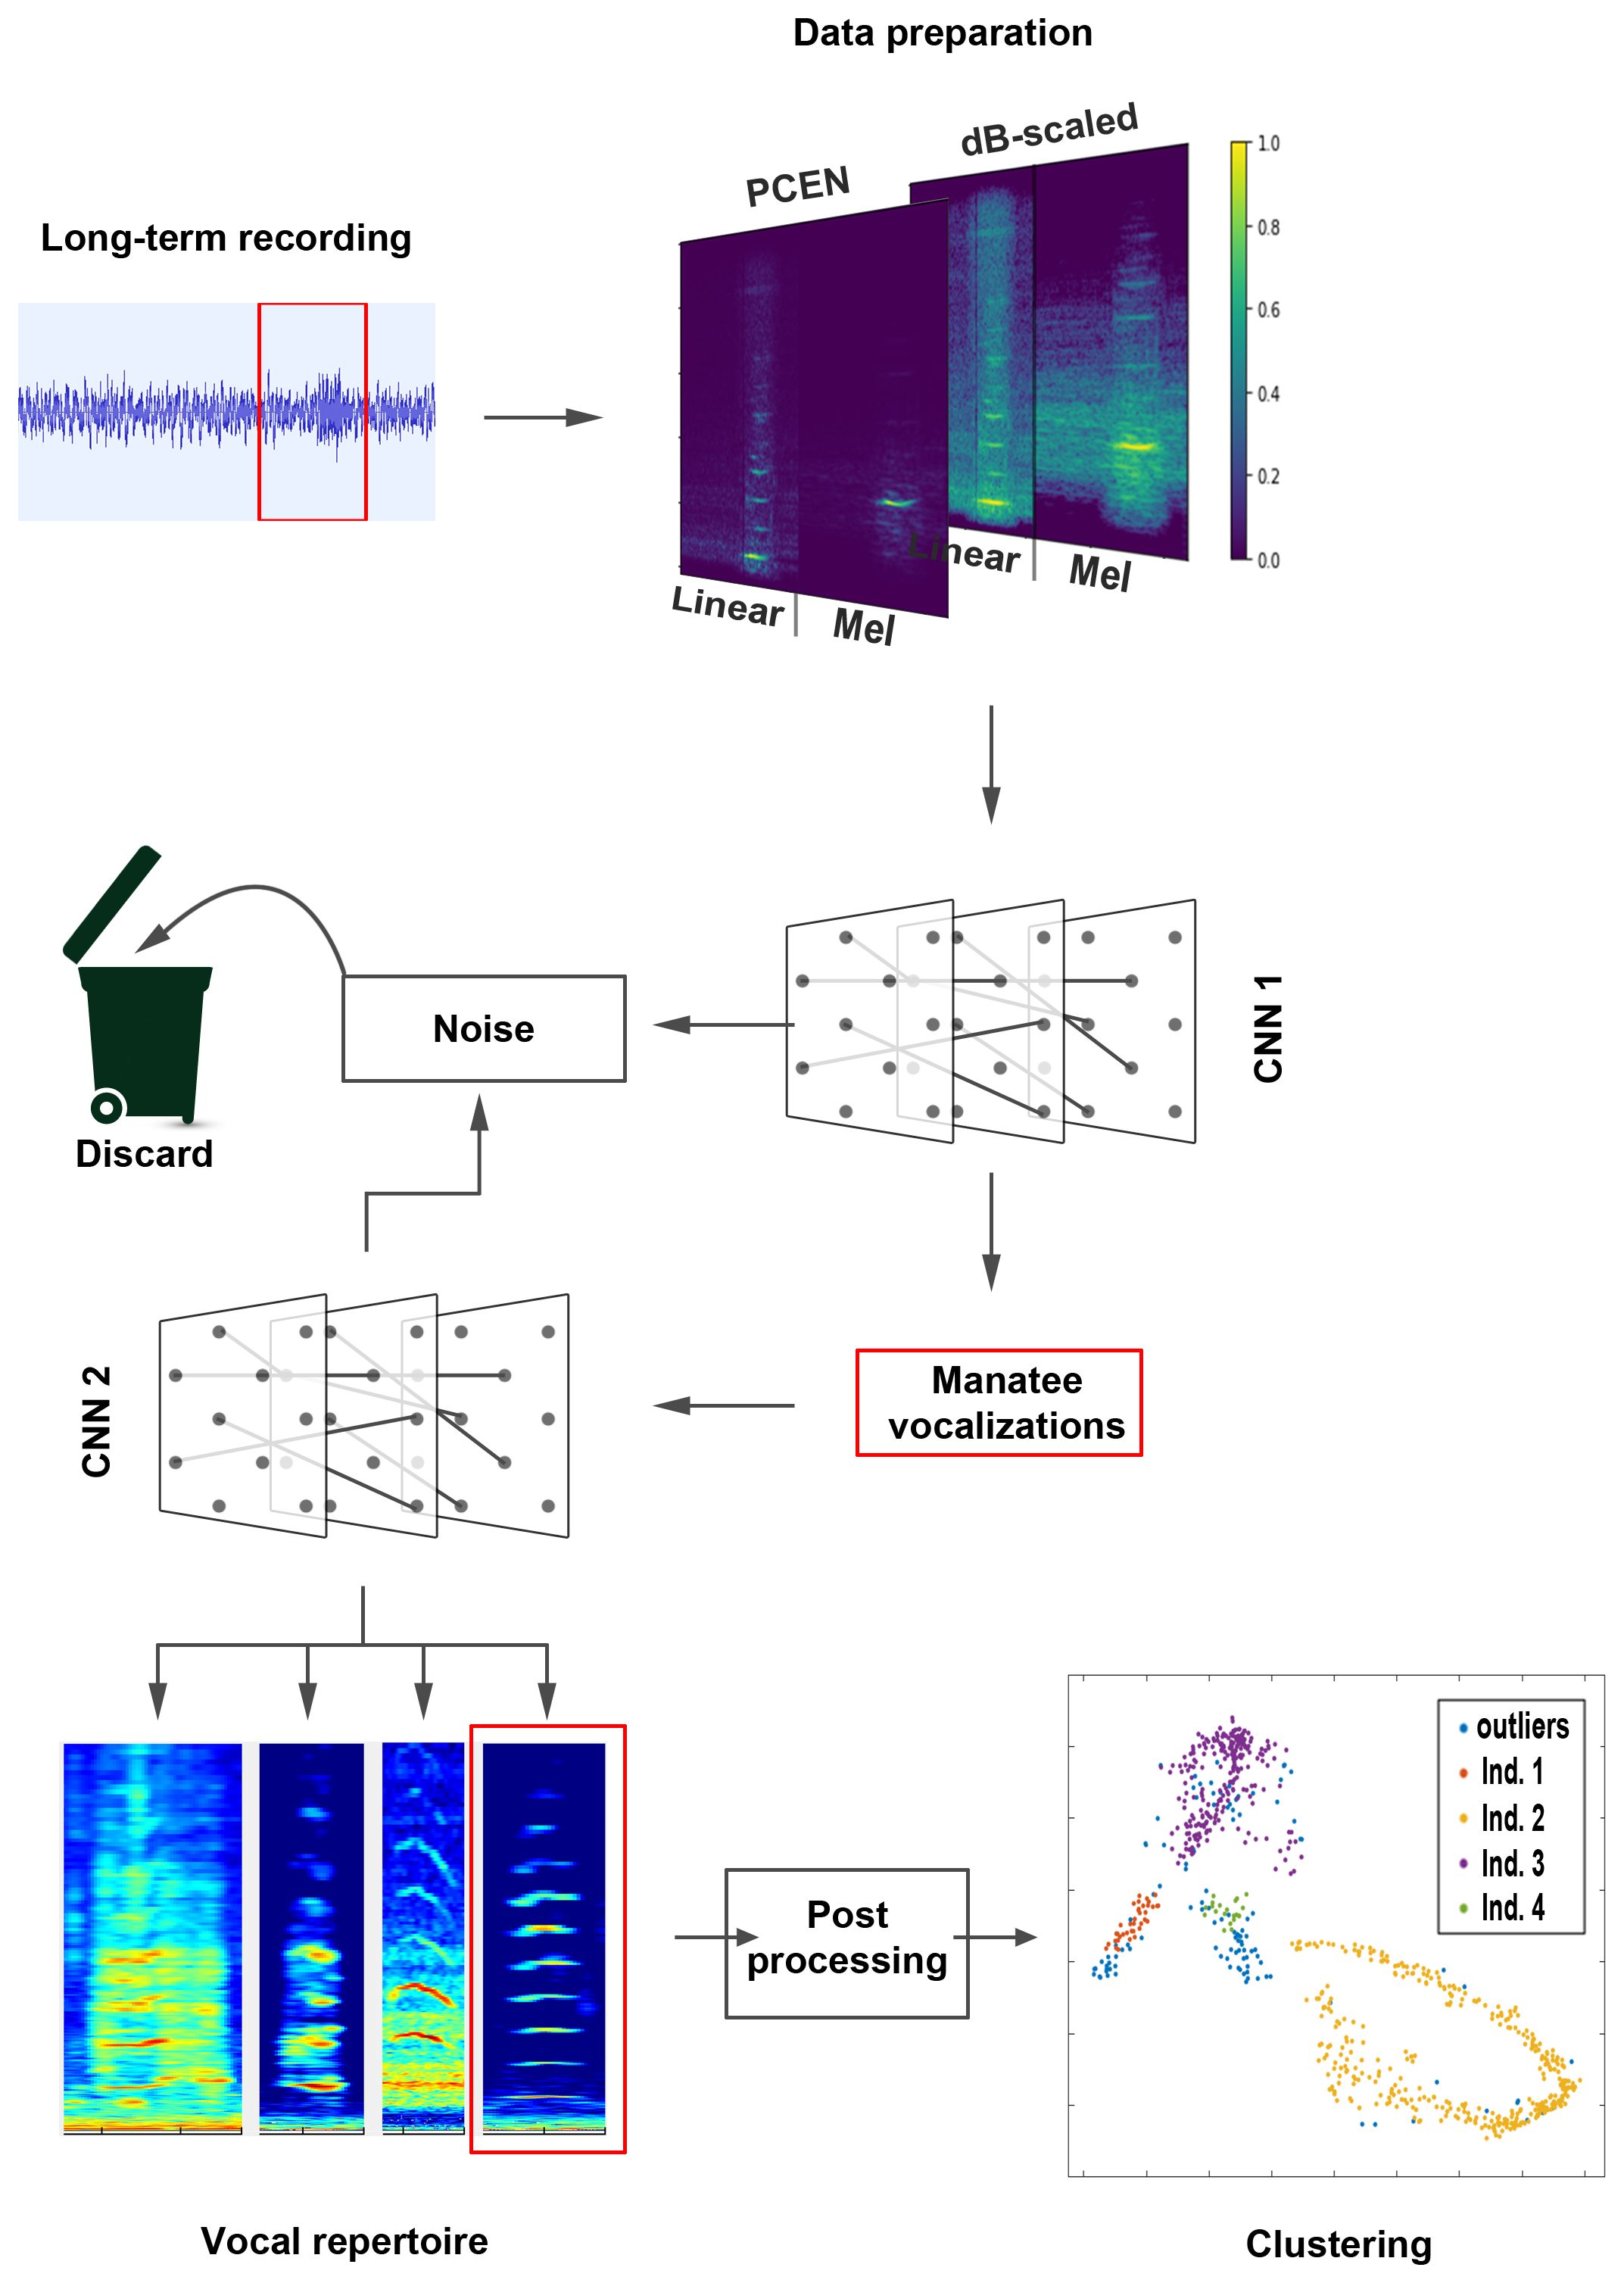
Figure 1 Schematic sequence of the automatic processing. A 0.5 second audio segment from a long-term recording is first prepared for CNN evaluation and converted into an image with two overlapping layers (similar to RGB color layers). This image is evaluated by the first deep learning model (CNN 1) and classified as either manatee vocalization or noise. If a vocalization is detected, a second deep learning model (CNN 2) re-evaluates the audio segment and assigns it to one of the 4 classes of the vocal repertoire (or discards the segment if it is classified as noise in this step). Only the vocalizations assigned to the first category (Squeak) are prepared for clustering in the post-processing stage. The number of clusters determined by the clustering algorithm corresponds to the number of different squeaks and thus to the number of individuals.
Linear Spectrogram: The linear spectrogram is created using the Short-Time Fourier Transform (STFT). The STFT calculates Discrete Fourier Transforms (DFTs) over short, overlapping windows to represent a signal in the time-frequency domain. The window size is set to 512 samples with an overlap of 307 samples (60%). This results in a time resolution of 4.65 ms at a sampling rate of 44.1 kHz and 256 frequency bins of 86Hz each.
Mel Spectrogram: The Mel spectrogram is generated with the same time resolution and the same number of frequency bins as the linear spectrogram. However, the frequency bins are Mel-scaled. This means that the frequency bins are divided according to the Mel scale. The Mel frequency scale is a nonlinear scale. Unlike the linear frequency scale, where each equal frequency interval represents an equal pitch step, the Mel scale is designed to better reflect human perception. The Mel scale is designed to provide a more detailed representation of lower frequencies and a less detailed representation of higher frequencies, reflecting the non-linear sensitivity of human hearing.
PCEN: Per Channel Energy Normalization (PCEN) is a method of spectral normalization often used in audio and speech processing (Stowell, 2022). The idea behind PCEN is to adjust the energy distribution in different frequency bands to better represent the relevant information in the signal. This normalization technique is particularly useful for reducing background noise and emphasizing important acoustic features (Wang et al., 2017).
dB scaled: By using a decibel-scaled display, contrast is increased at lower energy levels and decreased at higher energy levels. The decibel values are then divided by the maximum decibel value in the spectrogram. This normalization makes it possible to display all spectrograms on a comparable scale.
In this way, both the linear and Mel spectrograms are normalized in two different ways. The linear and Mel spectrograms of an audio segment with the same normalization (PCEN or dB-scaled) are concatenated on the time axis and merged into one image. This so-called multi-frame encoding has proven to be advantageous when referring to multiple images and has been used to classify marine mammal species (Ji et al., 2013; Karpathy et al., 2014; Hahn-Klimroth et al., 2021). The resulting two spectrogram representations are linked on a third dimensional axis to create a multichannel input (Figure 1). This multichannel input (which is processed like the color channels in an RGB image) is used for training and prediction of the deep learning process. The use of multichannel spectrograms as input has been shown to be effective in classifying marine mammal species (Thomas et al., 2020).
2.2.2 Classification
We used previously trained CNN models trained on manatee calls from two zoos (Nuremberg and Arnhem) and extended the models using transfer learning and vocalizations from additional zoos (Nuremberg, Duisburg and Wroclaw) to improve the models. The deep learning models were trained to classify the audio segments in two steps. Since the amount of training data per class and the number of classes affect the accuracy (Shahinfar et al., 2020), the first step should only distinguish between two classes to increase the chance of recognizing as many manatee calls as possible in a recording and to reduce false-negative noise predictions, where noise is incorrectly predicted to be a vocalization. Accordingly, the first model is binary and distinguishes only between manatee calls and everything that is not a manatee call. For the binary model, a training set of 438 vocalizations was primarily used and retrained using transfer learning with a new data set of 842 vocalizations. The second model classifies manatee calls into 5 classes: 4 call categories and another noise category (Figure 2). The 4 call categories are divided into squeak, high squeak, squeal, and mixed. Squeaks are linear, harmonic calls, high squeaks are similar to squeaks but are slightly frequency modulated and have a hill-shaped contour. Squeaks have limited overtones and less harmonic components. The mixed category includes calls that combine harmonic and less harmonic vocal units in a single call, have a sudden jump in fundamental frequency, or have a highly modulated frequency sequence (Brady et al., 2020) (Figure 2). For this neural network, 474 vocalizations were used for the first training run and 796 for transfer learning. Accordingly, the classification of a long-term recording is done in two steps. In the first step, manatee calls are detected and isolated. In the second step, the isolated calls are classified into the corresponding call categories (Figure 1).
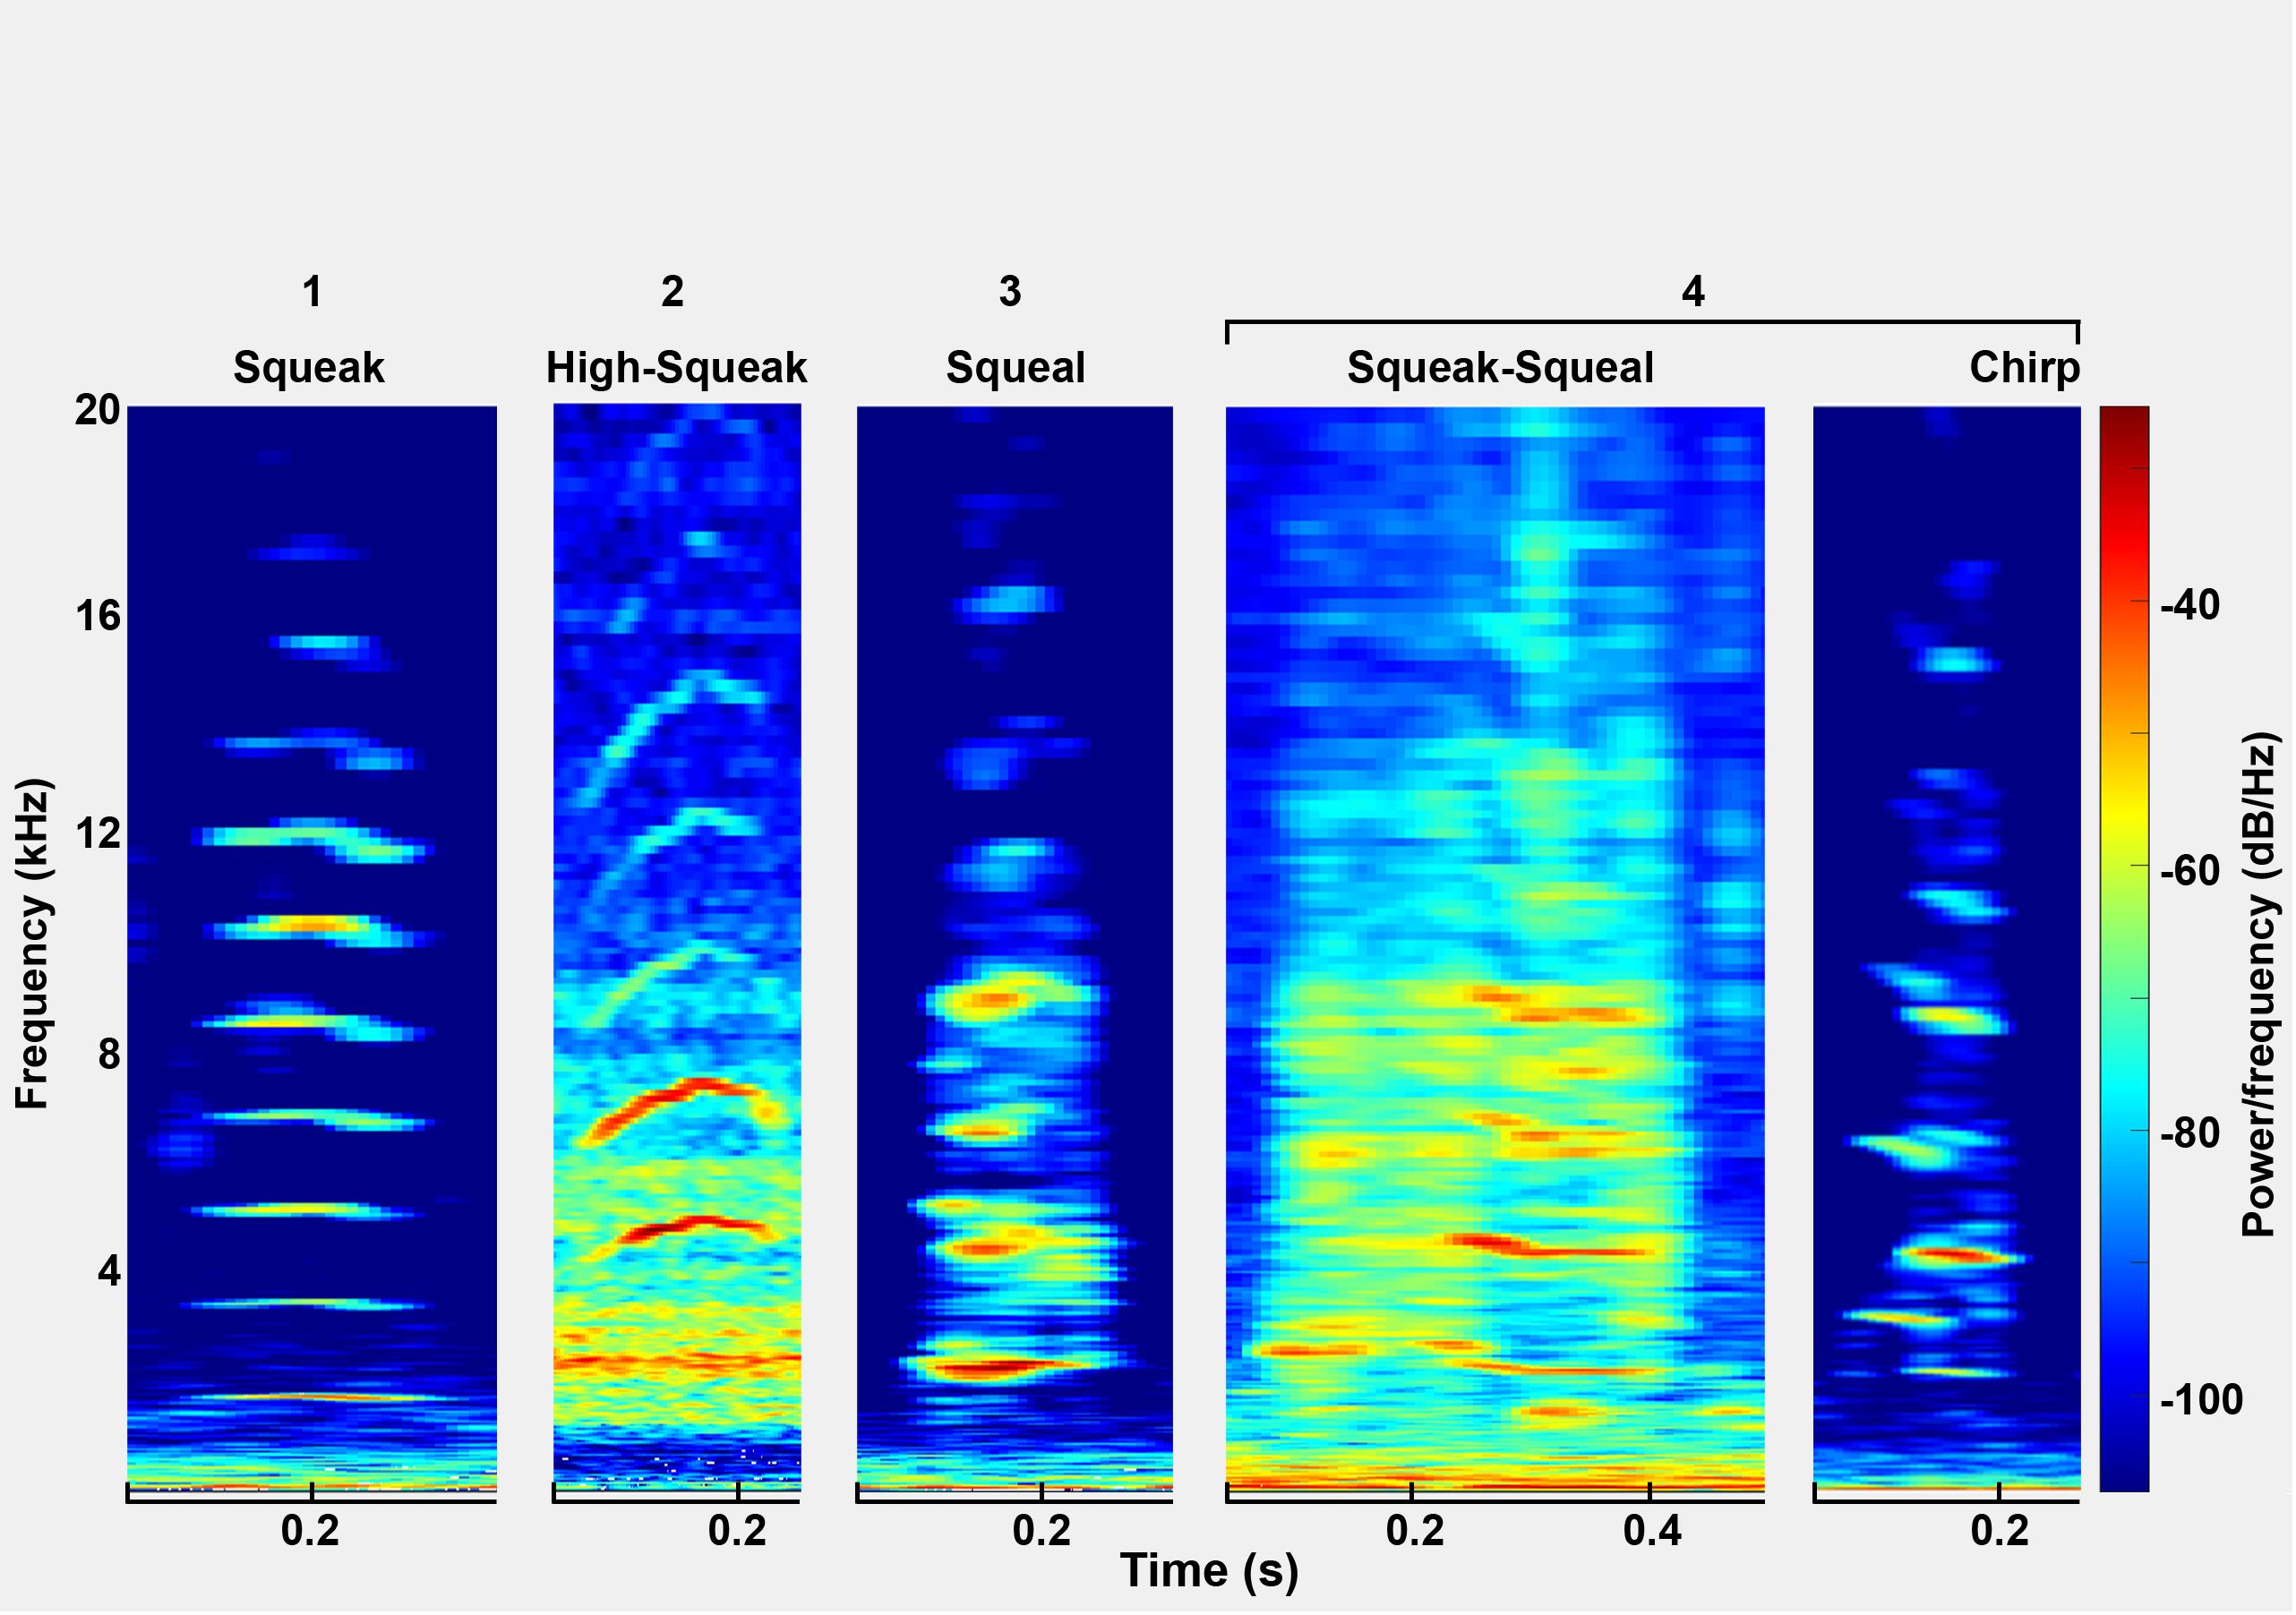
Figure 2 Example vocalizations for the 4 classes shown as spectrograms.
2.3 Post processing
Since only one call type can be used for clustering and population size estimation (to avoid clusters of different call types), only vocalizations that were assigned to the “squeak” class were post-processed. This call type is particularly suitable as it is the most common and has been shown to distinguish individuals (Sousa-Lima et al., 2002; Brady et al., 2022). The audio segments isolated by the CNN have a range of background noise due to the windowing before and after the actual onset and offset of the vocalization. Such large areas of noise would cause difficulties in the automatic extraction of vocal features and lead to inaccurate results. Therefore, the onset and offset of the vocalization are determined in a post-processing step and the audio segment is cropped. This is done using Matlab R2023a (The MathWorks Inc., MA, USA). The harmonic ratio is calculated to determine the onset and offset. The harmonic ratio measures the amount of energy of the tonal signal component in relation to the amount of energy of the total signal, for each defined time window (Kim et al., 2010). A sudden rise in the harmonic ratio indicates the onset of a harmonic vocalization, and a steep drop indicates the offset (Figure 3). To calculate onset and offset, the gradient between adjacent harmonic ratio values is determined. The maximum is selected for onset and the minimum (negative maximum) for offset. Once the onset and offset have been defined, the vocalization is truncated at these points in time. The next step is to determine the signal-to-noise ratio (SNR) for the selected area in order to discard vocalizations with low signal strength. The SNR is calculated by computing the ratio of the signals summed squared magnitude to that of the noise. A sample vocalization with an above-average SNR is used as a reference to determine the threshold. Vocalizations not reaching at least 40% of the reference SNR are discarded. The selected and cropped vocalizations are saved and can be used for feature extraction. The SNR and the total noise power of the non-harmonic components of the signal (noise power) are calculated using the “snr” function in the Signal Processing Toolbox.
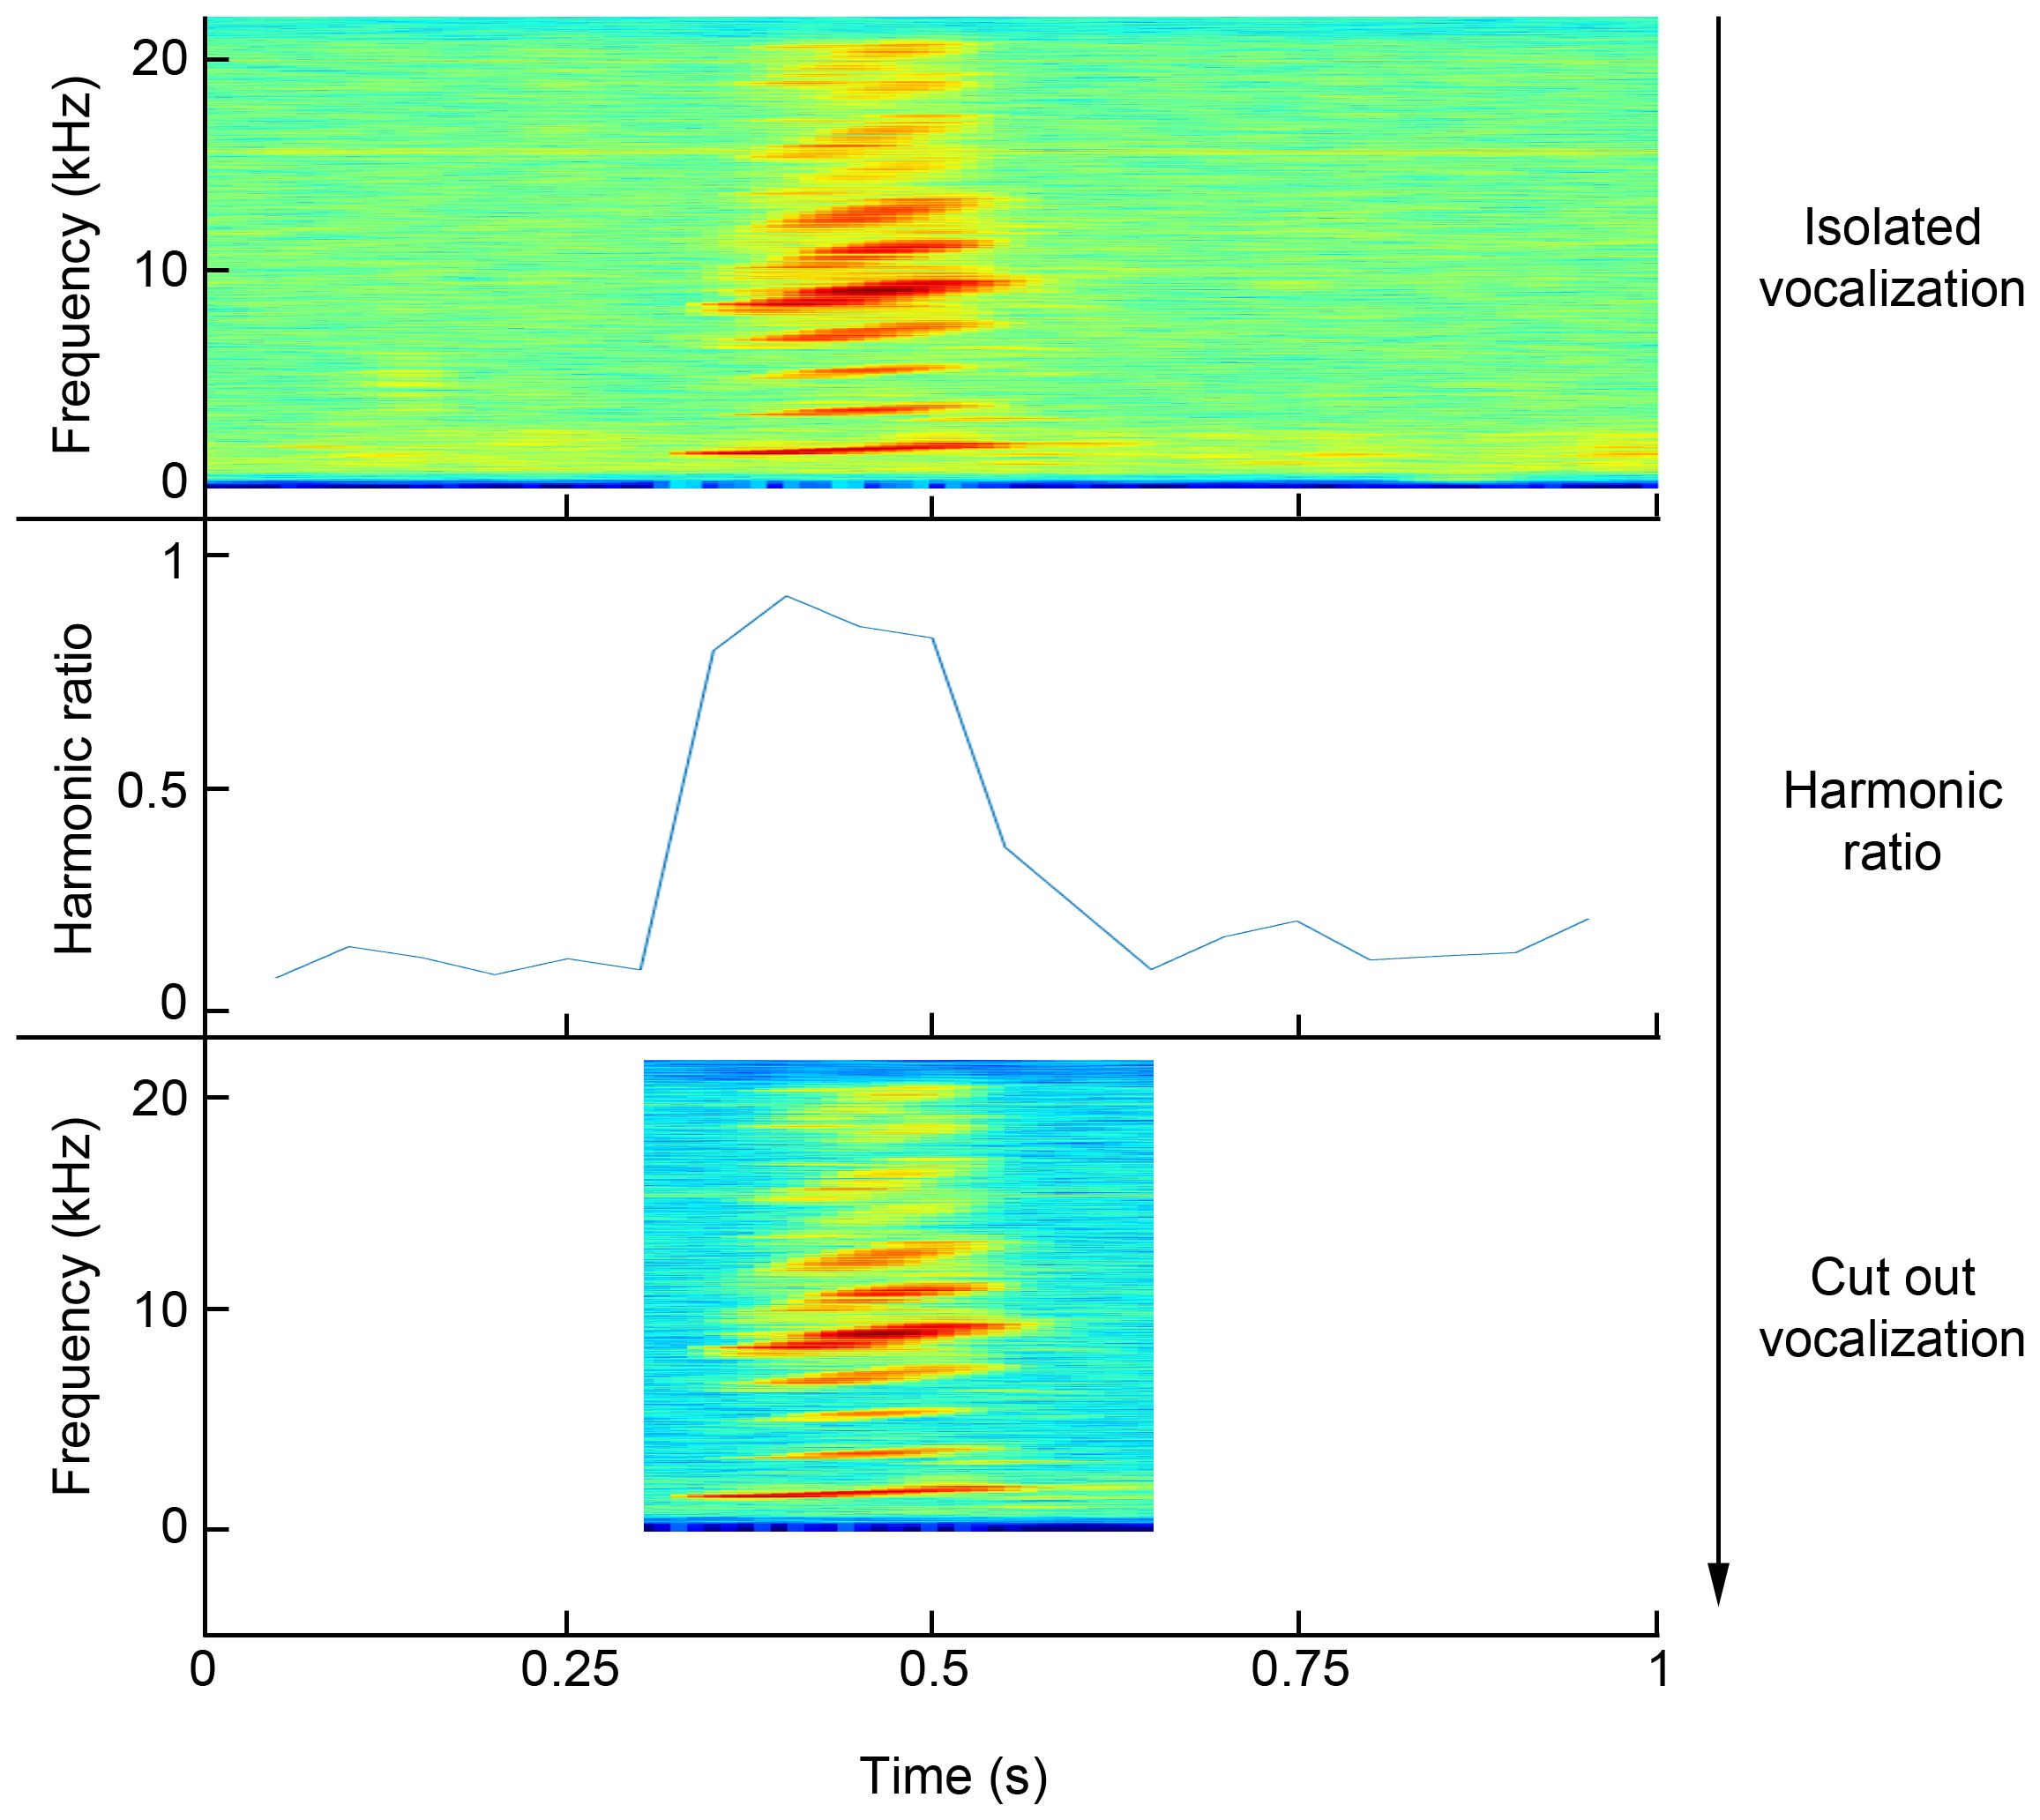
Figure 3 Sequence for clipping a vocalization from an audio segment isolated by the CNN and classified as a squeak. The onset and offset of the vocalization are detected by the sudden rise and fall of the harmonic ratio. This allows the vocalization to be cut out at the appropriate times.
2.4 Feature extraction
Previous studies have shown that features of manatee calls such as fundamental frequency, harmonics and duration are well suited to distinguish individuals (Sousa-Lima et al., 2002, 2008; Dietrich et al., 2022). It was also shown that Mel-Frequency Cepstral Coefficients (MFCCs) provide consistently reliable results in machine learning (Wierucka et al., 2024). Since the automatic cutting of vocalizations does not allow a reliable estimation of the duration of a vocalization, features were extracted that determine the fundamental frequency, the harmonic frequency bands, and the MFCCs. A list of the extracted features is shown in Table 2. The features were extracted using Matlab R2023a (The MathWorks Inc., MA, USA) and the software CASE (Schneider et al., 2022). For extraction, some of the methods used in the software CASE were improved. The fundamental frequency (F0) was determined using 6 different methods. The methods for estimating the fundamental frequency are: Normalized Correlation Function (Atal, 1972), Pitch Estimation Filter (Gonzalez and Brookes, 2014), Cepstrum Pitch Determination (Noll, 1967), Log-Harmonic Summation (Hermes, 1988), Residual Harmonics Summation (Drugman and Alwan, 2019), and a Deep Learning Neural Network Estimation (Kim et al., 2018). Each of these methods determines one value for F0 per time window. The median is then determined for each time window and used as the actual F0 value. The subsequent harmonic frequency bands are determined by calculating the maximum peak within a defined frequency range in the spectrogram. The boundaries of the frequency range are set by:
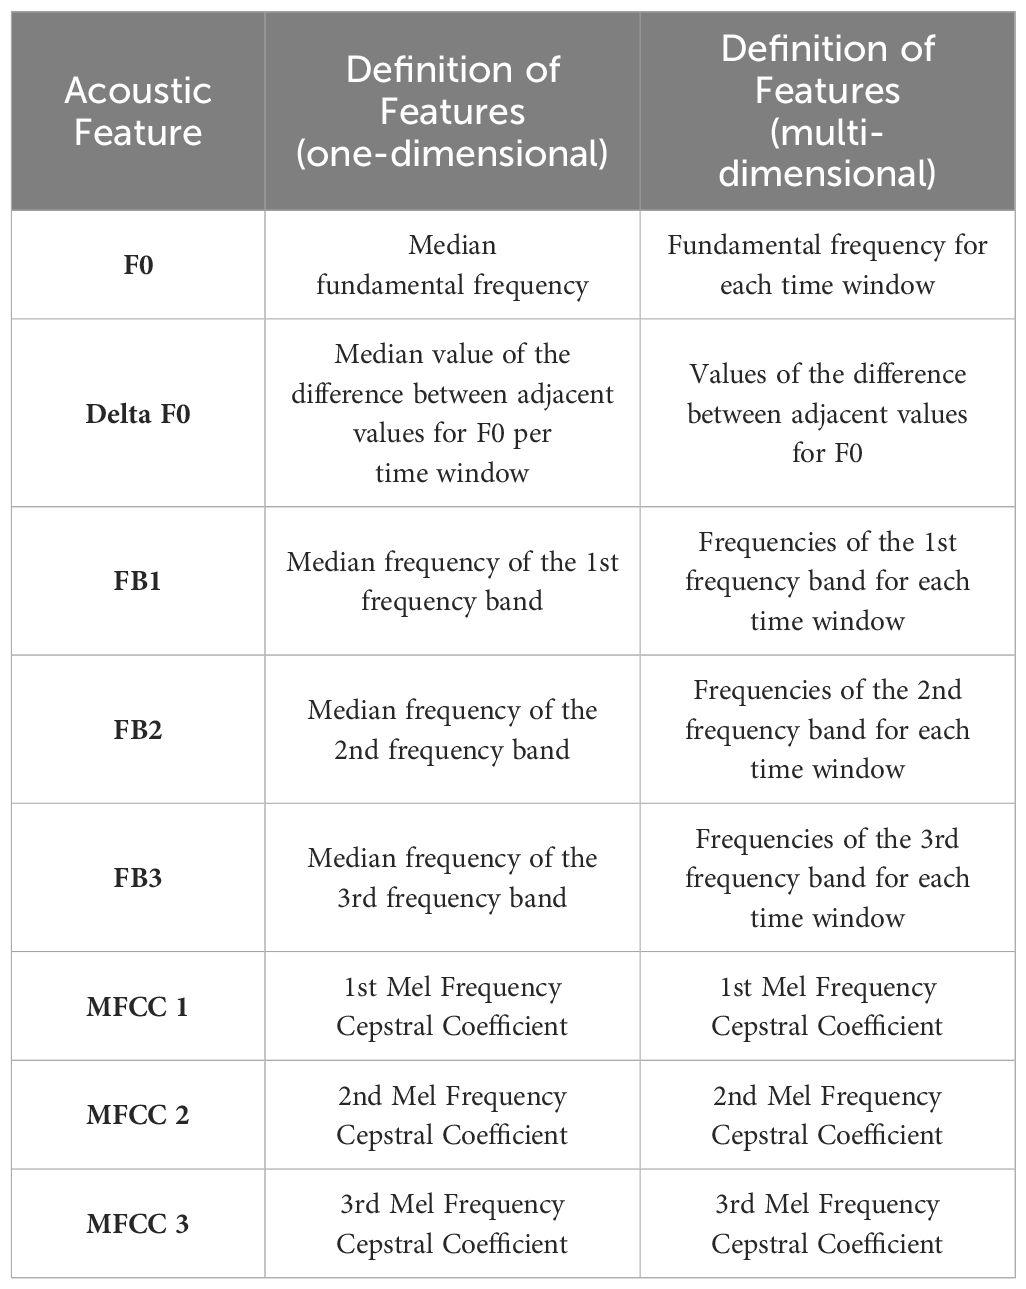
Table 2 List of extracted features.
Where X is the lower limit and Y is the upper limit of the frequency range and i corresponds to the number of the frequency band being searched for (1, 2 or 3). Thus, the frequency with the maximum energy is determined in a range that is half as wide as the value of the fundamental frequency and whose center corresponds to a multiple of the fundamental frequency. Other methods for determining harmonic frequency bands, such as linear predictive coding, are often developed for the human voice, whose fundamental frequency is much lower than that of the manatee, or require information about the vocal tract. The method used here has provided very reliable results and is robust even with noisy signals (Figure 4). The calculation of the Mel-Frequency Cepstral Coefficients is not modified and used as originally implemented in the software CASE.
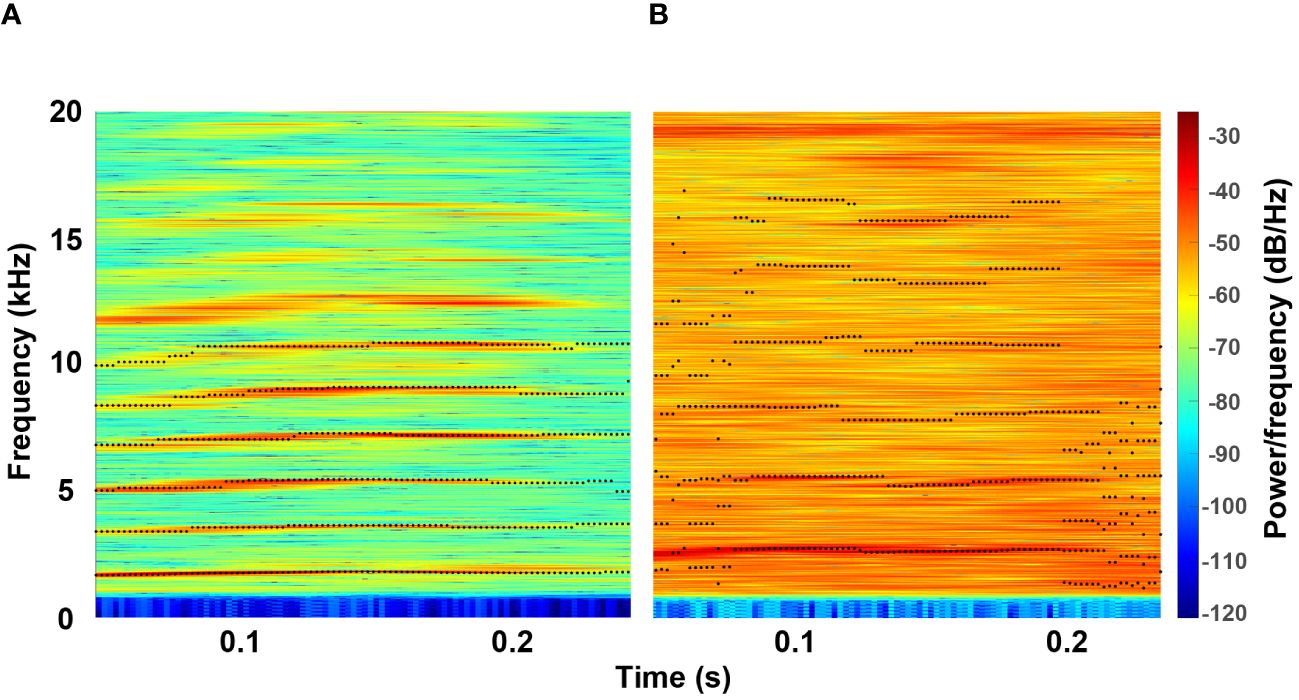
Figure 4 Feature extraction of a vocalization with low noise power (A) and a vocalization with high noise power (B). The black dots mark the frequency value determined for F0 (lowest frequency band) and the subsequent harmonic frequency bands.
Depending on the clustering method used, the features were either windowed in the time domain and compiled as a multidimensional matrix or extracted once for the entire vocalization as a one-dimensional vector. For the windowed variant, the vocalizations were divided into 5 time windows with an overlap of 50% and the corresponding features were extracted for each window.
2.5 Clustering algorithms
Three different clustering methods were used to estimate the number of individuals based on their squeak calls. Again, the software CASE was used. Community Detection (CD), an agglomerative hierarchical clustering method (Peel et al., 2017), was used in combination with either the k-Nearest Neighbor (kNN) (Friedman et al., 1977) or the Dynamic Time Warping (DTW) (Sakoe and Chiba, 1978; Paliwal et al., 1982) classifier to create a similarity matrix as input for CD. As Third clustering method HDBSCAN, a divisive hierarchical clustering method, was used (Campello et al., 2013, 2015). For HDBSCAN, the features were provided as one-dimensional vectors, while the other two methods used windowed features in the form of matrices. For HDBSCAN, both the number of nearest neighbor data points used to compute the core distance and the minimum number of data points required to form a cluster were set to 4. Since a dimensionality reduction can lead to better results for HDBSCAN, a reduction to 4 dimensions was tested using t-SNE (McInnes et al., 2017; Sainburg et al., 2020; Schneider et al., 2022). It was decided to keep the t-SNE dimensionality reduction as it gave better results. For more information on the algorithms, see (Schneider et al., 2022). The noise power determined by the “snr” function was used as a parameter in the subsequent evaluation of the cluster results to quantify the amount of background noise. For example, the amount of background noise generated by pumps can be estimated and may explain poor clustering results caused by feature extraction errors.
3 Results
3.1 CNN verification
To test the reliability of the CNN, 770 vocalizations from three different zoos were evaluated manually and compared with the results of the CNN prediction. The results are shown in Table 3. Overall, the CNN finds over 10% more vocalizations than a trained human and correctly assigns 92.44% of the vocalizations found to the appropriate class of the vocal repertoire. The confusion matrices in Figure 5 show a reliable prediction of the different call types both for the validation of the CNN model and for the evaluation of the long-term recordings (test set). As a result, a well-trained deep learning model can reliably detect and classify manatee calls in long-term recordings.
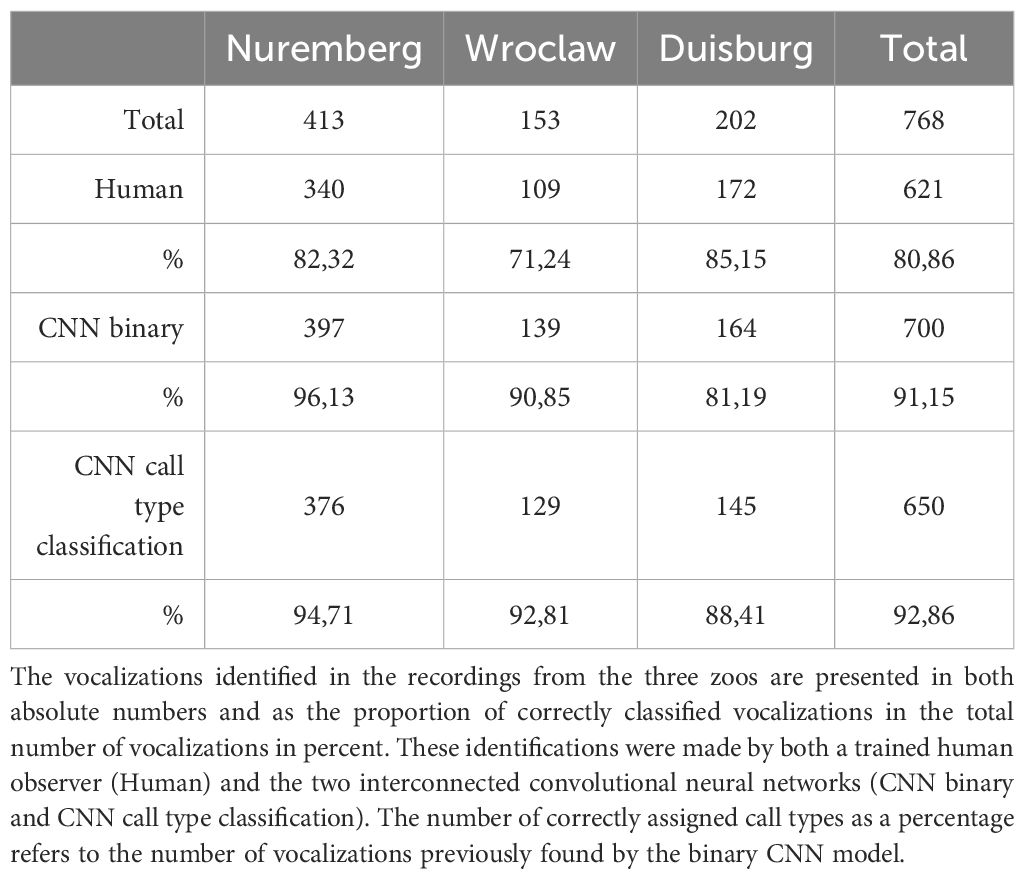
Table 3 Results of the evaluation of long-term recordings.
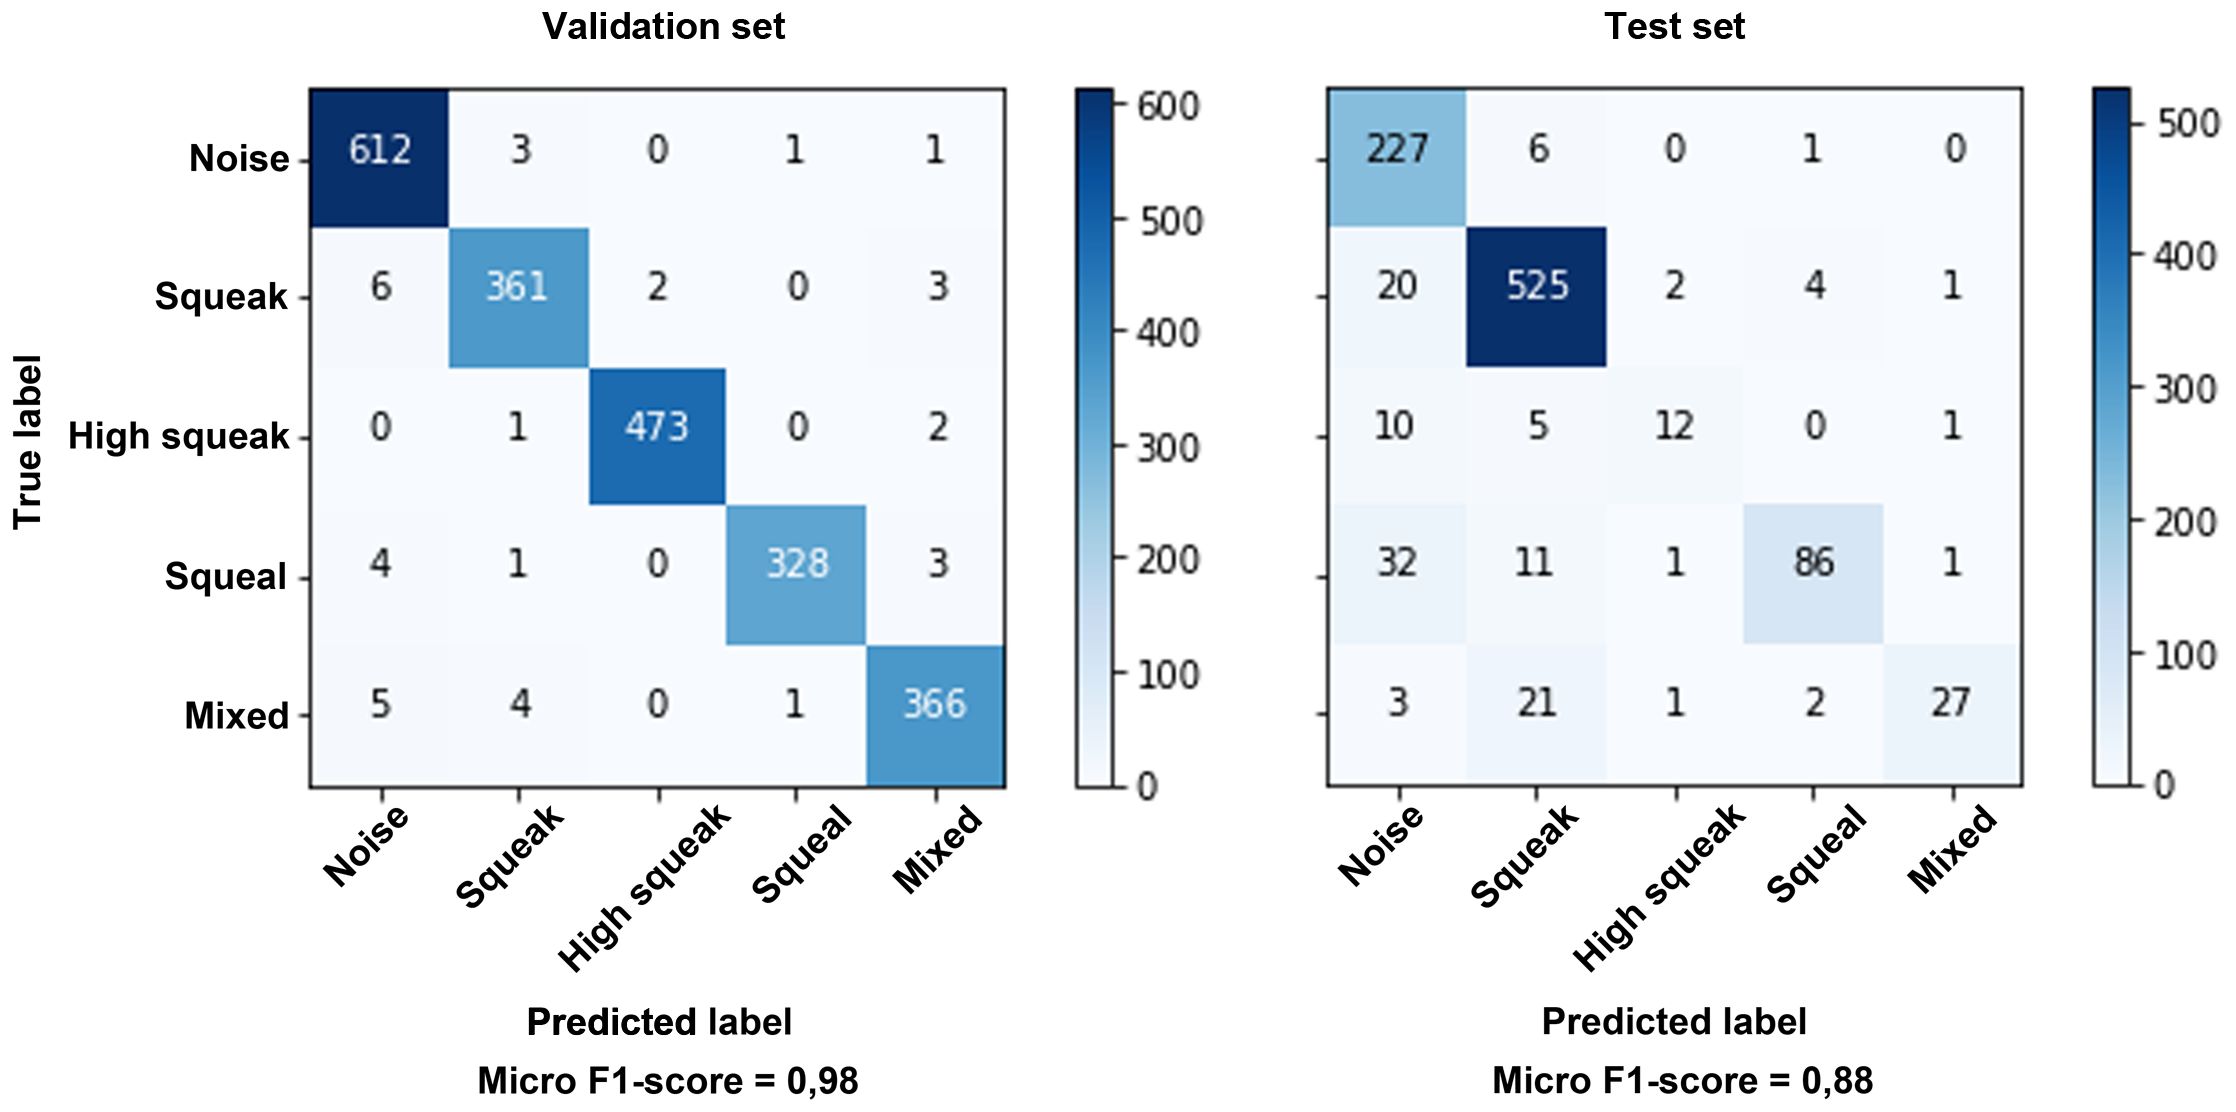
Figure 5 Confusion matrix of the validation data during transfer learning (validation set) and the evaluation of the long-term recordings (test set). The accuracy is given as a micro F1-score, since the classes are not optimally balanced, especially in the long-term recordings.
3.2 Activity phases
It is particularly important to selectively record data in the field, as resources such as storage media and batteries are limited. Knowing when the animals are most vocally active is therefore very valuable for bioacoustic studies and can significantly increase the amount of usable data. For the manatees studied in this study, the CNN identified two main activity phases (Figure 6). An activity phase is initiated when a defined threshold is exceeded and ends when the value remains below the threshold for at least two time intervals. A time interval corresponds to one hour. All detected vocalizations were summed for this hour. To make the values comparable between zoos, they were normalized to 1 and the median of these values (0.3) was used as the threshold value. The identified activity phases are between 3 and 7 a.m. and between 4 p.m. and midnight (Figure 6). Between 8 a.m. and 3 p.m. there is a long phase of low vocal activity.
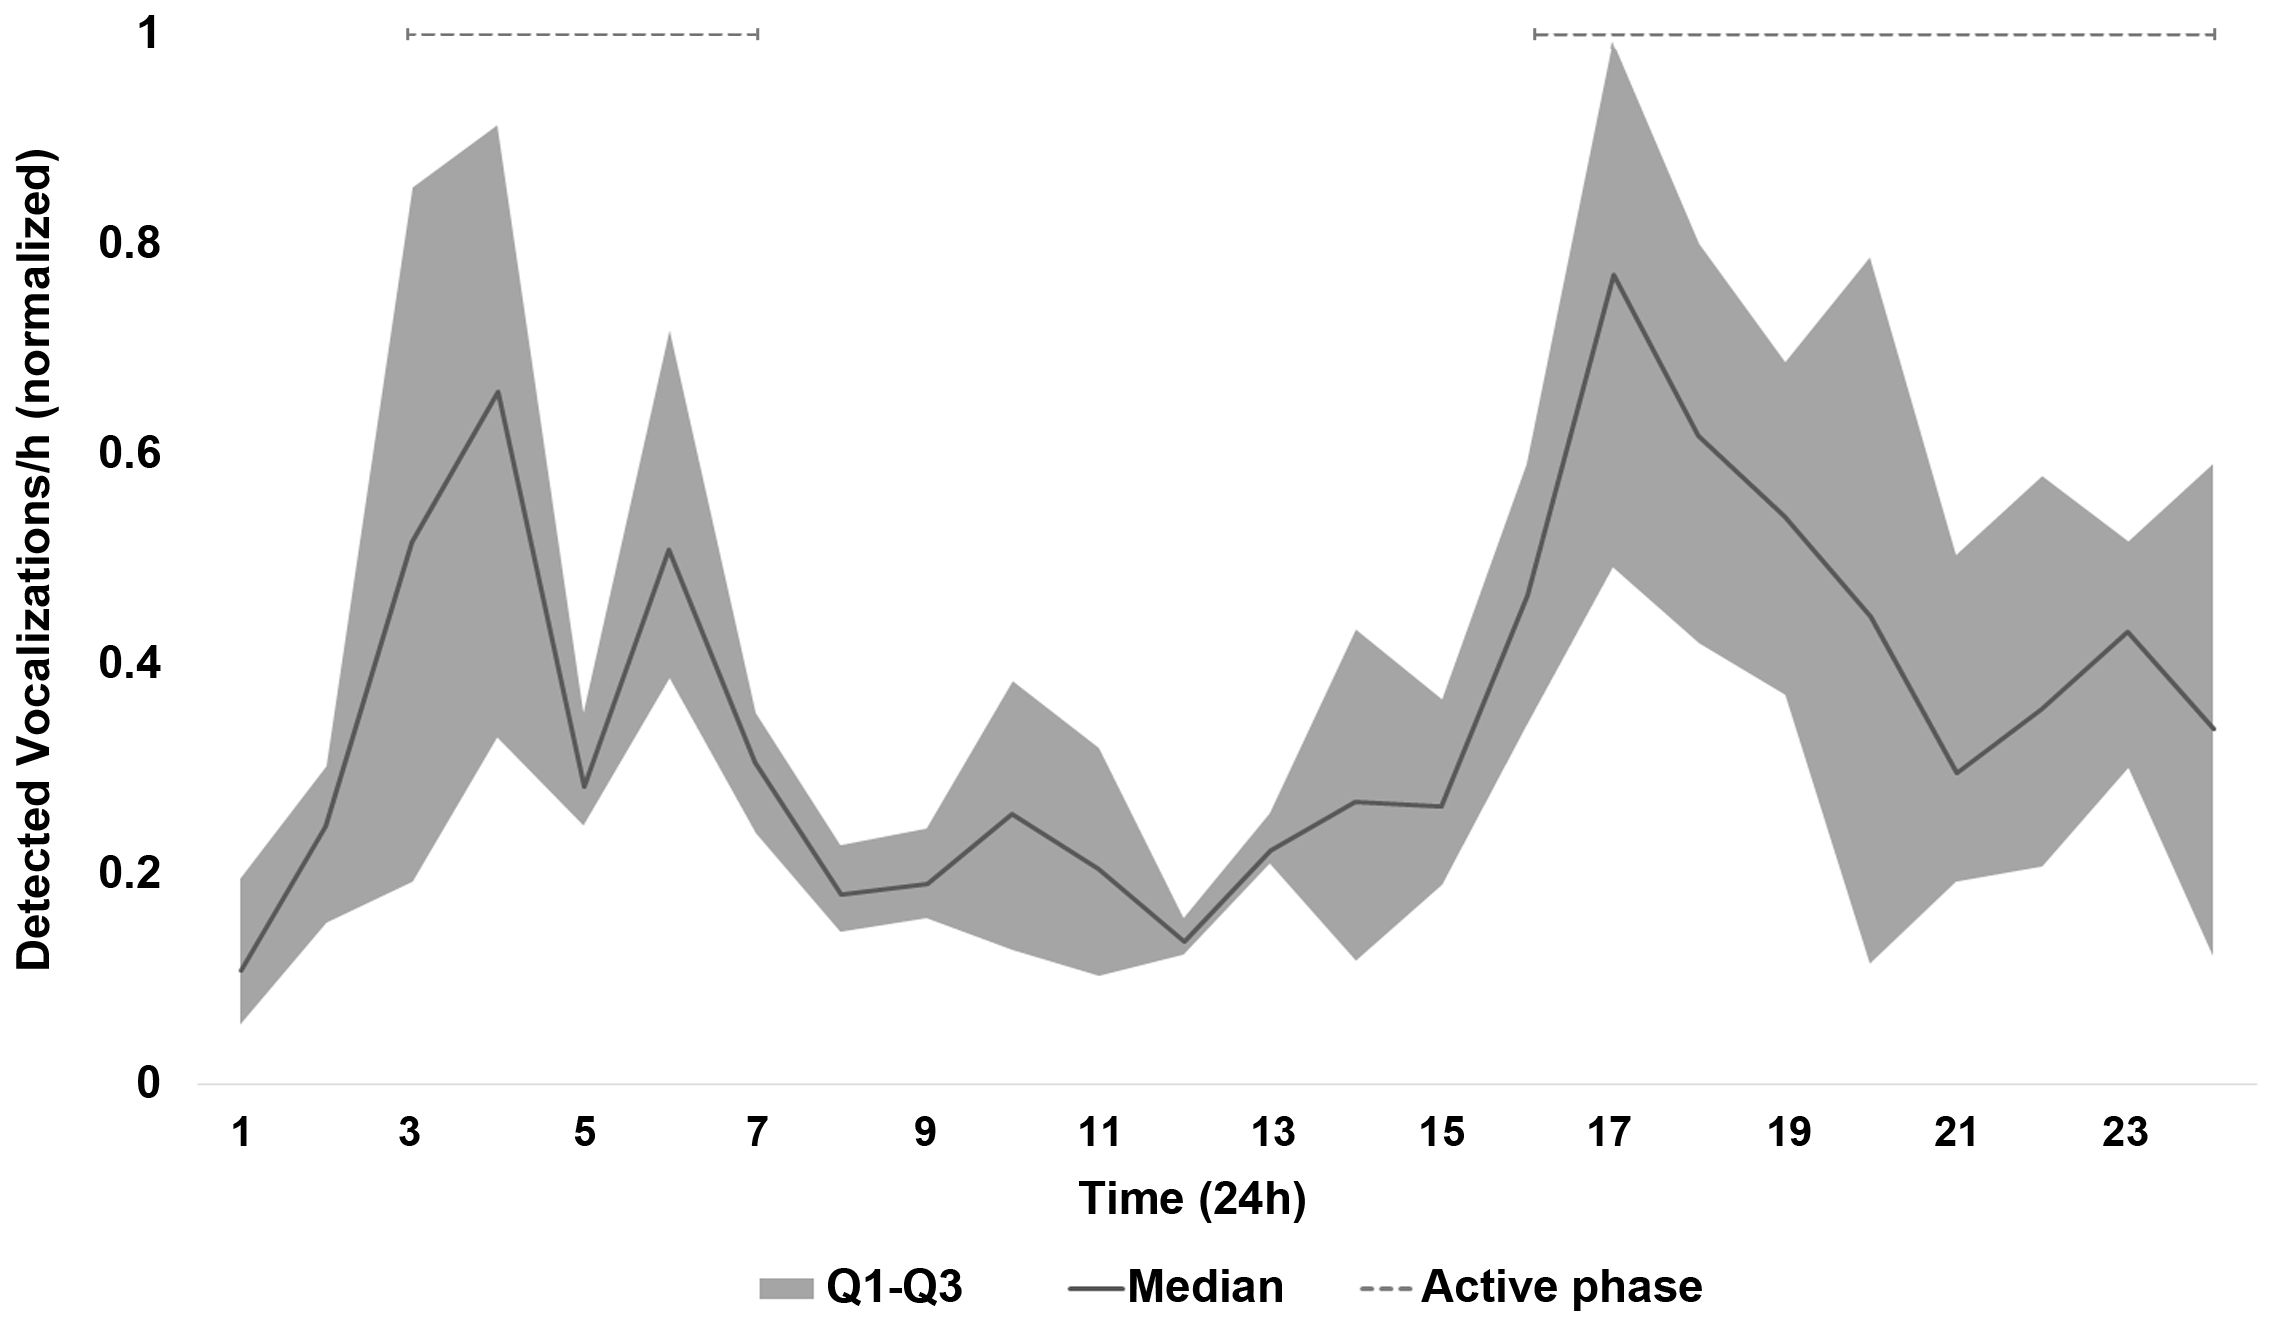
Figure 6 Vocal activity of all recorded manatees over 24 hours. The black line corresponds to the median number of vocalizations detected within an hour. The number of vocalizations per hour was normalized to 1, so that the recording period with the most vocalizations is equal to 1 and the proportion of all others is determined. The area between the first and third quartile is shown in dark grey. The dashed line indicates periods of activity.
3.3 Determine population sizes using clustering methods
To validate that the clustering algorithms were determining the correct number of individuals, audio recordings from 3 different zoos were used. Recordings from Nuremberg Zoo were used from two different time periods, once before and once after a new individual was added to the group. In this way, the evaluation of 4 different group sizes could be tested, as well as the ability of the clustering algorithms to recognize the calls of a new individual. Additionally, the calls were merged in two different constellations to simulate larger groups. Table 4 shows the results of the clustering procedures and the actual group sizes. In addition, the percentage deviation (Δ%) from the actual number of individuals is shown, as well as the median noise power for each zoo. Especially for clustering with CD, the accuracy decreases strongly with increasing noise power. HDBSCAN is much more robust and determines the correct number of clusters for each zoo. When combining the Nuremberg and Wroclaw vocalizations into one dataset, HDBSCAN correctly counts the number of individuals, which CD does not. When the vocalizations from Nuremberg and Wroclaw are combined into one data set, HDBSCAN determines the number of individuals with a small deviation of 11.11 percent, while the CD methods show a considerably larger deviation. Using all vocalizations from all zoos, the number of individuals cannot be accurately determined by any of the methods.
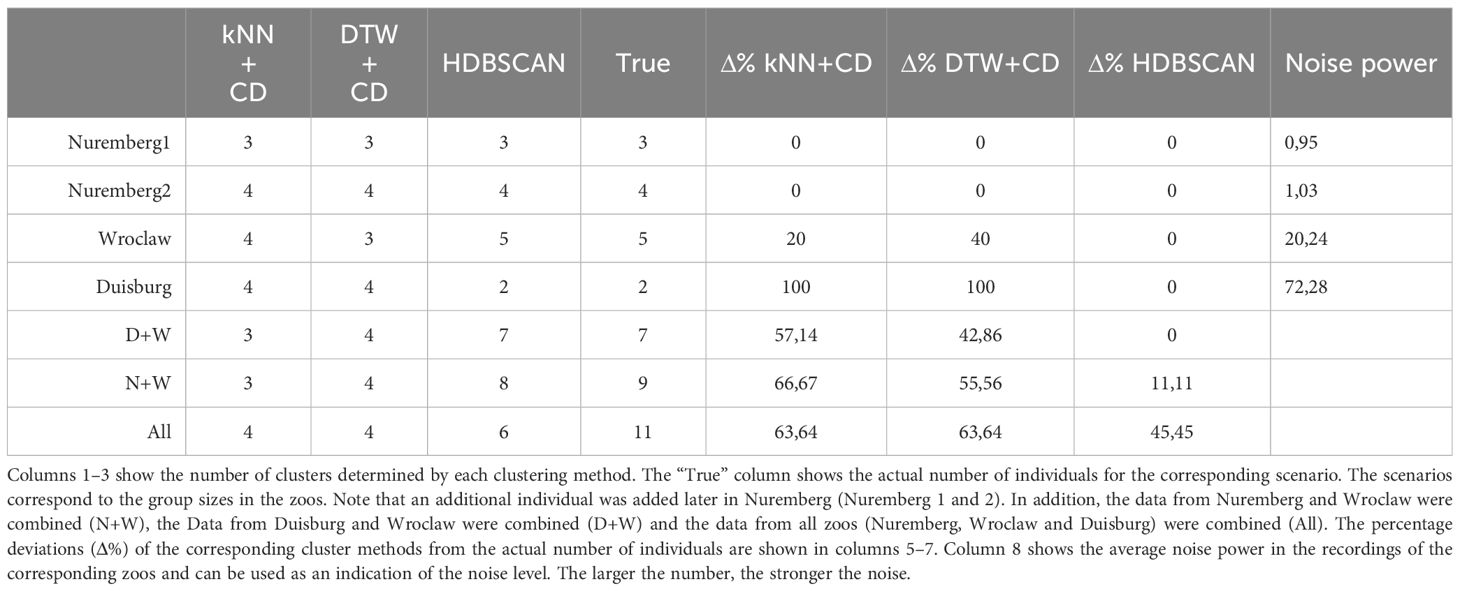
Table 4 Estimated number of individuals by the different clustering methods.
4 Discussion
4.1 Benefits and advantages of the method
The unsupervised clustering method in combination with deep learning used in this paper is independent of human decisions and therefore not susceptible to human bias or errors of concentration (Stowell, 2022; Guerrero et al., 2023). Some of the errors that led to poorer results in the human evaluation of the long-term recordings (Table 3) are probably due to lack of concentration. The vocalizations in the long-term recordings must first be isolated from the recording and then stored by the user. Additional information (e.g. time stamps) must be transferred to a spreadsheet. Each of these steps are subject to errors that do not occur in automated systems. Furthermore, by including low SNR vocalizations and augmentation, the model trained here is robust and also finds vocalizations that are weak and maybe missed by humans. Weak vocalizations with low SNR are not suitable for clustering, but are important when estimating animal activity or when the frequency of certain calls is relevant, such as in mother-calf interactions. Therefore, a large amount of data is required both for the frequency of certain calls and for clustering the population size, which cannot be handled by human evaluation for long-term recordings of several months or years. In our study, HDBSCAN has clearly proven to be the most performant clustering algorithm. By discarding data that are difficult to assign, the method has a clear advantage, especially for automatically selected vocalizations. Although clustering with CD works very well for preselected vocalizations with high SNR and easy to extract features (Schneider et al., 2022), it is at a disadvantage when clustering total sets with an unknown number of individuals. Especially with large amounts of data, discarding insufficient data is an advantage and can lead to better results. After post-processing, the error rate is reduced because only vocalizations with sufficient SNR are used for clustering. This, along with HDBSCAN’s exclusion of outliers, means that a larger amount of data is advantageous, but the results are more reliable.
4.2 Challenges in field research
In the wild, disturbing noises such as motorboats or environmental factors (wind, rain, snapping shrimp) can reduce the SNR and negatively affect the analysis of the audio recordings (Yan et al., 2005). Therefore, it is advisable to choose recording times with minimal noise and within a vocal activity phase of the manatees. The activity phases determined here correspond well with those already described for African manatees (Trichechus senegalensis) (Rycyk et al., 2022). Rycyk et al. (2022) hypothesized that nocturnal activity may be related to reduced disturbance from human activity during the night. The fact that this pattern of activity is also found in three different zoos may suggest that vocal activity is generally more nocturnal. However, human disturbance in zoos also occurs primarily during the day.
For passive acoustic monitoring in the field, the accuracy of the results also depends on how often and whether all individuals vocalize close enough to the recording device to capture a reliable signal of the call. Although the deep learning model trained here reliably detects even weak vocalizations with low SNR, such calls can rarely be used to cluster the population size. Consequently, a longer recording time increases the chance of recognizing useful calls. Accordingly, the quality of the results increases as the amount of data increases. However, large numbers of recordings can only be analyzed using automated procedures. The method presented here provides reliable results and is also able to classify the different calls of manatees. This allows not only to monitor activity, but also to provide information about possible offspring, specific behaviors, or arousal states. In their study, Brady et al. (2022) associated certain calls with increased stress or arousal. By distinguishing such calls and recording their frequency, the CNN can infer some welfare aspects of the group and monitor affiliative and agonistic behavior within the group.
4.3 Limitations
When developing the CNN, an attempt was made to take into account as many potential challenges as possible and to find an adequate solution for them. Despite augmentation, the results show that signals with very high noise power can affect the accuracy of the CNN (Table 4). In the audio data recorded here, this is primarily noise from the pumps in the basin, which partially mask frequencies of the manatee calls. Accordingly, less accurate results can be expected from recordings with high background noise.
Discarding outliers has the advantage of improving the clustering result, but requires a sufficient amount of data. The fact that the number of individuals could not be sufficiently determined when adding the data from Duisburg to the other datasets (Table 4, column “All”) is probably due to the lower number of usable data compared to the other individuals. For comparison, in Nuremberg 13.33% of the vocalizations were discarded as outliers, while in Duisburg 93.1% were discarded. Furthermore, discarding outliers is not common in other clustering algorithms, making it impractical to compare the results of different clustering methods to increase the reliability of the results. One approach would be to use other outlier detection methods upstream of the classifiers (kNN or DTW), which may improve the results. Nowak-Brzezińska and Gaibei (2022) also show that clustering results can be improved by discarding outliers using LOF (Local Outlier Factor) and COF (Connectivity-based Outlier Factor) algorithms. This would allow multiple clustering methods to be applied to the same data sets to confirm or question the reliability of the results. Furthermore, the cluster results should be checked manually to be on the safe side by taking random samples from the clusters and adjusting the results if necessary. This manual check is particularly advisable if the data quality is poor.
In the results obtained here, the accuracy of the population size estimate decreases as the number of individuals increases (Table 4). As mentioned above, this may be due to an excessive proportion of outliers and the associated strong imbalance of data points per cluster. However, as the number of individuals increases, the probability that the calls of two individuals are very similar and difficult to distinguish by the clustering algorithm also increases. However, this can only partially explain the poorer clustering results when using all vocalizations from all zoos, as HDBSCAN deviates much less from the actual number of individuals for two zoos taken together (Table 4, D+W and N+W).
4.4 Conclusion
The results of this study demonstrate that the developed deep learning method effectively detects and accurately categorizes manatee vocalizations in extended recordings. The use of this automated classification, along with subsequent post-processing techniques that select signature calls based on their signal-to-noise ratio (SNR), offers potential avenues for estimating population size. In particular, the use of clustering methods such as HDBSCAN has shown promise in this regard, providing robust estimates of individual numbers across different test scenarios. Its effectiveness lies in its ability to eliminate outliers, a key advantage over alternative clustering algorithms. Automated analysis enables the evaluation of large datasets collected over long periods of time, increasing the likelihood of detecting all individuals within an area and reliably determining population sizes.
However, it’s important to recognize the limitations, particularly the variety of sound environments encountered in the wild. Variations in ambient noise levels and acoustic conditions can pose challenges to accurate population estimates. In the future, it is imperative to explore the application of this methodology to analyze sound recordings of animals in their natural habitats, such as lagoons, where population sizes are known. By assessing the extent to which HDBSCAN can provide reliable results in these real-world settings, researchers can further refine and validate this approach. In addition, future efforts should focus on using recordings of different call categories to not only monitor animal activity, but also track the presence of offspring and identify instances of arousal states and stress events. This comprehensive understanding will be instrumental in advancing welfare assessment and conservation efforts for manatees and other wildlife species.
Data availability statement
The raw data supporting the conclusions of this article will be made available by the authors, without undue reservation.
Ethics statement
Ethical approval was not required for the studies involving animals in accordance with the local legislation and institutional requirements because only acoustic data were obtained, with no change whatsoever to the animals’ environments or management. The study adhered to the EAZA Code of Ethics and advice on the husbandry of zoo and wildlife species in captivity. Written informed consent was obtained from the owners for the participation of their animals in this study.
Author contributions
SS: Conceptualization, Data curation, Formal analysis, Investigation, Methodology, Software, Validation, Visualization, Writing – original draft. LvF: Conceptualization, Data curation, Investigation, Resources, Writing – original draft. PD: Funding acquisition, Project administration, Resources, Supervision, Writing – review & editing.
Funding
The author(s) declare financial support was received for the research, authorship, and/or publication of this article. This study was supported by the Opel-Zoo Foundation Professorship in Zoo Biology from von Opel Hessische Zoostiftung.
Acknowledgments
We would like to thank the Nuremberg Zoo, Wroclaw Zoo, Duisburg Zoo and Burgers Zoo, Arnhem for their generous cooperation and invaluable support. We are particularly grateful to Lea Schepermann, Ralph Simon, Tim Hüttner, Jana-Marie Schmincke, Arun Idoe and Kerstin Ternes, whose willingness to allow us access to acoustic recordings of the manatees was instrumental in advancing our research efforts and the development of our artificial intelligence systems. Without their cooperation, this work would not have been possible.
Conflict of interest
The authors declare that the research was conducted in the absence of any commercial or financial relationships that could be construed as a potential conflict of interest.
Publisher’s note
All claims expressed in this article are solely those of the authors and do not necessarily represent those of their affiliated organizations, or those of the publisher, the editors and the reviewers. Any product that may be evaluated in this article, or claim that may be made by its manufacturer, is not guaranteed or endorsed by the publisher.
References
Adi K., Johnson M. T., Osiejuk T. S. (2010). Acoustic censusing using automatic vocalization classification and identity recognition. J. Acoust. Soc Am. 127, 874–883. doi: 10.1121/1.3273887
Atal B. S. (1972). Automatic speaker recognition based on pitch contours. J. Acoust. Soc Am. 52, 1687–1697. doi: 10.1121/1.1913303
Bengtson J. L., Fitzgerald S. M. (1985). Potential role of vocalizations in west Indian manatees. J. Mamm. 66, 816–819. doi: 10.2307/1380821
Brady B., Hedwig D., Trygonis V., Gerstein E. (2020). Classification of florida manatee (Trichechus manatus latirostris) vocalizations. J. Acoust. Soc Am. 147, 1597–1606. doi: 10.1121/10.0000849
Brady B., Moore J., Love K. (2022). Behavior related vocalizations of the Florida manatee (Trichechus manatus latirostris). Mar. Mammal Sci. 38, 975–989. doi: 10.1111/mms.12904
Brady B., Sarbacker C., Lasala J. A., Maust-Mohl M., Collom K. A., Searle L., et al. (2023). Manatees display diel trends in acoustic activity at two microhabitats in Belize. PloS One 18, e0294600. doi: 10.1371/journal.pone.0294600
Campello R. J. G. B., Moulavi D., Sander J. (2013). “Density-based clustering based on hierarchical density estimates,” in Advances in knowledge discovery and data mining. Eds. Pei J., Tseng V. S., Cao L., Xu G., Motoda H. (Springer Berlin Heidelberg, Berlin, Heidelberg), 160–172.
Campello R. J. G. B., Moulavi D., Zimek A., Sander J. (2015). Hierarchical density estimates for data clustering, visualization, and outlier detection. ACM Trans. Knowl. Discovery Data 10, 1–51. doi: 10.1145/2733381
Castro J. M., Rivera M., Camacho A. (2016). Automatic manatee count using passive acoustics. 169th Meeting Acoustical Soc. America 23 (1), 10001. doi: 10.1121/2.0000148
Dietrich A., Fersen L.v., Hammerschmidt K. (2022). Signature Calls in west Indian manatee (Trichechus manatus manatus)? Aquat. Mamm. 48, 349–354. doi: 10.1578/AM.48.4.2022.349
Drugman T., Alwan A. (2019). Joint robust voicing detection and pitch estimation based on residual harmonics. arXiv 1973–1976. doi: 10.48550/arXiv.2001.00459
Erbe C., Thomas J. A. (Eds.) (2022). Exploring animal behavior through sound: Volume 1: Methods (Cham: Richard Lounsbery Foundation). doi: 10.1007/978-3-030-97540-1
Factheu C., Rycyk A. M., Kekeunou S., Keith-Diagne L. W., Ramos E. A., Kikuchi M., et al. (2023). Acoustic methods improve the detection of the endangered African manatee. Front. Mar. Sci. 9. doi: 10.3389/fmars.2022.1032464
Friedman J. H., Bentley J. L., Finkel R. A. (1977). An algorithm for finding best matches in logarithmic expected time. ACM Trans. Math. Software 3, 209–226. doi: 10.1145/355744.355745
Gerrodette T., Taylor B. L., Swift R., Rankin S., Jaramillo-Legorreta A. M., Rojas-Bracho L. (2011). A combined visual and acoustic estimate of 2008 abundance, and change in abundance since 1997, for the vaquita, Phocoena sinus. Mar. Mammal Sci. 27, E79–E100. doi: 10.1111/j.1748-7692.2010.00438.x
Gonzalez S., Brookes M. (2014). PEFAC - A pitch estimation algorithm robust to high levels of noise. IEEE/ACM Trans. Audio Speech Lang. Process. 22, 518–530. doi: 10.1109/TASLP.2013.2295918
Guerrero M. J., Bedoya C. L., López J. D., Daza J. M., Isaza C. (2023). Acoustic animal identification using unsupervised learning. Methods Ecol. Evol. 14, 1500–1514. doi: 10.1111/2041-210X.14103
Hahn-Klimroth M., Kapetanopoulos T., Gübert J., Dierkes P. W. (2021). Deep learning-based pose estimation for african ungulates in zoos. Ecol. Evol. 11, 6015–6032. doi: 10.1002/ece3.7367
Hartman D. S. (1979). Ecology and behavior of the manatee (Trichechus manatus) in Florida (Pittsburgh: American Society of Mammalogists). doi: 10.5962/bhl.title.39474
Hermes D. J. (1988). Measurement of pitch by subharmonic summation. J. Acoust. Soc Am. 83, 257–264. doi: 10.1121/1.396427
Jacobson E. K., Forney K. A., Barlow J. (2017). Using paired visual and passive acoustic surveys to estimate passive acoustic detection parameters for harbor porpoise abundance estimates. J. Acoust. Soc Am. 141, 219–230. doi: 10.1121/1.4973415
Ji S., Yang M., Yu K. (2013). 3D convolutional neural networks for human action recognition. IEEE Trans. Pattern Anal. Mach. Intell. 35, 221–231. doi: 10.1109/TPAMI.2012.59
Karpathy A., Toderici G., Shetty S., Leung T., Sukthankar R., Fei-Fei L. (2014). “Large-scale video classification with convolutional neural networks,” in 2014 IEEE Conference on Computer Vision and Pattern Recognition. (Columbus, OH, USA: IEEE), 1725–1732.
Kershenbaum A., Sayigh L. S., Janik V. M. (2013). The encoding of individual identity in dolphin signature whistles: How much information is needed? PloS One 8, e77671. doi: 10.1371/journal.pone.0077671
Kim H.-G., Moreau N., Sikora T. (2010). MPEG-7 audio and beyond: Audio content indexing and retrieval. (Chichester, West Sussex, England, Hoboken, NJ, USA: J. Wiley).
Kim J. W., Salamon J., Li P., Bello J. P. (2018). “Crepe: a convolutional representation for pitch estimation,” in MPEG-7 audio and beyond: audio content indexing and retrieval. (Hoboken, New Jersey, USA: IEEE), 161–165.
Linhart P., Mahamoud-Issa M., Stowell D., Blumstein D. T. (2022). The potential for acoustic individual identification in mammals. Mamm. Biol. 102, 667–683. doi: 10.1007/s42991-021-00222-2
Marques T. A., Thomas L., Martin S. W., Mellinger D. K., Ward J. A., Moretti D. J., et al. (2013). Estimating animal population density using passive acoustics. Biol. Rev. Camb. Philos. Soc 88, 287–309. doi: 10.1111/brv.12001
McInnes L., Healy J., Astels S. (2017). HDBSCAN: Hierarchical density based clustering. JOSS 2, 205. doi: 10.21105/joss.00205
Merchan F., Echevers G., Poveda H., Sanchez-Galan J. E., Guzman H. M. (2019). Detection and identification of manatee individual vocalizations in Panamanian wetlands using spectrogram clustering. J. Acoust. Soc Am. 146, 1745–1757. doi: 10.1121/1.5126504
Merchan F., Guerra A., Poveda H., Guzmán H. M., Sanchez-Galan J. E. (2020). Bioacoustic classification of antillean manatee vocalization spectrograms using deep convolutional neural networks. Appl. Sci. 10, 3286. doi: 10.3390/app10093286
Noll A. M. (1967). Cepstrum pitch determination. J. Acoust. Soc Am. 41, 293–309. doi: 10.1121/1.1910339
Nowacek D. P., Casper B. M., Wells R. S., Nowacek S. M., Mann D. A. (2003). Intraspecific and geographic variation of west Indian manatee (Trichechus manatus spp.) vocalizations. J. Acoust. Soc Am. 114, 66–69. doi: 10.1121/1.1582862
Nowak-Brzezińska A., Gaibei I. (2022). How the outliers influence the quality of clustering? Entropy (Basel) 24, 917. doi: 10.3390/e24070917
Paliwal K. K., Agarwal A., Sinha S. S. (1982). A modification over Sakoe and Chiba’s dynamic time warping algorithm for isolated word recognition. Signal Process. 4, 329–333. doi: 10.1016/0165-1684(82)90009-3
Peel L., Larremore D. B., Clauset A. (2017). The ground truth about metadata and community detection in networks. Sci. Adv. 3, e1602548. doi: 10.1126/sciadv.1602548
Reyes-Arias J. D., Brady B., Ramos E. A., Henaut Y., Castelblanco-Martínez D. N., Maust-Mohl M., et al. (2023). Vocalizations of wild west Indian manatee vary across subspecies and geographic location. Sci. Rep. 13, 11028. doi: 10.1038/s41598–023-37882–8
Rojas-Bracho L., Jaramillo-Legoretta A. M. (2009). “Vaquita,” in Encyclopedia of Marine Mammals (Burlington, MA; San Diego, CA; New York, NY, United States; London, United Kingdom: Academic Press, Elsevier), 1196–1200. doi: 10.1016/B978-0-12-373553-9.00274-1
Rose P. E., Riley L. M. (2021). Conducting behavioural research in the zoo: A guide to ten important methods, concepts and theories. JZBG 2, 421–444. doi: 10.3390/jzbg2030031
Rycyk A., Bolaji D. A., Factheu C., Kamla Takoukam A. (2022). Using transfer learning with a convolutional neural network to detect African manatee (Trichechus Senegalensis) vocalizations. JASA Express Lett. 2, 121201. doi: 10.1121/10.0016543
Sainburg T., Thielk M., Gentner T. Q. (2020). Finding, visualizing, and quantifying latent structure across diverse animal vocal repertoires. PloS Comput. Biol. 16, e1008228. doi: 10.1371/journal.pcbi.1008228
Sakoe H., Chiba S. (1978). Dynamic programming algorithm optimization for spoken word recognition. IEEE Trans. Acoust. Speech Signal Process. 26, 43–49. doi: 10.1109/TASSP.1978.1163055
Schneider S., Hammerschmidt K., Dierkes P. W. (2022). Introducing the software CASE (Cluster and Analyze Sound Events) by comparing different clustering methods and audio transformation techniques using animal vocalizations. Anim. (Basel) 12. doi: 10.3390/ani12162020
Shahinfar S., Meek P., Falzon G. (2020). “How many images do I need?” Understanding how sample size per class affects deep learning model performance metrics for balanced designs in autonomous wildlife monitoring. Ecol. Inform. 57, 101085. doi: 10.1016/j.ecoinf.2020.101085
Sousa-Lima R. S., Paglia A. P., Da Fonseca G. A. (2002). Signature information and individual recognition in the isolation calls of Amazonian manatees, Trichechus inunguis (Mammalia: Sirenia). Anim. Behav. 63, 301–310. doi: 10.1006/anbe.2001.1873
Sousa-Lima R. S., Paglia A. P., Da Fonseca G. A. B. (2008). Gender, age, and identity in the isolation calls of antillean manatees (Trichechus manatus manatus). Aquat. Mamm. 34, 109–122. doi: 10.1578/AM.34.1.2008.109
Stowell D. (2022). Computational bioacoustics with deep learning: a review and roadmap. PeerJ 10, e13152. doi: 10.7717/peerj.13152
Tan M., Le Q. (2019). EfficientNet: Rethinking model scaling for convolutional neural networks. PMLR 97, 6105–6114. doi: 10.48550/arXiv.1905.11946
Thomas M., Martin B., Kowarski K., Gaudet B., Matwin S. (2020). “Marine mammal species classification using convolutional neural networks and a novel acoustic representation,” in Machine learning and knowledge discovery in databases. Eds. Brefeld U., Fromont E., Hotho A., Knobbe A., Maathuis M., Robardet C. (Springer International Publishing, Cham), 290–305.
Wadewitz P., Hammerschmidt K., Battaglia D., Witt A., Wolf F., Fischer J. (2015). Characterizing vocal repertoires–Hard vs. soft classification approaches. PloS One 10, e0125785. doi: 10.1371/journal.pone.0125785
Wang Y., Getreuer P., Hughes T., Lyon R. F., Saurous R. A. (2017). “Trainable frontend for robust and far-field keyword spotting,” in 2017 IEEE International Conference on Acoustics, Speech and Signal Processing (ICASSP). (New Orleans, LA, USA: IEEE), 5670–5674.
Wierucka K., Murphy D., Watson S. K., Falk N., Fichtel C., León J., et al. (2024). Same data, different results? Evaluating machine learning approaches for individual identification in animal vocalisations. bioRxiv [Preprint]. doi: 10.1101/2024.04.14.589403
Xie J., Zhu M., Hu K., Zhang J., Hines H., Guo Y. (2022). Frog calling activity detection using lightweight CNN with multi-view spectrogram: A case study on Kroombit tinker frog. MLWA 7, 100202. doi: 10.1016/j.mlwa.2021.100202
Keywords: manatee, bioacoustics, deep-learning, artificial intelligence (AI), population estimation, clustering methods, animal communication, passive acoustic monitoring
Citation: Schneider S, von Fersen L and Dierkes PW (2024) Acoustic estimation of the manatee population and classification of call categories using artificial intelligence. Front. Conserv. Sci. 5:1405243. doi: 10.3389/fcosc.2024.1405243
Received: 22 March 2024; Accepted: 28 May 2024;
Published: 10 June 2024.
Edited by:
Vincent Lostanlen, UMR6004 Laboratoire des Sciences du Numérique à Nantes (LS2N), FranceReviewed by:
Paul Best, Université de Toulon, FranceAndrea Napoli, University of Southampton, United Kingdom
Copyright © 2024 Schneider, von Fersen and Dierkes. This is an open-access article distributed under the terms of the Creative Commons Attribution License (CC BY). The use, distribution or reproduction in other forums is permitted, provided the original author(s) and the copyright owner(s) are credited and that the original publication in this journal is cited, in accordance with accepted academic practice. No use, distribution or reproduction is permitted which does not comply with these terms.
*Correspondence: Sebastian Schneider, c2ViLnNjaG5laWRlckBlbS51bmktZnJhbmtmdXJ0LmRl