 Omar García-Castañeda1,2
 Lorena Viloria-Gómora3,4*
 Véronique Sophie Ávila-Foucat5
 Ernesto Vicente Vega-Peña6Mario A. Pardo7Gino Jafet Quintero-Venegas8
 Jorge Urbán R.3,4Steven Swartz4
 Enrique Martínez-Meyer2,9*
- 1Posgrado en Ciencias de la Sostenibilidad, Universidad Nacional Autónoma de México, Ciudad de México, Mexico
- 2Instituto de Biología, Departamento de Zoología, Universidad Nacional Autónoma de México, Ciudad de México, Mexico
- 3Departamento Académico de Ciencias Marinas y Costeras, Universidad Autónoma de Baja California Sur, La Paz, Baja California Sur, Mexico
- 4Gray Whale Research in Mexico, formerly Laguna San Ignacio Ecosystem Science Program (LSIESP), Washington, DC, United States
- 5Laboratorio Nacional de Resiliencia Costera, Instituto de Investigaciones Económicas, Universidad Nacional Autónoma de México, Ciudad de México, Mexico
- 6Instituto de Investigaciones en Ecosistemas y Sustentabilidad, Universidad Nacional Autónoma de México, Morelia, Michoacán, Mexico
- 7Laboratorio de Macroecología Marina, Consejo Nacional de Humanidades Ciencias y Tecnologías (CONAHCYT) - Centro de Investigación Científica y de Educación Superior de Ensenada (CICESE), Unidad La Paz, La Paz, Baja California Sur, Mexico
- 8Instituto de Investigaciones Sociales, Universidad Nacional Autónoma de México, Ciudad de México, Mexico
- 9Laboratorio Nacional Conahcyt sobre la Biología del Cambio Climático en México, Universidad Nacional Autónoma de México, Mexico City, Mexico
Introduction: Social-ecological systems (SES) recognize the intricate relationship between human activities and the environment and advocate for comprehensive approaches to address complex environmental issues. This study investigates the factors influencing whale watching, particularly the gray whale (Eschrichtius robustus) in northern Mexico, after significant recovery following overexploitation. Despite reaching a peak in 2015, the eastern North Pacific gray whales experienced unusual mortality events (UME), the most recent from 2019 to 2023, leading to a population decline and historically low calf production in 2022. This decline is evident in the reduced presence of whales and calves in winter breeding lagoons. Concurrently, whale watching has become a significant tourist attraction in these areas.
Methods: Our objective was to develop a mental model of the SES of gray whale watching, integrating ecological and socioeconomic data to identify key variables and interactions that support system resilience. From an ecological perspective, we analyzed the long-term temporal trends of eight years of gray whale counts in the southernmost breeding and nursing lagoons within the Bahía Magdalena–Bahía Almejas Complex, Mexico. Additionally, we incorporated the current discussion in the literature about the potential impact of global climate change on gray whale populations. In the socioeconomic subsystem, we used participatory methods, including interviews, surveys, and workshops with government officials, tourism operators, and visitors. We also added on-site assessments of compliance with welfare regulations to understand tourism dynamics.
Results: Our findings identified as main external stressors the changes in ice levels in feeding areas and sea warming in breeding areas, and as internal stressors the compliance with official regulations and the number of vessels observing whales at the same time. The key socioeconomic factor of the system was tourist satisfaction, influenced by factors such as the quality of the information provided by operators.
Discussion: Ultimately, our mental model provides a framework for further exploration of relevant interactions and trajectories, offering insights for developing effective management strategies.
1 Introduction
Social-ecological systems (SES), often referred to as social-ecosystems, emphasize the intricate interplay between social and ecological elements, recognizing the inherent connection between human activities and the natural environment (Mehring et al., 2017). This interconnectedness demands an integrated research and management approach to effectively address complex environmental challenges (Hummel et al., 2017; Mehring et al., 2017). Analyzing environmental issues within an SES framework offers insights into how ecosystem benefits support society amidst changing conditions, facilitating adaptive management strategies against climate change, biodiversity loss, and other environmental challenges (Hummel et al., 2011).
Nature-based tourism systems involve direct and non-linear hidden interactions between socioeconomic and ecological components (Biggs et al., 2012). Understanding these complex relationships and involving humans as an integral part of the ecosystem is crucial for promoting environmental conservation, identifying systemic alterations, and guiding sustainable practices (Schlüter et al., 2012). Studying the interactions between recreational activities and wildlife as social-ecological systems has helped delineate the positive, negative, and neutral effects to achieve a balance between human needs and the protection of natural ecosystems (Miller et al., 2022). Nature tourism, such as whale watching (WW), serves as a prime example of an SES where communities are intricately linked to whales and their habitats, forming cohesive and integrated systems (Reyers et al., 2018; Rodríguez-Izquierdo et al., 2019; Sousa et al., 2023).
SES are characterized by operating across diverse spatial, temporal, and social scales, requiring transdisciplinary approaches for understanding and intervention (Levin, 1998; Levin et al., 2013; Liehr et al., 2017). SES are complex adaptive systems that, when faced with stressors, can undergo regime shifts (Levin et al., 2013). It is, therefore, important to understand the system’s capacity to absorb disturbances and continue functioning (Walker et al., 2004). This type of analysis is possible through the study of specific resilience in SES, which involves identifying the specific boundaries of a system that, if exceeded, could lead to a change in its functioning, thereby affecting its overall dynamics (Carpenter and Gunderson, 2001). When the goal is adaptive capacity, the study of specific resilience helps to understand the behavior of the system under certain stressors and also allows for the development of specific actions to guide that part of the system toward a desirable state (Li et al., 2020). In particular, ‘resilience thinking’ describes the important qualities a system must maintain or enhance to progress towards a more desirable state, typically aiming for a more sustainable social-ecological system while enduring a series of changes to withstand the impacts of stressors (Folke et al., 2010; Walker and Salt, 2006).
Recently, some studies have demonstrated that one of the primary stressors threatening whales and their observation is global climate change (GCC) (Lambert et al., 2010; Schumann et al., 2013; Salvadeo et al., 2015; Sousa et al., 2023). Certain whale populations, which are tourist attractions during their migration or in their breeding and nurturing areas, are directly impacted by global climate change (Lambert et al., 2010; Sousa et al., 2023). These impacts range from distribution and migration patterns shifts to effects on nutritional status, reproductive success, abundance, and population structure (Moore and Huntington, 2008; Schumann et al., 2013). Of particular concern is the population of the eastern North Pacific gray whale (Eschrichtius robustus), known for one of the world’s longest migrations, covering approximately 11,000 kilometers across more than 40 degrees of latitude (Swartz, 1986). This migration exposes the whales to extensive climatic gradients influenced by various environmental phenomena. Gray whales migrate to Baja California Sur, in Mexico, to mate, calve, and rear their young in warmer waters during the winter months, particularly in lagoons such as Laguna Ojo de Liebre (the northernmost breeding area), Laguna San Ignacio, and the Bahía Magdalena–Bahía Almejas Complex (BMAC; the southernmost breeding area) (Swartz, 1986). These areas are crucial for their survival and reproductive success but are vulnerable to the impacts of climate variability and change, such as alterations in sea surface temperature (SST) during warm and cold periods of the El Niño-Southern Oscillation (ENSO) and changes in ice levels in the Arctic (Gardner and Chavez-Rosales, 2000; Urbán et al., 2003a; Salvadeo et al., 2015).
This population has recovered from historical overexploitation and reached its maximum environmental carrying capacity (maximum population size that can be sustained under the area’s climatic conditions for feeding) by the late 1990s, and population levels peaked in 2015 (Eguchi et al., 2023a; Moore et al., 2001). However, due to a significant increase in the number of stranded dead whales, at least two Unusual Mortality Events (UME) were declared for this population, one from 1999 to 2001 attributed to exceeding the carrying capacity of the feeding areas and a second one from 2019 to 2023 (Eguchi et al., 2023a). Population size estimates conducted by NOAA NMFS-SWFSC during the recent Unusual Mortality Event (UME) reveal that the number of eastern North Pacific gray whales had reached a minimum level comparable to that of the 1970s, when whaling effects were more recent and estimates were below 15,000 gray whales. A notable difference in whale population estimates between 2016 (27,000 gray whales, 95% CI: 24,420–29,830) and the 2022-2023 season (14,526 whales, 95% CI: 13,194–15,858) indicates a 46% decline over the past seven years (Eguchi et al., 2023a). The production of calves reflects a more dramatic state; the historically lowest estimate of calf production was in 2022, with 216 calves (SE = 33.4, 95% CI = 1,236.5-1,753.5), whereas in 2016 the estimate was 1,458.3 calves (SE = 132.4, 95% CI = 159-290) (Eguchi et al., 2023b). In seeking an explanation for these changes, a recent study finds a clear relationship between the estimated abundance of the last 50 years of eastern North Pacific gray whales with a historical decline in the biomass of food (crustaceans) and access to feeding areas attributed to oceanographic changes in the Arctic region (Stewart et al., 2023).
Whale watching has experienced a rapid growth worldwide in the last decade, surpassing overall tourism growth (Higham et al., 2014; Hoyt and Parsons, 2014; Orams, 2002). In 2009, the International Fund for Animal Welfare (IFAW) estimated that whale watching income exceeded $2.1 billion USD annually, welcomed 13 million tourists, and generated 13,000 jobs worldwide (O’Connor et al., 2009). This extraordinary growth relies extensively on promoting whale watching as an inherently sustainable activity (Neves, 2010). However, concerns persist regarding the sustainability of whale watching (Markwell, 2015), prompting efforts to minimize negative interactions with whales and vessels while ensuring economic stability (Higham et al., 2009; Hoyt, 2005; Lambert et al., 2010; Orams, 2000). Studies have highlighted that cetaceans react to human presence similarly to natural predators, exhibiting stress responses in the presence of vessels, altering their behavior, and compromising their well-being (Frid and Dill, 2002; Bejder et al., 2006; Nowacek et al., 2001). Vessel collisions with whales pose risks to both whale and human safety, contributing to concerns regarding the sustainability of whale-watching activities, particularly in developing regions like Mexico and other Latin American and Asian countries (Cisneros-Montemayor et al., 2010; Mustika et al., 2013; Rodger et al., 2011).
Understanding the stressors and components that determine the resilience of a Social-Ecological System (SES), such as whale watching, is crucial for effective and sustainable management (Chontasi-Morales et al., 2021; Márquez-González and Sánchez-Crispín, 2007). Direct collaboration with stakeholders, from conceptualization to validation, is essential to ensure the accuracy and acceptance of intervention measures within the SES. However, obtaining direct information from stakeholders can be challenging, necessitating a holistic exploratory perspective that integrates empirical data and mental models to capture relevant causal relationships and enhance understanding of emerging phenomena in SES (Groesser and Schaffernicht, 2012; Radosavljevic et al., 2023; Schlüter et al., 2019). In particular, Lambert et al. (2010) have emphasized the need to study the resilience of whale watching in the context of climate change. Recently, collaborative studies have emerged to describe some components of the SES of whale watching in this context (Meynecke et al., 2017; Richards et al., 2021; Sousa et al., 2023). However, there is an urgent need for research that more balancedly assesses whale watching from both environmental and social viewpoints (Suárez-Rojas et al., 2022).
This work is the first to include in situ data on long-term trends in whale numbers in the region, the behavior of tourist vessels, and transdisciplinary collaborative work not only with the most interested stakeholders, namely the tour operators, but also including tourists, their expectations, and satisfaction. A clear way to represent the elements that determine the resilience of SES is by highlighting their interconnections and qualitative feedback through conceptual models of the system (Meynecke et al., 2017; Richards et al., 2021). This conceptualization is often known as a “dynamic hypothesis” because it is a theory about how the system’s structure and observed temporal behavior appear in key variables (Maani and Cavana, 2007). Recently, the conceptual model has been used to describe the effects of climate change on whale watching (Meynecke et al., 2017; Richards et al., 2021). This work aims to develop a mental model that identifies the elements determining the resilience of the social-ecological system of gray whale watching in the face of climate change. Based on a transdisciplinary approach and the collection of in situ data, we explore possible adaptation strategies to promote the sustainability of whale watching.
2 Materials and methods
This study was conducted within the Bahía Magdalena–Bahía Almejas Complex (BMAC), located in Baja California Sur (BCS), Mexico, designated as an approved site for whale-watching activities in the Official Gazette of the Federation (DOF, 2011). Spanning between 24° 20’ to -25° 44’ N and -111° 27’ to -112° 15’ W, the BMAC is the largest inlet on the west coast of the Baja California peninsula, covering a total area of 1409 km² (Bizzarro, 2008). Whale-watching activities in the area primarily take place in three key locations: 1) Puerto Adolfo López Mateos (PALM); located in the northernmost area, conducts whale-watching activities in the Santo Domingo Channel (SDC), a system of channels covering approximately 300 km² (Bizzarro, 2008); 2) Puerto San Carlos (PSC), dedicated to whale-watching in Bahía Magdalena (BM), is another significant site for these activities (Álvarez-Borrego et al., 1975); and 3) Puerto Chale (PCH), situated in the southernmost region, conducts whale-watching activities within the 414 km² of Bahía Almejas (BA) (Figure 1). The main whale-watching areas in the three lagoons are the ocean entrance points. Hereafter, when referring to the whales from any of these sites, we mention the bays, and when referring to the localities in socioeconomic aspects, we refer to the names of the communities. To identify the elements that describe the resilience of the SES of whale watching and thus shape the mental model of the system, we divided the SES into two major blocks: the ecological and socioeconomic subsystems.
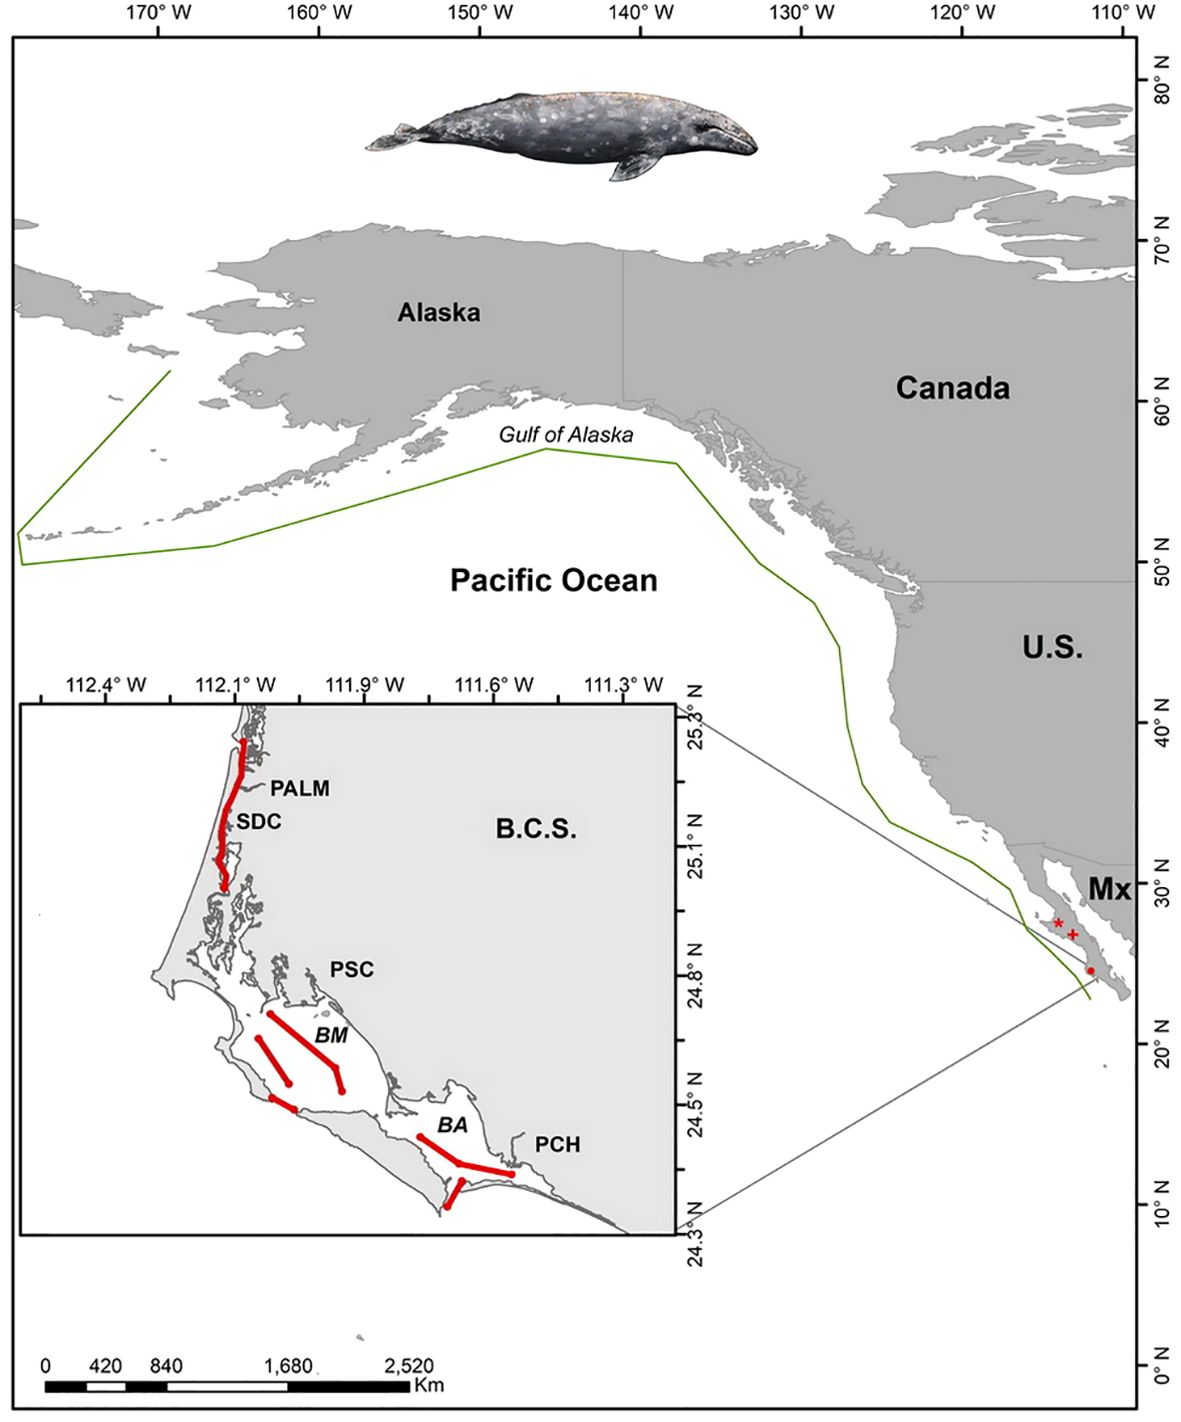
Figure 1. Migration route and calving and breeding bays of the gray whale (Eschrichtius robustus). Green line: example of migration route. Laguna Ojo de Liebre ( ), Laguna San Ignacio (
 ), Bahía Magdalena – Bahía Almejas Lagoon Complex (BMAC) (
 ). In the small box, locations and lagoons of BMAC; Locations: PALM (Puerto Adolfo López Mateos), PSC (Puerto San Carlos), PCH (Puerto Chale). Lagoons: Santo Domingo Channel (SDC), BM (Magdalena Bay), BA (Almejas Bay). The red lines indicate the navigation routes followed during the whale census counts conducted by PRIMMA-UABCS.
2.1 Elements of the ecological subsystem
To construct the SES, a group of researchers first conducted biological monitoring of gray whales and analyzed trends over time. Between 2016 and 2023, a group of researchers and volunteers conducted vessel censuses in the study area, supervised by the Marine Mammal Research Program (PRIMMA) of the Autonomous University of Baja California Sur (UABCS) (sanignaciograywhales.org). During these annual censuses, whose reports have been published in the International Whaling Commission (Urbán et al., 2016, 2017, 2018, 2019, 2020, 2021, 2022, 2023), we performed systematic counts along predetermined routes for each lagoon. For each lagoon, we conducted at least three annual censuses, at least one per month from the second week of January to the second week of March, culminating in a total of 29 censuses per lagoon, except for Bahía Magdalena, which had 30 censuses (88 censuses in total) (Figure 2). These censuses estimate the minimum number of gray whales within the main winter breeding and nursing lagoons along the Pacific coast of the Baja California peninsula. In each census, we used a portable Global Positioning System (GPS) device to follow a predetermined transect in each lagoon. For the lagoons of the BMAC, we followed the pre-designed routes by authors such as Fleischer et al. (1995), Gardner and Chavez-Rosales (2000), and Perez-Cortez et al. (2004) (Figure 1). This duplication of census effort allows us to compare whale counts within the year along the same census transect of each lagoon, and to compare with historical counts from previous years (Jones and Swartz, 1984; Urbán et al., 2003b).
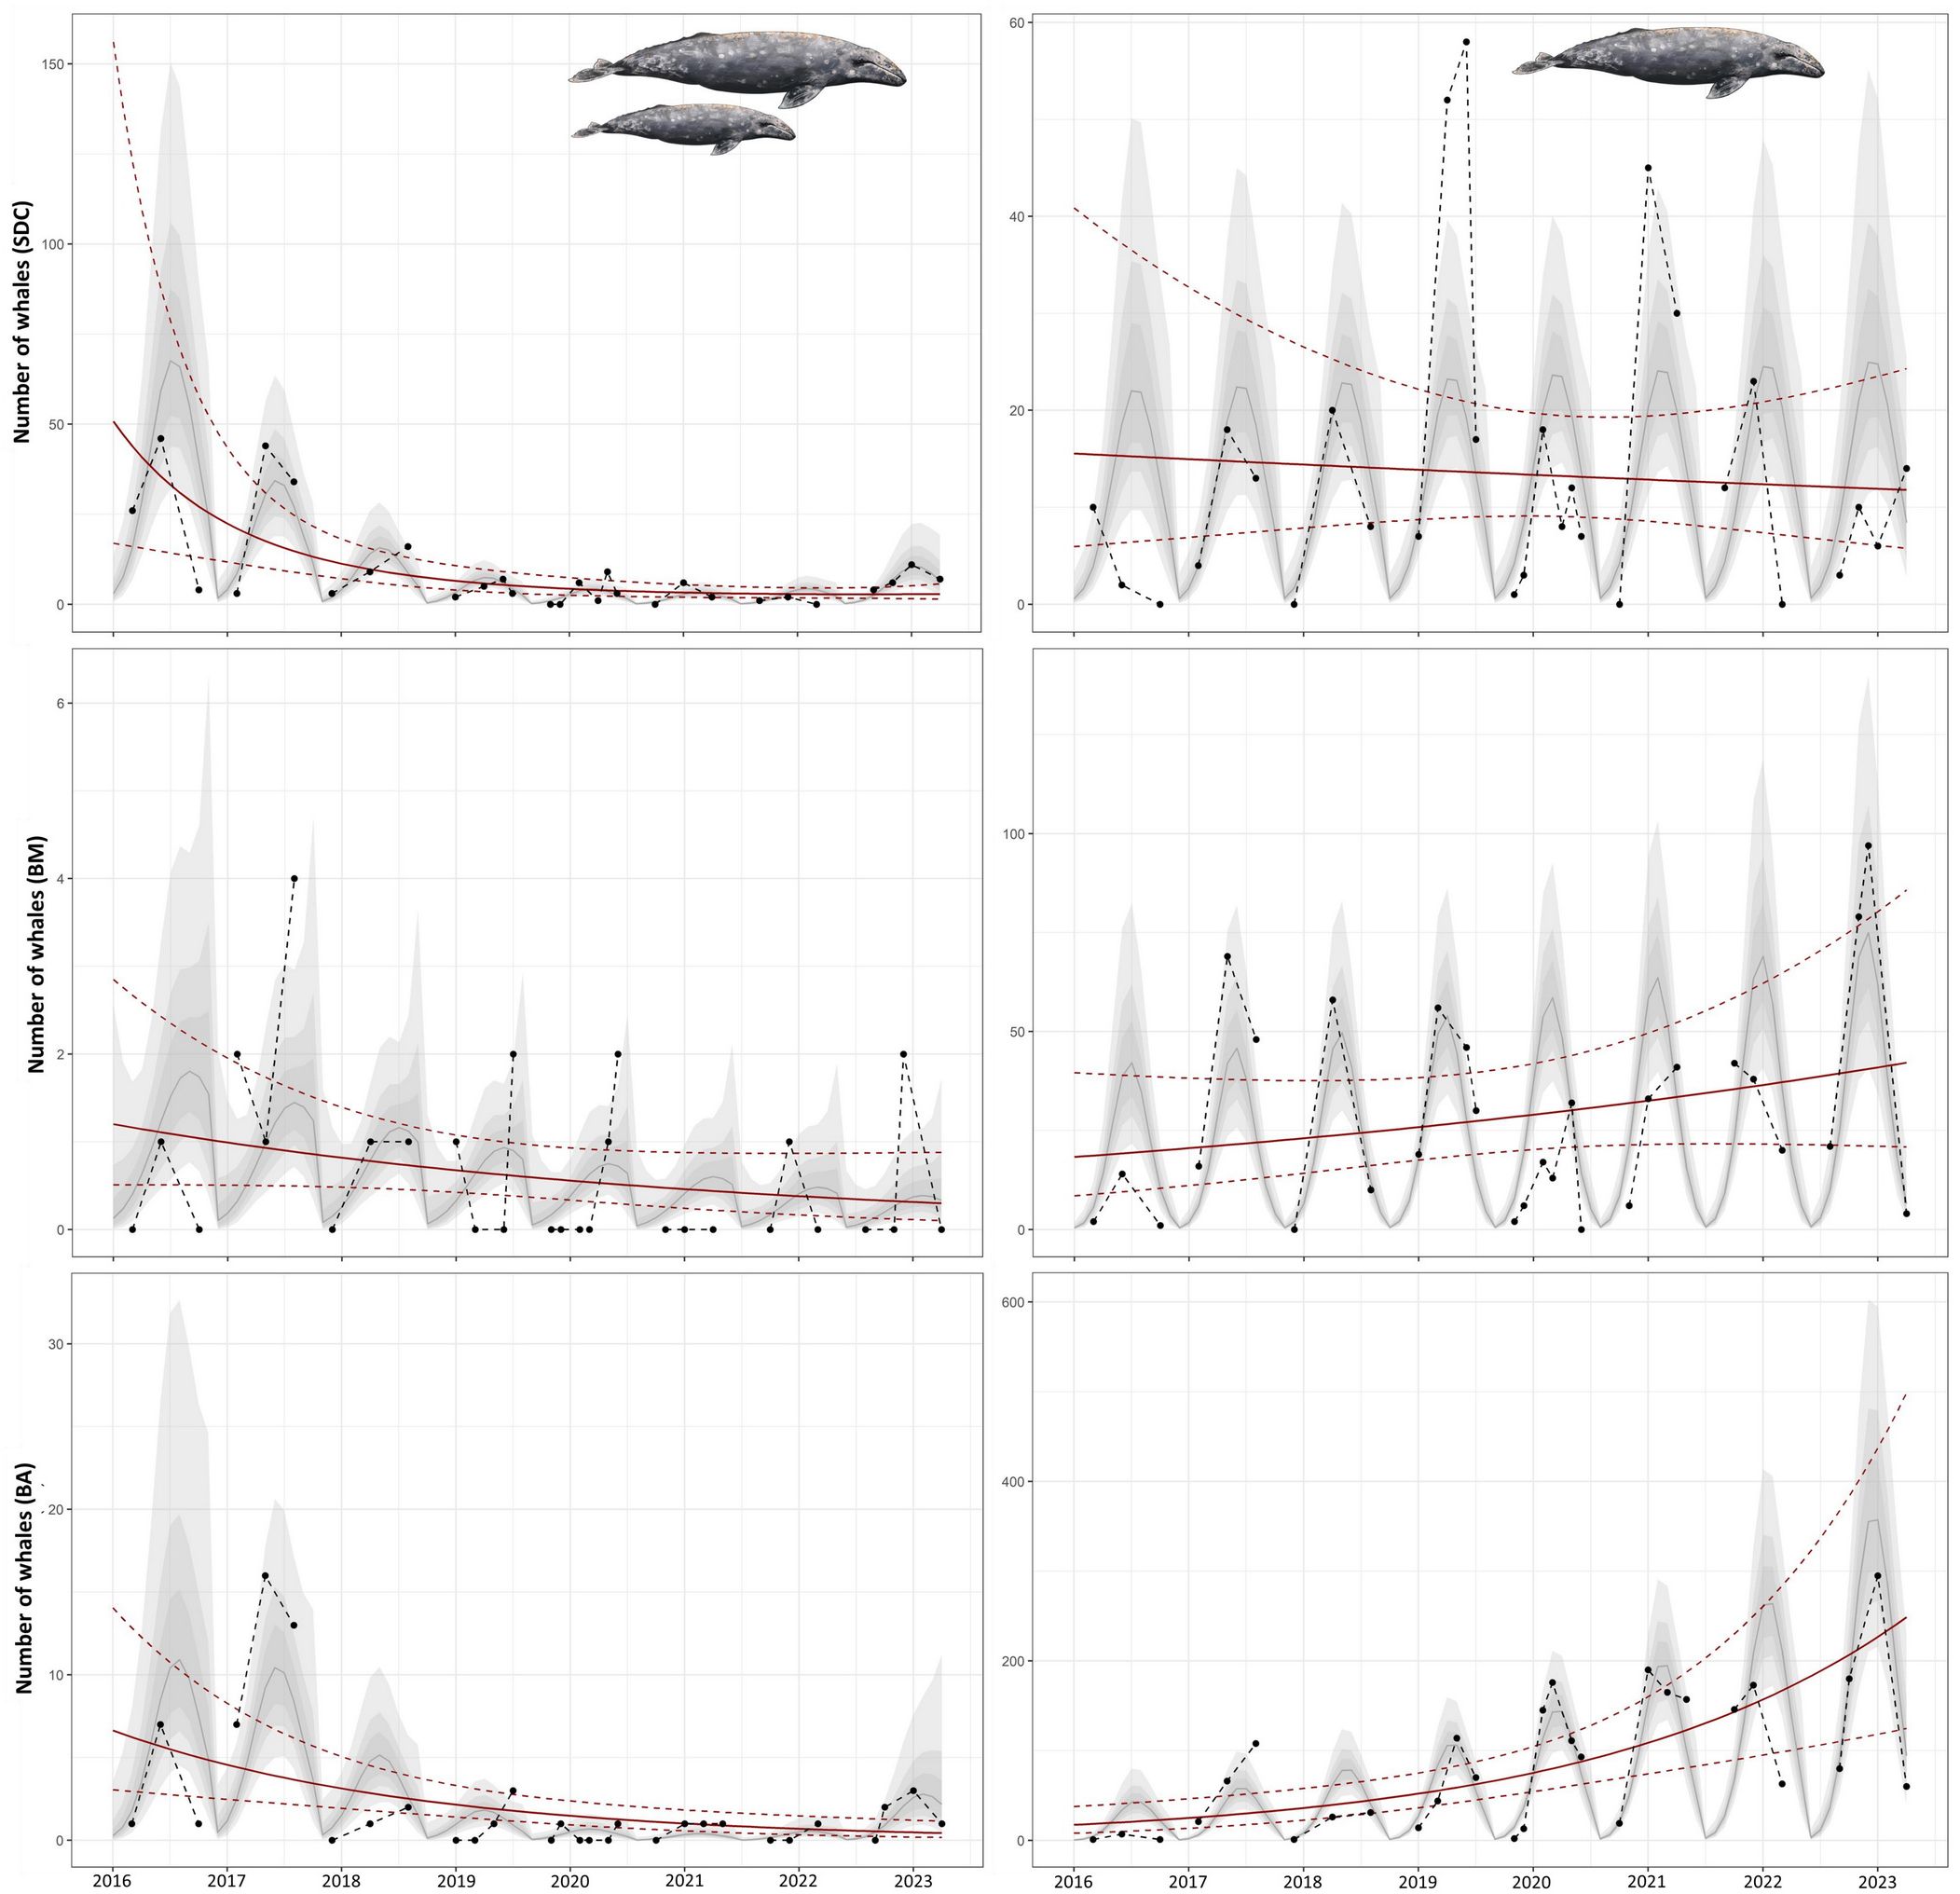
Figure 2. Trends in the number of mother-calf pairs (left) and single whales (right) counted per year in each lagoon of the Bahía Magdalena-Bahía Almejas complex from 2016 to 2023: Santo Domingo Canal (SDC), Bahía Magdalena (BM), and Bahía Almejas (BA). The points connected by dotted lines represent the original counts. The 95%, 75%, and 50% credible intervals (CI) of the estimated number of whales from the full model with long-term and seasonal scales are shown as shaded areas in grayscale. The solid red line represents the median of the long-term trend, and the dotted gold lines are its 95% credible intervals (CI).
For these censuses, we used the methodology proposed by Jones and Swartz (1984), which consists of navigating small outboard motorboats of 7 to 8 meters in length, following pre-designed routes at a speed of 11 km/h during the whale count. This speed is used to minimize the probability of whales outpacing the vessel, giving observers enough time to detect whales surfacing along the tracking route. Whales were recorded by two pairs of observers, one on the port side and another on the starboard side. Whales were counted only when they were at a right angle to the observers, and a fifth person recorded the sighting in a logbook, noting the time of the sighting, the number of whales, their swimming direction, and whether a calf accompanied them or if they were single whales. Additionally, we recorded some environmental conditions such as the Beaufort Sea state, wind direction, cloud cover, sea surface temperature, and depth. Censuses were not conducted or were aborted if in progress wind and sea state conditions exceeded Beaufort Sea state 3 (winds over 18 km/h with consistent whitecaps). By convention, “mother-calf pairs” (i.e., female whales with calves of the year) are counted as a single unit. “Single whales” refer to females without calves, adult males, and immature or juvenile animals.
Using the annual census data, we created temporal models for each lagoon and whale group (number of mother-calf pairs and single whales). We implemented Bayesian mixed-effects temporal models with an integrated nested Laplace approximation (INLA) approach (Rue et al., 2009), which has proven to be a great alternative for modeling time series, providing results in terms of posterior probability distributions instead of fixed values, and incorporating various types of random effects of temporal nature (Blangiardo et al., 2013; Zuur and Leno, 2018). We used years 2016 to 2023 as covariates to show long-term trends and the weekly scale from week 1 to week 16 of the year to cover the weeks of the first three months of each year, covering the census period to show temporal trends. We tested various model structures with combinations of the covariates. We used the best model results to show the long-term and seasonal temporal trends of the estimated number of gray whales over the eight years of systematic censuses.
2.2 Elements of the socioeconomic subsystem
During the biological monitoring, researchers identified some practices during whale watching that could affect the whales’ well-being. As a result, we designed and evaluated compliance with the guidelines of the official Mexican regulations, specifically the Mexican Official Standard NOM-131-SEMARNAT-2010 (DOF, 2011). We assessed compliance with guidelines such as the maximum observation time (30 minutes), the maximum allowed navigation speed (9 km/h in the observation area, decreasing to 4 km/h when starting the observation activity), the observation distance between the vessel and the whales (60 meters), the trajectory of the vessel’s approach to the whale (in a diagonal line from the rear side of the whale), and the maximum number of vessels observing the same whale or group of whales (four vessels). For the in situ evaluation of violations of the official regulations, we used a survey and registration method adapted from Quintana-Martín Montalvo et al. (2021) (the modified survey is available in Supplementary Table 1). This involved data collection by a group of researchers from a smaller vessel (45 feet or 13.7 meters long), positioned approximately 300 meters from a group of whales being observed by tourists. Sampling was conducted for a minimum of 6 minutes (2 scans to check for compliance or violation) and a maximum of 45 minutes (15 scans) as soon as visual contact with the group was lost or the whale-watching activity ended by a vessel or group of vessels. The size and composition of the group (adults and calves) were estimated visually. We then conducted a Principal Component Analysis (PCA) to identify the main violations of the official standard in each community and group of whales (mother-calf pairs, single whales, and groups of more than three whales) (Greenacre et al., 2023) to reduce the dimensionality of the multiple violations assessed and observe only the primary relationships between communities and violations (Chan and Shi, 1997; Greenacre et al., 2023). We used the scores of the projection of each locality in the principal components space to represent the position of the original observations in the principal components space, which helped to understand the influence of each principal component on the observations. We also performed a Pearson correlation analysis between the principal components and the violations to analyze and visualize how each community is associated with the principal components and the violations (Greenacre et al., 2023). To understand the dynamics of whale-watching tourism and its economic impact in the study area, we analyzed available data from the Mexican government’s Secretariat of Environment and Natural Resources (SEMARNAT). SEMARNAT collects information reported annually by tourism operators regarding the number of permits, trips, income, and jobs generated by whale-watching in Mexico (SEMARNAT, 2024).
Analyzing the trends of the last eight years of whale counts, the lack of compliance with official regulations by tourism operators, and the economic importance of whale watching in the localities, we approached the communities to begin participatory work involving key stakeholders according to the nature of the activity, including tour operators conducting gray whale watching, tourists, and government representatives. In early winter 2022, we conducted 18 interviews with representatives of service operators. These interviews aimed to delve deeply into their experiences in tourism, tourists’ perceptions, their understanding and views on official regulations, as well as their knowledge and perceptions of climate change and its impact on gray whales and whale-watching activities (the interview questions for tour operators are available in the Supplementary Table 2). We conducted the interviews in the three communities of the BMAC (Figure 1) and one additional interview with a representative of the Director of the Biosphere Reserve of the Pacific Islands in the Baja California Peninsula of the National Commission of Natural Protected Areas (CONANP).
Our research was a collaborative effort, with a wealth of information obtained from interviews. At the end of the winters of 2022 and 2023, we conducted 12 participatory workshops using mixed methodologies in focus groups. These workshops were aimed at people from communities near the observation area, with a primary focus on tour operators. The workshops, distributed among the three localities, were a platform for sharing and gathering insights. The first round of workshops in each locality focused on understanding the community’s perception of climate change, its effects on gray whales and tourism, and sharing the results of the whale count censuses. The second part involved providing updated information on the status of the gray whale population, the observed effects of climate change on migration routes and breeding lagoons, and their interest in regulations and whale welfare. The third part provided detailed information on current regulations and their importance for whale conservation and tourist safety.
Between the third and fourth rounds of workshops, we conducted semi-structured surveys among 235 tourists to gather information on their level of interest in gray whale watching, overall satisfaction with the activity, satisfaction with the information provided during the tour, compliance with regulations, and the number of vessels encountered during the tour. For each of these sections, we asked participants to indicate their level of agreement on a Likert scale (1 - strongly disagree to 5 - strongly agree) (Pett, 2015). Additionally, we collected data on socio-demographic aspects, travel expenditures, and asked about scenarios in which they would be willing to return about the amount of information received during the WW trip, the number of vessels watching whales at the same time (crowding), and the number of whales (especially mother-calf pairs) (the survey questions for tourists are available in the Supplementary Table 3). The intention to return has been widely addressed in the theory of planned behavior, which states that tourists’ intention to return depends on attitudes, subjective norms, and perceived behavioral control (Ajzen, 1991). Perceived crowding reveals a subjective perception of the number of vessels encountered affecting tourist satisfaction (Vaske and Donnelly, 2002).
We performed descriptive statistical analyses to understand the factors related to tourist satisfaction and to assess whether communities exhibited tendencies to commit specific types of normative violations. Through a correlation tree, we identified the segmentation of tourists based on their overall satisfaction with gray whale watching. Correlation trees reveal complex and non-linear relationships between predictive variables and the response variable (satisfaction level) (Breiman et al., 2017).
Finally, we conducted the fourth round of workshops where researchers shared our interpretation of the interviews, the results of the tourist surveys, the evaluation of compliance with regulations, and the relationship with the results of the whale censuses. In this final round, we conducted a feedback process where, through brainstorming sessions, we identified the essential variables of the SES and their interactions, discussed important adaptation actions for the system to be resilient to the effects of climate change, emphasizing that these actions are crucial for the future of gray whale watching and tourism. We validated the mental model of the SES via focal groups. To qualitatively understand the behavior of the system elements and the flows indicating how the variables interact, we represented the polarities of the links connecting these variables to show cause-effect relationships (Loucks and Van Beek, 2017). We represented these polarities with a plus (+) or minus (−) sign to show the direction of the relationship between the two interconnected variables (Maani and Cavana, 2007).
3 Results
We grouped the elements describing the resilience of the SES of gray whale watching in the BMAC into large blocks of the natural and socioeconomic subsystems, subsequently describing their interactions graphically in a mental model of the system.
3.1 Ecological subsystem
We obtained six models, selecting one for each locality with a different grouping of whales (mother-calf pairs and single whales). For all competing models, the negative binomial probability better represented the response variable than the Poisson distribution. Model selection was carried out using the Watanabe-Akaike Information Criterion (WAIC) (Table 1).
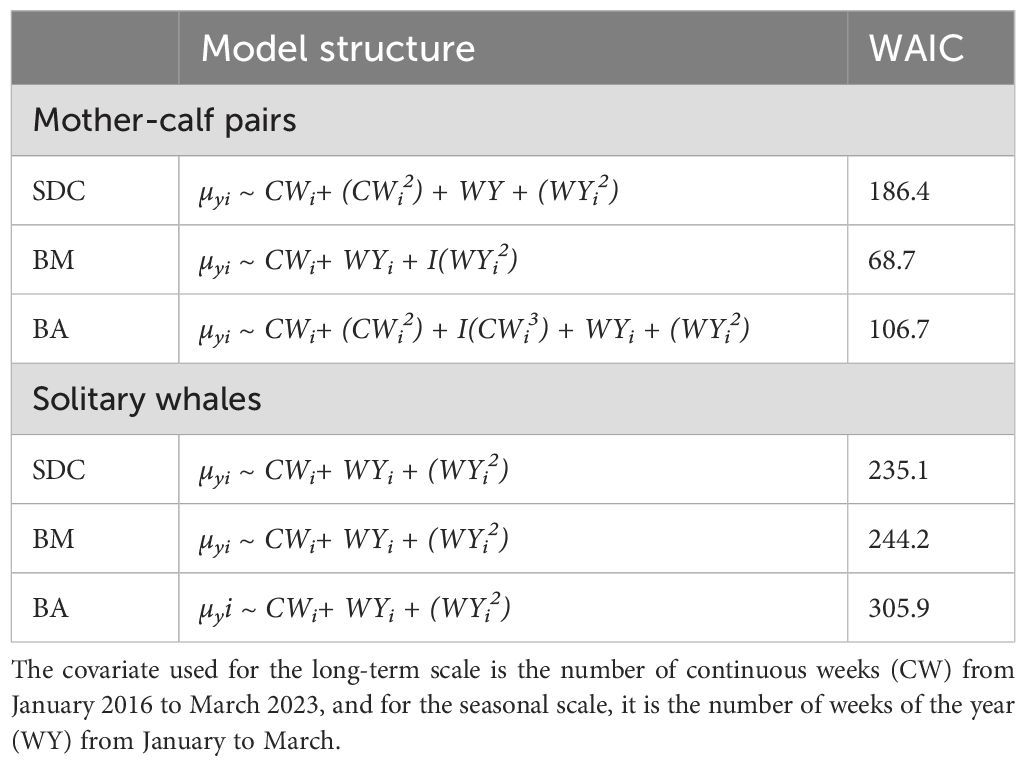
Table 1. Best models of gray whale counts (μy) for each lagoon: SDC (Santo Domingo Channel), BM (Bahía Magdalena), and BA (Bahía Almejas) based on long-term and seasonal weekly scales selected by the Watanabe-Akaike Information Criterion (WAIC).
In the case of single whales, the best model was the same for each locality, including the number of continuous weeks (CW) from January 2016 to March 2023 (long-term scale), and the week of the year (WY) from January to March (seasonal scale) with second-order polynomials. Mother-calf pairs had different models for each locality; the most complex model was for BA with CW with third-order polynomials and WY with second-order polynomials, followed by SDC with second-order polynomials in both covariates. The simplest model for mother-calf pairs was for BM with CW plus WY with second-order polynomials (Table 1). There is a differentiated segregation of whales in the bays. The northernmost region (SDC) hosts the highest number of mother-calf pairs, while BM and BA have more single whales. On the other hand, the number of single whales has been higher in BA, with the annual average number of whales in this area being between three and seven times higher than in BM and between five and fourteen times higher than in SDC over the past four years (Figure 2).
The data reveals a trend of decreasing mother-calf pairs over the years. The highest counts were observed in 2016 and 2017 in SDC, with maximum counts of 46 and 44 pairs, respectively. However, the following year (2018), only about one-third of that number was counted. This trend is consistent across all lagoons, with the most drastic changes observed in SDC, followed by BA. Between 2017 and 2022, there was a 95% decrease in the maximum number of mother-calf pairs counted in SDC, a 94% decrease in BA, and a 75% decrease in PSC. While 2023 saw a slightly higher increase than the average trend estimated in the long-term model, the overall trend is a cause for concern (Figure 2).
The trend in the number of single whales has been increasing in BM and BA, although it is more pronounced in the southernmost area. Following the lowest counts of single whales in 2016 in BM, there was a drop in 2020, with slightly higher maximum counts in 2021 and 2022, but even in these years, the maximum whale count was 41% less than in 2017. However, by 2023, there was a historic increase with a maximum count of 97 single whales, 131% more than in 2022 and 40% more than in 2017. In the case of BA, the maximum count of single whales increased consistently until 2021, with three times more whales in 2019 than the previous year. Between 2020 and 2022, there were no clear differences, but there was a 10% decrease between 2021 and 2022. However, in 2023, there was a considerable increase with a maximum count of 295 single whales (70% more whales than in 2022). SDC is the only lagoon showing a long-term decreasing trend in single whales. In 2022, SDC had a maximum count of single whales almost 50% lower than in 2021 and 60% lower than in 2019, and in 2023 was the only lagoon with fewer single whales than the previous year, with a 64% decrease (Figure 2).
The number of whales in the breeding lagoons, mainly the mother-calf pairs, and their declining trend over time are the primary state factors of the SES, as without whales, the system simply would not exist. Going from a maximum of 44 mother-calf pairs to two implies a change in the main factor of the SES, raising other questions related to how the system can remain resilient to these changes: Will the number of whales observed be important to tourists? Have tour operators noticed these changes in the whales? Is tourism conducted in the same way? Are there implications if tourism remains the same or grows?, among others.
3.2 Socioeconomic subsystem
After examining the temporal trend of gray whales visiting the Bahía Magdalena area over time, we compared the three localities within the BMAC. We evaluated how this tourist activity aligned with the official Mexican regulations. By assessing compliance with the Mexican Official Standard NOM-131-SEMARNAT-2010 using principal component analysis, we observed that violations of exceeded observation time (Time), improper approach trajectory to the whales (Trajectory), and high navigation speed (Speed) are distributed differently in the principal components (Figure 3). Trajectory and Speed are strongly correlated with the first principal component (Comp.1), with correlations of r = 0.90 and r = 0.77, respectively (Table 2). This suggests that Comp.1 represents a variability axis where long trajectories and high-speed violations predominate. On the other hand, Time shows a high correlation with the second principal component (Comp.2, r = 0.92), while Speed has a negative correlation with Comp.2 (r = -0.53) (Table 2). This indicates that Comp.2 represents a variability axis where long violation times oppose high-speed violations. By examining the scores of the communities in these components, we observed that when operators from the community of PSC observe single whales (PSC.single), they have high scores in both components (Table 2), suggesting that this community has improper approaches to the whales and prolonged violation times (Figure 3). Operators from PCH have a high score in Comp.1 and a negative score in Comp.2 when observing single whales, indicating that this community tends to have improper approach trajectories to the whales, navigate at high speeds, but usually respect the maximum observation time. In contrast, in the presence of mother-calf pairs, all localities have low scores in both components, indicating better approach trajectories, slow navigation, and no exceeding the maximum observation times (Figure 3).
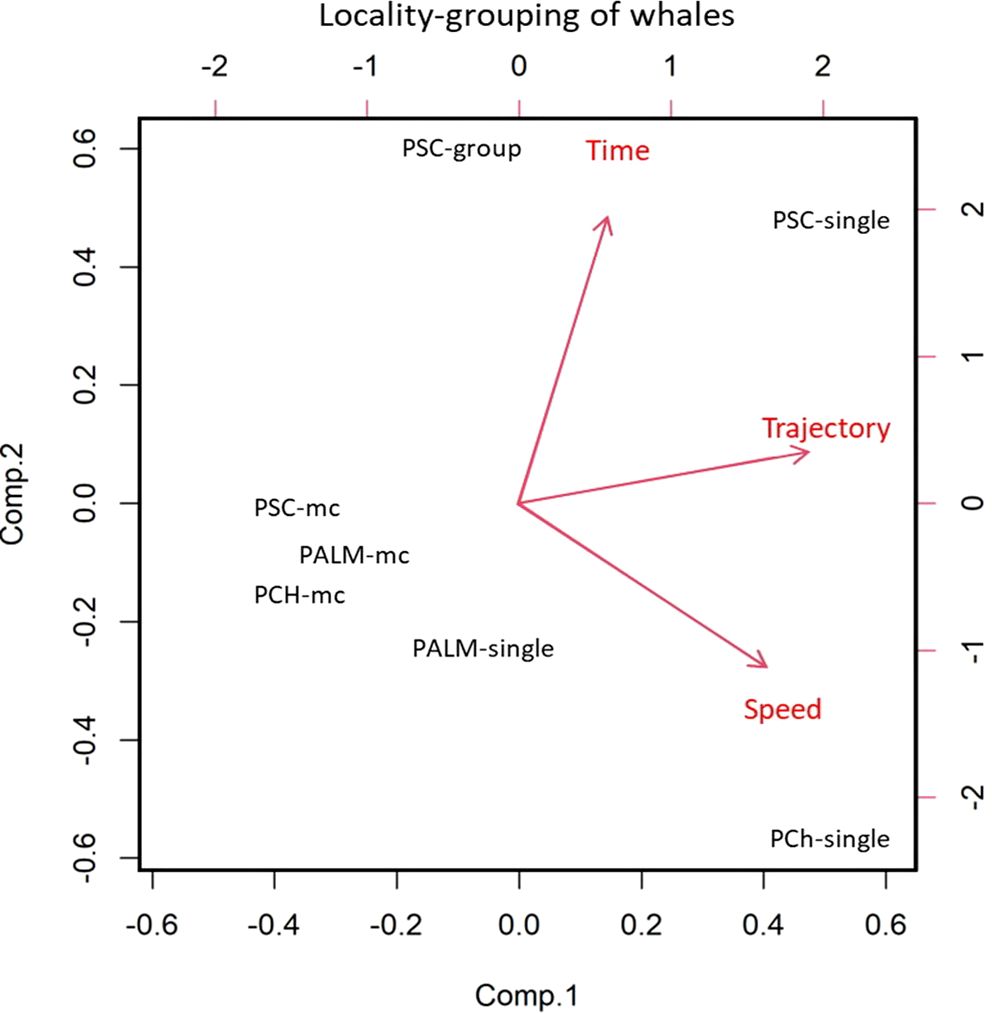
Figure 3. Principal Component Analysis. Representative infractions of non-compliance with regulations in different groupings of gray whales in the communities of BMAC. PSC: Puerto San Carlos, PALM: Puerto Adolfo López Mateos, PCh: Puerto Chale. Chale. Group: groups of three or more whales, mc: mothers with calves, single: solitary whales.
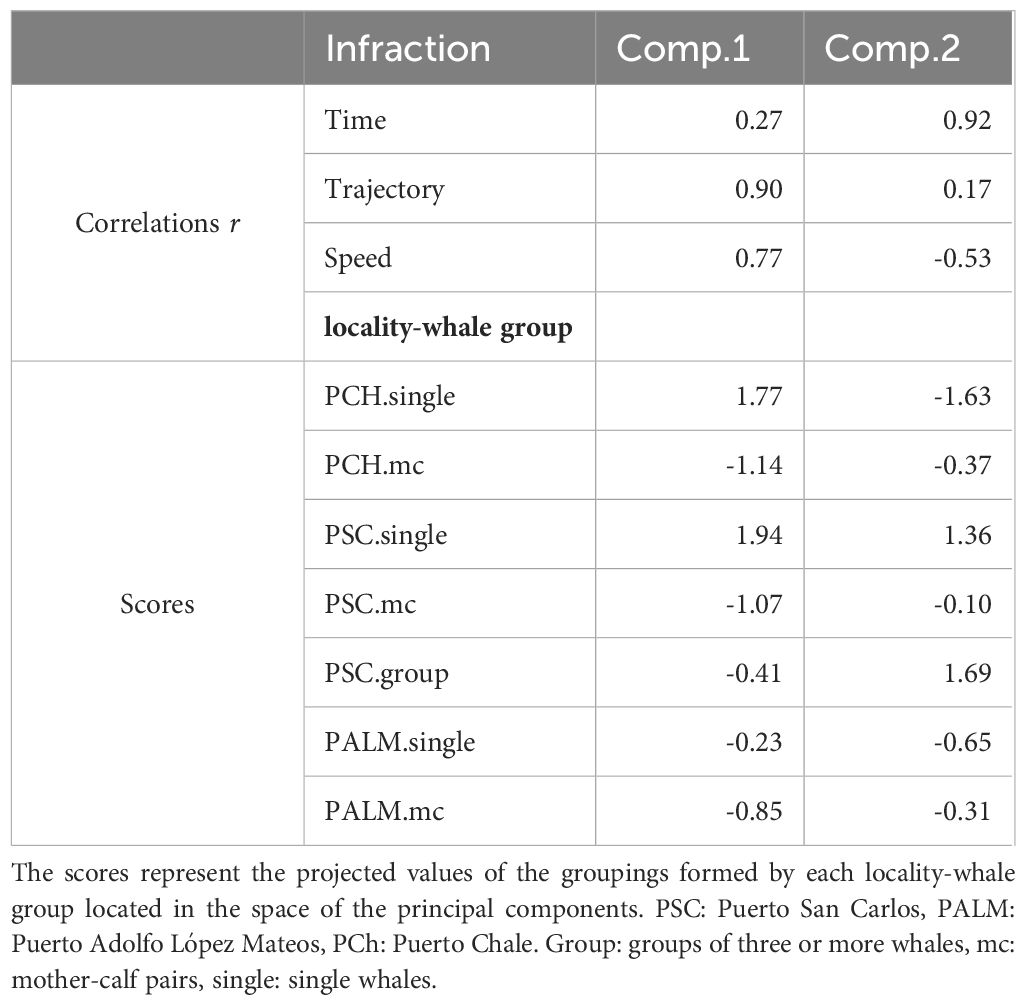
Table 2. Correlations indicating the relationship between violations of NOM-131-SEMARNAT-2010 (Time, Trajectory, Speed) and the principal components (Comp.1, Comp.2).
Currently, we do not have evaluations from different years with varying numbers of whales, but we have the experience of being constantly present during the winter season, conducting whale monitoring, and evaluating compliance with regulations on different days of the week and at various times, some with higher tourism intensity than others. Therefore, we observed an increase in poor practices during times of higher influx of tourist vessels in the observation areas, mainly the mouths of the lagoons to the open sea.
Subsequently, our objective was to understand the importance of whale watching as an economic activity. By examining the available data in the SEMARNAT database (SEMARNAT, 2024), we observed that despite the geographical proximity of the localities within the same lagoon complex, there are significant variations in the number of tourists visiting these areas and their economic contributions. Interestingly, we observed a notable increase in economic income in PALM, where there has been a clearer decrease in gray whales, particularly mother-calf pairs (Figure 4). The differences in income between PALM and PSC are evident, with the former consistently being a higher income generator and conducting a greater number of trips since 2009 (Figure 4). However, there are cases where PSC’s earnings could be proportionally higher, such as in 2015, when it generated $228,280 dollars in 655 trips, just $1,780 dollars less than PALM, despite conducting only one-third of the trips. However, there are no available records in the SEMARNAT databases for the southernmost site (PCH) despite its official inclusion as a whale watching area in 2013 (DOF, 2012).
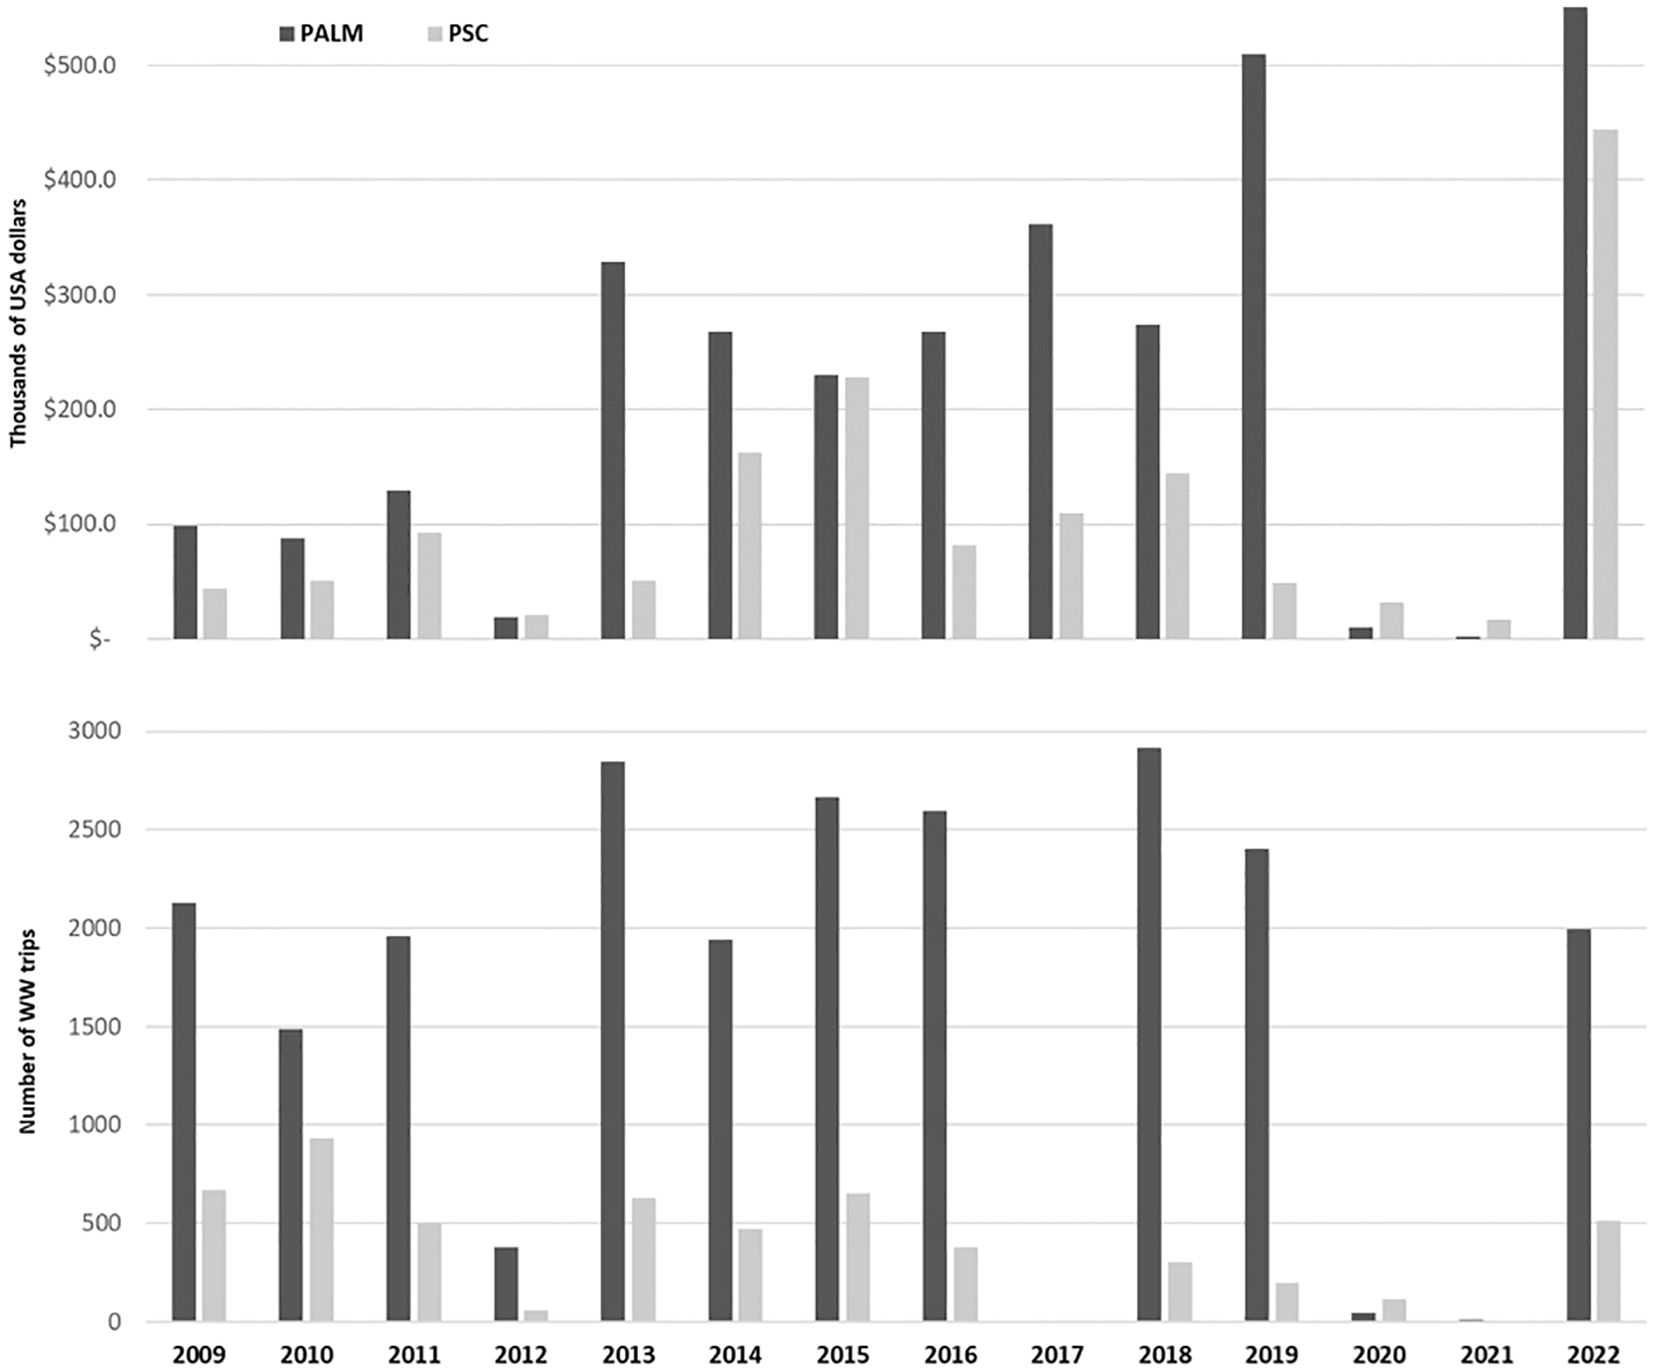
Figure 4. Top: Economic income in thousands of U.S. dollars from whale watching in Puerto Adolfo López Mateos (PALM) and Puerto San Carlos (PSC). Bottom: Number of reported whale-watching trips in Puerto Adolfo López Mateos (PALM) and Puerto San Carlos (PSC). Data from (SEMARNAT, 2024).
Specifically for PALM, starting in 2013, there was a significant increase in income, exceeding $200,000, much higher than in previous years (Figure 4). Since 2013, revenues in this community have ranged from $230,000 to $940,000 in 2022, followed by a notable decrease in 2020 and 2021, marking the lowest historical incomes from whale watching in PALM ($10,300 and $1,930, respectively). The difference between the second-highest income year and the highest is notable; in 2022, revenues were 85% higher than in 2019. Similar to PALM, PSC experienced its highest income year in 2022 ($444,300), followed by 2015 ($228,930), and then 2014 ($162,000). In 2020, revenues slightly exceeded those of 2012, which was the worst year, and in 2022, revenues were 94% higher than in 2015, the second-highest income year (Figure 4).
The number of trips appears to have remained relatively stable in PALM, fluctuating between 2,400 and 2,900 trips per year since 2013. A similar pattern is observed in PSC from 2009 to 2015, but a steady decline in the number of trips has been recorded until 2020. In 2020, the historical minimum of trips was recorded, with only 112, only surpassed by 2010 when only 55 trips were reported (Figure 4). The growth pattern in the number of trips is less noticeable compared to the economic income, particularly for PALM, where a historical record of earnings was achieved in 2019, before the onset of the SARS-CoV-2 Coronavirus pandemic, which was then greatly surpassed in 2022 (Figure 4). Despite some years with declines in tourist activity, the increase in recent years is clear, especially the upturn in 2022, which underscores the importance of a growing activity, contrary to the decline in gray whales. The low values in 2012 for both economic income and the number of trips should be taken with caution, as we did not find an explanation for these values, and even service operators mentioned that they do not reflect the tourist dynamics of that year. It also appears that the record of travel information for 2017 by SEMARNAT is missing.
The next step was to understand in depth the perceptions, knowledge, and needs identified by whale-watching operators. We conducted a total of 18 interviews with whale-watching operators from the three communities in the BMAC. In PALM, eight whale-watching operators were interviewed, including the leaders of the two cooperatives and two individuals registered for whale watching. Unlike the other two communities, whale-watching operators in PALM stand out for their high level of organization, maintaining constant communication and making decisions related to whale watching through democratic processes. They also associate with foreign companies arriving on yachts or cruises, facilitating information exchange, and raising awareness about recent events, such as the unusual mortality of gray whales. Additionally, alternative nature tourism activities were identified in PALM due to its diverse environments, including dunes, mangroves, and wildlife. The operators expressed their understanding of the need for training and close communication with whale researchers in the area.
In PSC, six whale-watching operators were interviewed, perceiving high competition among operators who often adjust prices to attract tourists. There is discontent with fishing activities during the whale-watching season, with limited knowledge of the recent UME among the operators. Some operators wanted local guides to be trained to join boat operators and share information to improve onboard safety.
In the southernmost community, PCH, three whale-watching operators were interviewed. They demonstrated great interest in learning about gray whale ecology and sharing information with tourists. Despite being relatively new to tourism, PCH is optimistic due to its proximity to the state capital city and perceived competitive advantages over other communities. The operators expressed interest in the presence of surveillance authorities to ensure compliance with regulations and prevent unauthorized tourist activities.
To gain a more comprehensive view of the current situation of whale watching, we also interviewed the current representative of the Biosphere Reserve of the Pacific Islands of the Baja California Peninsula, belonging to the federal government agency called the National Commission of Natural Protected Areas (CONANP). During the interview, differences were highlighted between fishing and tourism groups in the level of organization among the communities and disparities and complaints among certain communities. There is a perception that the number of permits for whale-watching activities is excessive, underscoring the need to regulate tourism to ensure its sustainability. Additionally, there is a call for developing alternative nature-based tourism activities to alleviate pressure on whale watching. Furthermore, there is an emphasis on the need for closer engagement from researchers and government authorities with the communities, particularly with whale-watching operators, due to growing dissatisfaction related to the decline in whales in recent seasons.
Through in-depth interviews, we identified that in all three localities there is a recognition of the decline in whales, especially mother-calf pairs. Although there are varying levels of knowledge related to the effects of climate change, everyone expressed a strong interest in learning more. We began to identify input variables to the SES related to its resilience, such as interest in diversifying tourist activities, training to learn more about the biology and ecology of whales, and we found that not everyone was fully aware of the official regulations and their importance.
In order to directly share the requested information, such as general aspects of the biology and ecology of the gray whale, the results of the biological monitoring conducted by PRIMMA, and to learn more about the recent UME of gray whales, we organized 12 participatory workshops (4 per site). In the first three rounds of workshops, we shared this information and discussed sustainable and resilient tourism, the importance and benefits of applying NOM-131-SEMARNAT-2010, and discussed some improvement and adaptation strategies to climate change, which were later taken up and established in the fourth round of workshops. Additionally, we identified an interest in understanding tourists’ perceptions and satisfaction with the activity. Tourists often came with the idea of touching whales, generated by social media, which was reflected in an insistence by tourists to get too close to increase their chance of touching a whale, which could lead to several operators harassing the whales.
To understand the tourist typology and the factors associated with their satisfaction, we administered 235 semi-structured surveys to tourists immediately after their gray whale watching trips between 2022 and 2023. Sixty-four percent of these surveys were collected in PALM, 22% in PCH, and 14% in PSC. The age range of the surveyed tourists varied between 13 to 80 years old, with most being between 27 and 51 years old in all sites. Tourists mentioned their main motivations for visiting the area and watching whales, where 62% of the tourists stated that their primary motivation was simply to see the whales, with a particular interest in seeing calves. Only 25% reported having an interest in seeing the entire natural environment. Thirteen percent said they were visiting the area only because it was part of a tour package. In all localities, most tourists reported having completed university studies, followed by high school and postgraduate education. The most frequent occupation in all localities was professional work (34% of the total), followed by employee (20%). Of the total tourists, 34% spent less than $250 dollars, 23.8% spent between $250 - $500 dollars, and 15.3%, a similar percentage of tourists, spent between $500-1000 and $1000-1500 dollars. In PAL and PCH, the majority spent less than $250 dollars (34.4% and 45.1%, respectively); however, in PSC a high percentage of tourists preferred not to mention how much they had spent (45.5%) (Figure 5).
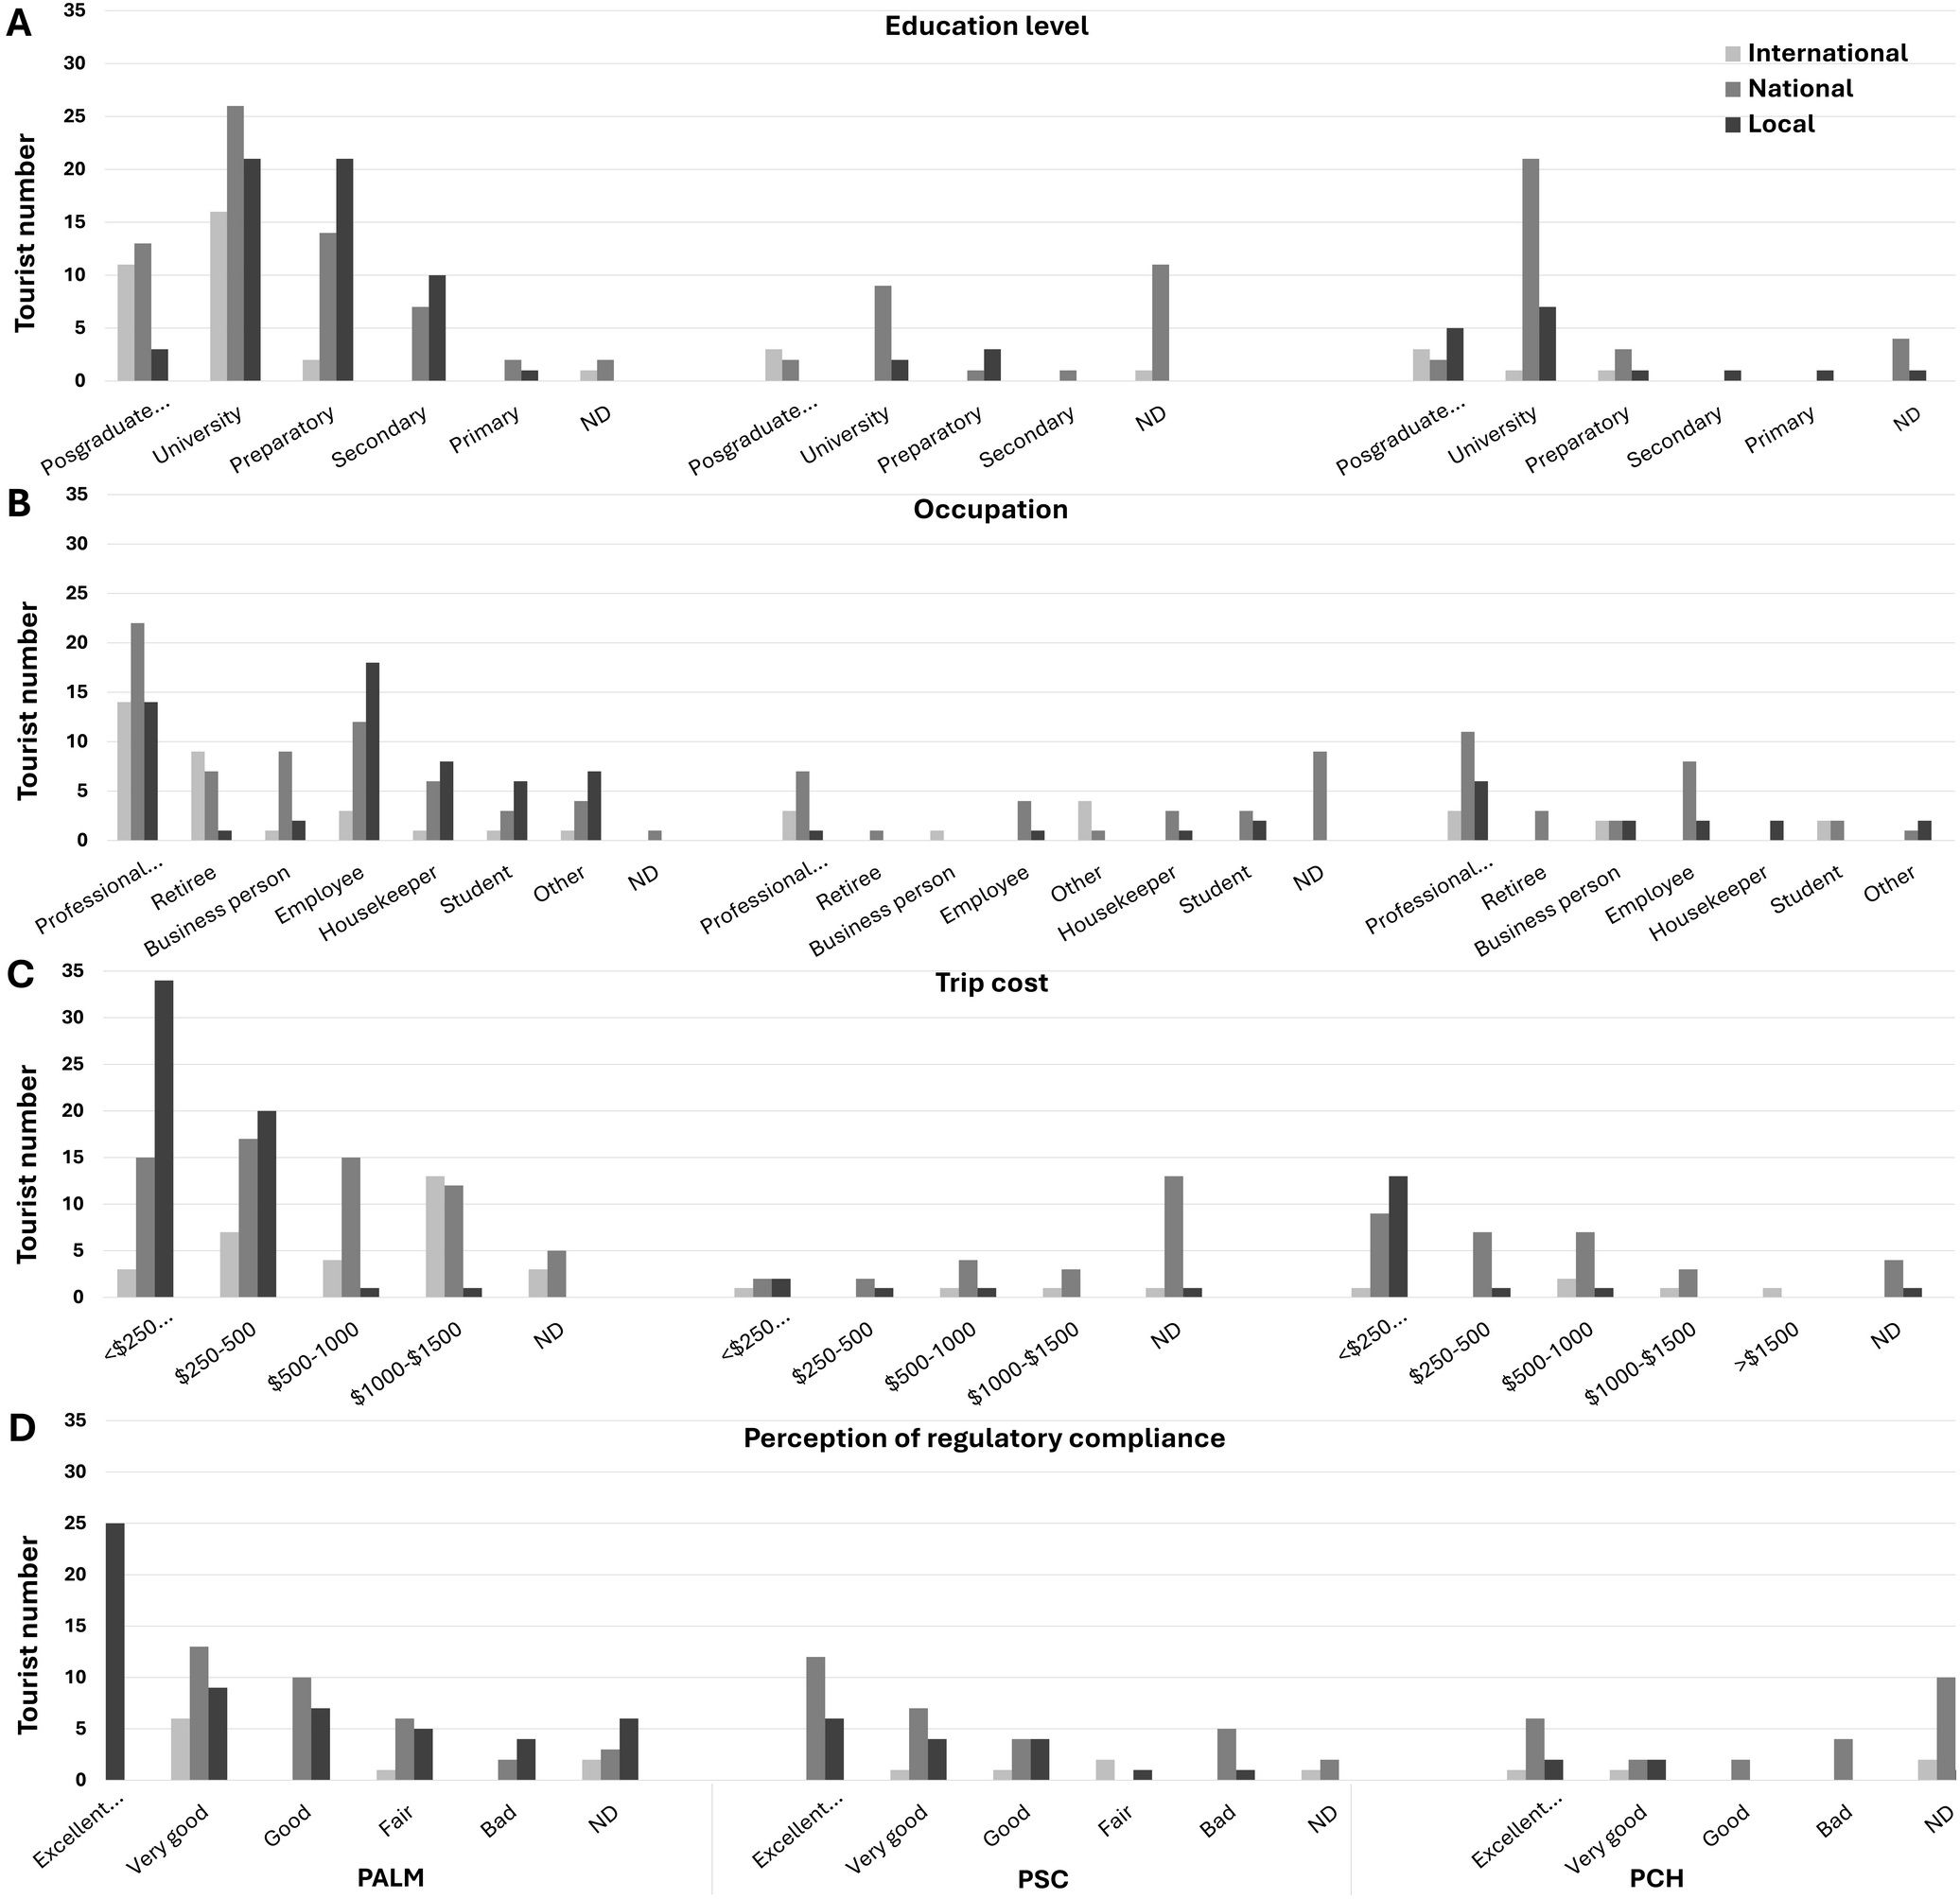
Figure 5. Tourist Typology: Some descriptive characteristics of tourists who visited different whale-watching locations, such as (A) Education level, (B) Occupation, (C) Trip cost. Tourist origin: Travelers from another country (International), tourists from Mexico traveling from a different state to Baja California Sur (National), and tourists from BCS (Local). PSC: Puerto San Carlos, PCH: Puerto Chale, PALM: Puerto Adolfo López Mateos. ND: Tourists who chose not to answer this question. (D) Tourists’ perception of compliance with NOM-131-SEMARNAT-2010.
Half of the respondents were national tourists, one-third were locals, and 17% were foreigners. PSC had the highest proportion of national tourists (55%), followed by PCH (25%) and PALM (20%) (Figure 5). When analyzing the proportion of tourists according to their origin (international, national, or local), we observed that international tourists (tourists from another country) had the highest proportion of university (41%) and postgraduate (28%) studies. The majority of national tourists (Mexicans who do not live in B.C.S.) had university studies (22%), followed by high school (12%) and postgraduate (11%) studies. Among local tourists (residents of B.C.S.), university and pre-university (high school) studies predominated (27% each), followed by secondary education (13%) (Figure 5A). Fifty-one percent of international tourists mentioned having a professional job, followed by retired tourists (23%). Most national tourists had professional jobs (34%), followed by employees (20%), and only 10% were retired tourists (Figure 5B).
After providing a general overview of the guidelines for proper whale watching according to NOM-131-SEMARNAT-2010, we sought to measure tourists’ perceptions of compliance with these guidelines. Among tourists visiting PALM, 51% rated compliance as excellent, 8% considered it moderate, and only 4% rated it as poor. In comparison, a smaller proportion of visitors to PCH and PSC rated compliance as excellent, with 35% and 39%, respectively. However, 12% of respondents rated compliance as deficient in both PCH and PSC. Additionally, 11% of all tourists refused to rate the compliance of their tour (Figure 5D). Interestingly, there were no clear differences in the compliance rating according to the tourists’ origin. Among international tourists, 56% rated compliance as excellent, followed by 43% of locals and 42% of nationals. Conversely, no foreigners rated compliance as deficient, while only 6% of locals and 9% of nationals perceived compliance as deficient. These findings suggest a generally positive perception of compliance with whale-watching guidelines among tourists, regardless of their origin (Figure 5D).
Tourists were willing to return for whale watching under certain circumstances, with no clear differences observed between communities or tourist origins. Sixty-four percent mentioned that they would consider returning if provided with more information during the whale-watching tour. In comparison, 23% said they would do so with the same information (Figure 6A). Interestingly, none of the respondents mentioned returning with less information than they received. Similarly, when asked about their willingness to return if they saw the same number of mother whales with calves, only 12% responded that the number of whales does not affect their decision to return. However, most tourists expressed that they would be more likely to return if the number of whale-watching vessels in the observation area was lower (30%) or at least the same as they observed during their tour (43%). Another 24% mentioned that a change in the number of vessels does not affect their decision (Figure 6A). Additionally, 40% of respondents expressed interest in engaging in more tourist activities in the area besides whale watching, even if it meant incurring higher expenses. About 33% said they neither agreed nor disagreed with this idea, while 21% chose not to answer. These responses indicate a potential to diversify tourist activities to enhance visitor experiences and support local economies.
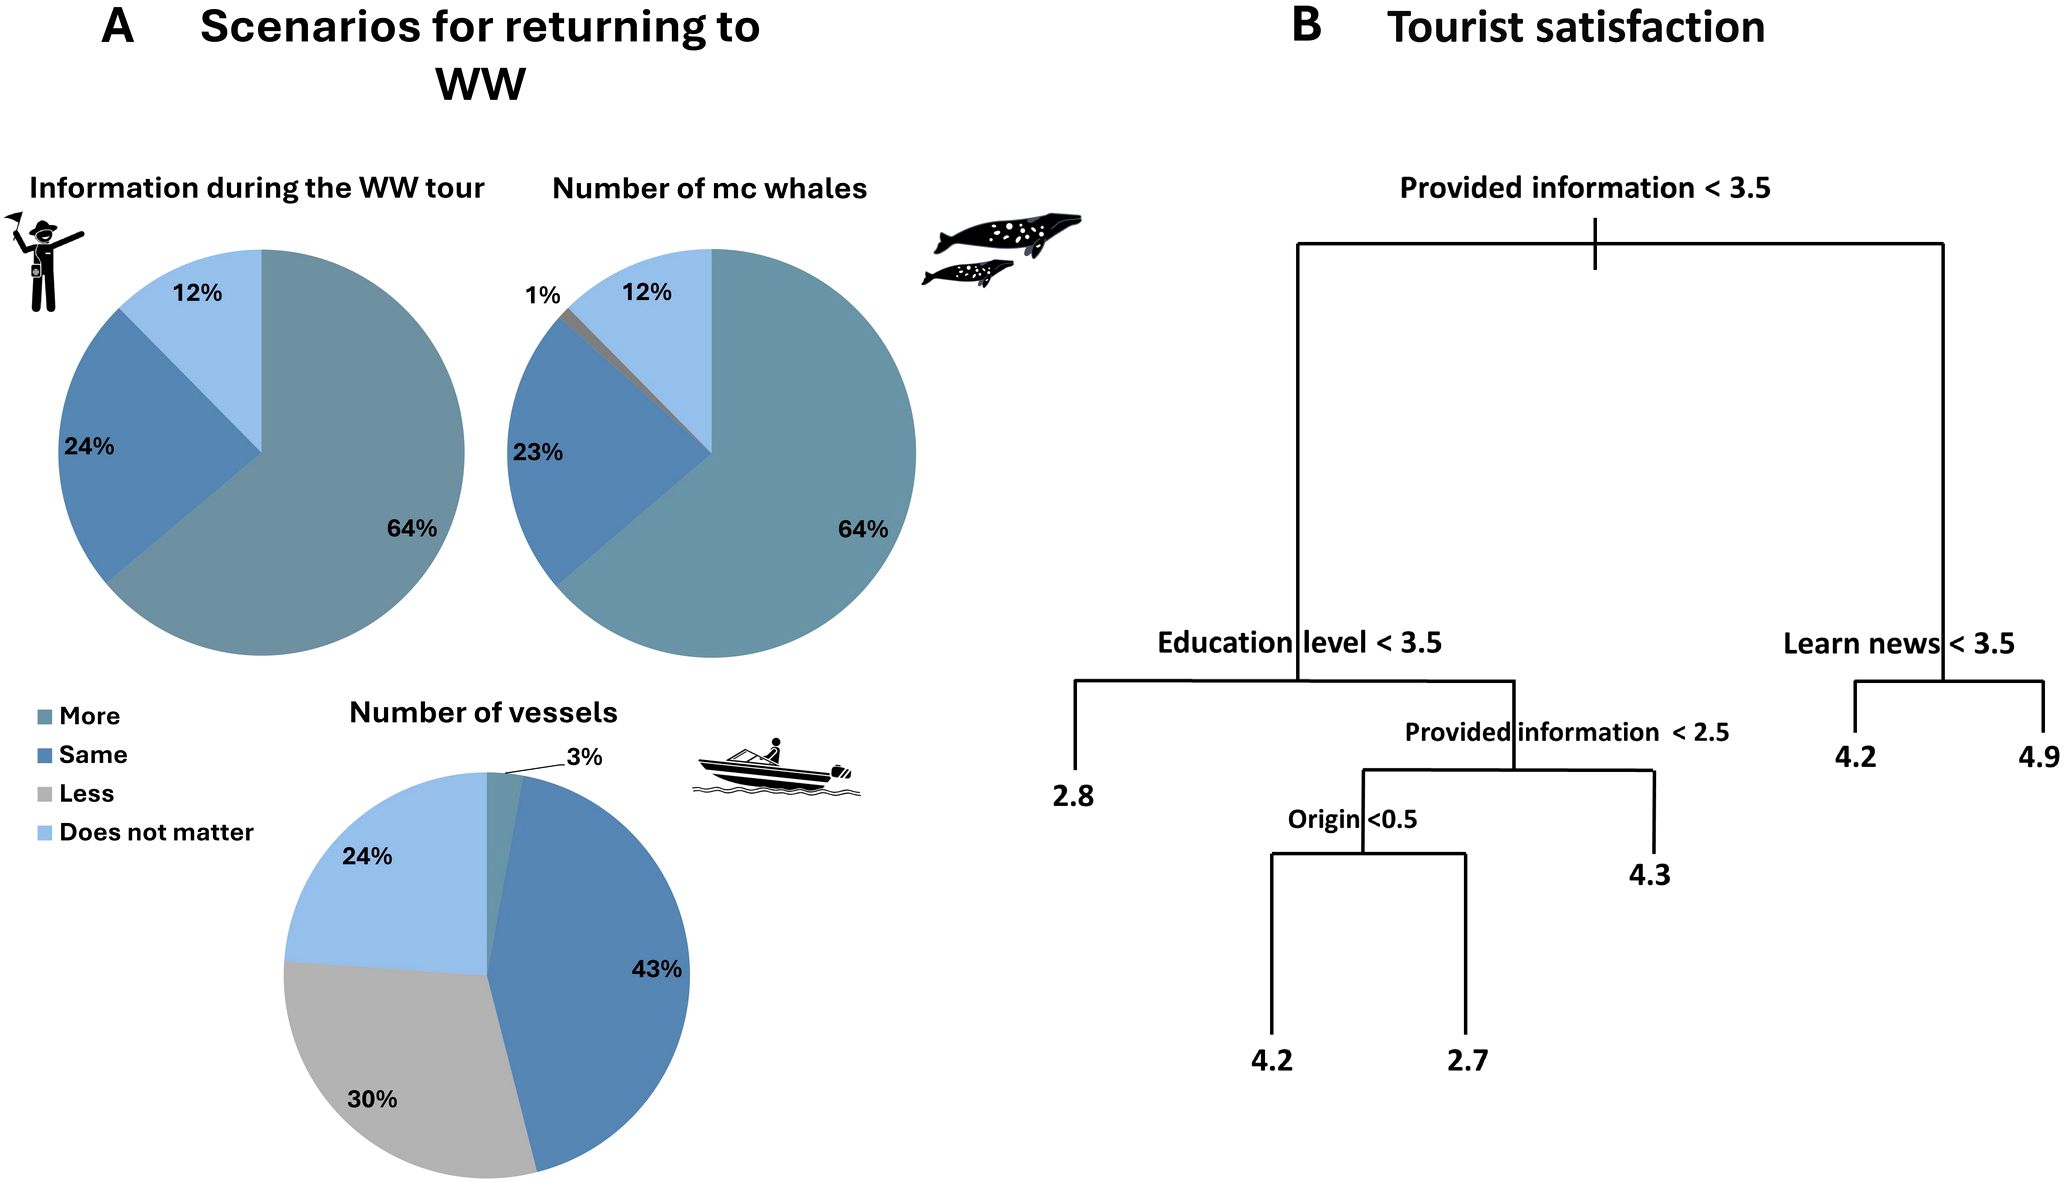
Figure 6. (A) (left) Percentage of total tourists who would return for whale watching under different scenarios, considering the amount of information provided during the tour, the number of whales in the lagoon, and the number of boats in the observation area. (B) (right) Relationship between tourist satisfaction and activities during the whale-watching event.
According to the correlation tree analysis, tourist satisfaction was primarily associated with the level of satisfaction with the information provided during the tour (Figure 6B). This factor served as the main determinant of satisfaction, indicating that tourists who felt adequately informed during the whale-watching tour were more likely to report higher levels of satisfaction. According to the conditions shown by the correlation tree, the highest degree of tourist satisfaction (4.9 out of a scale of 5) was obtained when there was medium to high satisfaction with the information received (>= 3.5, right branch of the tree) and subsequently, if tourists considered themselves moderately to highly in agreement with having learned new information during the tour (>= 3.5 out of a scale of 5). This suggests that tourists who felt they gained new insights or knowledge during the experience had higher satisfaction (Figure 6B). The next level of satisfaction was related to the tourists’ educational level. Tourists with university or postgraduate education who had satisfaction with the information received equal to or greater than the average (>= 2.5 out of 5) reported being moderately to highly satisfied with the activity (4.3 out of 5). Another important factor is whether the respondents were local or foreign tourists (national or international). Interestingly, it was found that Mexicans from outside Baja California Sur (BCS) were less satisfied with the information received than local tourists. This distinction highlights the importance of considering cultural or regional differences in tourists’ expectations and experiences during whale-watching tours. It is worth noting that factors related to information and learning something new are found in three of the five nodes of the tree, including the main node, highlighting the importance of these factors in tourists’ overall satisfaction with the WW activity.
Once the data from the ecological and socioeconomic subsystems were analyzed, the results were presented in the fourth participatory workshop, following feedback from each section, through brainstorming sessions and focus groups. Among the participants, whom tour operators mostly represented, some civil associations, and representatives of CONANP, we consolidated the mental model of the social-ecological system of whale watching on a medium or meso scale that includes the three localities of the Bahía Magdalena–Bahía Almejas Complex, integrating various ecological and socioeconomic components to understand their interactions and responses to changes over time (Figure 7).
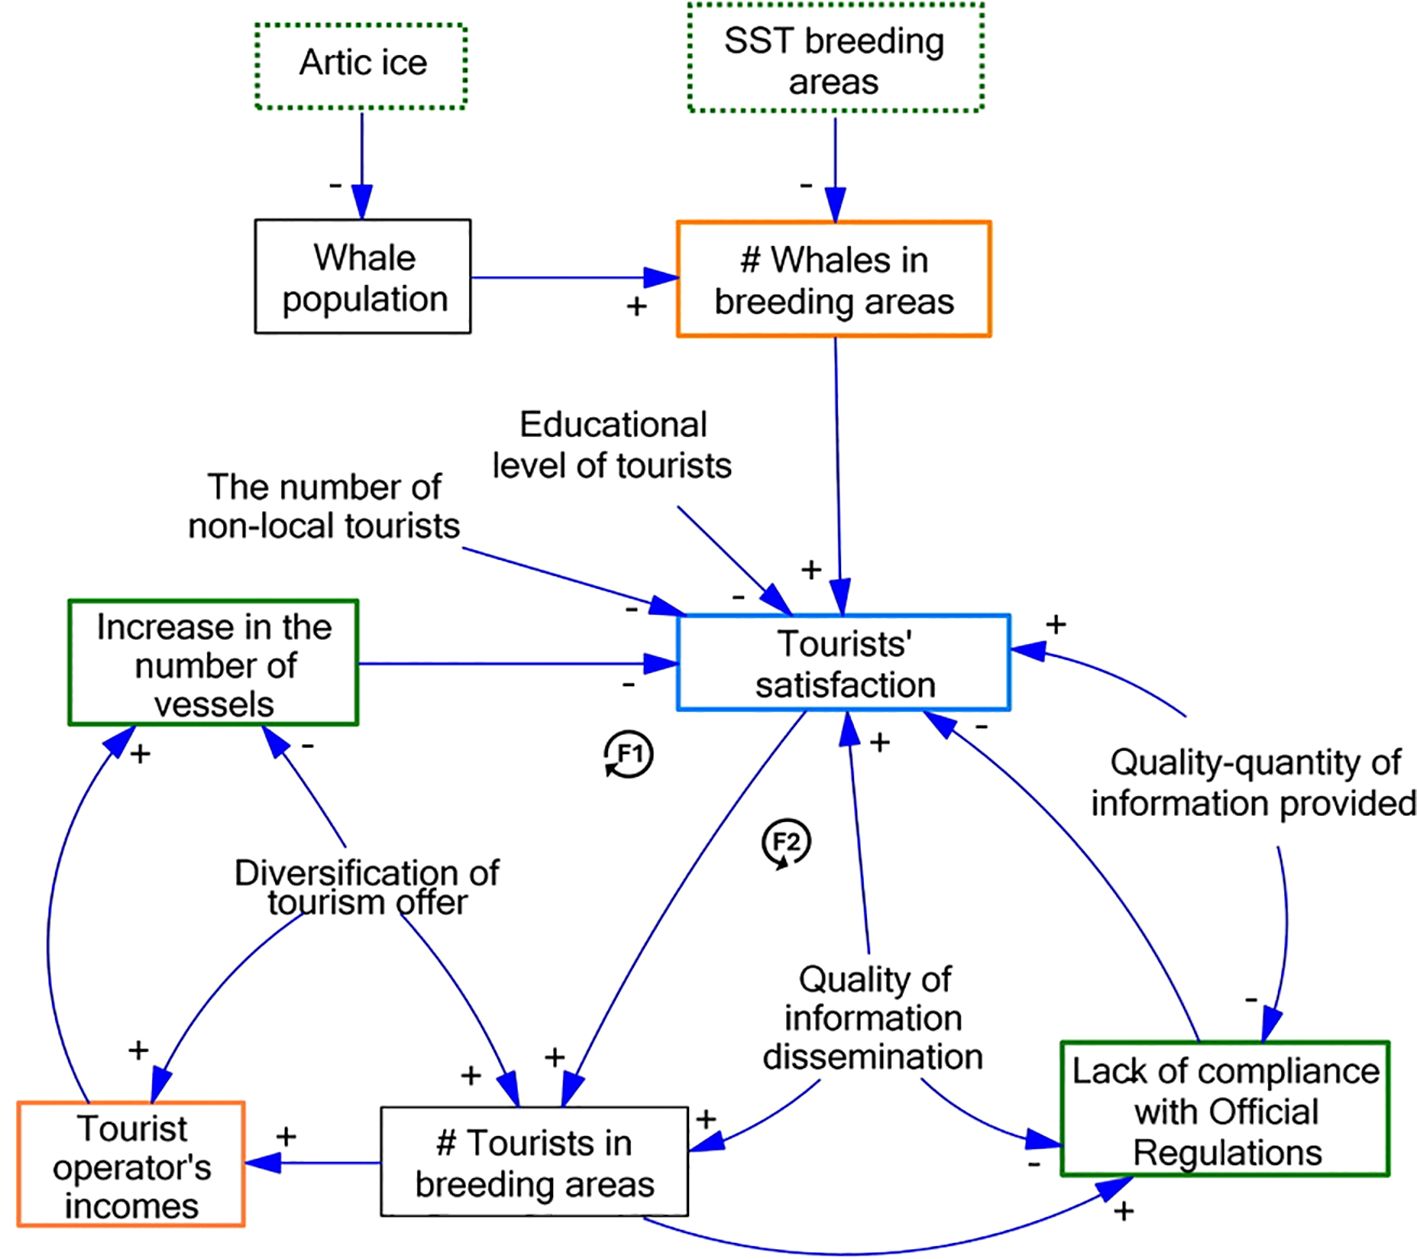
Figure 7. The mental model of the SES for gray whale watching in the BMAC. The main variables determining the system’s desired state are enclosed in a box. Variables determining the system’s resilience are enclosed in orange. The main internal stressor variables of the system are enclosed in a green box, and external stressors are indicated with a dashed green line. The variable encompassing the system’s responses to both resilience and internal stressors is in blue. Arrows in the model and the signs indicate the direction of influence (one factor increases, and the other increases or decreases). F1 and F2 are the feedback loops.
We found that resilience in this SES is defined by the system’s ability to sustain economic activity over time while facing its main stressor: the effect of climate change on gray whales. Climatic variables such as ice levels in the feeding area and sea surface temperature in the breeding areas influence the number and condition of whales visiting the bays, serving as input variables and identified as external stressors to the system over which we have no control. The state of the biological component, represented by the number of whales, is related to actions that can make the SES resilient.
Tourist satisfaction emerges as a central variable within the SES, influencing and being influenced by most of the other variables. Satisfaction is a variable that balances the two indicators of the resilience of the activity: the number of whales and the economic income of tour operators. Satisfaction is strongly linked to the information provided by tour operators, with increased quantity and quality of information increasing satisfaction and potentially fostering greater environmental awareness among tourists. Additionally, improving the information used in marketing campaigns to promote the activity can lead to better compliance with regulations and reduce the pressure on tour operators to get closer to the whales. We did not lose sight of the fact that satisfaction is also influenced by the educational level of tourists; the higher the education, the greater their demand, and it is also higher among non-local tourists (non-residents of B.C.S.) (Figure 7).
Tourist preferences support efforts to control the increase in the number of vessels in the whale-watching area, which could improve satisfaction. Additionally, diversifying tourist activities in each locality could reduce the number of vessels dedicated exclusively to whale watching, allowing for better organization and compliance with regulations even with fewer whales (Figure 7).
Two main causal relationships were identified between elements, defined as feedback loops in the SES mental model. These elements are connected in such a way that if we follow the causality starting from any element in the loop, we can eventually return to the first element. The first feedback loop (F1) is defined by the relationship between the increase in tourists and economic income and whether this generates a higher number of vessels watching whales simultaneously, which would negatively affect tourist satisfaction. The second feedback loop (F2) is defined by the effect on satisfaction from poor practices that lead to non-compliance with official regulations due to increased tourism (Figure 7). Overall, the mental model provides information on the complex interactions within the SES of whale watching in a simple and easily understandable way, and helps to emphasize the importance of adaptive management strategies to ensure the resilience of both the economic activity and the whale populations in the area.
4 Discussion
This study contributes significantly to understanding the social-ecological system (SES) of gray whale watching in Mexico. It involved developing a mental model of the system that incorporates ecological variables, such as the temporal trend of whale counts in breeding and calving lagoons, population estimates, and the intricate relationship between gray whales and environmental changes. Additionally, it integrates social variables such as the temporal behavior of tourism and compliance with official regulations. It also analyzes variables associated with tourist satisfaction, aiming for a more resilient and sustainable system. Research focused on SES, which integrally incorporates ecological and socioeconomic aspects in marine environments, is limited but crucial (Refulio-Coronado et al., 2021). Since economic activities are closely linked to the environment, strategies must strengthen vulnerable components against regime shifts or persistent pressures (Hummel et al., 2011).
In our study, we analyzed ecological and socioeconomic factors at the local level; however, we identified key system factors that influence a medium or meso scale similarly across the three breeding lagoons of the BMAC and their corresponding localities that conduct WW. Components of the ecological subsystem, such as the decline of whales in WW areas, and those of the socioeconomic subsystem, such as tourist satisfaction, non-compliance with regulations, economic income, and the increase in vessels observing whales, are represented through a mental model that illustrates the interactions and feedback within the SES of gray whale watching in the BMAC (Groesser and Schaffernicht, 2012). This holistic and participatory approach, involving various sources of information and stakeholders, enhances the resilience of the SES (Berkes, 2012; Refulio-Coronado et al., 2021).
The study reveals an eight-year long-term trend of gray whale counts in the breeding and nursing lagoons of the BMAC, reflecting a clear trend of declining mother-calf pairs in all lagoons and an apparent increase in single whales in the two southernmost lagoons. In recent years, a historically low drop in the maximum count of mother-calf pairs and a stagnation in the counts of single whales correspond with the years of the recent UME (2019-2022) of gray whales (Eguchi et al., 2023a). The recent UME has been associated with changes in climatic conditions in the feeding areas (Stewart et al., 2023). These changes in the gray whale feeding area have been associated with the extent of Arctic ice, which influences the physical accessibility of gray whales to feeding areas. Although a negative relationship has been observed between high ice densities (more than 45 to 55%) and gray whale counts (Stewart et al., 2023), especially calf production, recent lower estimates do not align with this pattern (Perryman et al., 2020). These discrepancies suggest that the recent mortality event and changes in calf production may be differently linked to ice conditions and other factors (Perryman et al., 2020; Stewart et al., 2023). Recent studies have estimated the carrying capacity of the feeding area and calf production in relation to ice cover and access to feeding areas, incorporating benthic crustacean biomass as an explanatory variable indicative of food availability. While ice accessibility remains crucial, a clearer trend emerges when comparing the carrying capacity of gray whales and calf production with food biomass (Stewart et al., 2023). Latitudinal shifts have also been observed, with ice moving northward, leading to decreased productivity in the Bering Strait and increased productivity further north (Frey et al., 2022; Grebmeier et al., 2018). These changes in the Arctic could be related to a decrease in per capita biomass of gray whale prey, which could affect the whale population (Stewart et al., 2023) and their migration.
On the other hand, Baja California peninsula serves as vital habitat for winter aggregations of gray whales in breeding lagoons. These lagoons provide refuge in their protected waters of the Pacific Ocean for specific mating and lactation events. Whales favor them due to their latitudinal gradient of warmer temperatures, allowing calves to maintain their body temperature while accumulating fat from maternal milk (Sumich, 1986; Swartz, 1986). The lagoons are separated by approximately one degree of latitude for the nearest and northernmost (Laguna Ojo de Liebre and Laguna San Ignacio) and three degrees for the furthest (L. Ojo de Liebre and BMAC). Historically, the northernmost lagoon closest to the feeding areas tends to host the highest number of whales, followed by the middle zone (L. San Ignacio), and finally, the area with the lowest proportion of whales is BMAC. However, these proportions show certain variations over the years (Salvadeo et al., 2015; Urbán et al., 2003b).
In general, global sea surface temperature is increasing and is expected to continue rising due to global climate change, with projections ranging from 0.6 to around 3°C, depending on the scenario (IPCC, 2019). Consequently, current tropical zones are expected to expand to higher latitudes, temperate zones will shift toward the poles, and polar zones will contract. Many species, including whales, are expected to move toward the poles in search of optimal temperature conditions, potentially altering their migration patterns; in the case of gray whales, potentially shortening the migratory route (García-Molinos et al., 2015; van Weelden et al., 2021). In particular, the North Pacific Ocean has been identified as one of the three oceans that harbor marine mammal species most vulnerable to global warming, with the gray whale being the second most vulnerable species, even under a low greenhouse gas emissions scenario (RCP 2.6) (Albouy et al., 2020).
The declining trends in gray whales shown in this study, especially mother-calf pairs, may be due to physiological stress from food reduction (Christiansen et al., 2021) and changes in the temperature of breeding and nursing areas. Studies suggest that during colder years associated with La Niña conditions, whales tend to migrate further south, reaching areas like Los Cabos in the Gulf of California and even Bahía de Banderas in Nayarit, Mexico. Conversely, during warmer years related to ENSO conditions, fewer mother-calf pairs have been observed in the Santo Domingo Channel in the BMAC region (Salvadeo et al., 2013). It is likely that with warmer anomalies in the sea surface temperature, mother-calf pairs do not migrate as far south. These latitudinal changes in the presence of gray whale mother-calf pairs in relation to sea surface temperature are especially evident in the southernmost breeding and nursing area, which corresponds to the study area of this research (Salvadeo et al., 2013). Therefore, alternative management strategies are needed to increase specific resilience and adapt to these fluctuations in whale numbers and a potentially significant historical decline (Lambert et al., 2010; Sousa et al., 2023). The strategies must ensure that the activity does not negatively impact gray whales and that economic revenues are maintained at least at the current levels.
Regarding the social subsystem, tourist satisfaction emerges as a central variable in the SES mental model, linking various aspects of whale watching and balancing the two indicators of system resilience, the number of whales and the income of tour operators. The external stressors of the system are composed of climatic conditions that affect the number of whales, and therefore there are no variables that can influence them. However, we identified two internal stressors: the lack of compliance with official whale-watching regulations and the simultaneous increase in boats watching whales.
Among the variables that influence tourist satisfaction, the number of whales sighted has been identified as one of the most significant (Lee et al., 2019; Suárez-Rojas et al., 2022). However, during interactions with tourists, most indicated that they would understand the situation if the current status of the whales was explained during the tour. It has been previously noted that tourists value interpretive services in whale watching (Lee et al., 2019). Satisfaction was also directly influenced by the quality of information received during the WW trip. Information is an important element for tourist satisfaction and serves as an indicator of sustainability (Tavares et al., 2018; Naidoo et al., 2011). Educational information for tourists enhances their concern for animal welfare and responsible behavior, which can help improve whale-watching practices (Suárez-Rojas et al., 2022). It is common around the world to use tour guides as communicators of the country, its offerings, laws, norms, regulations, expected behavior patterns, and the quality of guide services is usually important for the final satisfaction of tourists (Sandaruwani and Gnanapala, 2016). However, in none of the three communities studied here is a tour guide service, so we recommend training local guides to reinforce tourists’ pro-environmental perceptions by facilitating awareness, reflection, and appreciation by local people working as guides (Walker and Weiler, 2017).
Ensuring accurate marketing information before the trip and managing tourists’ expectations is essential. It is also important to consider that tourists’ pressure to interact closely with whales is influenced by disseminated images on internet government pages (Cho et al., 2014; Sheungting Lo and McKercher, 2016). In this study, tour operators mentioned feeling pressure from tourists who insisted on getting too close to the whales to increase their chances of touching them. We believe that the quality of disseminated information is a factor influencing tourists’ expectations and satisfaction (Sheungting Lo and McKercher, 2016).
This study also observed a lack of compliance with regulations, especially regarding certain infractions such as the approach trajectory to the whales, the maximum observation time, and the navigation speed. Although there is generally no high appreciation of non-compliance with these guidelines by tourists, this may be due to their lack of awareness of the regulations due to the lack of information shared by operators. In other parts of the world, tourists have indicated they are willing to pay more for WW tours that ensure the safety of the observed animals, especially respecting navigation speed (Suárez-Rojas et al., 2022). Sharing information is important for compliance with guidelines and tourists might even accept an increase in observation distance if they were informed about the potential impacts on whale welfare (Kessler et al., 2014). In other regions, tour operators have considered regulatory compliance as an important factor within the conceptualization of the SES of whale watching in the face of climate change, as this could reduce pressure on the whales (Meynecke et al., 2017).
Tourists mentioned being willing to return under the scenario of maintaining or reducing the number of vessels watching whales simultaneously. Previous studies conducted in Bahía de Banderas, Mexico, found that perceived crowding by tourists negatively affects the likelihood of tourists returning for a whale-watching trip (Avila-Foucat et al., 2013). Crowding impacts satisfaction in other recreational activities (Needham et al., 2011), so it is important to consider satisfaction with vessel crowding when designing coastal management policies. Despite the official standard indicating that only four vessels can watch whales at the same time, two is the optimal number of vessels for tourist satisfaction (Avila-Foucat et al., 2013). Since tourism continues to grow, regulating the number of vessels in the water has been very complicated for service providers, as it would require many tourists to wait a long time in the water. Different management recommendations have been issued, such as codes of conduct, zoning, closure areas, seasonal timing, vessel permits, and performance and education programs (Avila-Foucat et al., 2013; Casis-García, 2010).
Collaboration between tour operators, authorities, and researchers is vital for adaptive management (Dimmock et al., 2014; Garrod and Fennell, 2004; Lusseau, 2014). Maintaining communication channels, providing updated information, ensuring that operators’ economic income remains unchanged regardless of the number of whales, and implementing collaborative actions can improve operators’ satisfaction and facilitate adaptive management based on the current state of the whales (Meynecke et al., 2017; Richards et al., 2021; Sousa et al., 2023). In Mexico, the number of whale-watching permits does not have a specific directive. The number of permits has been previously used to measure adaptive management, considering specific population aspects (Organ et al., 2012; Runge et al., 2013). Achieving an equitable distribution of economic benefits among community stakeholders and implementing monitoring and surveillance mechanisms is essential. Also, the impact of the COVID-19 pandemic on whale-watching tourism remains uncertain, but a resurgence is expected due to pent-up demand and remote work trends (Adelman, 2022; Feng and Xia, 2022; Mckercher, 2021; Vogler, 2021). This study shows a significant resurgence in WW tourism activity in 2023.
Adapting best practices to local conditions can minimize negative impacts on organisms and ensure the sustainability of whale-watching tourism (Gómez-Gallardo Unzueta et al., 2023). There are some examples of integrated management strategies that work in whale watching. Tour operators in Laguna San Ignacio, Baja California Sur, Mexico (the northernmost breeding lagoon of the gray whale), have established since the beginning of the activity in the 1990s a Rural Association of Collective Interest (ARIC) (Gómez-Gallardo Unzueta et al., 2023). This organization, comprised by the tour operators themselves, has allowed them to organize and establish internal guidelines, such as the maximum number of vessels that can navigate simultaneously; only 16 vessels can practice whale watching at the same time in the entire authorized area, regardless of the number of permits, which tends to increase annually. Additionally, each vessel can remain in the water for a maximum of 90 minutes, and they have an operator who acts as an onboard observer dedicated solely to ensuring compliance with the guidelines; otherwise, they communicate via radio with the violating vessel (Amerson and Parsons, 2018; Gómez-Gallardo Unzueta et al., 2023). Similarly, blue whale (Balaenoptera musculus) watching in Loreto, Baja California Sur, Mexico, has specifications generated in collaboration between tour operators and researchers, established in the “Management Program of the Bahía de Loreto National Park” (DOF, 2019).
Studies analyzing tourism activities as SES, combining environmental and social sciences interdisciplinarily, are few and recent (Miller et al., 2022; Richards et al., 2021; Sumanapala and Wolf, 2019). For over a decade, the importance of analyzing the resilience of whale watching to climate change has been discussed (Lambert et al., 2010). However, few studies have analyzed it (Meynecke et al., 2017; Richards et al., 2021; Sousa et al., 2023). These studies have been conducted through participatory workshops and bibliographic data, primarily in Meynecke et al. (2017) and Richards et al. (2021). However, they have not used in situ data on tourist characteristics and satisfaction, nor how the activity’s compliance with regulations and adequate information can influence the resilience of WW to climate change. Therefore, we recommend making efforts to indicate tourists’ preferences to analyze their intersection with other factors that will help ensure the resilience of this activity. It is also important to consider actions directed to animal welfare, such as compliance with regulations, especially in cases like the gray whale, which is already suffering the effects of climate change. Additionally, analyzing different migratory destinations of the same whale population helps understand similarities and differences between localities, which can, in turn, conceptualize an SES that encompasses medium-scale interactions of common factors as described here.
While our study sheds light on the SES of gray whale watching, it is not exhaustive. Knowing some additional factors could help better understand the SES, such as the fixed and variable costs for operators to carry out the activity (Sousa et al., 2023), and possible changes in the whales’ migration timing (Richards et al., 2021). Continuous feedback and stakeholder collaboration can refine understanding and contribute to adaptive management agreements. Our mental model and all the gathered information can serve as a basis for future mathematical models, such as dynamic systems modeling (Richards et al., 2021), which has even been used to evaluate the effect of management decisions in gray whale watching in Ojo de Liebre, Mexico (Rodríguez-Izquierdo et al., 2019). This would allow quantitative explorations of the adaptive responses of the SES to different scenarios, understanding its thresholds and feedback loops, particularly in policy applications (Kwakkel and Pruyt, 2013).
5 Conclusion
The present mental model provides an analytical framework for understanding the dynamics of whale watching, particularly in unique locations such as the communities of the Bahía Magdalena–Bahía Almejas Lagoon Complex, and its correlation with changes in the population dynamics of gray whales attributed to recent climatic changes. This knowledge has the potential to guide adaptive management decisions, prioritizing benefits for the entire community and long-term economic stability while mitigating adverse impacts on whale populations. This study lays the foundation for developing joint strategies to improve resilience and sustainability within the tourism sector by initiating discussions and fostering collaboration among stakeholders. Additionally, it serves as a cornerstone for implementing mathematical methodologies to evaluate scenarios and determine critical system thresholds.
Data availability statement
The raw data supporting the conclusions of this article will be made available by the authors, without undue reservation.
Ethics statement
Ethical approval was not required for the studies involving humans because the people involved participated voluntarily and their identity and responses to the interviews are kept confidential. The studies were conducted in accordance with the local legislation and institutional requirements. The participants provided their written informed consent to participate in this study. Ethical approval was not required for the study involving animals in accordance with the local legislation and institutional requirements because this study was fully observational following the “Guidelines for the treatment of marine mammals in field research,” supported by the Society for Marine Mammalogy (Gales et al., 2009). Written informed consent was obtained from the individual(s) for the publication of any potentially identifiable images or data included in this article.
Author contributions
OG: Conceptualization, Data curation, Formal analysis, Funding acquisition, Investigation, Methodology, Project administration, Resources, Software, Supervision, Validation, Visualization, Writing – original draft, Writing – review & editing. LV: Conceptualization, Methodology, Project administration, Supervision, Writing – original draft, Writing – review & editing. VA: Formal analysis, Methodology, Writing – review & editing. EV: Data curation, Formal analysis, Methodology, Writing – review & editing. MA: Data curation, Formal analysis, Methodology, Supervision, Visualization, Writing – review & editing. GQ: Methodology, Writing – review & editing. JR: Funding acquisition, Project administration, Writing – review & editing. SS: Funding acquisition, Project administration, Writing – review & editing. EM: Conceptualization, Supervision, Writing – original draft, Writing – review & editing.
Funding
The author(s) declare financial support was received for the research, authorship, and/or publication of this article. Data collection for this research was partially funded by the Scientific Monitoring Project of the San Ignacio Lagoon Ecosystem Scientific Program and the Rufford Foundation (project number 35804-2). This work was possible thanks to the support of CONAHCYT to OG-C with Scholarship No. 823353 and Registration No. 522005220. The publication fee was covered by the Instituto de Biologı́a of the Universidad Nacional Autónoma de México and by the San Ignacio Lagoon Ecosystem Scientific Program.
Acknowledgments
We thank the tour operators of Puerto A. López Mateos, Puerto San Carlos, and Puerto Chale, as well as Jesús Porras from the Directorate of Biosphere Reserve of Pacific Islands in the Baja California Peninsula of the National Commission of Protected Natural Areas (CONANP). A special acknowledgment to Alejandra Galindo, MSc, from the Institute of Ecology, A.C. (INECOL), for her language editing. OG-C thanks the Graduate School of Sustainability Sciences of the National Autonomous University of Mexico for the support during his graduate studies. This publication is a requirement for his PhD program.
Conflict of interest
The authors declare that the research was conducted in the absence of any commercial or financial relationships that could be construed as a potential conflict of interest.
The author(s) declared that they were an editorial board member of Frontiers, at the time of submission. This had no impact on the peer review process and the final decision.
Publisher’s note
All claims expressed in this article are solely those of the authors and do not necessarily represent those of their affiliated organizations, or those of the publisher, the editors and the reviewers. Any product that may be evaluated in this article, or claim that may be made by its manufacturer, is not guaranteed or endorsed by the publisher.
Supplementary material
The Supplementary Material for this article can be found online at: https://www.frontiersin.org/articles/10.3389/fcosc.2024.1397204/full#supplementary-material
References
Adelman R. A. (2022). “Enduring COVID-19, nevertheless,” in The Cultural Politics of COVID-19. Eds. Nguyet Erni J, Striphas T (New York: Routledge), 259–271. doi: 10.1038/s41598-019-57280-310.4324/9781003310419-24
Ajzen I. (1991). The theory of planned behavior. Organizational Behav. Hum. Decision Process 50, 179e211. doi: 10.1016/0749-5978(91)90020-T
Albouy C., Delattre V., Donati G., Frölicher T. L., Albouy-Boyer S., Rufino M., et al. (2020). Global vulnerability of marine mammals to global warming. Sci. Rep. 10, 1–12. doi: 10.1038/s41598-019-57280-3
Álvarez-Borrego S., Galindo-Bect L. A., Chee-Barragán A. (1975). Caracter sticas hidroqu micas de Bah a Magdalena, B. C. S. Ciencias Marinas 2 (2), 94–110. doi: 10.7773/CM.V2I2.285
Amerson A., Parsons E. (2018). Evaluating the sustainability of the gray-whale-watching industry along the pacific coast of North America. J. Sustain. Tour. 26, 1362–1380. doi: 10.1080/09669582.2018.1449848
Avila-Foucat V. S., Sánchez Vargas A., Frisch Jordan A., Ramírez Flores O. M. (2013). The impact of vessel crowding on the probability of tourists returning to whale watching in Banderas Bay, Mexico. Ocean Coast. Manage. 78, 12–17. doi: 10.1016/j.ocecoaman.2013.03.002
Bejder L., Samuels A., Whitehead H., Gales N. (2006). Interpreting short-term behavioural responses to disturbance within a longitudinal perspective. Anim. Behav. 72, 1149–1158. doi: 10.1016/j.anbehav.2006.04.003
Biggs R., Schlüter M., Biggs D., Bohensky E. L., Burnsilver S., Cundill G., et al. (2012). Toward principles for enhancing the resilience of ecosystem services. Annu. Rev. Environ. Resour. 37, 421–448. doi: 10.1146/annurev-environ-051211-123836
Bizzarro J. J. (2008). A review of the physical and biological characteristics of the bahía magdalena lagoon complex (Baja California Sur, Mexico). Bull. S. Calif. Acad. Sci. 107, 1–24. doi: 10.3160/0038-3872(2008)107[1:AROTPA]2.0.CO;2
Blangiardo M., Cameletti M., Baio G., Rue H. (2013). Spatial and spatio-temporal models with R-INLA. Spat. Spatiotemporal Epidemiol., 39–55. doi: 10.1016/j.sste.2012.12.001
Breiman L., Friedman J. H., Olshen R. A., Stone C. J. (2017). Classification and regression trees (New York: Chapman and Hall/CRC), 1–358. doi: 10.1201/9781315139470
Carpenter S. R., Gunderson L. H. (2001). Coping with collapse: Ecological and social dynamics in ecosystem management. BioScience 51, 451–457. doi: 10.1641/0006-3568(2001)051[0451:CWCEAS]2.0.CO;2
Casis-García J. A. (2010). Defining a policy for the sustainable management of whale watching activities in Mexico through the estimation of tourist’s willingness to pay. School of geosciences. University of Edinburgh., Integrated Resource Management, Escocia.
Chan J. C. L., Shi J.-E. (1997). Application of projection-pursuit principal component analysis method to climate studies. Int. J. Clim. 17, 103–113. doi: 10.1002/(SICI)1097-0088(199701)17:1%3C103::AID-JOC108%3E3.0.CO;2-1
Cho H.-S., Byun B., Shin S. (2014). An examination of the relationship between rural tourists’ satisfaction, revisitation and information preferences: A Korean case study. Sustainability. 6, 6293–6311. doi: 10.3390/su6096293
Chontasi-Morales F. D., Noguera-Benalcázar D. J., Ortega-Vásconez D. P., Chicaiza-Guaman M. T., Naula-Morillo L. A., Duarte-Victorero D. C., et al. (2021). Resiliencia socio-ecológica: una perspectiva teórico-metodológica para el turismo comunitario. Siembra. 8, 13. doi: 10.29166/SIEMBRA.V8I2.2967
Christiansen F., Rodríguez-González F., Martínez-Aguilar S., Urbán J., Swartz S., Warick H., et al. (2021). Poor body condition associated with an unusual mortality event in gray whales. Mar. Ecol. Prog. Series. 658, 237–252. doi: 10.3354/meps13585
Cisneros-Montemayor A. M., Sumaila U. R., Kaschner K., Pauly D. (2010). The global potential for whale watching. Mar. Policy 34, 1273–1278. doi: 10.1016/j.marpol.2010.05.005
Dimmock K., Hawkins E. R., Tiyce M. (2014). Stakeholders, industry knowledge and adaptive management in the Australian whale-watching industry. J. Sustain. Tourism 22, 1108–1121. doi: 10.1080/09669582.2013.879311
DOF (2011). Norma oficial mexicana NOM-0131-SEMARNAT-2010. Available online at: https://www.dof.gob.mx/nota_detalle.php?codigo=5214459&fecha=17/10/2011. (accessed September 09, 2024).
DOF (2012). AVISO mediante el cual se da a conocer al público en general la temporada 2012-2013 para llevar a cabo actividades de observación de ballenas. Available online at: https://dof.gob.mx/nota_detalle.php?codigo=5270222&fecha=26/09/2012#gsc.tab=0. (accessed September 09, 2024).
DOF (2019). ACUERDO por el que se da a conocer el resumen del Programa de Manejo del Parque Nacional Bahía de Loreto. Available online at: https://www.dof.gob.mx/nota_detalle.php?codigo=5558313&fecha=23/04/2019#gsc.tab=0.
Eguchi T., Lang A. R., Weller D. W. (2023a). NOAA technical memorandum NMFS abundance of eastern north Pacific gray whales 2022/2023. (La Jolla: Department of Commerce, NOAA) doi: 10.25923/n10e-bm23
Eguchi T., Lang A. R., Weller D. W. (2023b). NOAA Technical Memorandum NMFS Eastern north pacific gray whale calf production 1994-2023 (La Jolla: Department of Commerce, NOAA). doi: 10.25923/e9at-x936
Feng J. W., Xia L. (2022). Revenge travel: nostalgia and desire for leisure travel post COVID-19. J. Travel Tour. Market. 38, 935–955. doi: 10.1080/10548408.2021.2006858
Fleischer L., Guerrero -Esperanza M., Contreras-Tapia J. (1995). Censos de ballena gris (Eschrichtius robustus) en la zona norte de Magdalena, B.C.S., Mexico, (1983-1987). Available online at: http://www.enip.com.mx/ap1-1.pdf. (accessed September 09, 2024).
Folke C., Carpenter S. R., Walker B., Scheffer M., Chapin T., Rockström J. (2010). Resilience thinking: Integrating resilience, adaptability and transformability. Ecol. Soc. 15, 20. doi: 10.5751/ES-03610-150420
Frey K. E., Kinney J. C., Stock L. V., Osinski R. (2022). Observations of declining primary productivity in the western Bering strait. Oceanography 35. doi: 10.5670/OCEANOG.2022.123
Frid A., Dill L. (2002). Human-caused disturbance stimuli as a form of predation risk. Conser. Ecol. 1, 258–261. doi: 10.5751/ES-00404-060111.1016/S0723-2020(86)80016-9
Gales N. J., Bowen W. D., Johnston D. W., Kovacs K. M., Littnan C. L., Perrin W. F., et al (2009). Guidelines for the treatment of marine mammals in field research. Mar. Mammal Sci. 25 (3), 725–736. doi: 10.1111/J.1748-7692.2008.00279.X
García-Molinos J., Halpern B. S., Schoeman D. S., Brown C. J., Kiessling W., Moore P. J., et al. (2015). Climate velocity and the future global redistribution of marine biodiversity. Nat. Clim. Change. 6, 83–88. doi: 10.1038/nclimate2769
Gardner S. C., Chavez-Rosales S. (2000). Changes in the relative abundance and distribution of gray whales (Eschrichtius robustus) in Bahía Magdalena, Mexico during an El Niño event. Mar. Mamm. Sci. 16, 728–738. doi: 10.1111/j.1748-7692.2000.tb00968.x
Garrod B., Fennell D. A. (2004). An analysis of whale watching codes of conduct. Ann. Tourism Res. 31, 334–352. doi: 10.1016/J.ANNALS.2003.12.003
Gómez-Gallardo Unzueta A., Swartz S., Martínez Aguilar S. (2023). Observación de ballena gris en Laguna San Ignacio: Una historia que vale la pena multiplicar. Panorama (UABCS). Available online at: https://difusion.uabcs.mx/documentos/revistaPanorama/Panorama%20digital%20revista%20No%207.pdf. (accessed September 09, 2024).
Grebmeier J. M., Frey K. E., Cooper L. W., Kędra M. (2018). Trends in benthic macrofaunal populations, seasonal sea ice persistence, and bottom water temperatures in the bering strait region. Oceanography 31, 136–151. doi: 10.5670/OCEANOG.2018.224
Greenacre M., Groenen P. J. F., Hastie T., D’Enza A. I., Markos A., Tuzhilina E., et al. (2023). Publisher Correction: Principal component analysis. Nat. Rev. Methods Primers. 3, 1–1. doi: 10.1038/s43586-023-00209-y
Groesser S. N., Schaffernicht M. (2012). Mental models of dynamic systems: taking stock and looking ahead. Syst. Dyn. Rev. 28, 46–68. doi: 10.1002/sdr.476
Higham J., Bejder L., Lusseau D. (2009). An integrated and adaptive management model to address the long-term sustainability of tourist interactions with cetaceans. Environ. Conser. 35, 294–302. doi: 10.1017/S0376892908005249
Higham J., Bejder L., Williams R. (2014). “Tourism, cetaceans and sustainable development: Moving beyond simple binaries and intuitive assumptions,” in Whale-watching Sustainable Tourism and Ecological Management. Eds. Higham J., Bejder L., Williams R. (Cambridge: Cambridge University Press), 1–16. doi: 10.1017/CBO9781139018166.001
Hoyt E. (2005). Sustainable ecotourism on Atlantic islands, with special reference to whale watching, marine protected areas and sanctuaries for cetaceans. Biol. Environ. 105, 141–154. doi: 10.3318/BIOE.2005.105.3.141
Hoyt E., Parsons E. C. M. (2014). “The whale-watching industry: Historical development,” in Whale-watching: Sustainable Tourism and Ecological Management. Eds. Higham J., Bejder L., Williams R. (Cambridge: Cambridge University Press), 57–70. doi: 10.1017/CBO9781139018166.006
Hummel D., Jahn T., Keil F., Liehr S., Stieß I. (2017). Social ecology as critical, transdisciplinary science-conceptualizing, analyzing and shaping societal relations to nature. Sustainability (Switzerland) 9, 20. doi: 10.3390/su9071050
Hummel D., Jahn T., Schramm E. (2011). Social-ecological analysis of climate induced changes in biodiversity-outline of a research concept. BiK-F Knowledge Flow. 11. Available at: https://d-nb.info/1013518705/34.
IPCC. (2019). “Technical summary,” in IPCC Special Report on the Ocean and Cryosphere in a Changing Climate. Eds. Pörtner H.-O., Roberts D. C., Masson-Delmotte V., Zhai P., Poloczanska E., Mintenbeck K., et al (Cambridge: Cambridge University Press), 39–69. doi: 10.1017/9781009157964.002
Jones M. L., Swartz S. L. (1984). “Demography and phenology of gray whales and evaluation of whale-watching activities in laguna san ignacio, Baja California Sur, Mexico,” in The Gray Whale: Eschrichtius Robustus. Eds. Lou Jones M., Swartz S. L., Leatherwood S. (Orlando, Florida: Academic Press), 309–374. doi: 10.1016/B978-0-08-092372-7.50020-0
Kessler M., Harcourt R., Bradfor W. (2014). Will whale watchers sacrifice personal experience to minimize harm to whales? Tourism Mar. Environ. 10, 21–30. doi: 10.3727/154427314X14056884441662
Kwakkel J., Pruyt E. (2013). Using system dynamics for grand challenges: the ESDMA approach. Syst. Res. Behav. Sci. 32, 358–375. doi: 10.1002/sres.2225
Lambert E., Hunter C., Pierce G. J., MacLeod C. D. (2010). Sustainable whale-watching tourism and climate change: towards a framework of resilience. J. Sustain. Tourism 18, 409–427. doi: 10.1080/09669581003655497
Lee C. K., Mjelde J. W., Kim T. K., Lee E., Choi Y. (2019). Willingness-to-pay for whale tour attributes using a choice experiment. Asia Pacific J. Tourism Res. 24, 606–617. doi: 10.1080/10941665.2019.1610001
Levin S. (1998). Ecosystems and the biosphere as complex adaptive systems. Ecosystems. 1, 431–436. doi: 10.1007/s100219900037
Levin S., Xepapadeas T., Crépin A. S., Norberg J., De Zeeuw A., Folke C., et al. (2013). Social-ecological systems as complex adaptive systems: Modeling and policy implications. Environ. Dev. Econ. 18, 111–132. doi: 10.1017/S1355770X12000460
Li T., Dong Y., Liu Z. (2020). A review of social-ecological system resilience: Mechanism, assessment and management. Sci. Total Environ. 723, 138113. doi: 10.1016/J.SCITOTENV.2020.138113
Liehr S., Röhrig J., Mehring M., Kluge T. (2017). How the social-ecological systems concept can guide transdisciplinary research and implementation: addressing water challenges in central northern Namibia. Sustainability. 9, 1109. doi: 10.3390/SU9071109
Loucks D. P., Van Beek E. (2017). Water Resource Systems Planning and Management An Introduction to Methods, Models, and Applications (Switzerland: Springer Nature). doi: 10.1007/978-3-319-44234-1
Lusseau D. (2014). “Ecological constraints and the propensity for population consequences of whale-watching disturbances,” in Whale-watching: Sustainable Tourism and Ecological Management. Eds. Higham J., Bejder L., Williams R. (Cambridge: Cambridge University Press), 229–241. doi: 10.1017/CBO9781139018166
Maani K., Cavana R. Y. (2007). Systems thinking, system dynamics: managing change and complexity. 2nd ed (Auckland: Pearson Education New Zealand).
Markwell K. (2015). Animals and tourism: understanding diverse relationship. Ann. Leisure Res. 21, 1–3. doi: 10.1080/11745398.2016.1239544
Márquez-González R. A., Sánchez-Crispín Á. (2007). Turismo y ambiente: la percepción de los turistas nacionales en Bahía de Banderas, Nayarit, México. Invest. Geog. 64, 134–152. doi: 10.14350/rig.17970
Mckercher B. (2021). NC-ND license Can pent-up demand save international tourism? Ann. Tour. Res Empir. Insights 2, 100020. doi: 10.1016/j.annale.2021.100020
Mehring M., Bernard B., Hummel D., Liehr S., Lux A. (2017). Halting biodiversity loss: How social–ecological biodiversity research makes a difference. Int. J. Biodivers. Sci. Ecosyst. Serv. Manage. 13, 172–180. doi: 10.1080/21513732.2017.1289246
Meynecke J.-O., Richards R., Sahin O. (2017). Whale watch or no watch: the Australian whale watching tourism industry and climate change. Regional Environ. Change 17, 477–488. doi: 10.1007/s10113-016-1034-z
Miller A. B., Blahna D. J., Morse W. C., Leung Y. F., Rowland M. M. (2022). From recreation ecology to a recreation ecosystem: A framework accounting for social-ecological systems. J. Outdoor Recreation Tourism 38, 10. doi: 10.1016/j.jort.2021.100455
Moore S. E., Huntington H. P. (2008). Arctic marine mammals and climate change: impacts and resilience. Ecol. Appl. 18, 157–165. doi: 10.1890/06-0571.1
Moore S. E., Jorge Urbán R., Perryman W. L., Gulland F., Hector Perez-Cortes M., Wade P. R., et al. (2001). Are gray whales hitting “K” hard? Mar. Mamm. Sci. 17, 954–958. doi: 10.1111/J.1748-7692.2001.TB01310.X
Mustika P. L. K., Birtles A., Everingham Y., Marsh H. (2013). The human dimensions of wildlife tourism in a developing country: Watching spinner dolphins at Lovina, Bali, Indonesia. J. Sust. Tour. 21, 229–251. doi: 10.1080/09669582.2012.692881
Naidoo P., Ramseook-Munhurrun P., Seegoolam P. (2011). An assessment of visitor satisfaction with nature-based tourism attractions. Int. J. Manage. Mark. Res. 4, 87–98. Available at: https://ssrn.com/abstract=1881032. (accessed January 9, 2024).
Needham M. D., Szuster B. W., Bell C. M. (2011). Encounter norms, social carrying capacity indicators, and standards of quality at a marine protected area. Ocean Coast. Manage. 54, 633–641. doi: 10.1016/j.ocecoaman.2011.06.004
Neves K. (2010). Cashing in on cetourism: A critical ecological engagement with dominant E-NGO discourses on whaling, cetacean conservation, and whale watching. Antipode. 42, 719–741. doi: 10.1111/j.1467-8330.2010.00770.x
Nowacek S. M., Wells R. S., Solow A. R. (2001). Short-term effects of vessel traffic on bottlenose dolphins, Tursiops truncatus, in Sarasota Bay, Florida. Mar. Mamm. Sci. 17, 673–688. doi: 10.1111/j.1748-7692.2001.tb01292.x
O’Connor S., Campbell R., Cortez H., Knowles T. (2009). Whale Watching Worldwide Tourism numbers, expenditures and expanding economic benefits, a special report from the International Fund for Animal Welfare. (Issue June). Available online at: www.ecolarge.com. (accessed September 09, 2024).
Orams M. (2000). Tourists getting close to whales, is it what whale-watching is all about? Tour. Manage. 21, 561–569. doi: 10.1016/S0261-5177(00)00006-6
Orams M. B. (2002). Feeding wildlife as a tourism attraction: a review of issues and impacts. Tourism Management 23, 281–293. Available online at: http://asia.cnn.com/2001/WORLD/asiapcf/auspac/.
Organ J. F., Decker D. J., Riley S. J., McDonald J. E. Jr., Mahoney S. P. (2012). “Adaptive management in wildlife conservation,” in The Wildlife Techniques Manual—Management. Ed. Silvy N. J. (Maryland: Johns Hopkins University Press), 43–55.
Perez-Cortez H., Urban J., Loreto P. (2004). A note on gray whale distribution and abundance in the Magdalena Bay Complex, México during the 1997 winter season. J. Cetacean Res. Manage. 6, 133–138. doi: 10.47536/jcrm.v6i2.776
Perryman W. L., Joyce T., Weller D. W., Durban J. W. (2020). Environmental factors influencing eastern North Pacific gray whale calf production 1994–2016. Mar. Mamm. Sci. 37, 448–462. doi: 10.1111/MMS.12755
Pett M. A. (2015). Nonparametric statistics for health care research: Statistics for small samples and unusual distributions, 2nd Edn. California: SAGE Publications, Inc.
Quintana-Martín Montalvo B., Hoarau L., Deffes P., Delaspre S., Delfour F., Landes A.-E. (2021). Dolphin watching and compliance to guidelines affect. Animals. 11, 1–16. doi: 10.3390/ani11092674.3390/ani11092674
Radosavljevic S., Banitz T., Grimm V., Johansson L.-G., Lindkvist E., Schlüter M. (2023). Dynamical systems modeling for structural understanding of social-ecological systems: A primer. Ecol. Complex. 56, 1476–1945. doi: 10.1016/j.ecocom.2023.101052
Refulio-Coronado S., Lacasse K., Dalton T., Humphries A., Basu S., Uchida H., et al. (2021). Coastal and marine socio-ecological systems: A systematic review of the literature. Front. Mar. Sci. 8. doi: 10.3389/fmars.2021.648006
Reyers B., Folke C., Moore M. L., Biggs R., Galaz V. (2018). Social-ecological systems insights for navigating the dynamics of the anthropocene. Annu. Rev. Environ. Resour. 43, 267–289. doi: 10.1146/annurev-environ-110615-085349
Richards R., Meynecke J. O., Sahin O. (2021). Addressing dynamic uncertainty in the whale-watching industry under climate change and system shocks. Sci. Total Environ. 756 (143889), 1–14. doi: 10.1016/j.scitotenv.2020.143889
Rodger K., Smith A., Newsome D., Moore S. A. (2011). Developing and testing an assessment framework to guide the sustainability of the marine wildlife tourism industry. J. Ecotourism. 10, 149–164. doi: 10.1080/14724049.2011.571692
Rodríguez-Izquierdo E., Miquelajauregui Y., Padilla P., Bojórquez-Tapia L. A. (2019). Modelling approach for crafting environmental regulations under deep uncertainty: Whale watching in Ojo de Liebre, Mexico. Ecol. Modell. 408, 1–13. doi: 10.1016/j.ecolmodel.2019.108731
Rue H., Martino S., Chopin N. (2009). Approximate Bayesian inference for latent Gaussian models by using integrated nested Laplace approximations. J. R. Stat. Soc B 71, 319–392. doi: 10.1111/j.1467-9868.2008.00700.x
Runge M. C., Grand J. B., Mitchell M. S. (2013). “Structured decision making,” in Wildlife management and conservation: contemporary principles and practices. Eds. Krausman P. R., Cain J. W. III (Maryland: The Johns Hopkins University Press), 51–72.
Salvadeo C. J., Gómez-Gallardo A., Nájera-Caballero M., Urbán-Ramirez J., Lluch-Belda D. (2015). The Effect of Climate Variability on Gray Whales (Eschrichtius robustus) within Their Wintering Areas. PloS One 10, e0134655. doi: 10.1371/journal.pone.0134655
Salvadeo C. J., Lluch-Cota S. E., Maravilla-Chávez M. O., Álvarez-Castañeda S. T., Mercuri M., Ortega-Rubio A. (2013). Impact of climate change on sustainable management of gray whale (Eschrichtius robustus) populations: Whale-watching and conservation. Arch. Biol. Sci. 65, 997–1005. doi: 10.2298/ABS1303997S
Sandaruwani R. C., Gnanapala A. C. (2016). The role of tourist guides and their impacts on sustainable tourism development: a critique on sri Lanka. Tourism, Leisure and Global Change 3, 29–31. Available online at: http://www.igutourism.org/Lombok2015/.CreativeCommonsCopyrightNC-BY-NDhttp://www.igutourism.org/Lombok2015/.
Schlüter M., McAllister R. R. J., Arlinghaus R., Bunnefeld N., Eisenack K., Hölker F., et al. (2012). New horizons for managing the environment: a review of coupled social-ecological systems modeling. Nat. Resour. Model. 25, 219–272. doi: 10.1111/J.1939-7445.2011.00108.X
Schlüter M., Müller B., Frank K. (2019). The potential of models and modeling for social-ecological systems research: the reference frame ModSES. Ecol. Soc 24. doi: 10.5751/ES-10716-240131
Schumann N., Gales N. J., Harcourt R. G., Arnould J. P. Y. (2013). Impacts of climate change on Australian marine mammals. Aust. J. Zool. 61, 146–159. doi: 10.1071/ZO12131
SEMARNAT (2024). Permisos, viajes, ingresos y empleos generados por la observación de ballenas por especie (DGEIA). Available at: http://dgeiawf.semarnat.gob.mx:8080/ibi_apps/WFServlet?IBIF_ex=D3_BIODIV03_15&IBIC_user=dgeia_mce&IBIC_pass=dgeia_mce&NOMBREENTIDAD=*. (accessed September 09, 2024).
Sheungting Lo I., McKercher B. (2016). “Beyond Imaginary of Place: Performing, Imagining, and Deceiving Self through Online Tourist Photography,” in Tourism Imaginaries at the Disciplinary Crossroads: Place, Practice, Media. Eds. Gravari-Barbas M., Graburn N. (London: Routledge), 231–245. doi: 10.4324/9781315550718-17
Sousa A., Encarnação Coelho R., Costa H., Capela Lourenço T., Azevedo J. M. N., Frazão Santos C. (2023). Integrated climate, ecological and socioeconomic scenarios for the whale watching sector. Sci. Total Environ. 857, 159589. doi: 10.1016/j.scitotenv.2022.159589
Stewart J. D., Joyce T. W., Durban J. W., Calambokidis J., Fauquier D., Fearnbach E., et al. (2023). Boom-bust cycles in gray whales associated with dynamic and changing Arctic conditions. Science 382, 207–2011. doi: 10.1126/science.adi1847
Suárez-Rojas C., González Hernández M. M., León C. J. (2022). Do tourists value responsible sustainability in whale-watching tourism? Exploring sustainability and consumption preferences. J. Sustain. Tourism 30, 2053–2072. doi: 10.1080/09669582.2021.1999966
Sumanapala D., Wolf I. D. (2019). Recreational ecology: A review of research and gap analysis. Environments - MDPI 6, 15. doi: 10.3390/environments6070081
Sumich J. L. (1986). Latitudinal Distribution, Calf Growth and Metabolism, and Reproductive Energetics of Gray Whales, Eschrichtius robustus. USA. Oregon: Oregon State University. Available at: https://ir.library.oregonstate.edu/xmlui/handle/1957/28090. (accessed November 15, 2023).
Swartz S. (1986). Gray whale migratory, social and breeding behavior. Rep. Int. Whal. Commun. Spec. 8, 207–229.
Tavares J., Neves O., Sawant M. (2018). The importance of information in the destination on the levels of tourist satisfaction. Int. J. Tour. Policy. 8, 129–146. doi: 10.1504/IJTP.2018.092476
Urbán J., Gómez-Gallardo A., Ludwig S. (2003a). Abundance and mortality of gray whales at Laguna San Ignacio, Mexico, during the 1997-98 El Niño and the 1998-99 La Niña. Geofis. Int. 42, 439–446. doi: 10.22201/IGEOF.00167169P.2003.42.3.932
Urbán J. R., Martínez A., Ronzón C., Viloria-Gómora L., Swartz S. L. (2021). 2021 Gray whale abundance in Laguna San Ignacio and Bahía Magdalena Complex, B.C.S., México. Rep. Int. Whal Comm Doc. SC/68C/CMP/13. Available at: https://archive.iwc.int/pages/download.php?direct=1&noattach=true&ref=19181&ext=pdf&k=.
Urbán J., Rojas-Bracho L., Pérez-Cortés H., Gómez-Gallardo A., Swartz S. L., Ludwig S., et al. (2003b). A review of gray whales (Eschrichtius robustus) on their wintering grounds in Mexican waters. Cetacean Res. Manage. 3, 281–295. doi: 10.47536/jcrm.v5i3.808
Urbán J. R., Swartz S., Gómez-Gallardo A. U., Martínez S. A., Rosales-Nanduca H. (2016). 2016 Gray whale research in Laguna San Ignacio and Bahia Magdalena, México. Rep. Int. Whal Comm Doc. SC/66b/BRG/19. Available at: https://archive.iwc.int/pages/download.php?direct=1&noattach=true&ref=6101&ext=pdf&k=.
Urbán J. R., Swartz S. L., Gómez-Gallardo A. U., Martínez S. A., Rosales-Nanduca H. (2017). 2017 Gray whale research in Laguna San Ignacio and Bahia Magdalena, México. Rep. Int. Whal Comm Doc. SC/67a/CMP/11. Available at: https://archive.iwc.int/pages/download.php?direct=1&noattach=true&ref=6646&ext=pdf&k=.
Urbán J. R., Swartz S. L., Martínez A. S., Viloria G. L. (2020). 2020 Gray whale abundance in Laguna San Ignacio and Bahía Magdalena, B.C.S., México. Rep. Int. Whal Comm Doc. SC/68B/CMP/09. https://archive.iwc.int/pages/download.php?direct=1&noattach=true&ref=17199&ext=pdf&k=.
Urbán J. R., Swartz S. L., Martínez S. A., Viloria L. G., Gómez-Gallardo A. U. (2018). 2018 Gray whale abundance in Laguna San Ignacio and Bahia Magdalena, México. Rep. Int. Whal Comm Doc. SC/67B/CMP/09. Available at: https://archive.iwc.int/pages/download.php?direct=1&noattach=true&ref=8841&ext=pdf&k=.
Urbán J. R., Swartz S. L., Martínez A. S., Viloria G. L., Ronzón-Contreras F. (2019). 2019 Gray whale abundance in Laguna San Ignacio and Bahía Magdalena, Baja California Sur, México. Rep. Int. Whal Comm Doc. SC/69a/CMP/12. Available at: https://archive.iwc.int/pages/download.php?direct=1&noattach=true&ref=11913&ext=pdf&k=.
Urbán J., Viloria-Gómora L., Martínez-A S., Swartz S. L. (2023). 2023 Gray whale abundance In Laguna San Ignacio and the Bahía Magdalena Lagoon Complex, B.C.S., México. Available online at: https://www.sanignaciograywhales.org/wp-content/uploads/2023/05/URBAN-ET-AL-2023-GRAY-WHALE-ABUNDANCE-11-MAY-2023.pdf. (accessed September 09, 2024).
Urbán Martínez-Aguilar, S., Viloria-Gómora L., Swartz S. L. (2022). Gray whale abundance in Laguna San Ignacio and Bahía Magdalena lagoon complex, B.C.S., México for 2022 breeding season. Available online at: https://www.sanignaciograywhales.org/wp-content/uploads/2022/05/SC_68D_CMP_071-Urb%C3%A1n-et-al-abundance.pdf. (accessed September 09, 2024).
van Weelden C., Towers J. R., Bosker T. (2021). Impacts of climate change on cetacean distribution, habitat and migration. Clim. Change Ecol. 1, 100009. doi: 10.1016/J.ECOCHG.2021.100009
Vaske J. J., Donnelly M. P. (2002). Generalizing the encounter-norm-crowding relationship. Leisure Sci. 24, 255e269. doi: 10.1080/01490400290050718
Vogler R. (2021). Revenge and catch-up travel or degrowth? Debating tourism Post COVID-19. Ann. Tour. Res. 93, 103272. doi: 10.1016/j.annals.2021.103272
Walker B., Holling C. S., Carpenter S. R., Kinzing A. (2004). Resilience, Adaptability and Transformability in Social– ecological Systems. Ecol. Soc. 9. Available at: https://www.ecologyandsociety.org/vol9/iss2/art5/.
Walker B., Salt D. (2006). “Resilience thinking. Sustaining ecosystems and people,” in a Changing World (Island Press, Washington DC, USA).
Walker K., Weiler B. (2017). A new model for guide training and transformative outcomes: a case study in sustainable marine-wildlife ecotourism. J. Ecotourism 16, 269–290. doi: 10.1080/14724049.2016.1245736
Keywords: gray whale, social-ecological system, whale watching, climate change, resilience
Citation: García-Castañeda O, Viloria-Gómora L, Ávila-Foucat VS, Vega-Peña EV, Pardo MA, Quintero-Venegas GJ, Urbán R. J, Swartz S and Martínez-Meyer E (2024) Climate change stands as the new challenge for whale watching and North Pacific gray whales (Eschrichtius robustus) in Bahia Magdalena, Mexico, after their recovery from overexploitation. Front. Conserv. Sci. 5:1397204. doi: 10.3389/fcosc.2024.1397204
Received: 07 March 2024; Accepted: 28 August 2024;
Published: 01 October 2024.
Edited by:
Jennifer Jackman, Salem State University, United StatesReviewed by:
Orla O’Brien, New England Aquarium, United StatesLaura González García, University of the Azores, Portugal
Copyright © 2024 García-Castañeda, Viloria-Gómora, Ávila-Foucat, Vega-Peña, Pardo, Quintero-Venegas, Urbán R, Swartz and Martínez-Meyer. This is an open-access article distributed under the terms of the Creative Commons Attribution License (CC BY). The use, distribution or reproduction in other forums is permitted, provided the original author(s) and the copyright owner(s) are credited and that the original publication in this journal is cited, in accordance with accepted academic practice. No use, distribution or reproduction is permitted which does not comply with these terms.
*Correspondence: Enrique Martínez-Meyer, ZW1tQGliLnVuYW0ubXg=; Lorena Viloria-Gómora, bHZpbG9yaWFAdWFiY3MubXg=