 Mitchell E. McGlaughlin
 Samantha K. Naibauer
- Department of Biological Sciences, University of Northern Colorado, Greeley, CO, United States
Introduction: Recent advances in genetic data collection utilizing next-generation DNA sequencing technologies have the potential to greatly aid the taxonomic assessment of species of conservation concern, particularly species that have been difficult to describe using morphology alone. Accurate taxonomic descriptions aided by genetic data are essential to directing limited conservation resources to species most in need. Sclerocactus glaucus is a plant endemic to Western Colorado that is currently listed as Threatened under the Endangered Species Act (ESA). However, in 2023, the U. S. Fish and Wildlife Service proposed de-listing S. glaucus from the ESA due to recovery of the species. Previous research had found substantial genetic structure between populations in the northern part of the S. glaucus range relative to the majority of the species distribution.
Methods: In this study we utilized double-digest Restriction-site Associated DNA sequencing (RAD-seq) in order to better understand the genetic structure of S. glaucus.
Results: Our results indicate that S. glaucus contains two distinct evolutionary lineages that warrant recognition at the level of species, with what was previously described as S. glaucus North being recognized as Sclerocactus dawsoniae.
Discussion: The newly described S. dawsoniae has a limited estimated number of individuals, low levels of nucleotide diversity, a very narrow geographic range, and an uneven geographic distribution with most plants being found in a single management area, all of which supports continued direct conservation of this species. In contrast, S. glaucus has a large estimated minimum population size, a broad geographic range that includes numerous protected areas, and adequate levels of genetic diversity. Without further conservation action, a delisting decision for S. glaucus will simultaneously remove all Endangered Species Act protections for S. dawsoniae. The current work demonstrates the importance of having robust genetic datasets when planning conservation activities for species of concern. Moving forward, we recommend that government stakeholders prioritize supporting genetic studies of endangered species prior to making any changes to listing decisions.
1 Introduction
Conservation scientists are continually challenged to recommend, develop, and execute conservation activities that will be impactful for protecting species of conservation concern. Although considerable debate exists around how best to allocate conservation resources (Bottrill et al., 2008; Wilson and Law, 2016; Wiedenfeld et al., 2021), there is widespread acceptance that there is not enough funding dedicated to conservation activities (Gerber, 2016; Buxton et al., 2020). An area where research can aid in conservation decision making when resources are scarce is by assessing the taxonomic status of species of concern (Haig et al., 2016; Morrison et al., 2009; Thomson et al., 2018; Jackson et al., 2022). Multiple examples exist of conservation funding not being directed toward evolutionary distinct lineages that warrant conservation priority that have not been formally recognized as distinct species (e.g., Malaney et al., 2017; Gippoliti et al., 2018; Melville et al., 2021). By utilizing genetic data we can ensure that taxonomy is accurate and that conservation resources are appropriately prioritized.
Recent advances in genetic data analyses utilizing next-generation DNA sequencing technologies have the potential to greatly aid the taxonomic assessment of species of conservation concern (Harrison and Kidner, 2011; Pante et al., 2015; Coates et al., 2018). Reduced representation sequencing methods such as Restriction-site Associated DNA sequencing (RAD-seq; Baird et al., 2008) and Genotype-by-Sequencing (GBS; Elshire et al., 2011) have two significant advantages over historically utilized conservation genetic techniques, such as microsatellites, mitochondrial DNA sequencing, and low copy nuclear sequencing. First, reduced representation sequencing methods do not require any previous information about the genome of the species under study (Baird et al., 2008; Grover and Sharma, 2016; Fuentes-Pardo and Ruzzante, 2017). This allows studies to be initiated de novo with a lower relative cost and without time dedicated to marker development (Harrison and Kidner, 2011; Andrews et al., 2016). Second, reduced representation sequencing techniques allow for the analysis of 1,000’s of SNP’s with greater genomic representation than previous markers. Taken together, the advantages of reduced representation sequencing make these markers appealing for efficient and cost-effective assessments of taxonomic accuracy.
Reduced representation sequencing is increasingly being used to inform taxonomy, particularly in groups that have undergone recent diversification and have unresolved species (e.g., Quattrini et al., 2019; Balao et al., 2020; Reyes-Velasco et al., 2020; Wagner et al., 2020). Despite the value of these types of studies, limited research has examined the taxonomy of species of conservation concern (e.g., Pedraza-Marrón et al., 2019). Although considerable challenges exist related to how best to incorporate genomic data into species concepts (Stanton et al., 2019) the potential for better understanding biodiversity should outweigh these concerns.
Sclerocactus (Cactaceae) has long been recognized as a taxonomic challenge with multiple competing classifications (Heil and Porter, 1994; Hochstätter, 1995; Hochstätter, 1996a; Hochstätter, 1996b, Hochstätter, 1997; Porter et al., 2000). Ten of the 19 Sclerocactus species recognized by NatureServe (2023a) are ranked as Imperiled (G2) or Critically Imperiled (G1) and seven members of the genus are listed as threatened (6) or endangered (1) under the U.S. Endangered Species Act (ESA; USFWS, 2023a). Members of Sclerocactus are cylindrical-stemmed cacti that are generally less than 40 cm tall, with relatively few distinguishing morphological characters and considerable variability within named taxa (Welsh, 1984). Traditionally, species have been differentiated based on overall size, central spine number and shape, seed surface cell types, flower color, and fruit shape (Heil and Porter, 1994; Hochstätter, 1995; Hochstätter, 1996a; Hochstätter, 1996b, Hochstätter, 1997; Porter et al., 2013). However, genetic analyses have demonstrated that several of these morphological features, specifically spine shape (Schwabe et al., 2015) and overall size (Porter et al., 2018; McGlaughlin unpublished data)1 do not align with genetically recognized groups (Schwabe et al., 2015; Porter et al., 2018; Porter et al., 2013; McGlaughlin unpublished data)1.
In this work, we were interested in examining the taxonomic status of Sclerocactus glaucus (K. Schim.) L.D. Benson, the Colorado hookless cactus. Sclerocactus glaucus is currently listed as Threatened under the ESA (USFWS, 2023a) and as Imperiled (G2) by NatureServe (2023b). However, in 2023 the U.S. Fish and Wildlife Service formally proposed removing S. glaucus from the Endangered Species List (USFWS, 2023b). Like most members of the genus, Sclerocactus glaucus has a complicated taxonomic history. This species was originally circumscribed to contain plants found in western Colorado and the Uintah Basin of northeastern Utah. In the late 1980’s and early 1990’s, plants found in Utah were removed from S. glaucus and recognized as S. wetlandicus Hochstätter (Hochstätter, 1989) and S. brevispinus K. D. Heil & J. M. Porter (Heil and Porter, 1994), a taxonomic revision that has been supported by genetic data (Porter et al., 2013). As currently recognized, S. glaucus is endemic to western Colorado, occurring in three geographic areas: 1) Along the Colorado River near DeBeque; 2) throughout the Grand Valley surrounding Grand Junction; and 3) along the Gunnison River south of the Grand Valley to Delta (Figure 1).
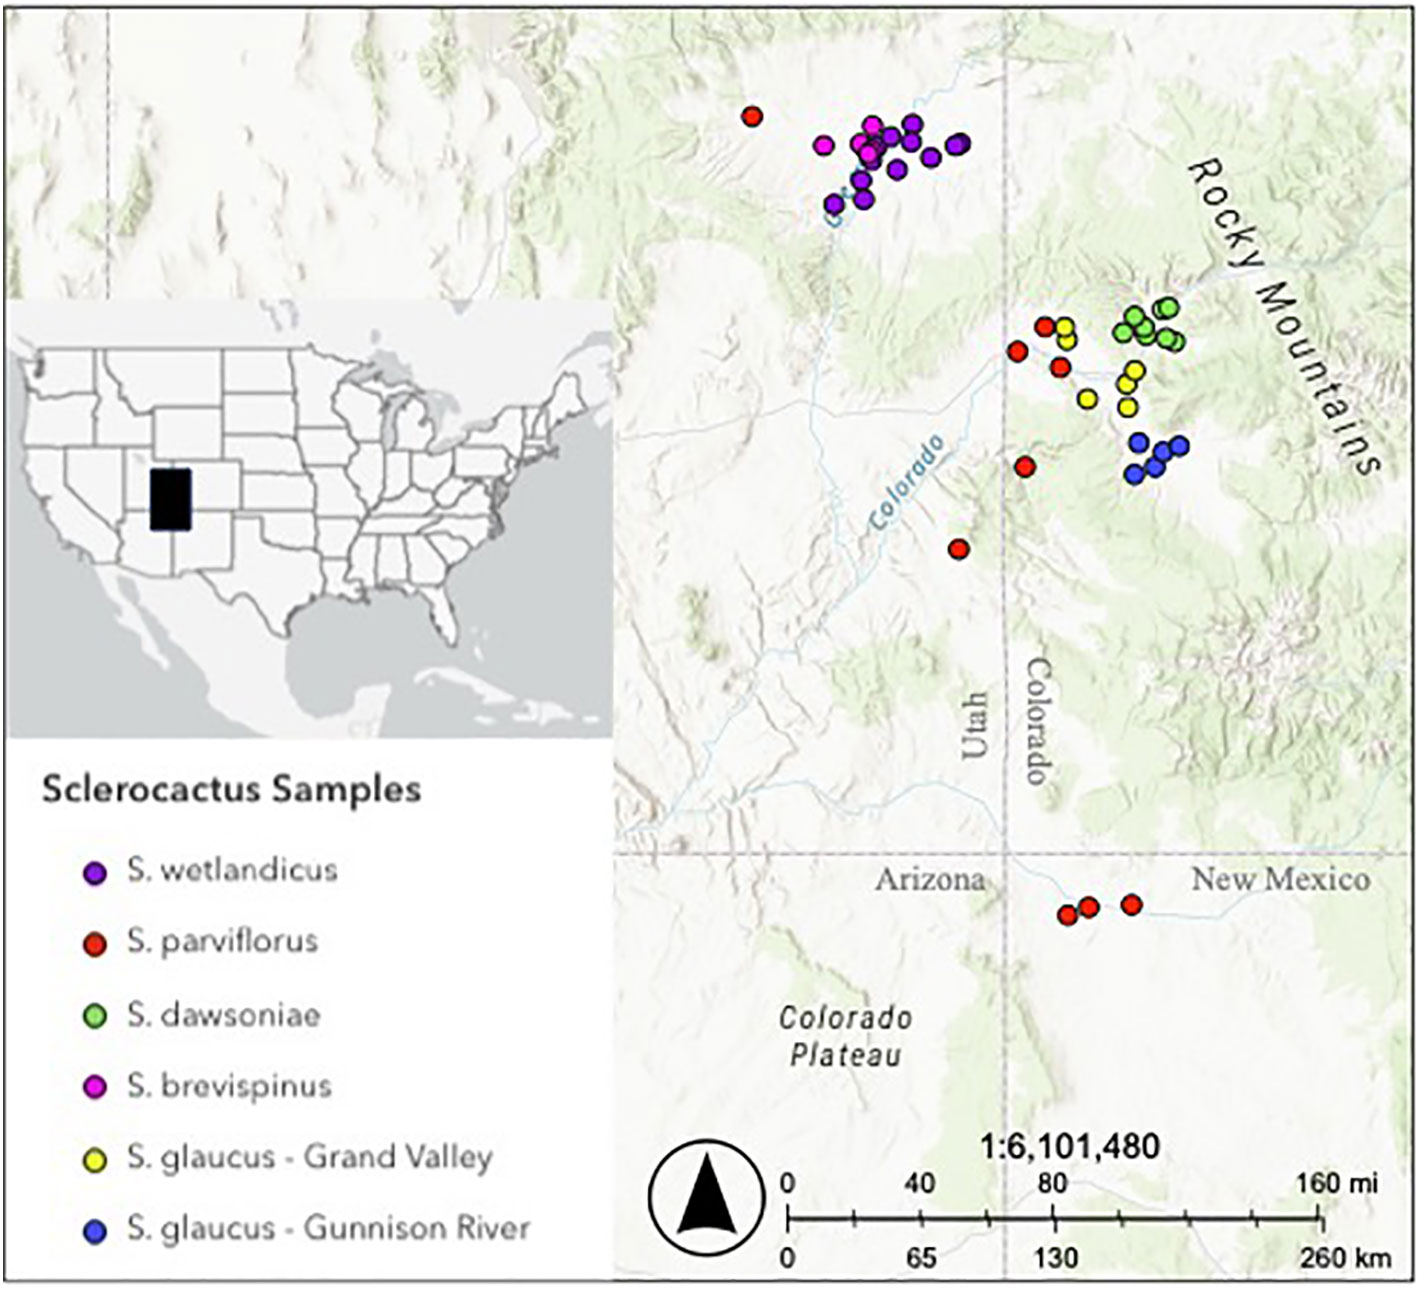
Figure 1 Sampling of Sclerocactus species included in the Taxonomic dataset. Each species is color-coded: S. dawsoniae (green), S. glaucus – Grand Valley (yellow), S. glaucus – Gunnison River (blue), S. parviflorus (red), S. wetlandicus (purple) and S. brevispinus (pink). Map of the relative sampling location in North America is inset. See Supplementary Figure 1 for population names of S. dawsoniae and S. glaucus.
Previous genetic work by Schwabe et al. (2015) utilizing nuclear microsatellites and plastid DNA sequences determined that hybridization between S. glaucus and a more widespread relative, S. parviflorus Clover & Jotter, was uncommon and not a major conservation concern. Schwabe et al. (2015) also found that there was substantial genetic differentiation between populations in the northern part of the S. glaucus range (near DeBeque) that were approaching the level of differentiation seen between S. glaucus and S. parviflorus, but no taxonomic revisions were recommended at that time. Here, we reexamine the genetic structure of S. glaucus and S. parviflorus using RAD-seq to gain a better understanding of the taxonomic diversity contained within this species of conservation concern.
2 Methods
2.1 Population sampling
Populations of Sclerocactus glaucus, S. parviflorus, S. wetlandicus, and S. brevispinus in Colorado, Utah, and New Mexico were sampled between 2009 – 2022 (Figure 1). Sclerocactus glaucus was sampled from the entire known range in Colorado covering the 3 previously recognized geographic groups (Supplementary Figure 1; Supplementary Table 1; Schwabe et al., 2015; McGlaughlin and Neale, 2017): Grand Valley (GV), Gunnison River (GR), and North. Sclerocactus parviflorus was sampled from populations in Colorado, Utah, and New Mexico, with the sampled populations in Colorado having been previously genetically identified (Schwabe et al., 2015). Sclerocactus wetlandicus and S. brevispinus were collected throughout their known ranges as part of another study and are included here to provide taxonomic context (McGlaughlin unpublished data)1. Floral tissue was collected and dried in silica beads until DNA extraction.
2.2 DNA extraction, sequencing, and SNP selection
DNA was extracted using a modified CTAB extraction protocol (Doyle and Doyle, 1987). DNA samples and library preparation were processed according to a modified double digest RADseq (ddRAD) protocol (Parchman et al., 2012; Tripp et al., 2017) using EcoR1 and Mse1 enzymes (New England Biolabs, Ipswich, MA). Illumina adapters and barcodes (Tripp et al., 2017) were ligated to opposing ends of the fragments through a single ligation step followed by two separate PCR enrichments which were combined. The fragments were quality filtered and size selected using BluePippin (Sage Science, Beverly, MA) at the University of Oregon Genomics and Cell Characterization Core Facility (GC3F; Eugene, OR). Fragments between 200-400 bp were chosen for library construction and sequenced using a HiSeq 4000 or a NovaSeq 6000 (Illumina, San Diego, CA) by GC3F. This work utilized the Alpine high performance computing resource at the University of Colorado Boulder (CURC, 2023). Alpine is jointly funded by the University of Colorado Boulder, the University of Colorado Anschutz, Colorado State University, and the National Science Foundation (award 2201538). Data storage is supported by the University of Colorado Boulder ‘PetaLibrary’ (CURC, 2021).
The resulting sequence data were cleaned and trimmed of single end adapters using TRIMMOMATIC v 0.39 (Bolger et al., 2014), and then demultiplexed using FASTQ-MULTX (Aronesty, 2013). Single Nucleotide Polymorphism (SNP) loci were determined denovo using the software iPYRAD v 0.9.87 (Eaton and Overcast, 2020) which was run following a two-step procedure to refine the datasets. In the first iPYRAD analysis, default parameters were used except clustering threshold [14] which was set to 0.90, the minimum number of samples per locus [21] which was set to reflect 75% of the individuals (allowing for 25% missing data), and the maximum number of SNP’s called per locus [22] was varied depending on dataset (detailed below). The resulting stats file was examined, and all samples that had a sample coverage of less than 60% of the total retained loci were removed. iPYRAD was then run a second time on the smaller dataset, using the same parameters as the previous run. Two datasets were created that varied in the maximum number of SNP’s per locus [22] and samples included, to examine either broad taxonomic relationships or focused population structure. The Taxonomic dataset was created allowing for 0.1 SNP’s per locus and included 208 samples (75 S. glaucus (GR and GV), 75 S. glaucus (North), 15 S. parviflorus, 24 S. wetlandicus, 19 S. brevispinus), resulting in 3537 loci and 20991 SNP’s. The Population Structure dataset was created to limit any impacts due to linked SNP’s within a single locus, allowing for 0.05 SNP’s per locus and included 150 individuals of S. glaucus (35 Grand Valley, 40 Gunnison River, and 75 North), resulting in 2476 loci and 3812 SNP’s.
2.3 Analyses
A Maximum Likelihood (ML) phylogenetic tree and performance of a rapid bootstrap analysis was completed on the Taxonomic dataset using RAxML ver. 8 (Stamatakis, 2014) with the GTRGAMMA model of rate heterogeneity, random seed number, and 100 bootstrap replicates. FigTree v 1.4.4 (Rambaut, 2016) was used to visualize phylogenetic trees. The R package, ADEGENET ver. 2.0 (Jombart, 2008), was used to perform principle component analysis (PCoA) on both the Taxonomic and Population Structure datasets. The Population Structure dataset was analyzed using the Bayesian clustering algorithm FASTSTRUCTURE (Raj et al., 2014).
Output structure files from iPYRAD (.vcf) were converted into Arlequin format (.arp) using PGDSPIDER version 2.1.1.5 (Lischer and Excoffier, 2012) for both datasets. The Taxonomic dataset was analyzed with Arlequin v 3.5 (Excoffier and Lischer, 2010) to calculate pairwise genetic distance (FST) among taxonomic groups, splitting S. glaucus into three regional groups (GR, GV, and North). The Population Structure dataset was analyzed with Arlequin v 3.5 to determine population level genetic diversity, including nucleotide diversity (π), average number of alleles (A), number of polymorphic loci (P), expected (He) and observed (Ho) heterozygosity, and inbreeding coefficient (FIS). To test for diversity differences among groups, a Mann-Whitney U Test was conducted for each genetic diversity measure using IBM SPSS Statistics for Windows, Version 25 (IBM Corp., Armonk, N.Y., USA).
3 Results
All analyses found that what was previously described as S. glaucus North is a substantially divergent group, which is recognized as Sclerocactus dawsoniae (McGlaughlin and Naibauer in press2) for the remainder of this paper. Maximum likelihood phylogenetic analysis of the Taxonomic dataset (Figure 2; Supplementary Figure 2) resolved four well supported groups: S. parviflorus, S. glaucus (Grand Valley and Gunnison River), S. dawsoniae, and S. brevispinus/S. wetlandicus. There is a lack of clear genetic distinction between S. brevispinus and S. wetlandicus.
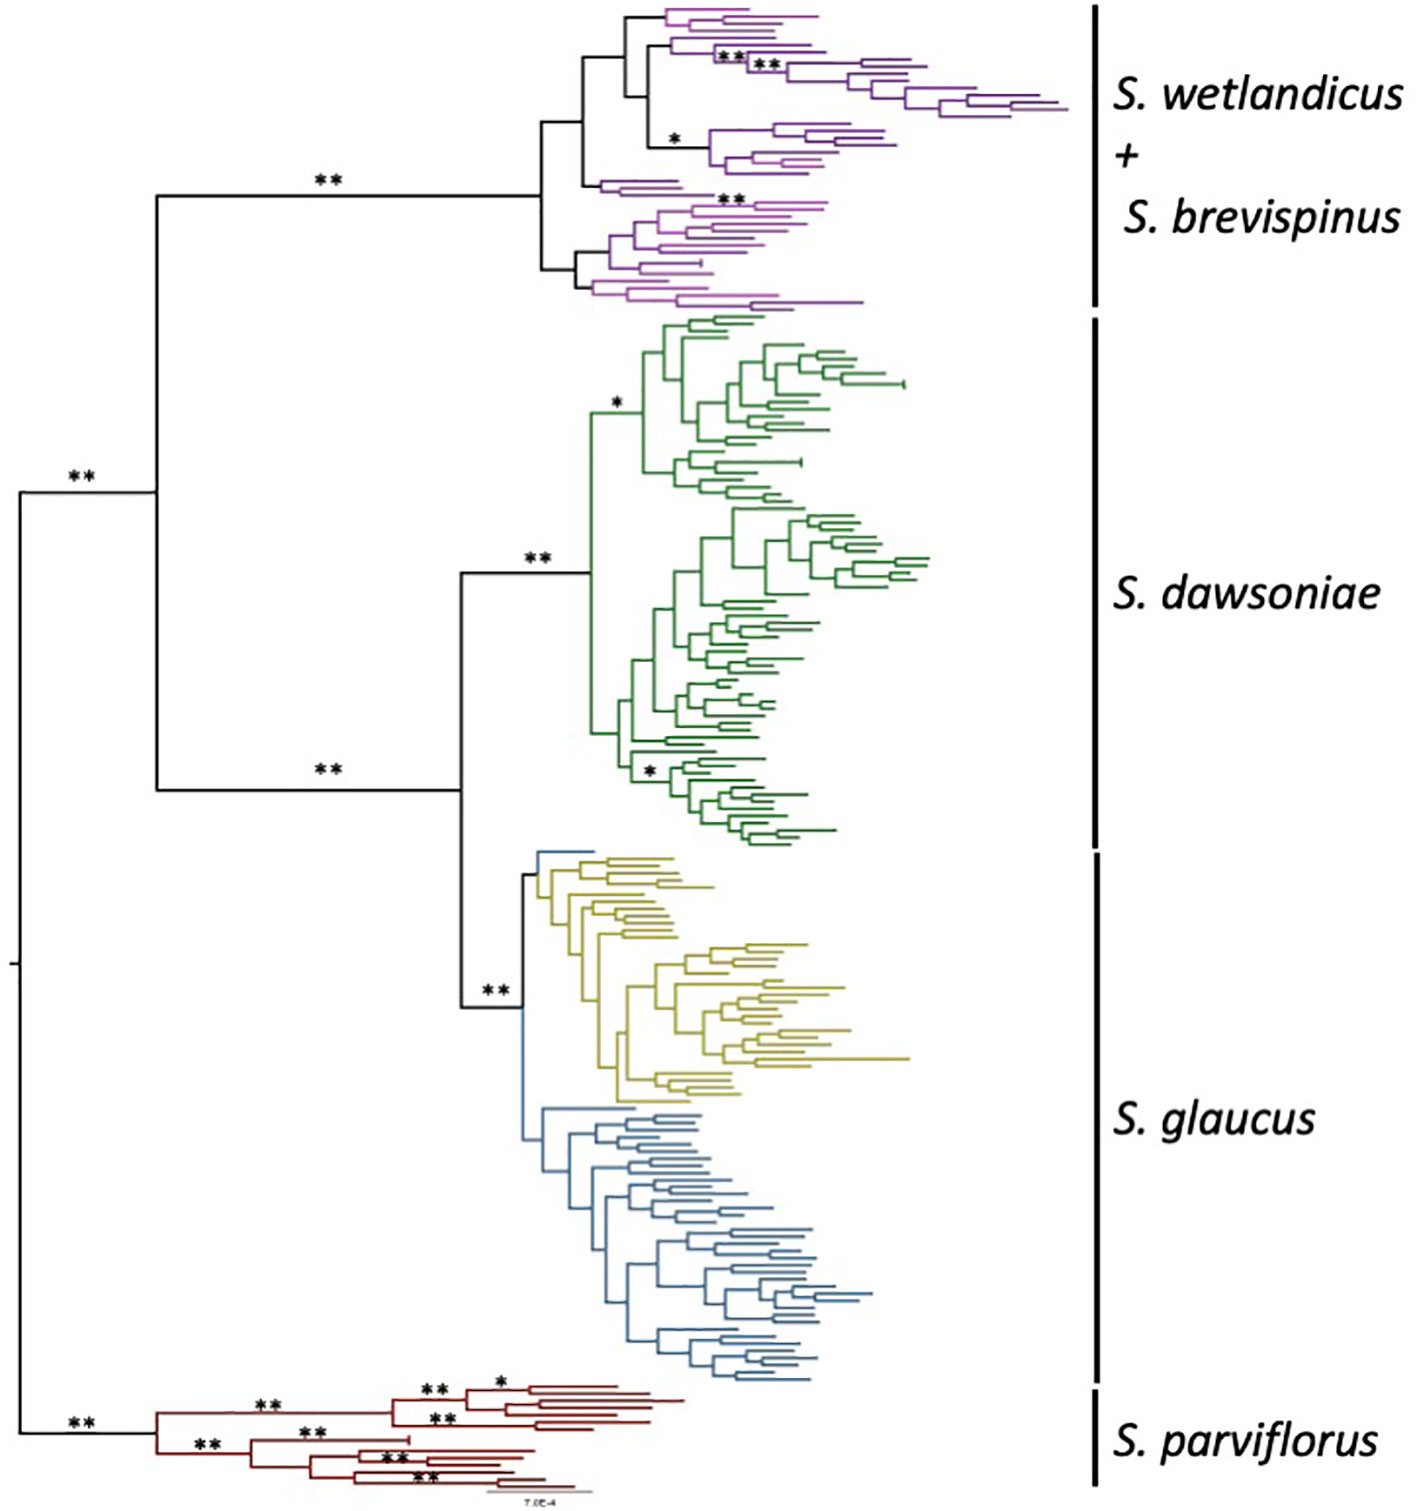
Figure 2 Maximum Likelihood phylogenetic tree for the Taxonomic data set. Individual samples are color coded by species: Blue – S. glaucus - Gunnison River; yellow – S. glaucus – Grand Valley; Green – S. dawsoniae; Red – S. parviflorus; Purple – S. wetlandicus; Pink – S. brevispinus. Bootstrap values of 100% are indicated by ** while bootstrap values between 95% - 99% are indicated by *. The same tree with sample labels is provided as Supplementary Figure 2.
Principle Coordinate Analyses (PCoA) of the Taxonomic dataset supported recognizing four distinct species (Figures 3A, B). Axis 1 explained 28.59% of the variation and separated S. glaucus and S. dawsoniae from S. parviflorus, S. brevispinus and S. wetlandicus; Axis 2, explained 7.34% of the variation and separated S. glaucus, S. dawsoniae, and S. parviflorus from S. brevispinus and S. wetlandicus; Axis 3 explained 6.17% of the variation and further separated S. glaucus from S. dawsoniae. For the Population Structure dataset (Figure 3C) Axis 1 explained 22.03% of the variation and separated S. glaucus and S. dawsoniae; Axis 2 explained 5.46% of the variation, resolving geographic structuring within S. glaucus. FastStructure further supports the distinction between S. glaucus and S. dawsoniae. The most statistically significant number of genetic groups was two (K=2), separating S. glaucus (Group 1, blue) and S. dawsoniae (Group 2, green) (Figure 4; Supplementary Figure 3). Sclerocactus glaucus had an average mean Q assignment of 0.991 to Group 1, while S. dawsoniae had an average mean Q assignment of 0.998 to Group 2 (Supplementary Table 2). FastStructure also indicated low levels of historic geneflow between populations of S. glaucus in the Grand Valley and S. dawsoniae, with 5 total samples showing 5-8% admixture between Groups 1 and 2. Although not the best statistically supported, FastStructure resolving three groups (K=3) aligned with McGlaughlin and Neale (2017) resolving 3 genetic groups: S. glaucus Gunnison River (blue), S. glaucus Grand Valley (yellow), and S. dawsoniae (green)(Supplementary Figure 3).
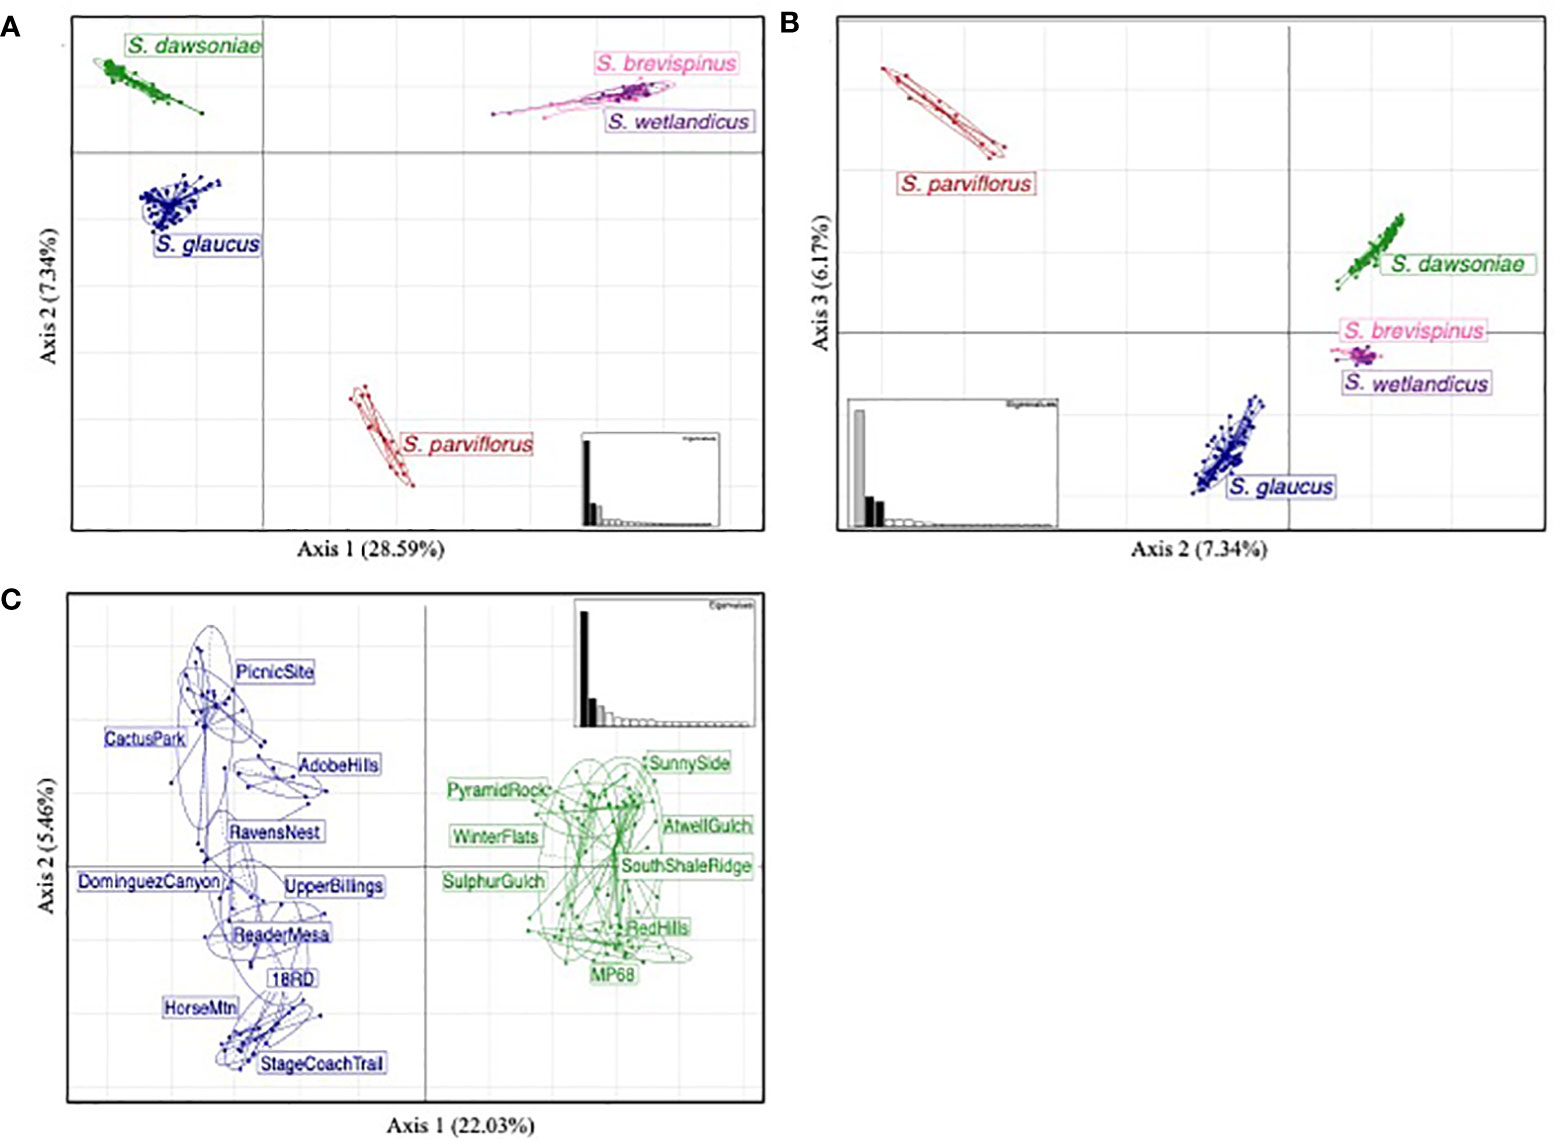
Figure 3 Principal Coordinate Analysis of the Taxonomic (A, B) and Population Structure (C) datasets with 95% confidence intervals drawn around identified groups. The relative contribution of each eigenvalue by axis is shown in the inset figure within each panel, with the axes being compared highlighted in black. For the Taxonomic dataset (A, B), axes 1-3 are shown explaining 28.50%, 7.34%, and 6.17% of the genetic variability, respectively. For the Populations Structure dataset (C), axes 1-2 are shown, explaining 22.03% and 5.46% of the genetic variability, respectively. Sampled species are color coded: Sclerocactus glaucus – blue; Sclerocactus dawsoniae – green; Sclerocactus parviflorus – red; Sclercactus wetlandicus – purple; and Sclerocactus brevispinus – pink. Within the Population Structure analysis (C), sampled populations are labeled to illustrate geographic structure.
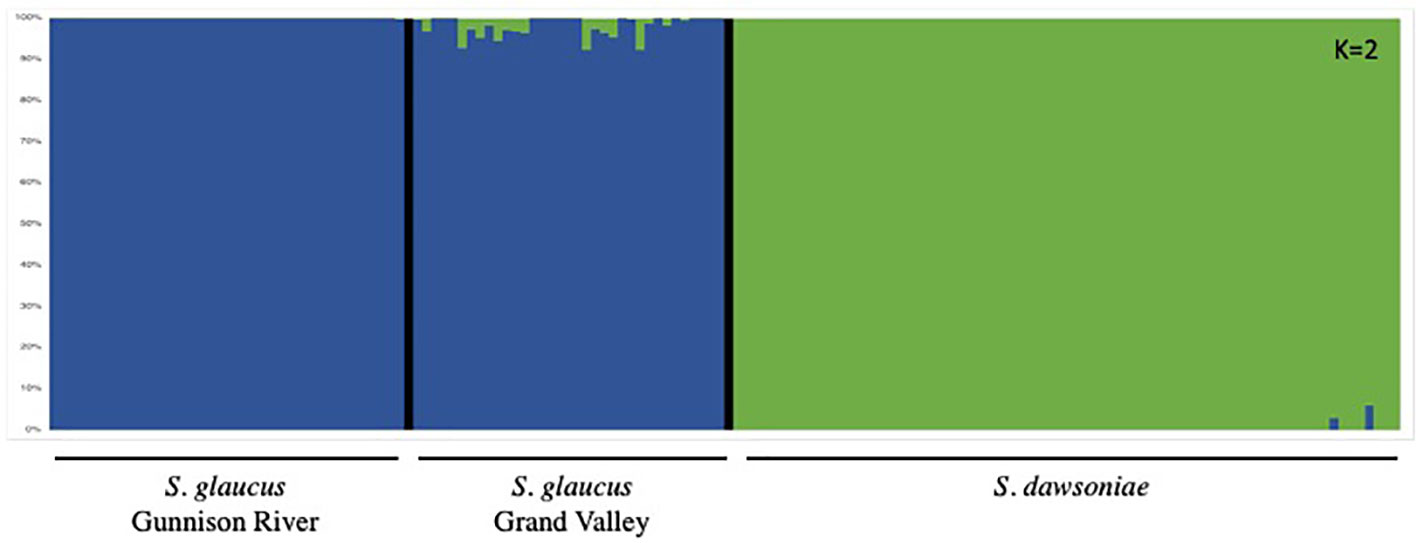
Figure 4 FASTSTRUCTURE analysis of the Population Structure dataset showing two groups (K=2) as the best supported grouping. The two groups are color coded: Blue – S. glaucus (Gunnison River and Grand Valley); Green – S. dawsoniae. This figure with specific populations labeled for K=2 and K=3 is provided as Supplementary Figure 3.
Measures of genetic distance (FST) were examined to determine the genetic distinction of named taxa and previously recognized genetic groups using the Taxonomic dataset (Table 1). The lowest FST values were observed between S. brevispinus and S. wetlandicus (0.02) and S. glaucus Gunnison River and Grand Valley (0.08). The highest FST values were observed between S. dawsoniae and both S. brevispinus and S. wetlandicus (0.60). Sclerocactus dawsoniae had a minimum FST of 0.25 when compared to any other group.
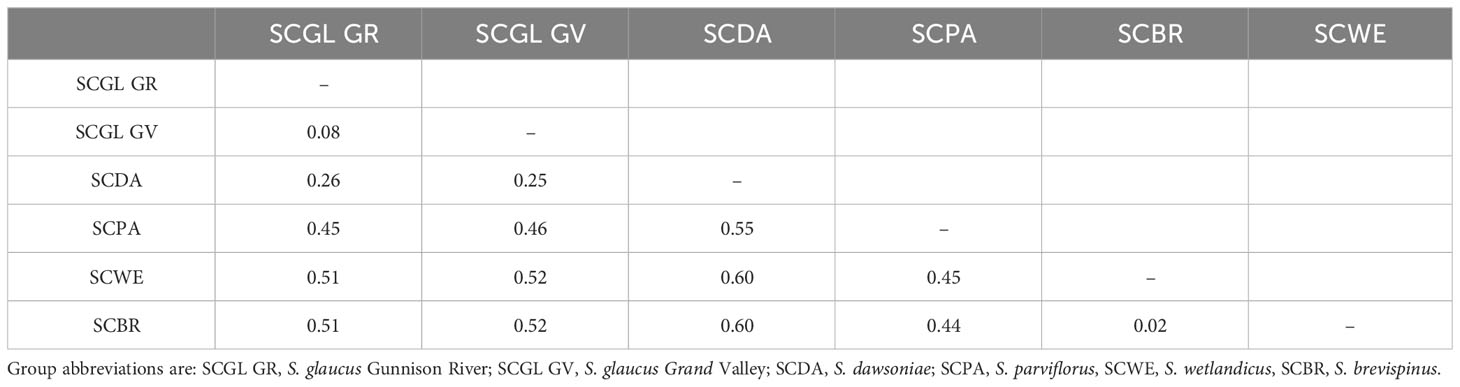
Table 1 Pairwise matrix of genetic distance (Fst) among species or groups within the Taxonomic dataset.
Measures of genetic distance (FST) were also examined using the Population Structure dataset, comparing all populations of S. dawsoniae and S. glaucus with more than 6 samples (Supplementary Table 3), which was then averaged to determine the genetic distance between S. dawsoniae and the two regional groups of S. glaucus (Table 2). Average FST within S. dawsoniae and S. glaucus was low (0.070-0.137), while distances between the two species were high (0.350-0.361) (Supplementary Table 3). Genetic diversity was calculated for the Population Structure dataset (Table 3), with estimates of polymorphic loci and heterozygosity excluded from populations with less than 5 sampled plants, due to errors in estimates when sample sizes are small. Mann-Whitney U Tests found that S. dawsoniae and S. glaucus were significantly different for nucleotide diversity (π; p <0.001), approaching significance for average number of alleles (A; p=0.068) and number of polymorphic loci (P; p=0.093), and not significantly different for expected heterozygosity (He; p = 1.000), observed heterozygosity (Ho; p = 1.000), or inbreeding coefficient (FIS; p = 0.622).
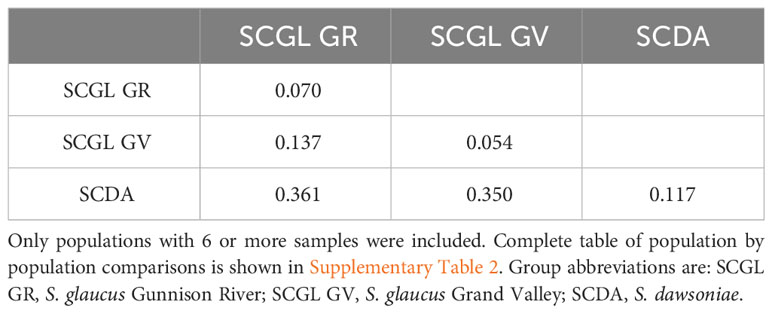
Table 2 Pairwise matrix of average genetic distance (Fst) among groups of S. dawsoniae and S. glaucus.
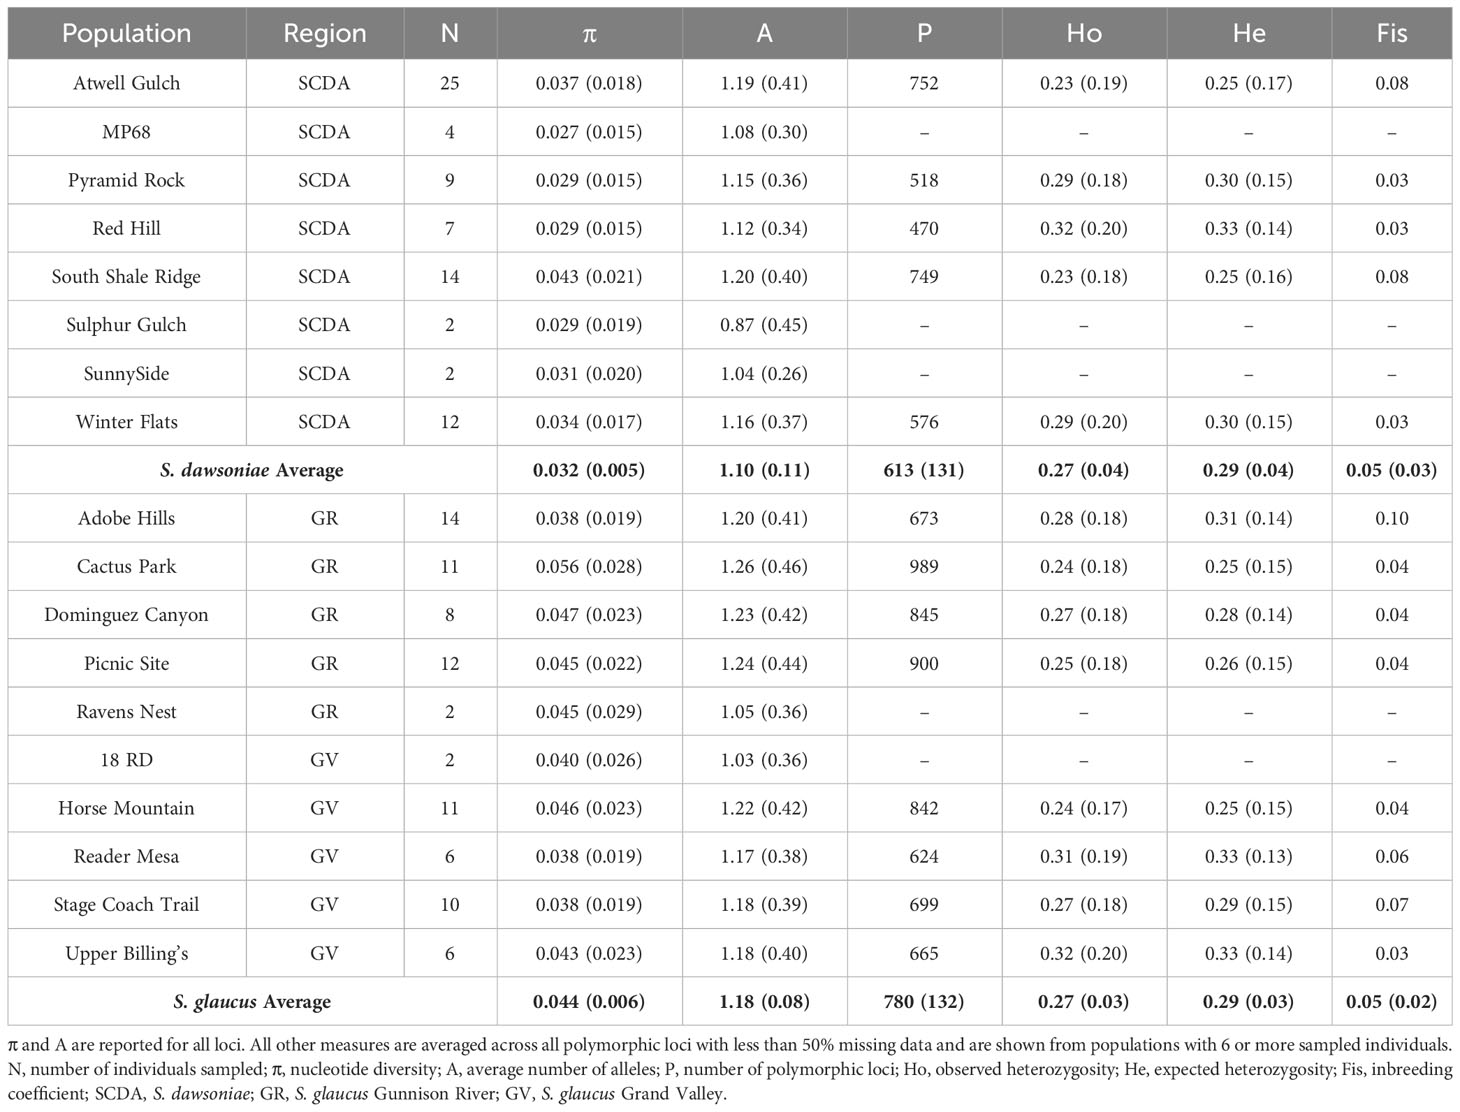
Table 3 Population genetic diversity statistics using the Population Structure dataset with the standard error in parentheses and species averages shown in bold.
4 Discussion
Sclerocactus has long been a taxonomic challenge due to variability in measurable morphological traits both within and among taxa, leading to multiple competing classifications (Heil and Porter, 1994; Hochstätter, 1995; Hochstätter, 1996a; Hochstätter, 1996b, Hochstätter, 1997; Porter et al., 2000). Sclerocactus taxonomic challenges are further compounded by the fact that close to 60% of all species are of conservation concern (G1 or G2, NatureServe, 2023a; USFWS, 2023a). Hence, which species are recognized can have significant impacts on how finite conservation funding is allocated. As shown here, recent advances in reduced representation next generation DNA sequencing provides an appealing approach to generate large genomic datasets capable of resolving taxonomic relationships and directing conservation activities to the taxa most in need.
4.1 Sclerocactus taxonomy
All genetic analyses support recognizing Sclerocactus glaucus as two distinct evolutionary entities at the level of species. What was previously described as S. glaucus North (Schwabe et al., 2015) was shown to be a substantially divergent group, now recognized as Sclerocactus dawsoniae (McGlaughlin and Naibauer in press2). Phylogenetic analyses (Figure 2) resolved 4 highly supported monophyletic groups: 1) S. glaucus – containing all populations from the Grand Valley and Gunnison River geographic areas; 2) S. dawsoniae – containing all populations previously recognized as S. glaucus North; 3) S. parviflorus – containing populations from Colorado, New Mexico, and Utah; and 4) a combined S. brevispinus and S. wetlandicus. The split between S. glaucus and S. dawsoniae is the most recent divergence within this analysis, but the divergence is substantial and well supported. The Principle Coordinate Analyses (Figures 3A, B) provides further support of the distinction among taxa, with the four groups all occupying distinct character space. Finally, measures of genetic distance (Table 1) show high levels of divergence among all groups except for S. brevispinus and S. wetlandicus, and S. glaucus Grand Valley and Gunnison River geographic areas.
Despite numerous competing Sclerocactus treatments, limited research has investigated genetic relationships among species. Porter et al. (2000) generated the only Sclerocactus wide phylogeny using chloroplast DNA sequence data which validated that the genus was monophyletic, but they were unable to resolve species relationships. A later study by Porter et al. (2013) examined genetic and morphological relationships among S. glaucus, S. brevispinus, and S. wetlandicus and concluded that these species should continue to be recognized as distinct taxa. Our results agree that S. glaucus is distinctive from S. brevispinus and S. wetlandicus, but we cannot resolve the latter two taxa. It is important to note that Porter et al. (2013) did not find species supporting differences in chloroplast DNA sequences and their summary analyses of AFLP genetic structure included S. glaucus, which was likely driving the signal of among species genetic structure. Additionally, a Masters Thesis using chloroplast DNA sequence data and nuclear microsatellites also could not resolve a genetic distinction between S. brevispinus and S. wetlandicus (Hubbard, 2014). The lack of genetic distinction among S. brevispinus and S. wetlandicus despite identifiable morphological differences continues to be an active area of research (McGlaughlin unpublished data)1. Schwabe et al. (2015) confirmed that there is genetic distinction among S. parviflorus and S. glaucus but did not place these species into a larger phylogenetic context.
The taxonomic accuracy of named Sclerocactus in northwestern New Mexico was also recently investigated using RAD-seq in a management report (Porter et al., 2018). The taxonomic placement of S. cloverae has been debated as well as the distinction of S. cloverae subsp. cloverae and subsp. brackii, with the two subspecies being differentiated based largely on size and habitat. Porter et al. (2018) concluded that S. cloverae should not be recognized as containing distinct subspecies, postulating that local infestation of cactus weevil or cactus longhorn beetle may have led to the loss of larger plants (subsp. cloverae like) at impacted locations. This study was also able to verify that S. cloverae was not closely related to S. whipplei, which it was originally described as a variety of, rather being most closely related to S. parviflorus. Interestingly, Porter et al. (2018) did not resolve S. parviflorus as a monophyletic species, which aligns with the current phylogenetic analyses where we observed considerable divergence between S. parviflorus located in northwestern New Mexico and northeastern Utah that is distinctive from populations located along the Colorado/Utah border (Supplementary Figure 2). This research lends support to our contention that the true units of biological diversity within Sclerocactus are not well understood and that they cannot be accurately resolved without the use of genetic analyses.
4.2 Population diversity
At the population level, S. dawsoniae and S. glaucus were resolved as genetically distinct species with substantial genetic divergence (Table 2). Limited previous studies have examined genetic distinction among populations of Sclerocactus species and sub-species. Measures of genetic divergence (FST) between S. dawsoniae and S. glaucus were higher than previous microsatellite based estimates comparing S. glaucus and S. parviflorus (Schwabe et al., 2015) or S. brevihamatus subsp. tobuschii and subsp. brevihamatus (Rayamajhi and Sharma, 2018), and RAD-seq based estimates between Sclerocactus cloverae subsp. cloverae and subsp. brackii (Porter et al., 2018). Limited admixture was observed between S. dawsoniae and S. glaucus populations in the Grand Valley (Figure 4; Supplementary Figure 3), with only 5 individuals having 5-8% admixture between Groups 1 and 2 (Supplementary Table 2). Populations of S. dawsoniae east of the Colorado River (Atwell Gulch and Sunnyside) and in the north-east (Red Hill, Mile Post, and South Shale Ridge) formed well supported clades in the taxonomic analysis (Supplementary Figure 2), but there was not distinctive genetic structure in other analyses. Within S. glaucus, slight genetic structure between Grand Valley and Gunnison River populations was observed (Figure 3C; Supplementary Figure 3; Table 2), which has been suggested in a previous management report (McGlaughlin and Neale, 2017). Levels of heterozygosity were comparable between S. dawsoniae and S. glaucus, but lower than previous estimates using nuclear microsatellites (Schwabe et al., 2015), which is a common trend in studies that compare RADseq and microsatellite data (Sunde et al., 2020). However, S. dawsoniae had significantly lower levels of nucleotide diversity than S. glaucus. This pattern suggests that S. dawsoniae has not experienced recent population bottlenecks, but reduced nucleotide diversity is indicative of it being a younger species with a with smaller geographic range and total population size.
4.3 Sclerocactus dawsoniae morphology and distribution
The genetic data presented here is part of the basis for recognizing S. dawsoniae as a distinct species along with morphological features and geographic separation that also support this distinction. As described by McGlaughlin and Naibauer (in press)2, S. dawsoniae differs from S. glaucus by having a smaller size (average of 7.42 cm tall x 5.07 cm wide v.s. 10.8 cm tall x 7.7 cm wide) and fewer spines per areole (average of 7.9 vs. 10.6). The distribution of S. dawsoniae is also allopatric relative to the distribution of S. glaucus, occurring north and west of Colorado Hwy 65, near De Beque, CO. There is a 10 km distance between the closest populations of genetically identified S. dawsoniae and S. glaucus. The ranges of both S. dawsoniae and S. glaucus have been extensively surveyed and it is unlikely that there are any occurrences that connect the two species ranges. Since morphological characters have been shown to be misleading in Sclerocactus (Schwabe et al., 2015; Porter et al., 2018; Porter et al., 2013; McGlaughlin unpublished data)1, we feel that geography and genetic data are the best tools to identify species in this region.
4.4 Conservation implications
In 2023, the U.S. Fish and Wildlife Service (USFWS, 2023b) recommended delisting S. glaucus (including S. dawsoniae) based on long-term population monitoring, designation of protected habitat, recent estimations of minimum population sizes, and sufficient species Redundancy, Resiliency, and Representation (USFWS, 2023b). Colorado Bureau of Land Management (BLM) has documented a stable/increasing trend in S. glaucus across its entire range and in one population of S. dawsoniae since 2009. Colorado BLM has also designated ten protected areas with special management status across the distribution of S. glaucus (112,605 acres) and four protected areas for S. dawsoniae (45,753 acres). Most significantly, estimates for minimum population size across the range of S. glaucus (as treated here) were considerably larger (103,086 ± 34,966 individual plants; Krening et al., 2021) than previously reported by Colorado Natural Heritage Program (16,800 individuals; CNHP, 2017) and at the time of ESA listing (15,000 individuals; Federal Resister, 1979). However, minimum population estimates for S. dawsoniae have been suggested to be much lower than expected (17,362 individual plants; BLM, 2023), compared to the numbers reported in the recent Species Status Assessment Report (31,867 individuals; USFWS, 2022 pg. 14). This updated minimum population estimate for S. dawsoniae is 54% lower than what USFWS recognizes. Additionally, 86% of S. dawsoniae individuals are believed to occur in one management area (Roan Creek; 14,901 individuals; BLM, 2023). The substantially lower population number and unequal distribution of S. dawsoniae individuals across the species range leads to concerns about the species ability to respond to potential stochastic disturbances. This study also shows that S. dawsoniae has significantly less nucleotide diversity than S. glaucus, leading to concerns about the ability for this species to adapt to changing conditions. Although the most recent scientific data indicates that S. glaucus is stable and should be a candidate for delisting, we do not feel that S. dawsoniae exhibits the population number, representation, or redundancy necessary to persist in the future without further conservation actions. Without further action by the U.S. Fish and Wildlife Service, a delisting decision for S. glaucus will simultaneously remove all Endangered Species Act protections for S. dawsoniae.
The taxonomic splitting of S. glaucus and S. dawsoniae has widespread implications for conservation and management, due to these two species having vastly different conservation needs. Sclerocactus glaucus has many individuals across its range (100,000+ individuals), monitored populations are stable or increasing in size, genetic diversity is relatively high, and there are habitat protections throughout its entire distribution. In contrast, S. dawsoniae is a narrowly endemic species with a small estimated population size (~17,362 individuals), reduced levels of genetic diversity, and an unequal abundance across the species range with an estimated 86% of S. dawsoniae located in a single management area. Based on our taxonomic split, resources for conservation should be directed to S. dawsoniae.
4.5 Taxonomic accuracy in conservation
As shown here, taxonomy-based research is essential for defining elements of biodiversity and directing conservation funding to protect that diversity. Although disagreements exist about how best to incorporate taxonomy into conservation (Thomson et al., 2018), the value of modern genetic approaches is clear (Stanton et al., 2019). Reduced representation sequencing is particularly valuable because it has been shown to differentiate cryptic species (Malaney et al., 2017; Quattrini et al., 2019; Melville et al., 2021), define population structure (Pedraza-Marrón et al., 2019), provide assessments of genetic health (Zhao et al., 2022), does not require previous knowledge of an organisms’ genome, and is relatively quick and cost effective (Andrews et al., 2016). The current work demonstrates the importance of having robust genetic datasets when planning conservation activities for species of concern. Moving forward, we recommend that government stakeholders prioritize supporting genetic studies of endangered species prior to making any changes to listing decisions.
Data availability statement
The datasets presented in this study can be found in online repositories. The names of the repository/repositories and accession number(s) can be found below: https://www.ncbi.nlm.nih.gov/, PRJNA1023954.
Author contributions
MM: Conceptualization, Data curation, Formal Analysis, Funding acquisition, Project administration, Resources, Supervision, Writing – original draft, Writing – review & editing. SN: Data curation, Formal Analysis, Investigation, Methodology, Software, Writing – original draft, Writing – review & editing.
Funding
The author(s) declare financial support was received for the research, authorship, and/or publication of this article. Data collection for this project was funded by a grant from the Colorado Bureau of Land Management (L17AS00170) with associated cost share from the University of Northern Colorado (36708A). Genetic samples collected for other funded projects were used, including awards from the US Fish and Wildlife Service (S. brevispinus and S. wetlandicus) and the New Mexico Bureau of Land Management (New Mexico S. parviflorus). This research was made possible by funding from Colorado Bureau of Land Management (Agreement L17AC00247) and the University of Northern Colorado (fund 36708A).
Acknowledgments
We thank Carol Dawson and Phil Krening (BLM, Colorado State Office), Anna Lincoln (BLM, Grand Junction Field Office), Ken Holsinger (BLM, Uncompaghre Field Office), WestWater Engineering (Grand Junction, CO), Denver Botanic Gardens (Denver, CO), and the US Fish and Wildlife (Western Colorado Ecological Services Field Office) for their field and collection contributions.
Conflict of interest
The authors declare that the research was conducted in the absence of any commercial or financial relationships that could be construed as a potential conflict of interest.
The author(s) declared that they were an editorial board member of Frontiers, at the time of submission. This had no impact on the peer review process and the final decision.
Publisher’s note
All claims expressed in this article are solely those of the authors and do not necessarily represent those of their affiliated organizations, or those of the publisher, the editors and the reviewers. Any product that may be evaluated in this article, or claim that may be made by its manufacturer, is not guaranteed or endorsed by the publisher.
Supplementary material
The Supplementary Material for this article can be found online at: https://www.frontiersin.org/articles/10.3389/fcosc.2023.1310985/full#supplementary-material
Footnotes
- ^ McGlaughlin, M. E. (n.d.). Genetic studies of Sclerocactus brevispinus and S. welandicus from the Uintah Basin, Utah. Unpublished genetic data.
- ^ McGlaughlin, M. E., and Naibauer, S. K. (in press). Sclerocactus dawsoniae (Cactaceae), a new species from Western Colorado, USA. Novon. Submitted October, 5, 2023.
References
Andrews K. R., Good J. M., Miller M. R., Luikart G., Hohenlohe P. A. (2016). Harnessing the power of RADseq for ecological and evolutionary genomics. Nat. Rev. Genet. 17 (2), 81–92. doi: 10.1038/nrg.2015.28
Aronesty E. (2013). Comparison of sequencing utility programs. Open Bioinf. J. 7 (1), 1–8. doi: 10.2174/1875036201307010001
Baird N. A., Etter P. D., Atwood T. S., Currey M. C., Shiver A. L., Lewis Z. A., et al. (2008). Rapid SNP discovery and genetic mapping using sequenced RAD markers. PloS One 3 (10), e3376. doi: 10.1371/journal.pone.0003376
Balao F., Lorenzo M. T., Sánchez-Robles J. M., Paun O., García-Castaño J. L., Terrab A., et al. (2020). Early diversification and permeable species boundaries in the Mediterranean firs. Ann. Bot. 125 (3), 495–507. doi: 10.1093/aob/mcz186
Bolger A. M., Lohse M., Usadel B. (2014). Trimmomatic: a flexible trimmer for Illumina sequence data. Bioinformatics 30 (15), 2114–2120. doi: 10.1093/bioinformatics/btu170
Bottrill M. C., Joseph L. N., Carwardine J., Bode M., Cook C., Game E. T., et al. (2008). Is conservation triage just smart decision making? Trends Ecol. Evol. 23 (12), 649–654. doi: 10.1016/j.tree.2008.07.007
Bureau of Land Management (BLM) (2023). Estimating the Minimum Population Size of Dawson’s Hookless Cactus (Sclerocactus dawsoniae). Manuscript in preparation.
Buxton R. T., Avery-Gomm S., Lin H. Y., Smith P. A., Cooke S. J., Bennett J. R. (2020). Half of resources in threatened species conservation plans are allocated to research and monitoring. Nat. Commun. 11 (1), 4668. doi: 10.1038/s41467-020-18486-6
Coates D. J., Byrne M., Moritz C. (2018). Genetic diversity and conservation units: dealing with the species-population continuum in the age of genomics. Front. Ecol. Evol. 6, 165. doi: 10.3389/fevo.2018.00165
Colorado Natural Heritage Program (CNHP) (2017). Sclerocactus glaucus Element Occurrence Records (Fort Collins, CO: Colorado State University).
Doyle J. J., Doyle J. L. (1987). A rapid DNA isolation procedure for small quantities of fresh leaf tissue. Phytochemical bulletin 19 (1), 11–15.
Eaton D. A., Overcast I. (2020). ipyrad: Interactive assembly and analysis of RADseq datasets. Bioinformatics 36 (8), 2592–2594. doi: 10.1093/bioinformatics/btz966
Elshire R. J., Glaubitz J. C., Sun Q., Poland J. A., Kawamoto K., Buckler E. S., et al. (2011). A robust, simple genotyping-by-sequencing (GBS) approach for high diversity species. PloS One 6 (5), e19379. doi: 10.1371/journal.pone.0019379
Excoffier L., Lischer H. E. (2010). Arlequin suite ver 3.5: a new series of programs to perform population genetics analyses under Linux and Windows. Mol. Ecol. Resour. 10 (3), 564–567. doi: 10.1111/j.1755-0998.2010.02847.x
Federal Register (1979). Endangered and threatened wildlife and plants; determination that Sclerocactus glaucus is a threatened species. Federal Register 44 (198), 58868–58870.
Fuentes-Pardo A. P., Ruzzante D. E. (2017). Whole-genome sequencing approaches for conservation biology: Advantages, limitations and practical recommendations. Mol. Ecol. 26 (20), 5369–5406. doi: 10.1111/mec.14264
Gerber L. R. (2016). Conservation triage or injurious neglect in endangered species recovery. Proc. Natl. Acad. Sci. 113 (13), 3563–3566. doi: 10.1073/pnas.1525085113
Gippoliti S., Cotterill F. P., Zinner D., Groves C. P. (2018). Impacts of taxonomic inertia for the conservation of African ungulate diversity: an overview. Biol. Rev. 93 (1), 115–130. doi: 10.1111/brv.12335
Grover A., Sharma P. C. (2016). Development and use of molecular markers: past and present. Crit. Rev. Biotechnol. 36 (2), 290–302. doi: 10.3109/07388551.2014.959891
Haig S. M., Miller M. P., Bellinger R., Draheim H. M., Mercer D. M., Mullins T. D. (2016). The conservation genetics juggling act: integrating genetics and ecology, science and policy. Evolutionary Appl. 9 (1), 181–195. doi: 10.1111/eva.12337
Harrison N., Kidner C. A. (2011). Next–generation sequencing and systematics: What can a billion base pairs of DNA sequence data do for you? Taxon 60 (6), 1552–1566. doi: 10.1002/tax.606002
Hochstätter F. (1989). Nieubeschrijving Sclerocactus wetlandicus species nova-Een nieuwe Sclerocactus uit Uintah County, Utah, USA. Succulenta 68, 123–126.
Hochstätter F. (1995). The genus Sclerocactus (Cactaceae)-part 1. Br. Cactus Succulent J. 13 (2), 73–79.
Hochstätter F. (1996a). The genus Sclerocactus (Cactaceae)-part 2. Br. Cactus Succulent J. 14 (2), 76–84.
Hochstätter F. (1996b). The genus Sclerocactus (Cactaceae)-part 3. Br. Cactus Succulent J. 14 (4), 183–188.
Hochstätter F. (1997). The genus Sclerocactus (Cactaceae)-part 4. Br. Cactus Succulent J. 15 (2), 74–81.
Hubbard A. R. (2014). Analysis of Sclerocactus Wetlandicus and S. Brevispinus Genetic Diversity and Population Structure in the Uinta Basin, Utah (Greeley (CO: University of Northern Colorado).
Jackson S. M., Baker A. M., Eldridge M. D. B., Fisher D. O., Frankham G. J., Lavery T. H., et al. (2022). The importance of appropriate taxonomy in Australian mammalogy. Aust. Mammalogy. doi: 10.1071/AM22016
Jombart T. (2008). adegenet: a R package for the multivariate analysis of genetic markers. Bioinformatics 24 (11), 1403–1405. doi: 10.1093/bioinformatics/btn129
Krening P. P., Dawson C. A., Holsinger K. W., Willoughby J. W. (2021). A sampling-based approach to estimating the minimum population size of the federally threatened colorado hookless cactus (Sclerocactus glaucus). Natural Areas J. 41 (1), 4–10. doi: 10.3375/043.041.0102
Lischer H. E., Excoffier L. (2012). PGDSpider: an automated data conversion tool for connecting population genetics and genomics programs. Bioinformatics 28 (2), 298–299. doi: 10.1093/bioinformatics/btr642
Malaney J. L., Demboski J. R., Cook J. A. (2017). Integrative species delimitation of the widespread North American jumping mice (Zapodinae). Mol. Phylogenet. Evol. 114, 137–152. doi: 10.1016/j.ympev.2017.06.001
McGlaughlin M. E., Neale J. R. (2017). Genetic structure of Sclerocactus glaucus (Colorado Hookless Cactus) in Western Colorado, Unpublished Technical Report to Colorado USFWS and Bureau of Land Management.
Melville J., Chapple D. G., Keogh J. S., Sumner J., Amey A., Bowles P., et al. (2021). A return-on-investment approach for prioritization of rigorous taxonomic research needed to inform responses to the biodiversity crisis. PloS Biol. 19 (6), e3001210. doi: 10.1371/journal.pbio.3001210
Morrison W. R. III, Lohr J. L., Duchen P., Wilches R., Trujillo D., Mair M., et al. (2009). The impact of taxonomic change on conservation: Does it kill, can it save, or is it just irrelevant? Biol. Conserv. 142 (12), 3201–3206. doi: 10.1016/j.biocon.2009.07.019
NatureServe (2023a) NatureServe Network Biodiversity Location Data accessed through NatureServe Explorer (Arlington, Virginia: NatureServe). Available at: https://explorer.natureserve.org/Searchq (Accessed September 25, 2023).
NatureServe (2023b) NatureServe Network Biodiversity Location Data accessed through NatureServe Explorer (Arlington, Virginia: NatureServe). Available at: https://explorer.natureserve.org/Taxon/ELEMENT_GLOBAL.2.832412/Sclerocactus_glaucus (Accessed September 25, 2023).
Pante E., Abdelkrim J., Viricel A., Gey D., France S. C., Boisselier M. C., et al. (2015). Use of RAD sequencing for delimiting species. Heredity 114 (5), 450–459. doi: 10.1038/hdy.2014.105
Parchman T. L., Gompert Z., Mudge J., Schilkey F. D., Benkman C. W., Buerkle C. A. (2012). Genome-wide association genetics of an adaptive trait in lodgepole pine. Mol. Ecol. 21 (12), 2991–3005. doi: 10.1111/j.1365-294X.2012.05513.x
Pedraza-Marrón C. D. R., Silva R., Deeds J., Van Belleghem S. M., Mastretta-Yanes A., Domínguez-Domínguez O., et al. (2019). Genomics overrules mitochondrial DNA, siding with morphology on a controversial case of species delimitation. Proc. R. Soc. B 286 (1900), 20182924. doi: 10.1098/rspb.2018.2924
Porter J. M., Clifford A., Medina N., Namoff S., Jensen N., Cohen D. (2018). Genetic diversity within Sclerocactus cloverae Heil & Porter based on ddRAD-seq: the genetic basis for subspecies recognition, Unpublished Technical Report to New Mexico USFWS and Bureau of Land Management. doi: 10.5642/aliso.20133002.2
Porter J. M., Cruse-Sanders J., Prince L., Lauri R. (2013). Species status of Sclerocactus brevispinus, S. wetlandicus and S. glaucus: inferences from morphology, chloroplast DNA sequences, and AFLP markers. Aliso: A J. Systematic Floristic Bot. 30 (2), 69–83. doi: 10.5642/aliso.20133002.2
Porter J. M., Kinney M. S., Heil K. D. (2000). Relationships between Sclerocactus and Toumeya (Cactaceae) based on chloroplast trnL-trnF sequences. Haseltonia 7, 8–23.
Quattrini A. M., Wu T., Soong K., Jeng M. S., Benayahu Y., McFadden C. S. (2019). A next generation approach to species delimitation reveals the role of hybridization in a cryptic species complex of corals. BMC Evolutionary Biol. 19, 1–19. doi: 10.1186/s12862-019-1427-y
Raj A., Stephens M., Pritchard J. K. (2014). fastSTRUCTURE: variational inference of population structure in large SNP data sets. Genetics 197 (2), 573–589. doi: 10.1534/genetics.114.164350
Rambaut A. (2016). FigTree v1. 4.3 2006–2016. Tree Figure Drawing Tool. Available at: http://tree.bio.ed.ac.uk/software/figtree/.
Rayamajhi N., Sharma J. (2018). Genetic diversity and structure of a rare endemic cactus and an assessment of its genetic relationship with a more common congener. Genetica 146, 329–340. doi: 10.1007/s10709-018-0024-0
Reyes-Velasco J., Adams R. H., Boissinot S., Parkinson C. L., Campbell J. A., Castoe T. A., et al. (2020). Genome-wide SNPs clarify lineage diversity confused by coloration in coralsnakes of the Micrurus diastema species complex (Serpentes: Elapidae). Mol. Phylogenet. Evol. 147, 106770. doi: 10.1016/j.ympev.2020.106770
Schwabe A. L., Neale J., McGlaughlin M. E. (2015). Examining the genetic integrity of a rare endemic Colorado cactus (Sclerocactus glaucus) in the face of hybridization threats from a close and widespread congener (Sclerocactus parviflorus). Conserv. Genet. 16, 443–457. doi: 10.1007/s10592-014-0671-3
Stamatakis A. (2014). RAxML version 8: a tool for phylogenetic analysis and post-analysis of large phylogenies. Bioinformatics 30 (9), 1312–1313. doi: 10.1093/bioinformatics/btu033
Stanton D. W., Frandsen P., Waples R. K., Heller R., Russo I. R. M., Orozco-terWengel P. A., et al. (2019). More grist for the mill? Species delimitation in the genomic era and its implications for conservation. Conserv. Genet. 20, 101–113. doi: 10.1007/s10592-019-01149-5
Sunde J., Yıldırım Y., Tibblin P., Forsman A. (2020). Comparing the performance of microsatellites and RADseq in population genetic studies: Analysis of data for pike (Esox lucius) and a synthesis of previous studies. Front. Genet. 11, 218. doi: 10.3389/fgene.2020.00218
Thomson S. A., Pyle R. L., Ahyong S. T., Alonso-Zarazaga M., Ammirati J., Araya J. F., et al. (2018). Taxonomy based on science is necessary for global conservation. PloS Biol. 16 (3), e2005075. doi: 10.1371/journal.pbio.2005075
Tripp E. A., Tsai Y. H. E., Zhuang Y., Dexter K. G. (2017). RAD seq dataset with 90% missing data fully resolves recent radiation of Petalidium (Acanthaceae) in the ultra-arid deserts of Namibia. Ecol. Evol. 7 (19), pp.7920–7936. doi: 10.1002.ece3.3274
United States Fish and Wildlife Service (USFWS) (2021) Species status assessment report for Colorado hookless cactus (Sclerocactus glaucus and Sclerocactus dawsoniae) (Lakewood, Colorado). Available at: https://ecos.fws.gov/ecp/species/2280#ssa (Accessed September 25, 2023).
United States Fish and Wildlife Service (USFWS) (2022) Species Status Assessment Report for Colorado Hookless Cactus (Sclerocactus glaucus and Sclerocactus dawsoniae). Available at: https://ecos.fws.gov/ServCat/DownloadFile/231569.
United States Fish and Wildlife Service (USFWS) (2023a) Sclerocactus. Available at: https://ecos.fws.gov/ecp/report/specieslistingsbytaxgroupstatusCategory=Listed&groupName=All%20Plants (Accessed September 25, 2023).
United States Fish and Wildlife Service (USFWS) (2023b). Endangered and threatened wildlife and plants; removal of the Colorado hookless cactus from the federal list of endangered and threatened wildlife. Federal Register 88 (69), 21582–21600.
University of Colorado Boulder Research Computing (CURC) (2021). PetaLibrary (University of Colorado Boulder). doi: 10.25811/81nc-wv41
University of Colorado Boulder Research Computing (CURC) (2023). Alpine (University of Colorado Boulder). doi: 10.25811/k3w6-pk81
Wagner F., Ott T., Schall M., Lautenschlager U., Vogt R., Oberprieler C. (2020). Taming the Red Bastards: Hybridisation and species delimitation in the Rhodanthemum arundanum-group (Compositae, Anthemideae). Mol. Phylogenet. Evol. 144, 106702. doi: 10.1016/j.ympev.2019.106702
Welsh S. L. (1984). Utah flora: cactaceae. Great Basin Nat. 44 (1), 52–69. Available at: https://www.jstor.org/stable/41712042.
Wiedenfeld D. A., Alberts A. C., Angulo A., Bennett E. L., Byers O., Contreras-MacBeath T., et al. (2021). Conservation resource allocation, small population resiliency, and the fallacy of conservation triage. Conserv. Biol. 35 (5), 1388–1395. doi: 10.1111/cobi.13696
Wilson K. A., Law E. A. (2016). Ethics of conservation triage. Front. Ecol. Evol. 4, 112. doi: 10.3389/fevo.2016.00112
Keywords: RAD-seq, conservation genetics, taxonomy, Endangered Species Act, Sclerocactus dawsoniae
Citation: McGlaughlin ME and Naibauer SK (2023) Conservation genetics of Sclerocactus in Colorado: the importance of accurate taxonomy to conservation. Front. Conserv. Sci. 4:1310985. doi: 10.3389/fcosc.2023.1310985
Received: 09 October 2023; Accepted: 28 November 2023;
Published: 14 December 2023.
Edited by:
Nicola Anthony, University of New Orleans, United StatesReviewed by:
Evandro Marsola Moraes, Federal University of Sao Carlos, BrazilShannon Fehlberg, Desert Botanical Garden, United States
Copyright © 2023 McGlaughlin and Naibauer. This is an open-access article distributed under the terms of the Creative Commons Attribution License (CC BY). The use, distribution or reproduction in other forums is permitted, provided the original author(s) and the copyright owner(s) are credited and that the original publication in this journal is cited, in accordance with accepted academic practice. No use, distribution or reproduction is permitted which does not comply with these terms.
*Correspondence: Mitchell E. McGlaughlin, bWl0Y2hlbGwubWNnbGF1Z2hsaW5AdW5jby5lZHU=