 Alanah Hayley Lewis1*
 Bex Gottlieb1
 Brett Wilson1
 Jack Sutton1
 Janeth Lessmann1
 Giacomo Delli2
 Grégoire Dubois3
 Heather C. Bingham1
- 1Nature Conserved, UN Environment Programme World Conservation Monitoring Centre, Cambridge, United Kingdom
- 2Arcadia Sistemi Informativi Territoriali s.r.l., Vigevano, PV, Italy
- 3Directorate for Sustainable Resources, Joint Research Centre of the European Commission, Ispra, Italy
A vast cross-societal effort will be needed to achieve the ambition of protecting and conserving 30% of the earth’s lands and oceans by 2030, as called for in Target 3 of the Kunming-Montreal Global Biodiversity Framework. While focus is often given to the 30% coverage aspect of this target, other elements – on the location and effectiveness of protected and conserved areas – are equally important. As the implementation of Target 3 progresses, it is increasingly acknowledged that non-profit organisations, for-profit organisations, and individual landowners play a key role by choosing to manage their lands and waters to deliver conservation outcomes. However, privately protected and conserved areas lack recognition by many governments charged with reporting progress on the target. For countries and territories where these areas have been reported, we use the World Database on Protected Areas to explore their contribution towards elements of Target 3, particularly coverage, connectivity and ecological representation. In addition, we explore how privately governed ‘other effective area-based conservation measures’ contribute to Target 3 in countries and territories where they have been identified. Our results demonstrate that privately protected and conserved areas play a significant role in some countries’ efforts to meet Target 3. Since these areas are known to be under-reported, we stress the need for scaled up efforts for their recognition and documentation. This is vital not only for Target 3 tracking and implementation, but to ensure private actors receive appropriate recognition and support for their role in tackling the biodiversity and climate crises.
1 Introduction
The unprecedented rate of global biodiversity loss (IPBES, 2019) and intensifying impacts of climate change (IPCC, 2021) are intertwined crises that require urgent international action (United Nations, 2021). With extinction rates now estimated to be thousands of times higher than background rates, scientists suggest we are undergoing a sixth mass extinction event (Barnosky et al., 2011). In addition, global mean temperatures, including ocean temperatures, continue to be the hottest on record (WMO, 2022). The interdependence of these crises is increasingly being recognised (Pörtner et al., 2021), with experts agreeing that successful solutions will need to address both crises simultaneously (IPBES, 2019; Pörtner et al., 2021; Smith and Young, 2022). Protected and conserved areas (PCAs) have long been considered the cornerstones of biodiversity conservation (IPBES, 2019), but their potential to protect vulnerable ecosystems, store carbon, and promote future carbon sequestration (Duncanson et al., 2023) make them one of the most effective solutions for tackling both biodiversity loss and mitigating climate change impacts (Smith and Young, 2022; Pörtner et al., 2021). Governments and other stakeholders have expanded the global coverage of PCAs in recent years, but the contributions of these areas to halting biodiversity loss also depends on their location and effectiveness. To date, improvements in coverage have not been matched by improvements in ecological representation, connectivity, coverage of important areas, or efforts to monitor effectiveness (UNEP-WCMC and IUCN, 2021b).
At the fifteenth Conference of the Parties (COP15) of the Convention on Biological Diversity (CBD), Parties to the Convention acknowledged the important role that PCAs will continue to play in tackling the biodiversity crisis. Specifically, Parties to the CBD committed to achieving Target 3 of the Kunming-Montreal Global Biodiversity Framework, which set out an ambitious goal to effectively conserve 30% of terrestrial and inland waters and coastal and marine areas through protected areas (PAs) and other effective area-based conservation measures (OECMs)1, recognising Indigenous and traditional territories, by 2030 (CBD, 2022). The target promotes the effective management and equitable governance of existing and new sites and ambitions also include improving the system of PCAs with respect to connectivity, ecological representation, and coverage of areas of importance for biodiversity and ecosystem services. All these elements will need to be addressed by the global community to achieve the ambition of Target 3 and to ensure the most successful outcomes for biodiversity and climate change mitigation.
Monitoring progress towards Target 3 and broader conservation goals requires a comprehensive understanding of the world’s existing PCAs. Currently, this understanding is limited as reported data is often skewed towards state-led approaches. In recent decades, non-state actors have received increasing attention for their contributions to achieving such targets (Bingham et al., 2017), however, the areas they conserve remain largely undocumented with little data (Borrini-Feyerabend et al., 2013). Privately protected areas (PPAs) and privately governed OECMs are defined as any site that meets the IUCN definition of a protected area (Dudley, 2008), or the CBD definition of an OECM (CBD, 2018), and is under the governance of a private actor. These private governance actors can include individual landowners, non-governmental organisations, research organisations, religious entities, and for-profit organisations, including corporations (Mitchell et al., 2018). PPAs and privately governed OECMs are a potential avenue through which non-state actors can contribute to Target 3 and diversify area-based conservation approaches, complementing state-led approaches (Bingham et al., 2021). With vast areas of the world in the hands of private landowners, the collective contributions of private actors to the implementation of Target 3 may prove substantial – particularly where their lands and waters fall in under-represented ecosystems, intersect with important habitats or ecosystem services, or provide landscape- or seascape-level conservation by connecting other PCAs.
The World Database on Protected Areas (WDPA) and World Database on Other Effective Area-Based Conservation Measures (WD-OECM) provide the headline indicator (CBD, 2023) of progress towards Target 3. They are the most complete global databases on PCAs (Milam et al., 2016; UNEP-WCMC, 2019), yet sites under private governance comprise just 6.55% of reported PAs and 2.44% of reported OECMs. This is thought to be a significant under-estimation of the actual conservation efforts being carried out by private actors worldwide. The primary reasons for this are thought to be a lack of recognition by governments and/or a lack of data at the national level (Bingham et al., 2017). In the case of OECMs, there is limited data across all governance types because the concept is new, meaning many governments have not yet recognised or reported data on OECMs. To date, studies focused on the contribution of PPAs to global coverage targets, ecological representation, and the connectivity of PCA networks have been restricted to specific ecoregions (Pliscoff & Fuentes-Castillo, 2011), groups of nations (Palfrey et al., 2022), individual countries (Fitzsimons and Wescott, 2001; Laurindo et al., 2017; Shanee et al., 2017; Clements et al., 2018; Nolte, 2018), or to explicit groups of species (Clements et al., 2018; Archibald et al., 2020). There therefore remains a critical lack of global scale analyses assessing the contribution of PCAs under private governance to biodiversity conservation efforts, particularly their potential role in helping to achieve Target 3.
To fill this gap, we analyse the contribution of internationally reported PPAs to achieving Target 3, examining their contribution to coverage, connectivity, ecological representation and coverage of areas important for biodiversity, comparing the results to PAs under other governance types. First, we focus on simple coverage metrics of PPAs before examining the intersection between PPAs and ecoregions (including priority ecoregions) and Key Biodiversity Areas (KBAs), finally investigating how PPAs contribute to connectivity. We then explore how privately governed OECMs could complement the impact of PPAs (and other PCAs) in achieving Target 3, assessing the additional benefits provided by these areas in countries and territories where they have been identified.
2 Methodology
2.1 Data preparation
The April 2023 versions of the WDPA and WD-OECM were used in these analyses (UNEP-WCMC & IUCN, 2023). We removed all sites reported as “Proposed” or “Not Reported” in the status field (STATUS). For spatial analyses and calculations of average size, we also removed all PAs designated as “UNESCO-MAB Biosphere Reserve” in the English designation field (DESIG_ENG), as these include buffer and transition zones, which are usually not considered PAs (UNEP-WCMC & IUCN, 2021a). Data on the core zones of UNESCO-MAB Biosphere Reserves – which meet the definition of a protected area – are retained as these are usually recorded as separate polygons representing nationally designated protected areas. A different approach is taken for UNESCO-MAB Biosphere Reserves reported to the WD-OECM. These are retained for analyses because they have been specifically identified as meeting the OECM definition by the data provider. We selected data on PPAs and privately governed OECMs from the broader dataset by filtering the datasets by governance type (GOV_TYPE), selecting data with the governance type ‘Individual landowners’, ‘For-profit organisations’ or ‘Non-profit organisations’. For comparison, a dataset on PAs and a dataset on OECMs under all other governance types (including ‘Not Reported’) were also produced. In summary, four datasets were produced; PPAs, privately governed OECMs, PAs not under private governance and OECMs not under private governance.
All privately governed PAs and OECMs reported to date were in polygon format. However, some sites under other forms of governance were reported as point data. For these, we buffered each point to equal the value of its reported area (REP_AREA) and in this process removed any point data with no reported area. We used the dissolve tool to prevent the double counting of areas where polygons overlapped. In some cases, PAs and OECMs consist of multiple spatial zones with differing descriptive data. For these instances we selected the descriptive data of the largest zone to be used in count statistics, except in the case of the area field (GIS_AREA), where the data was instead summed across the different zones. For national level count statistics, PAs and OECMs were assigned to countries and territories based on the ISO3 field of the WDPA or WD-OECM.
Analyses were carried out in ArcGIS Pro (v3.1.2) using Python 3. All data were transformed to the projected coordinate system Mollweide (world) for analyses. For spatial analyses at the national level, we intersected the four datasets with a basemap combining Exclusive Economic Zones (VLIZ, 2014) and terrestrial country boundaries (World Vector Shoreline, 3rd edition, National Geospatial-Intelligence Agency). A simplified version of this layer has been published in Nature Scientific Data journal (Brooks et al., 2016). PAs and OECMs were assigned to countries and territories based on the ISO3 codes of this basemap.
2.2 Data analysis
We calculated the coverage of PPAs and privately governed OECMs at both the global and national level using the standard methods of the Protected Planet Initiative (UNEP-WCMC and IUCN, 2021a). For coverage calculations and other spatial analyses, areas of overlap between privately governed PCAs and PCAs under non-private governance were considered as under non-private governance. This ensured that we only measured where privately governed PCAs provide exclusive, additional coverage outside of other forms of governance.
We also calculated the change in worldwide PPA coverage over time. This was carried out by collating information on the years that PPAs were reported as proposed, inscribed, adopted, designated, or established (STATUS_YR) and then calculating the cumulative coverage of PPAs across ten-year intervals from the first designated PPA in the 1870s up to the present day; for ~27% of all PPAs no STATUS_YR data was available, so these were excluded from the analysis.
We assessed the contribution of PPAs and privately governed OECMs to the protection of terrestrial ecoregions (Olson et al., 2001), marine ecoregions and pelagic provinces (Spalding et al., 2007; Spalding et al., 2012), as well as priority terrestrial and marine ecoregions (Olson and Dinerstein, 2002) and Key Biodiversity Areas (KBAs) (BirdLife International, 2023). This involved intersecting each of these datasets with our four prepared datasets. The area of intersection was calculated to give the percentage protection of each ecoregion, KBA or system of KBAs. These analyses were carried out at both at the global and national level.
The contribution of PPAs to terrestrial connectivity was calculated using the Protected Connected (ProtConn) indicator, defined as the percentage of an area that is covered by protected and connected lands (Saura et al., 2017; Saura et al., 2018), by calculating ProtConn with and without PAs under private governance. ProtConn indicators were calculated for countries and territories and for terrestrial ecoregions (Olson et al., 2001). OECMs were not included.
2.3 Data gaps
This paper is based on limited data. Given that data for only 39 countries and territories was available in the Protected Planet databases, our results highlight a worrying data gap that means we can provide only a limited insight into the actual conservation efforts of private actors. Currently, international reporting on area-based conservation is dominated by PAs under state governance, comprising around ~84% of all sites in the WDPA (UNEP-WCMC & IUCN, 2023). PPAs are the second most commonly reported governance type, yet only 18,580 PPAs have been reported internationally, comprising just 6.55% of all sites. The vast majority of reported coverage from PPAs occurs in just three countries: Australia, South Africa, and the USA, where robust PA reporting procedures and established frameworks for recognising non-state governance are in place (Bingham et al., 2017). It is also important to note that data on governance type has not been reported to the WDPA and WD-OECM for all PCAs. In this analysis, 6.55% of records did not have any governance type reported (GOV TYPE = ‘Not Reported’). Only PCAs with a reported private governance type were included in this analysis, meaning that other privately governed PCAs are likely to have been omitted. Notable examples are New Zealand and Brazil, where thousands of known PPAs are missing accurate data on their governance type. This issue also extends to most protected areas in Europe, where there is no option to submit data on governance type to the European Environment Agency’s database of nationally designated areas, which feeds into the WDPA. As a result, large PPA networks such as Finland’s cannot readily be identified in the WDPA. This highlights the need for both scaled up reporting on privately governed PCAs and improved reporting on governance types. Opportunities to address these issues are discussed in Bingham et al., 2021.
3 Results
3.1 Privately protected areas
3.1.1 Coverage
As of April 2023, there were 18,580 PAs reported to the WDPA under private governance, covering approximately 167,670 km2 of terrestrial and inland waters and 723 km2 of the marine realm. Whilst these sites comprise approximately 6.55% of all protected area records reported to the WDPA, they cover only 0.78% of protected terrestrial and inland waters and 0.002% of the protected marine realm. The average size of PPAs reported to the WDPA was relatively small, at 10.26 km2, compared to the average size of PAs under other forms of governance, which is 219 km2. Nonetheless, the coverage of PPAs has increased rapidly since around 1950, after a period of slow growth following the designation of the first reported PPA in 1876 (Figure 1)2. While this suggests a general increase in the rate of designation of PPAs over time, the shape of the curve could change substantially with improved reporting of both older and newer PPAs (see ‘data gaps’).
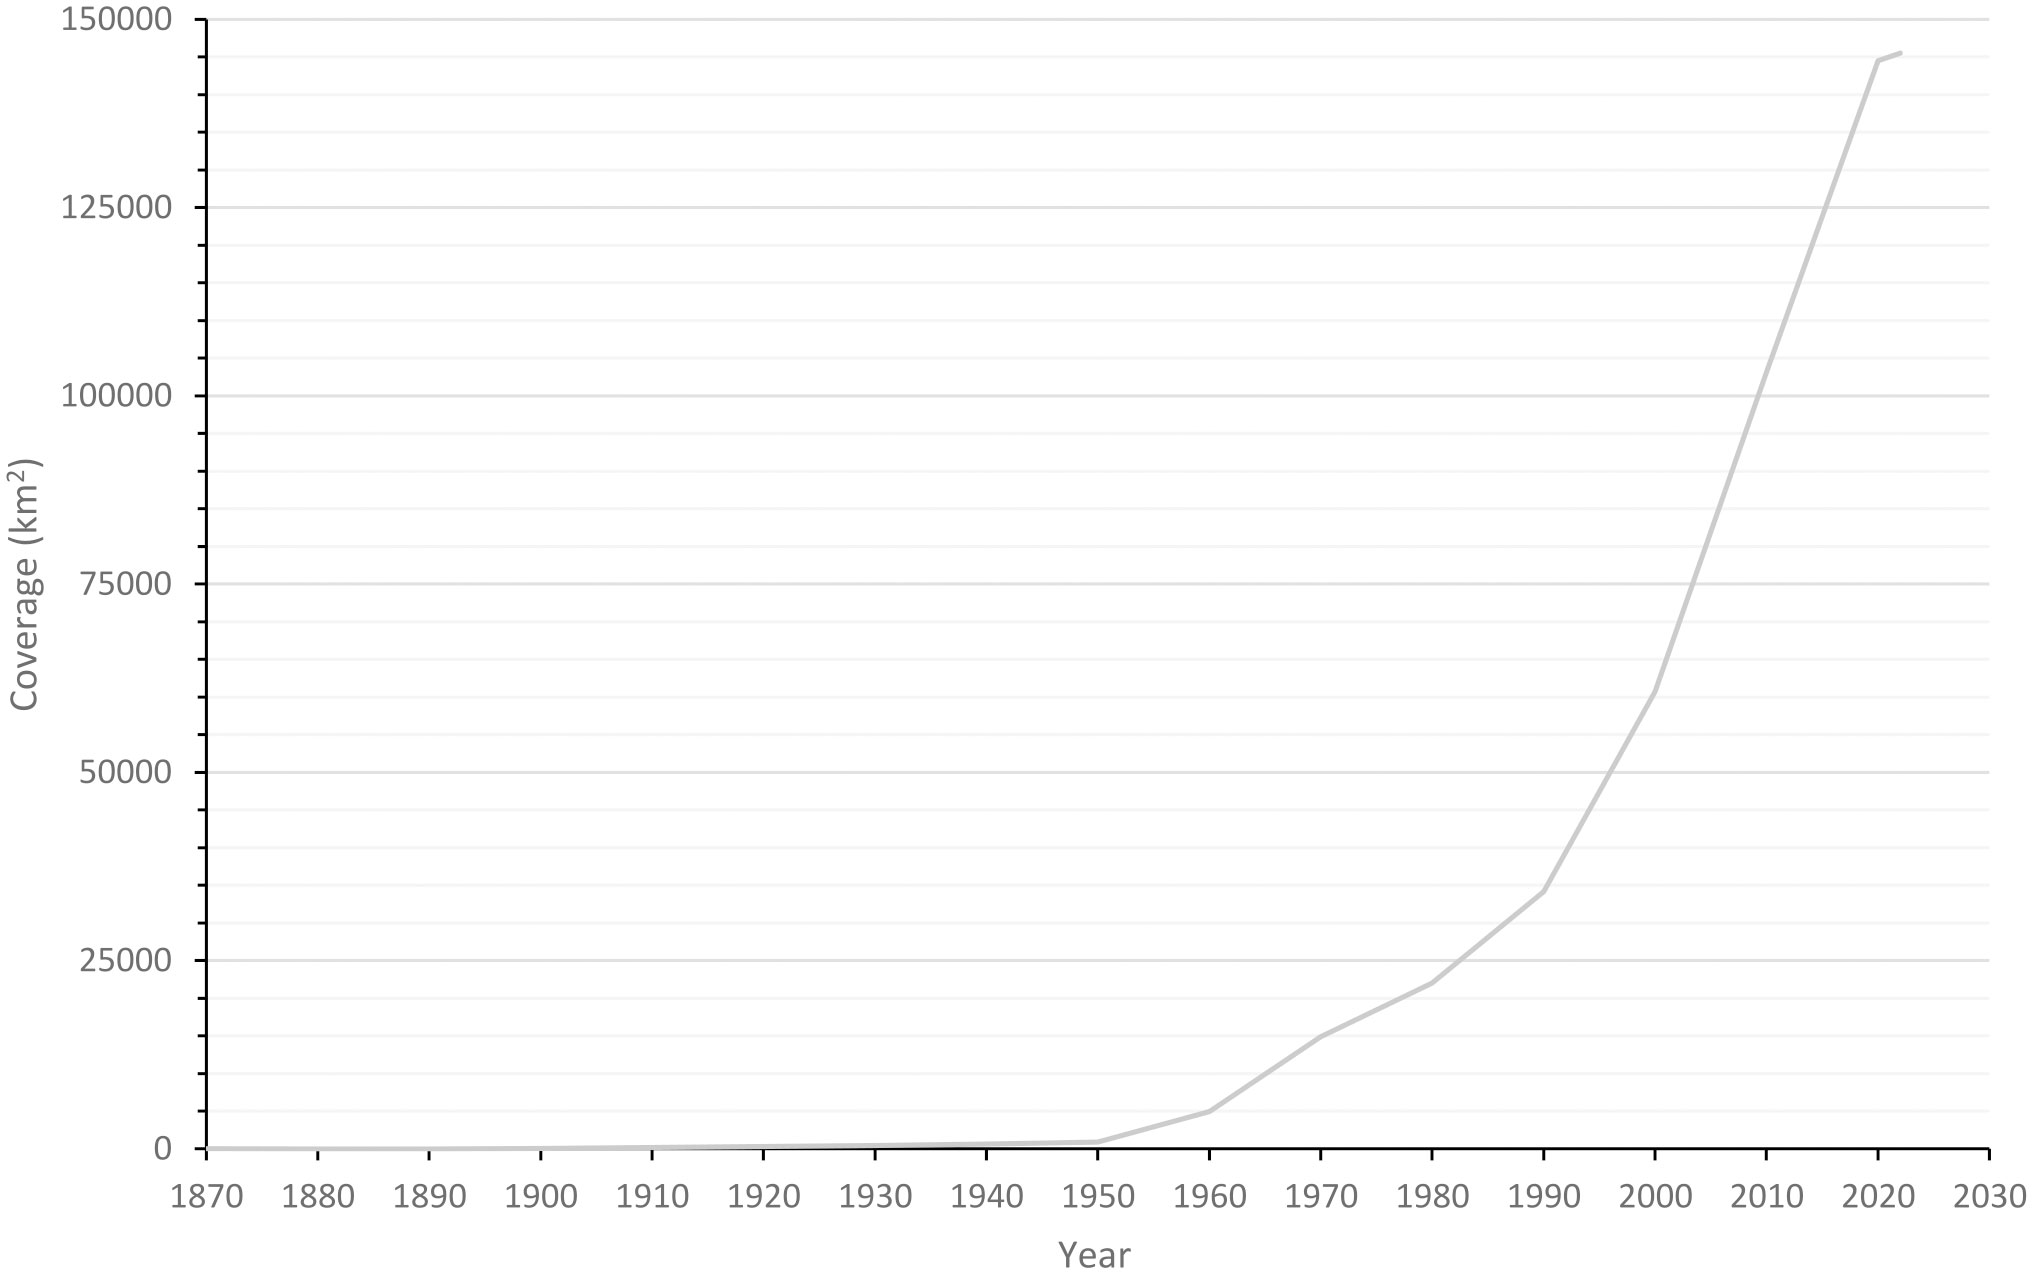
Figure 1 Change in global privately protected area coverage reported to the WDPA over time.
PPAs have been reported in 39 countries and territories. The majority of PPAs were located in the United States of America (USA) (11,877 PPAs), Canada (1,863 PPAs) and Australia (1,530 PPAs). The USA alone reported 63.9% of all PPAs and these three countries combined reported 82% of all PPAs in the WDPA (see Bingham et al., 2021). In four countries and territories, PPAs make up over 50% of all reported PAs. These were: Colombia (68.6%), The Kingdom of Eswatini (61.5%), Bermuda (57.1%), and South Africa (55.4%). In a further 7 countries and territories, PPAs made up over 25% of the reported PA network (Table 1). While for many countries and territories, large numbers of PPAs do not equate to large contributions to geographic coverage, in three countries and territories, PPAs contribute over 25% of the coverage of the PA network. These are The Kingdom of Eswatini (25.0%), Nepal (32.1%) and Aruba (98.1%).
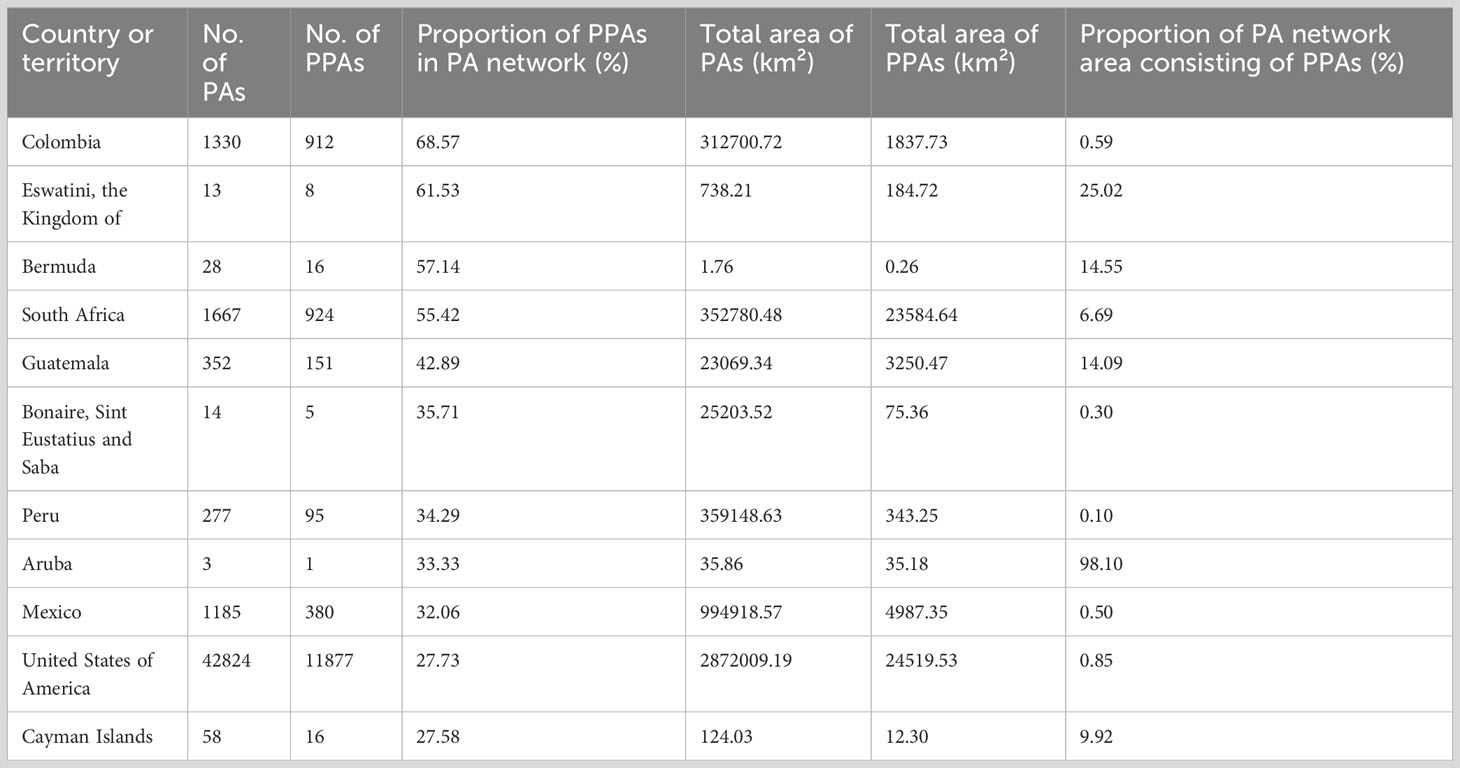
Table 1 The contribution of PPAs to the national protected area networks of the 11 countries or territories where the proportion of PPAs exceeds 25% of the total number of PAs.
3.1.2 Ecoregions
PPAs provided some level of protection for 235 (28.5%) terrestrial ecoregions worldwide, compared to 801 (97%) with coverage from PAs under other forms of governance. The Montane fynbos and renosterveld ecoregion of South Africa had the greatest coverage by PPAs at 13%. Four terrestrial ecoregions had at least 5% coverage by PPAs and 37 had coverage of at least 1%, but for most (96%) terrestrial ecoregions, the coverage provided by PPAs was less than 1%. In three cases, ecoregions were better represented in PPAs than other protected area types: Chimalapas montane forests and Oaxacan montane forests in Mexico and Highveld grasslands in South Africa. For eight terrestrial ecoregions, the addition of PPAs to PAs of other governance types pushed levels of coverage to exceed 30% of the ecoregion area.
In the marine realm, 41 (15.2%) marine ecoregions had some coverage by PPAs, whereas 257 (95.5%) marine ecoregions and pelagic provinces worldwide have coverage by PAs under other forms of governance. The spatial extent of protection of marine ecoregions by PPAs is minimal, with no ecoregions having greater than 1% coverage. Only two marine ecoregions had greater than 100 km2 within PPAs, specifically Delagoa eastern coast, Africa and Western and Northern Madagascar.
When only the section of each ecoregion falling within national borders was considered, there were 54 terrestrial ecoregions across 18 countries and territories where PPAs provided greater than 1% coverage, and six terrestrial ecoregions across five countries and territories where PPAs provided greater than 30% coverage. PPAs provided greater coverage than other forms of PA for 15 terrestrial ecoregions across 10 countries and territories and brought coverage levels above 30% for 12 terrestrial ecoregions across seven countries and territories. Nepal had three ecoregions with greater than 30% coverage exclusively by PPAs, two of which had greater protection by PPAs than by PAs under other forms of governance: Eastern Himalayan alpine shrub and meadows (53% PPA coverage; 4,493 km2), Eastern Himalayan subalpine conifer forests (36% PPA coverage; 1,822 km2), and Rock and ice (30% PPA coverage; 1,950 km2). In general, PPAs provided minimal protection to marine ecoregions and pelagic provinces at the national level, with no greater than 1% protection provided. The highest level of protection provided by PPAs was the portion of the Delagoa marine ecoregion within Mozambique’s national waters, with 0.82% coverage.
3.1.3 Priority ecoregions
The analysis of global priority ecoregions showed that 52 (36.4%) terrestrial and 17 (41.5%) marine priority ecoregions had at least some coverage by PPAs. Broadly, priority terrestrial ecoregions were poorly captured in PPAs; however, for 17 of these ecoregions, over 1,000 km2 was captured within PPAs. The largest area covered (in km2) by PPAs in a terrestrial priority ecoregion is the in the Northern Australia and Trans-Fly Savannas ecoregion, with around 37,037 km2 coverage. In addition, there were eight terrestrial priority ecoregions that had greater than 1% coverage by PPAs. The greatest percentage coverage occurred in the Fynbos ecoregion in South Africa, which had 8% (6,393 km2) coverage by PPAs. PPAs provided some coverage to 17 priority marine ecoregions, but this was very minimal (less than 0.1% in all cases). The greatest area covered (in km2) of a priority marine ecoregion was in the East African Marine ecoregion, with coverage of 211 km2.
3.1.4 Key biodiversity areas
PPAs provided some coverage to 554 or 13.8% of all recognised KBAs across 35 countries and territories (Figure 2). PPAs provided greater than 1% KBA coverage in nine countries and territories, with the greatest percentage coverage found in Aruba, with 77.6% (34 km2) KBA coverage. 94% of the largest reported PPA in the world, Annapurna (7,491 km2), overlapped with KBAs. In both Aruba and the Cayman Islands, PPAs provided greater total coverage of KBAs than PAs under other forms of governance. PPAs provided greater than 30% protection to 44 KBAs worldwide, and in 53 KBAs the addition of PPAs in addition to other forms of governance has resulted in greater than 30% protection. For 153 KBAs, the coverage provided by PPAs was greater than that provided by PAs under other governance types (within the borders of the countries and territories assessed).
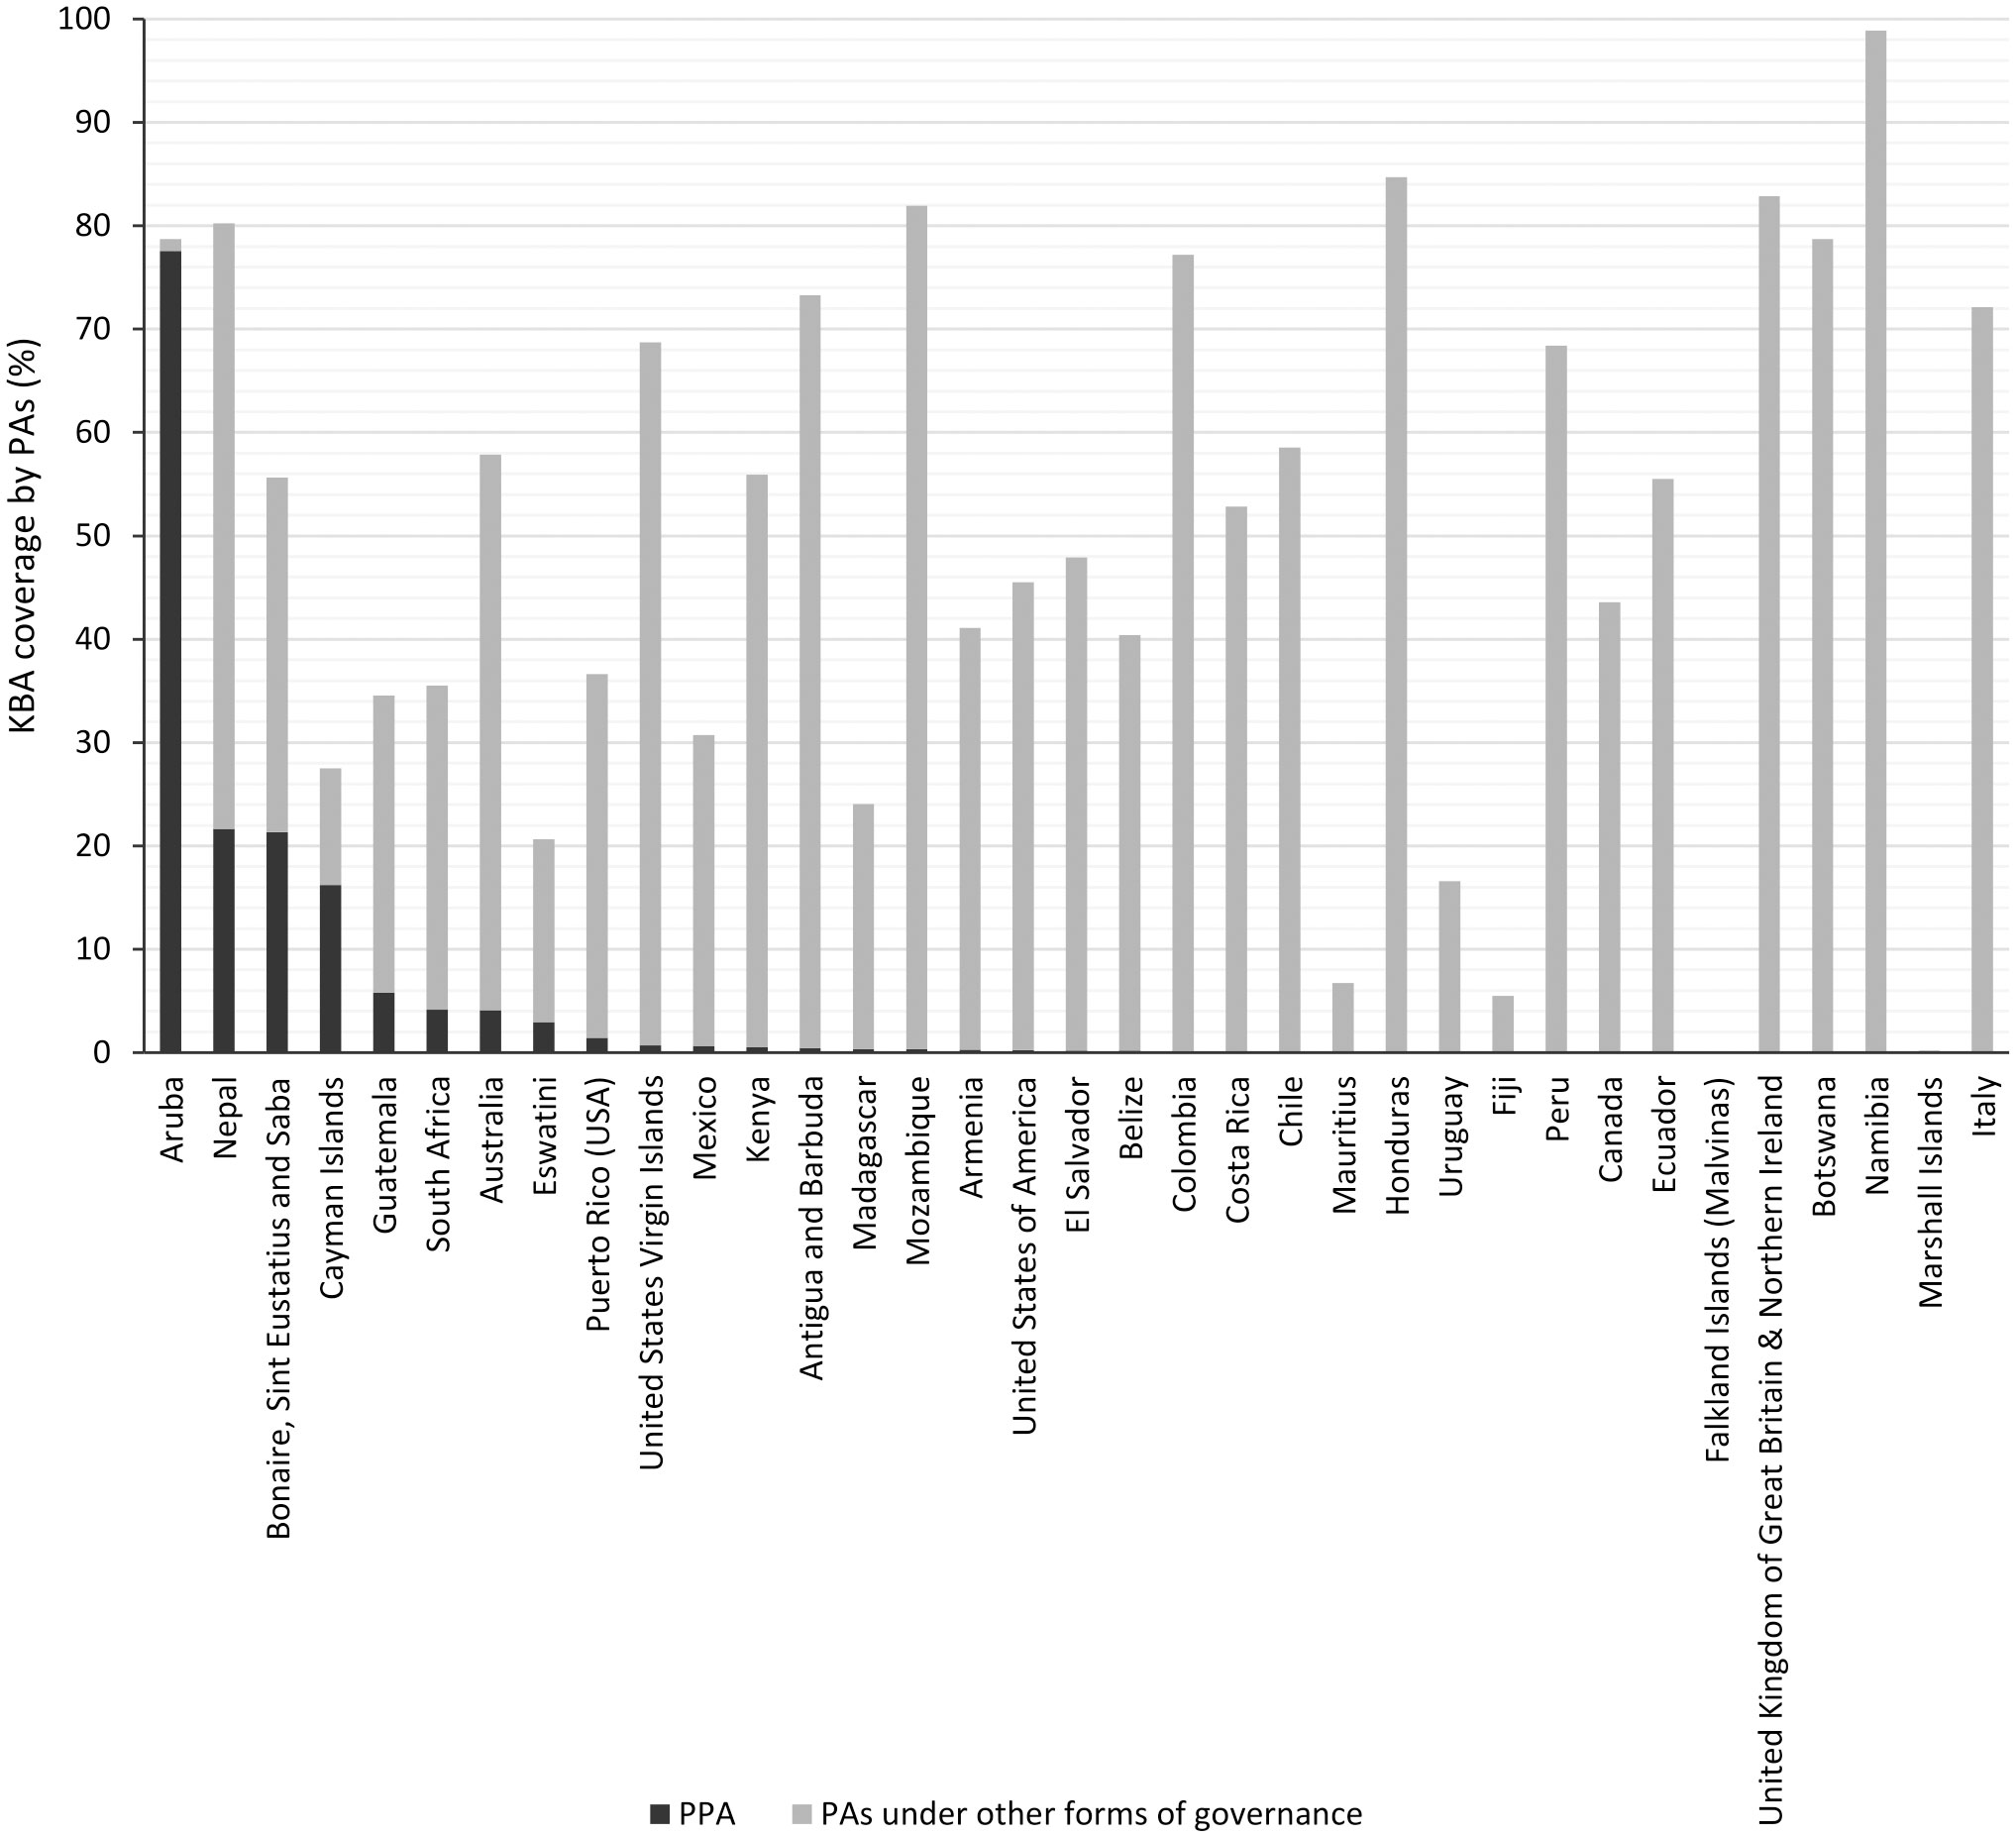
Figure 2 The total percentage coverage of KBAs by protected areas within each country or territory, split by coverage from privately protected areas (PPAs) (black) and protected areas under other governance types (grey).
3.1.5 Connectivity
PPAs increase the percentage of land that is both protected and connected in 60 countries and territories. In six of these countries and territories, PPAs increased the area that is protected and connected by greater than one percentage point. The most substantial increase in connectivity attributed to PPAs was in Bonaire, Sint Eustatius and Saba where the proportion of protected and connected land increased by 23.2 percentage points, and in Aruba, where PPAs provided all 19.2% of protected and connected land. The Cayman Islands were another case where a substantial increase in connectivity was attributable to PPAs, more than doubling the area of protected and connected land from 2.15% to 5.45%. In Nepal, the area of protected and connected land almost doubled with the inclusion of PPAs, increasing from 5.85% to 10.87%.
PPAs increased the percentage of land that is both protected and connected across 261 terrestrial ecoregions. This increase was greater than one percentage point for 16 terrestrial ecoregions and greater than five percentage points for four terrestrial ecoregions. The largest increase attributable to PPAs was recorded for Montane fynbos and renosterveld in South Africa and for Cape York Peninsula tropical savanna in Australia, with 13.14 and 12.09 percentage point increases in the area protected and connected respectively. The largest proportional increases in ProtConn were found in Oaxacan montane forests in Mexico, where connectivity of the protected area network was over 31 times greater due to PPAs. For three further ecoregions, the proportion of land that is both protected and connected more than doubled as a result of PPAs.
3.2 Privately governed OECMs
As of April 2023, there were 20 privately governed OECMs from four countries reported to the WD-OECM (Table 2). In total, these OECMs covered 86,018 km2 (85,434 km2 of terrestrial and inland waters and 584 km2 of the marine realm). Privately governed OECMs comprised 2.44% of all reported OECMs (3.04% of terrestrial and 0.52% of marine). Of the total area covered by OECMs globally, privately-governed OECMs contributed 5.37% to terrestrial and inland waters and 0.16% to marine coverage. Non-profit organisations governed around 55% (11 OECMs) of all privately governed OECMs, amounting to over 99% of the total area covered by privately-governed OECMs. This is due in large part to the reporting by South Africa of UNESCO Man and Biosphere Reserves buffer and transition zones, which cover large areas reported as OECMs governed by non-profit organisations. Individual landowners across Canada, Colombia, and The Kingdom of Eswatini govern 45% (9 OECMs) of privately governed OECMs, but these provide coverage of just 90.16 km2, or 0.1% of total privately governed OECM coverage. No privately governed OECMs have yet been reported as under the governance of for-profit organisations. Of the 20 privately governed OECMs, 12 intersected with a priority terrestrial ecoregion, with 10 having at least 50% of their area within a priority terrestrial ecoregion, including six OECMs fully within priority ecoregions. Furthermore, 14 OECMs under private governance intersected with KBAs, with seven having over 50% of their area in a KBA and three of these being fully within a KBA.
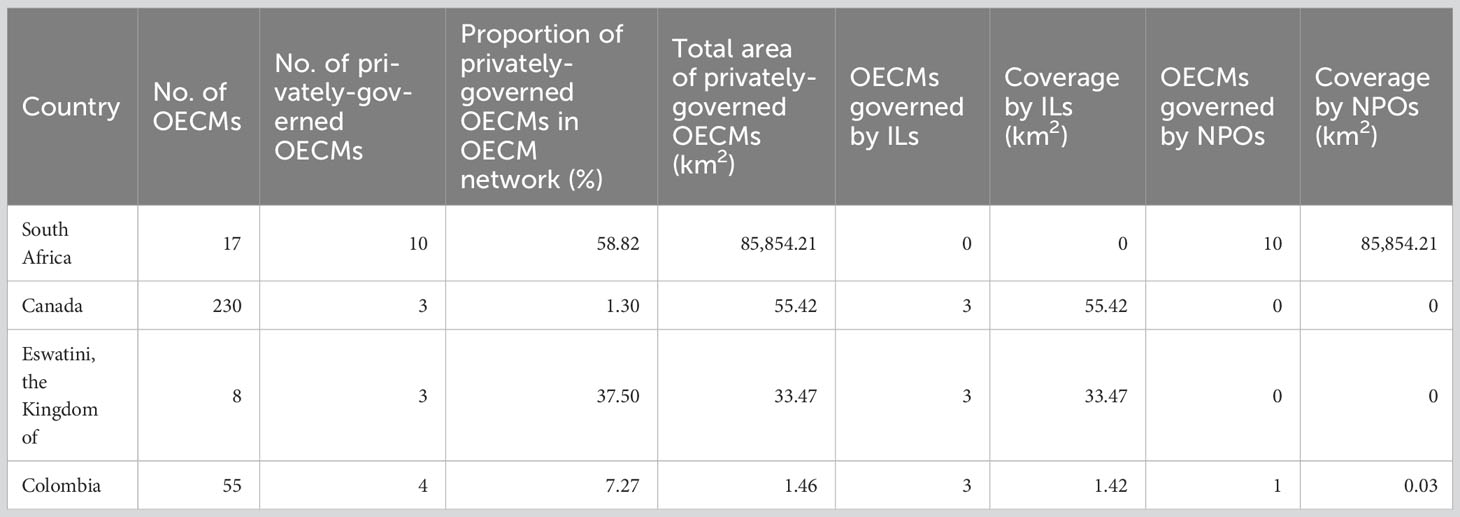
Table 2 Countries with privately-governed OECMs reported to the WD-OECM.
4 Discussion
This study demonstrates that both PPAs and privately governed OECMs already play an important role in protecting biodiversity in some countries and territories around the world. The contributions of these areas – while modest in most cases – to the implementation of Target 3 go beyond coverage by extending protection to Key Biodiversity Areas and under-represented ecoregions, and by increasing the percentage of land that can be considered both protected and connected. For those countries and territories where data is available, our results reveal important insights into the scale of these current contributions, whilst more broadly highlighting the potential of PCAs under private governance for integration in future conservation strategies.
While the contributions of privately governed PCAs to Target 3 implementation may be small, they are important in the context of the limitations of the broader global system of PCAs. Systems of PCAs are known to provide important shelter for vulnerable species and habitats, however, there remain gaps in the ecological representativeness and connectedness of the current global PCA system (Maxwell et al., 2020). KBAs and priority ecoregions are currently not sufficiently protected at the global level (UNEP-WCMC and IUCN, 2021b), with 39% of KBAs having no coverage in PAs (IUCN, 2021). Furthermore, in 2021 only 47.4% of marine ecoregions had reached the 10% coverage target and just 44.5% of terrestrial ecoregions had reached the 17% coverage target (UNEP-WCMC and IUCN, 2021b).Whilst these results are based on limited data, with reported PPAs currently comprising less than 1% terrestrial and just 0.002% of marine PA coverage globally, they also provide some coverage to 36.4% of priority terrestrial ecoregions, 41.5% of priority marine ecoregions and 554 KBAs. In the case of some KBAs, PPAs are providing greater coverage than PAs under other forms of governance. Furthermore, our results show that PPAs increase the connectivity of 60 national PA networks and 261 terrestrial ecoregions.
Recognising and supporting OECMs provides a further opportunity to implement Target 3 and acknowledge the conservation efforts of a diverse set of governance actors. Privately governed OECMs are a relatively new concept but offer a new avenue to increase engagement of private actors. Although currently only a very small number of privately governed OECMs have been reported, their relative contribution to terrestrial OECM coverage is large and when combined with PPAs this impact is even greater. Our results also show that these OECMs are already conserving key areas for biodiversity, including priority ecoregions and KBAs, suggesting that scaling up their recognition will be an important component of Target 3 implementation.
While recognising existing PCAs is only one step towards achieving Target 3, it is a vital one. A clear baseline revealing where protection is already adequate, and where it is not, would bolster the efforts of governments and others to prioritise their efforts under the target. The potentially vast costs of implementing the GBF (CBD, 2020) and the shortfalls of past approaches (UNEP-WCMC and IUCN, 2021) make such prioritisation efforts essential. If patterns of PCA expansion efforts continue as they have over the last three decades, it is predicted that 75% of ecoregions worldwide will not reach 30% coverage (Chauvenet et al., 2020). Future efforts to expand the global PCA network must therefore prioritise areas based on their contributions to ecological representation and their biodiversity importance (IUCN, 2021; Antonelli, 2023). A comprehensive global map of privately governed PCAs would play an important role in enabling these prioritisations to take place.
A final, important point is that the validity of all results presented here depends upon the effectiveness of the PCAs in question. Even PCAs that are ideally located to conserve biodiversity will not do so unless they are well governed and managed. Efforts are underway to better monitor this crucial aspect of Target 3, and the data gathered will provide new opportunities to assess the relative effectiveness of different governance types. In the case of OECMs, it will also provide greater transparency regarding the basis on which individual OECMs are considered effective conservation measures, and may lead to changes in the currently reported data, for example if data providers choose to divide up very large OECMs into smaller parcels for which there is stronger evidence of effectiveness. Ultimately, a greater focus on effectiveness will provide opportunities to understand the enabling conditions behind the effectiveness of privately governed PCAs, address barriers to success, and optimise biodiversity benefits.
Data availability statement
The datasets analysed for this study are available from the following links. The WDPA and WD-OECM datasets are available at https://www.protectedplanet.net. KBA data can be requested from https://www.keybiodiversityareas.org/kba-data/request. The marine ecoregions and pelagic provinces dataset is available at https://data.unep-wcmc.org/datasets/38. The terrestrial ecoregions dataset is available at https://www.worldwildlife.org/publications/terrestrial-ecoregions-of-the-world. The priority ecoregions dataset is available at https://www.worldwildlife.org/publications/global-200. A simplified version of the basemap used in this analysis has been published at Nature Scientific Data journal (Brooks et al., 2016) and is available here: http://datadryad.org/resource/doi:10.5061/dryad.6gb90.2.
Author contributions
AL: Writing – original draft, Writing – review & editing. BG: Formal Analysis, Methodology, Writing – review & editing. BW: Writing – review & editing. JS: Formal Analysis, Writing – review & editing. JL: Writing – review & editing. GDe: Writing – review & editing, Formal Analysis, Methodology. GDu: Formal Analysis, Methodology, Writing – review & editing. HB: Conceptualization, Writing – original draft, Writing – review & editing.
Funding
The author(s) declare financial support was received for the research, authorship, and/or publication of this article. The authors thank the Arcadia Fund for supporting this output.
Conflict of interest
The authors declare that the research was conducted in the absence of any commercial or financial relationships that could be construed as a potential conflict of interest.
Publisher’s note
All claims expressed in this article are solely those of the authors and do not necessarily represent those of their affiliated organizations, or those of the publisher, the editors and the reviewers. Any product that may be evaluated in this article, or claim that may be made by its manufacturer, is not guaranteed or endorsed by the publisher.
Footnotes
- ^ Protected areas and other effective area-based conservation measures (OECMs) are collectively referred to as protected and conserved areas, or PCAs, within this paper.
- ^ The year of designation is not known for ~27% of all PPAs in the WDPA, generating uncertainty around the change in coverage over time. These PPAs are excluded from Figure 1, meaning the present-day coverage in Figure 1 is lower than the total coverage reported in this paper (167,670 km2 of terrestrial and inland waters and 723 km2 of the marine realm).
References
Antonelli A. (2023). Five essentials for area-based biodiversity protection. Nat. Ecol. Evol. 7 (5), 630–631. doi: 10.1038/s41559-023-02023-x
Archibald C. L., Barnes M. D., Tulloch A. I. T., Fitzsimons J. A., Morrison T. H., Mills M., et al. (2020). Differences among protected area governance types matter for conserving vegetation communities at risk of loss and fragmentation. Biol. Conserv. 247, 108533. doi: 10.1016/j.biocon.2020.108533
Barnosky A. D., Matzke N., Tomiya S., Wogan G. O., Swartz B., Quental T. B., et al. (2011). Has the Earth’s sixth mass extinction already arrived? Nature 471 (7336), 51–57. doi: 10.1038/nature09678
Bingham H. C., Fitzsimons J. A., Mitchell B. A., Redford K. H., Stolton S. (2021). Privately protected areas: Missing pieces of the Global Conservation Puzzle. Front. Conserv. Sci. 2. doi: 10.3389/fcosc.2021.748127
Bingham H. C., Fitzsimons J. ,. A., Redford K. H., Mitchell B. A., Bezaury-Creel J., Cumming T. L. (2017). Privately protected areas: Advances and challenges in guidance, policy and Documentation. PARKS 23 (1), 13–28. doi: 10.2305/iucn.ch.2017.parks-23-1hb.en
BirdLife International (2023). The World Database of Key Biodiversity Areas (Cambridge, UK: Developed by the KBA Partnership: BirdLife International, International Union for the Conservation of Nature, Amphibian Survival Alliance, Conservation International, Critical Ecosystem Partnership Fund, Global Environment Facility, Re:wild, NatureServe, Rainforest Trust, Royal Society for the Protection of Birds, Wildlife Conservation Society and World Wildlife Fund). Available at: www.keybiodiversityareas.org.
Borrini-Feyerabend G., Dudley N., Jaeger T., Lassen B., Pathak Broome N., Phillips A., et al. (2013). “Governance of Protected Areas: From understanding to action,” in Best Practice Protected Area Guidelines Series No. 20 (Gland, Switzerland: IUCN).
Brooks T. M., Akçakaya H. R., Burgess N. D., Butchart S. H. M., Hilton-Taylor C., Hoffmann M., et al. (2016). Analysing biodiversity and conservation knowledge products to support regional environmental assessments. Sci. Data 3 (1), 160007. doi: 10.1038/sdata.2016.7
CBD (2018). Convention on Biological Diversity (Montreal, Canada: Decision adopted by the conference of the parties to the Convention on Biological Diversity/ CBD/COP).
CBD (2020). Convention on Biological Diversity. Estimation of resources needed for implementing the post-2020 Global Biodiversity Framework (Montreal, Canada: CBD/SBI).
CBD (2022). “Convention on biological diversity. Kunming-montreal biodiversity framework,” in Target 3 (Montreal, Canada: CBD/COP).
CBD (2023) Target 3. 30 per cent of areas are effectively conserved. Available at: https://www.cbd.int/gbf/targets/3/ (Accessed 20/10/2023).
Chauvenet A. L. M., Watson J. E. M., Adams V. M., Di Marco M., Venter O., Davis K. J., et al. (2020). To achieve big wins for terrestrial conservation, Prioritize Protection of ecoregions closest to meeting targets. One Earth 2 (5), 479–486. doi: 10.1016/j.oneear.2020.04.013
Clements H. S., Kerley G. I., Cumming G. S., De Vos A., Cook C. N. (2018). Privately protected areas provide key opportunities for the regional persistence of large- and medium-sized mammals. J. Appl. Ecol. 56 (3), 537–546. doi: 10.1111/1365-2664.13300
Dudley N. (2008). Guidelines for Applying Protected Area Management Categories. Eds. Stolton S., Shadie P., Dudley N. (Gland, Switzerland: IUCN), x + 86pp.
Duncanson L., Liang M., Leitold V., Armston J., Krishna Moorthy S. M., Dubayah R., et al. (2023). The effectiveness of global protected areas for climate change mitigation. Nat. Commun. 14 (1), 2908. doi: 10.1038/s41467-023-38073-9
Fitzsimons J., Wescott G. (2001). The role and contribution of private land in Victoria to biodiversity conservation and the Protected Area System. Australas. J. Environ. Manage. 8 (3), 142–157. doi: 10.1080/14486563.2001.10648524
IPBES (2019). Summary for policymakers of the global assessment report on biodiversity and ecosystem services of the Intergovernmental Science-Policy Platform on Biodiversity and Ecosystem Services. Eds. Díaz S., Settele J., Brondízio E. S., Ngo H. T., Guèze M., Agard J., Arneth A., Balvanera P., Brauman K. A., Butchart S. H. M., Chan K. M. A., Garibaldi L. A., Ichii K., Liu J., Subramanian S. M., Midgley G. F., Miloslavich P., Molnár Z., Obura D., Pfaff A., Polasky S., Purvis A., Razzaque J., Reyers B., Roy Chowdhury R., Shin Y. J., Visseren-Hamakers I. J., Willis K. J., Zayas C. N. (Bonn, Germany: IPBES secretariat), 56 pages. doi: 10.5281/zenodo.3553579
IPCC (2021) Climate change widespread, rapid, and intensifying. Available at: https://www.ipcc.ch/2021/08/09/ar6-wg1-20210809-pr/ (Accessed 11/08/23).
IUCN (2021) We need to protect and conserve 30% of the planet: but it has to be the right 30%. Available at: https://www.iucn.org/crossroads-blog/202108/we-need-protect-and-conserve-30-planet-it-has-be-right-30 (Accessed 23/07/23]).
Laurindo R. D., Novaes R. L., Souza R. D., Souza V. F., Felix F., Souto T. M., et al. (2017). Mammals in forest remnants of an ecotonal Atlantic Forest-cerrado area from southeastern Brazil. Neotropical Biol. Conserv. 12 (1), 19–29. doi: 10.4013/nbc.2017.121.03
Maxwell S. L., Cazalis V., Dudley N., Hoffmann M., Rodrigues A. S., Stolton S., et al. (2020). Area-based conservation in the twenty-first century. Nature 586 (7828), 217–227. doi: 10.1038/s41586-020-2773-z
Milam A., Kenney S., Juffe-Bignoli D., Bertzky B., Corrigan C., MacSharry B., et al. (2016). “Maintaining a global data set on Protected Areas” in Protected Areas: Are They Safeguarding Biodiversity? Eds.Joppa. L., Bailie J., Robinson J. G. (Chichester, UK: Wiley-Blackwell), 81–101. doi: 10.1002/9781118338117.ch5
Mitchell B. A., Stolton S., Bezaury-Creel J., Bingham H. C., Cumming T. L., Dudley N., et al. (2018). Guidelines for Privately Protected Areas. Best Practice Protected Area Guidelines. Series No. 29 (Gland: IUCN). doi: 10.2305/IUCN.CH.2018.PAG.29.en
Nolte C. (2018). Buying forests for conservation: Contours of a global trend. Curr. Opin. Environ. Sustain. 32, 68–75. doi: 10.1016/j.cosust.2018.05.003
Olson D. M., Dinerstein E. (2002). The global 200: Priority ecoregions for global conservation. Ann. Missouri Botanical Garden 89 (2), 199. doi: 10.2307/3298564
Olson D. M., Dinerstein E., Wikramanayake E. D., Burgess N. D., Powell G. V. N., Underwood E. C., et al. (2001). Terrestrial ecoregions of the world: A new map of life on Earth. BioScience 51 (11), 933–938. doi: 10.1641/0006-3568(2001)051[0933:TEOTWA]2.0.CO;2
Palfrey R., Oldekop J. A., Holmes G. (2022). Privately protected areas increase global protected area coverage and connectivity. Nat. Ecol. Evol. 6 (6), 730–737. doi: 10.1038/s41559-022-01715-0
Pliscoff P., Fuentes-Castillo T. (2011). Representativeness of terrestrial ecosystems in Chile’s protected area system. Environ. Conserv. 38 (3), 303–311. doi: 10.1017/s0376892911000208
Pörtner H. O., Scholes R. J., Agard J., Archer E., Arneth A., Bai X., et al. (2021). Scientific outcome of the IPBES-IPCC co-sponsored workshop on biodiversity and climate change (Bonn, Germany: IPBES Secretariat; Geneva, Switzerland, IPCC secretariat).
Saura S., Bastin L., Battistella L., Mandrici A., Dubois G. (2017). Protected areas in the world’s ecoregions: How well connected are they? Ecol. Indic. 76, 144–158. doi: 10.1016/j.ecolind.2016.12.047
Saura S., Bertzky B., Bastin L., Battistella L., Mandrici A., Dubois G. (2018). Protected Area Connectivity: Shortfalls in global targets and country-level priorities. Biol. Conserv. 219, 53–67. doi: 10.1016/j.biocon.2017.12.020
Shanee S., Shanee N., Monteferri B., Allgas N., Alarcon Pardo A., Horwich R. H. (2017). Protected area coverage of threatened vertebrates and ecoregions in Peru: Comparison of communal, private and State reserves. J. Environ. Manage. 202, 12–20. doi: 10.1016/j.jenvman.2017.07.023
Smith R., Young V. (2022). Role of Protected Areas in Climate Change Mitigation and Biodiversity Conservation (Gland, Switzerland: IUCN WCPA), 6pp.
Spalding M. D., Agostini V. N., Rice J., Grant S. M. (2012). Pelagic provinces of the world: A biogeographic classification of the world’s surface pelagic waters. Ocean Coast. Manage. 60, 19–30. doi: 10.1016/j.ocecoaman.2011.12.016
Spalding M. D., Fox H. E., Allen G. R., Davidson N., Ferdaña Z. A., Finlayson M., et al. (2007). Marine ecoregions of the world: A bioregionalization of coastal and shelf areas. BioScience 57 (7), 573–583. doi: 10.1641/b570707
UNEP-WCMC (2019). User Manual for the World Database on Protected Areas and world database on other effective area-based conservation measures: 1.6 (Cambridge, UK: UNEP-WCMC). Available at: http://wcmc.io/WDPA_Manual.
UNEP-WCMC, IUCN (2021a) Calculating protected area and OECM coverage. Available at: https://www.protectedplanet.net/en/resources/calculating-protected-area-coverage (Accessed 14/05/23).
UNEP-WCMC, IUCN (2021b). Protected Planet Report 2020 (Cambridge UK; Gland, Switzerland: UNEP-WCMC and IUCN).
UNEP-WCMC, IUCN (2023). Protected Planet: The World Database on Protected Areas (WDPA) and World Database on Other Effective Area-based Conservation Measures (WD-OECM) (Cambridge, UK: UNEP-WCMC and IUCN). Available at: www.protectedplanet.net.
United Nations (2021)Un launches decade on Ecosystem Restoration to counter. In: “Triple Environmental Emergency”. Available at: https://news.un.org/en/story/2021/06/1093362 (Accessed 16/05/23).
VLIZ (Flanders Marine Institute) (2014) Maritime Boundaries Geodatabase, version 8. Available at: https://www.marineregions.org/.
WMO (World Meteorological Organization). (2023). State of the Global Climate 2022. WMO-No. 1316. (Geneva, Switzerland: World Meteorological Organization). 55 p.
Keywords: conservation planning, kunming-montreal global biodiversity framework, private governance, privately protected areas, target 3, world database on other effective area-based conservation measures, world database on protected areas
Citation: Lewis AH, Gottlieb B, Wilson B, Sutton J, Lessmann J, Delli G, Dubois G and Bingham HC (2023) Coverage and beyond: how can private governance support key elements of the Global Biodiversity Framework’s Target 3? Front. Conserv. Sci. 4:1303801. doi: 10.3389/fcosc.2023.1303801
Received: 28 September 2023; Accepted: 01 November 2023;
Published: 01 December 2023.
Edited by:
Sue Stolton, Equilibrium Research, United KingdomReviewed by:
Brent A. Mitchell, QLF Atlantic Center, United StatesStephen Woodley, International Union for Conservation of Nature, Canada
Copyright © 2023 Lewis, Gottlieb, Wilson, Sutton, Lessmann, Delli, Dubois and Bingham. This is an open-access article distributed under the terms of the Creative Commons Attribution License (CC BY). The use, distribution or reproduction in other forums is permitted, provided the original author(s) and the copyright owner(s) are credited and that the original publication in this journal is cited, in accordance with accepted academic practice. No use, distribution or reproduction is permitted which does not comply with these terms.
*Correspondence: Alanah Hayley Lewis, QWxhbmFoLmxld2lzQHVuZXAtd2NtYy5vcmc=