 Peter K. Marsh
 Franz J. Kurfess
- Drones for Marine Science and Agriculture, California Polytechnic State University, Computer Science and Software Engineering, San Luis Obispo, CA, United States
Ecologists today face significant challenges in accurately modeling wildlife populations. Population surveys provide an essential understanding of an ecosystem; however, they currently require an extensive amount of labor and resources to carry out which limits the frequency at which they are conducted. Lack of population data presents a significant barrier to ecologists in their ability to understand and model interactions between species and their surroundings. Preliminary work has been done in employing consumer drones and object detection software to automate data collection and processing on large mammal species. Such work suggests these technologies can significantly ease the process of data collection while maintaining an accuracy comparable to manual surveying techniques. While previous studies indicate the use of drone and object detection technology can aid in the collection of population data, there remain significant barriers in applying such methods to aid in ecological research on a broader scale. In particular, using object detection to identify target individuals involves combining many software tools, each of which comes with its own challenges and complexities. This paper presents a flexible software framework for automated population sampling that is accessible to researchers in the field of wildlife research. To achieve this we combine orthomosaic stitching, object detection, label post-processing, and visualization solutions into a single software pipeline. We then show how such a pipeline can be run in the cloud and provide documentation for others to replicate this process. Finally, we use a consumer drone and free navigation software to demonstrate the proposed workflow on a herd of cattle and assess its viability in providing useful population data.
1 Introduction
As the threat to wildlife and endangered species due to human encroachment increases, the work of ecologists in understanding and modeling a species’ characteristics and relation to its environment becomes increasingly important. Effects of habitat loss and ecological disruption over the last few decades can be seen across a multitude of species types and ecosystems. Recent studies estimate that over 50% of the world’s vertebrate species have suffered population decline and range contractions due to habitat loss and fragmentation (Ceballos et al., 2017). Off the coast of Australia, researchers recorded a 92% decline in hammerhead shark abundance between 1962 and 2016 (Roff et al., 2018). Human activities and climate change also correlate with range shifts in animals, such as rapid changes in bird populations observed by (Lehikoinen et al., 2013; Marchowski et al., 2017; Marchowski et al., 2020). Such range shifts can cause large population concentrations in areas not affected by human intervention. Marchowski and Leitner (2019) have documented such episodes of birds’ massive concentrations in small areas using aerial methods and subsequently employed Kernel Density Estimation techniques for spatial analysis. Analysis of population data shows significant changes in wildlife density and distribution.
In order to help mitigate human impact on wildlife we can monitor small changes in population data and use statistical modeling to extrapolate future trends. The collection of high-resolution population data enables ecologists to model hypothetical future scenarios and generate effective mitigation techniques to prevent unwanted outcomes. However, despite the importance of collecting high-resolution population data, population surveys remain sparse as current survey methods require an extensive amount of labor, skill, and resources to carry out.
Preliminary work has been done in employing consumer drones and object detection software to automate data collection and processing on large mammal species. Such work suggests these technologies can significantly ease the process of data collection while maintaining an accuracy comparable to manual surveying techniques. A study by Infantes et al. (2022) used a DJI Phantom 4 with a pre-programmed flight path and machine learning detector to conduct a survey of Scandinavian harbor seals. When compared with ground-based counts, the machine learning detector identified seals with 95-97% accuracy. In addition to providing accurate results in significantly less time than manual surveying techniques did, drone surveying also provided access to rocky archipelagos which are largely inaccessible for ground-based surveys. Another study by Purcell et al. (2022) in New South Wales, Australia, assessed the viability of using deep learning and object recognition to perform real-time identification of sharks in drone footage. The researchers trained two neural networks on a large archive of video drone footage achieving an accuracy of 80% for their RetinaNet algorithm and 78% for their MobileNet V1 algorithm both of which compared well to skilled human observers. Such studies prove the viability of drones and machine learning in identifying large animal species even in an adverse ocean environment.
While previous studies indicate the use of drone and object detection technology can aid in the collection of population data, there remain significant barriers in applying such a method to aid in ecological research on a broader scale. In particular, using object detection to identify target individuals involves combining many software tools, each of which comes with its own costs and complexities. In Infantes et al. (2022) study of Scandinavian harbor seals, researchers used Pix4Dmapper for flight programming and orthomosaic stitching, Picterra for model training and detection of seals, and R for statistical analysis. The researchers recommend pursuing a cloud-based workflow which would combine orthomosaic creation, object detection, and statistical analysis into a single pipeline. If implemented, such a workflow could aid population researchers in their ability to conduct surveys, process large amounts of data, and generate insights necessary to understand and protect target species.
In this paper, we will focus on implementing a cloud-based wildlife detection pipeline and provide code that can be utilized and modified by future researchers. Specifically, the pipeline we have created takes a folder of drone survey images as input and produces multiple data outputs such as coordinates for each detection of the target species and Google Earth files that help visualize these detections. The experiments reported in this study focus on large mammals, using cows on range land as an example. The methodology, however, is equally applicable to other animals. The critical part of the pipeline here is object detection, which has been applied in our own studies to cows, sheep and sharks, and by others on a wide range of animals including birds (Marchowski, 2021; Weinstein et al., 2022; Sikora & Marchowski, 2023). In general, object detection is a reasonably mature technique, with a variety of pre-configured Deep Learning architectures such as RetinaNet and MobileNet mentioned above, and the YOLO family discussed in more detail below. The use of transfer learning in combination with a labeled dataset for the specific animal can be used to generate specific detection models with accuracies in the range of 80-95%. Of course, this also depends on the animal, the context, and the similarity of the pre-trained model to the intended application: Distinguishing dark cows from rangeland is relatively easy, whereas identifying birds and their nests in bushes, or sharks below the water surface can be very challenging. Detecting and identifying objects from multiple classes, such as different animals, also can increase the level of difficulty significantly. Here, we will focus on the methodology for creating a cloud-based detection pipeline and use cows on rangeland to exemplify how the pipeline can be utilized.
2 Methods
We decided to use Google Colab in order to represent the pipeline’s execution in the cloud while providing a concrete example of use that allows for experimentation. Google Colab provides a serverless Jupyter notebook environment which harnesses Google Cloud computing resources and allows for interactive development (Bisong, 2019). The functions of this notebook could easily be ported over for full automation to Google Cloud, Amazon Web Services (AWS) or similar cloud platform. We also opted for a fully open-source software pipeline in order to preserve the flexibility and customizability of the workflow. Open-source software can be downloaded, examined, and modified, whereas consumer software platforms constrain users to a finite set of uses. The use of open-source software also provides a low-cost solution for future wildlife researchers who need to process survey imagery.
The diagram in Figure 1 gives an overview of the overall flow of information, with more details in further subsections. Survey images from drone footage are uploaded and then stitched into an orthomosaic, which is a composite image of the observation area without the distortions that would result from a wide-angle photo. The resulting image can be of very high resolution, making it too large as direct input for object detection architectures. Hence it is split up into tiles, and objects are identified within each tile. Care must be taken to also deal with objects that straddle the boundaries between the tiles. Detected objects are then labeled, and their location and category are recorded. On the overall image, objects are visualized through bounding boxes and labels.
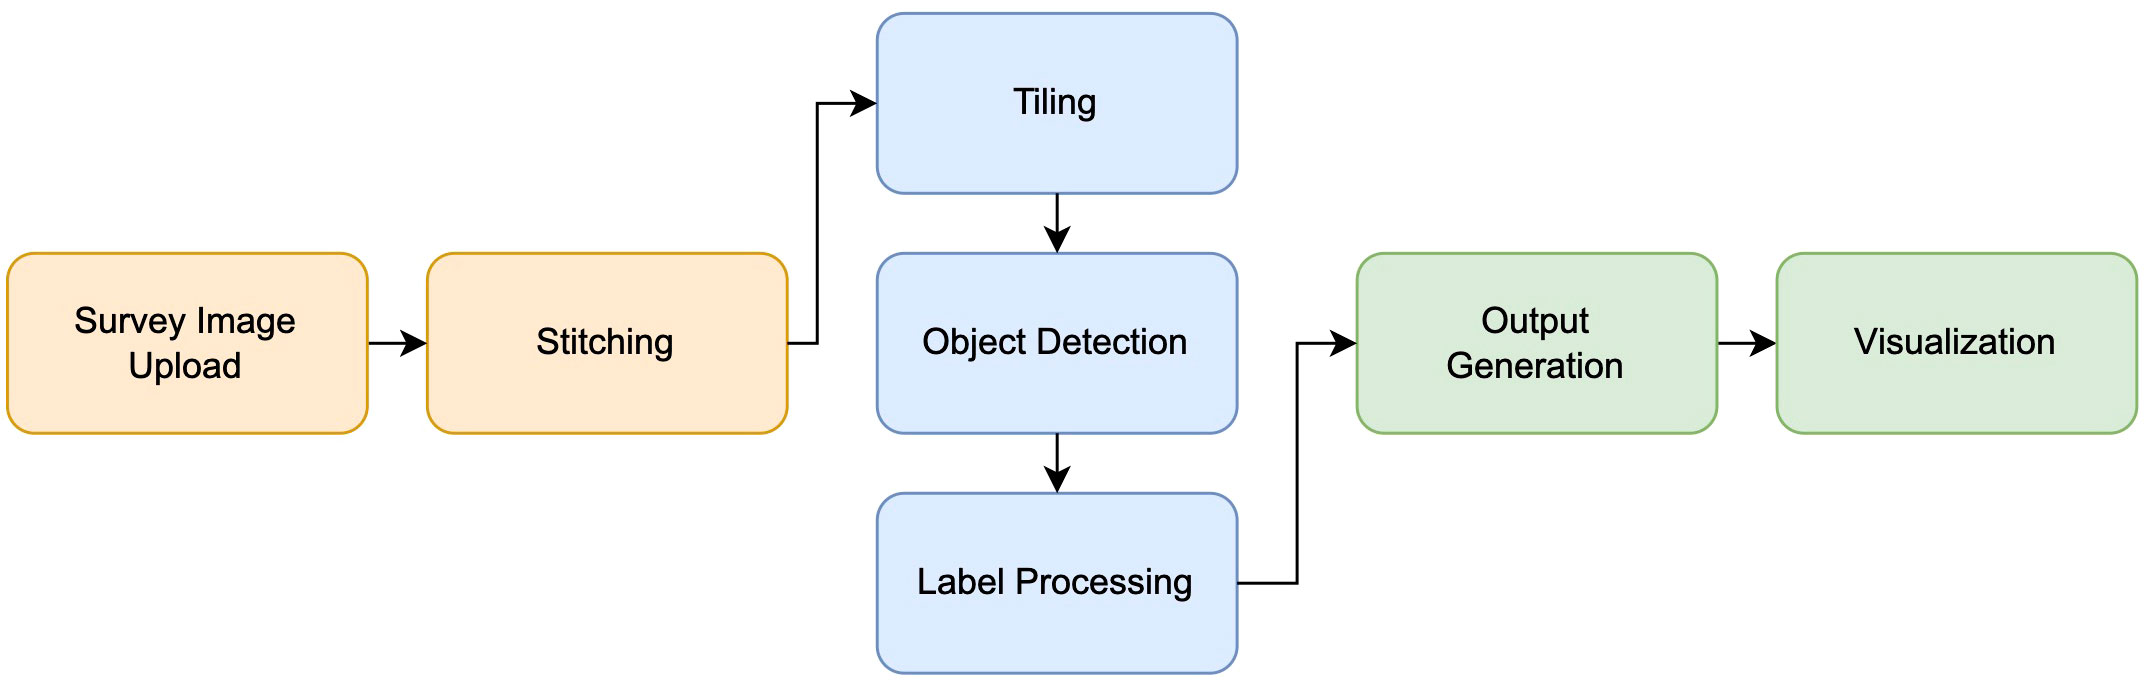
Figure 1 Diagram of the methods used for survey image processing.
2.1 Image stitching
To stitch the orthomosaic from survey images (see Figure 2) we used Open Drone Map (ODM), an open-source API which is able to generate high-resolution orthoimages (Mattivi et al., 2021). ODM uses a processing pipeline that reads metadata from survey images such as flight altitude and approximate center coordinates, compares features and pixels from neighboring images, eliminates edge distortions, and combines images into a georeferenced orthomosaic file (Mokrane et al., 2019). This software can be downloaded and executed locally, however, due to its computationally intensive nature and reliance on parallelization, its performance may vary across different operating systems. ODM can also be run in a user-friendly, cloud processing environment called WebODM which we can interface with programmatically.
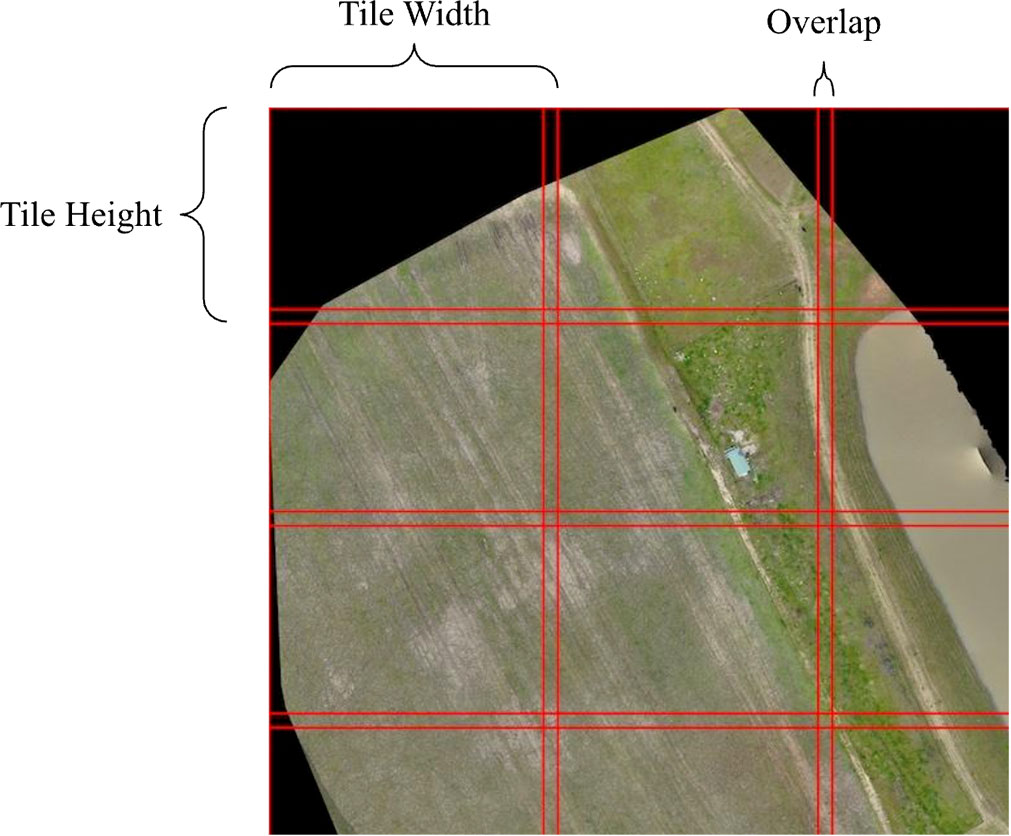
Figure 2 Orthomosaic tiling using a sliding window approach.
Using WebODM’s API, we upload a folder of survey imagery to their server and set custom flags to tailor the processing job to our specific needs. Enabling fast-orthophoto and skip-report will skip 3D reconstruction and performance report generation, both of which are unnecessary for generating a high-resolution stitch. Setting orthophoto-kmz will tell WebODM to generate a Google Earth compatible overlay of the resulting orthomosaic which we will use later to visualize our results. Finally, setting orthophoto-resolution to 1.0 cm will ensure a maximum resolution of 1.0 cm per pixel and disable image compression for images with more granular resolution. Note that the actual resolution of the resulting orthomosaic depends on the survey altitude and resolution of the drone camera but in most cases will be more granular (lower resolution) than 1.0 cm per pixel. After images are uploaded to WebODM, stitching occurs in the WebODM cloud server using compute credits which are free for new users. Longer term users may purchase compute credits at a low cost after their free credits are spent. Upon completion of the stitching job, WebODM sends a response with a folder of outputs including a stitched and geo-referenced orthomosaic (.tif), and a Google Earth compatible overlay file (.kmz).
2.2 Sliding window approach
The high resolution of orthoimagery poses substantial complexities when attempting to identify individuals through object detection. In order to detect target individuals we must partition the larger image into tiles, perform object detection on each tile, and map detected labels from each tile back into the context of the larger image. However, the presence of objects that straddle the boundaries between two adjacent tiles must be accounted for (Ophoff et al., 2023). We used a sliding window approach which allowed us to break an image up into many sub-images while accounting for boundary objects (Lee et al., 2017). Our implementation allows the user to set the width and height of a tile as well as the desired overlap in pixels. The image is then broken up into tiles of equal size ensuring that each tile overlaps by at least the amount of pixels specified by the user. Tile boundaries are also plotted on a display image which can be viewed once the script is complete.
2.3 Object detection
In order to detect target individuals (cows) we used the YOLOv7 object detection algorithm. YOLOv7 employs a single-pass architecture which is highly efficient in predicting bounding boxes and class probabilities for multiple objects within an image (Wang et al., 2022). The model we used was trained by a fellow researcher in the Drones for Marine Science and Agriculture research project on a labeled set of aerial cow images. Training was done on a Mac Studio M1 desktop with 32 GByte of memory using the YOLOv7 source code published by Wang et al. (2022). While the model we used was trained locally, Google Colab is frequently used to train object detection models in the cloud (Pandiya et al., 2020; Karakaya et al., 2022). In the future, a training step could be incorporated in the cloud based pipeline. The result of training a YOLOv7 object detection model is a PyTorch weights file (.pt) which we are able to utilize in detecting cows in an image. Once the orthomosaic has been processed into tiles, we run object detection on each tile, producing bounding boxes for the predicted location and extent of each cow.
2.4 Processing labels
In order to combine labels from each tile we take into account the position of each tile within the original image, and the possibility for duplicate detections due to tile overlap. We first translate each bounding box by the offset of its parent tile to get its position in the larger image. We then loop over each pair of bounding boxes and calculate the Intersection over Union (IoU) for each. If the pair’s IoU is over 60% we combine the two boxes by taking the min and max over both. Duplicate detections will appear on top of each other and therefore our algorithm for combining labels is simple. More complex combination methods are recommended if high precision is needed as this method may create bounding box inflation in overlapping regions. Once the labels are combined we use the gdal python library to access the orthoimage’s geospatial data and translate labels from pixel space into GPS space and write the results to a JSON file (Ma et al., 2020).
2.5 Data output and visualization
We created two main output formats. The first is a CSV file that lists all the detection bounding boxes in GPS format. The second output is a KML file for Google Earth which displays a polygon overlay for each bounding box so it can be visualized in Google Earth. This can be loaded on top of the orthomosaic generated by ODM (OpenDroneMap) in order to show target individuals along with each detection.
2.6 Testing
In order to test the viability of this pipeline in processing survey imagery and providing useful outputs, we used a DJI Mavic Pro drone to survey a herd of cows. We used the free Pix4Dcapture software to program the drone with an automated flight path, setting the overlap and sidelap parameters to 80%, and the flying height to 40 m. These survey parameters were proven effective in previous studies for providing accurate population data (Baxter and Hamilton, 2018; Infantes et al., 2022). The survey produced 97 images which we uploaded to Google Drive after the flight for processing. We then used our cloud pipeline to process the imagery, timing each stage as it ran. Figure 3 shows the task completion times across the processing pipeline.

Figure 3 Task completion times for each stage of the processing pipeline.
3 Results
The entire workflow from uploading images to downloading outputs took about 33 minutes to run. Image stitching took the majority of the time, about 17 minutes. This was expected given the computational intensity of orthomosaic generation. The orthomosaic produced by WebODM achieved a resolution of 5.0 cm per pixel.
In order to quantify the accuracy of detection we used multiple statistical metrics including precision, recall, and F1 score (Csurka and Larlus, 2013; Infantes et al., 2022). Precision and recall are calculated using the number of true positive, false positive, and false negative detections made by the object detection model. As shown in Figure 4, a true positive refers to a correct detection of a cow, a false positive refers to the detection of an object that is not a cow, and a false negative refers to a failure to detect an existent cow. The equations for precision, recall, and F1 score can be found below in Figure 5.
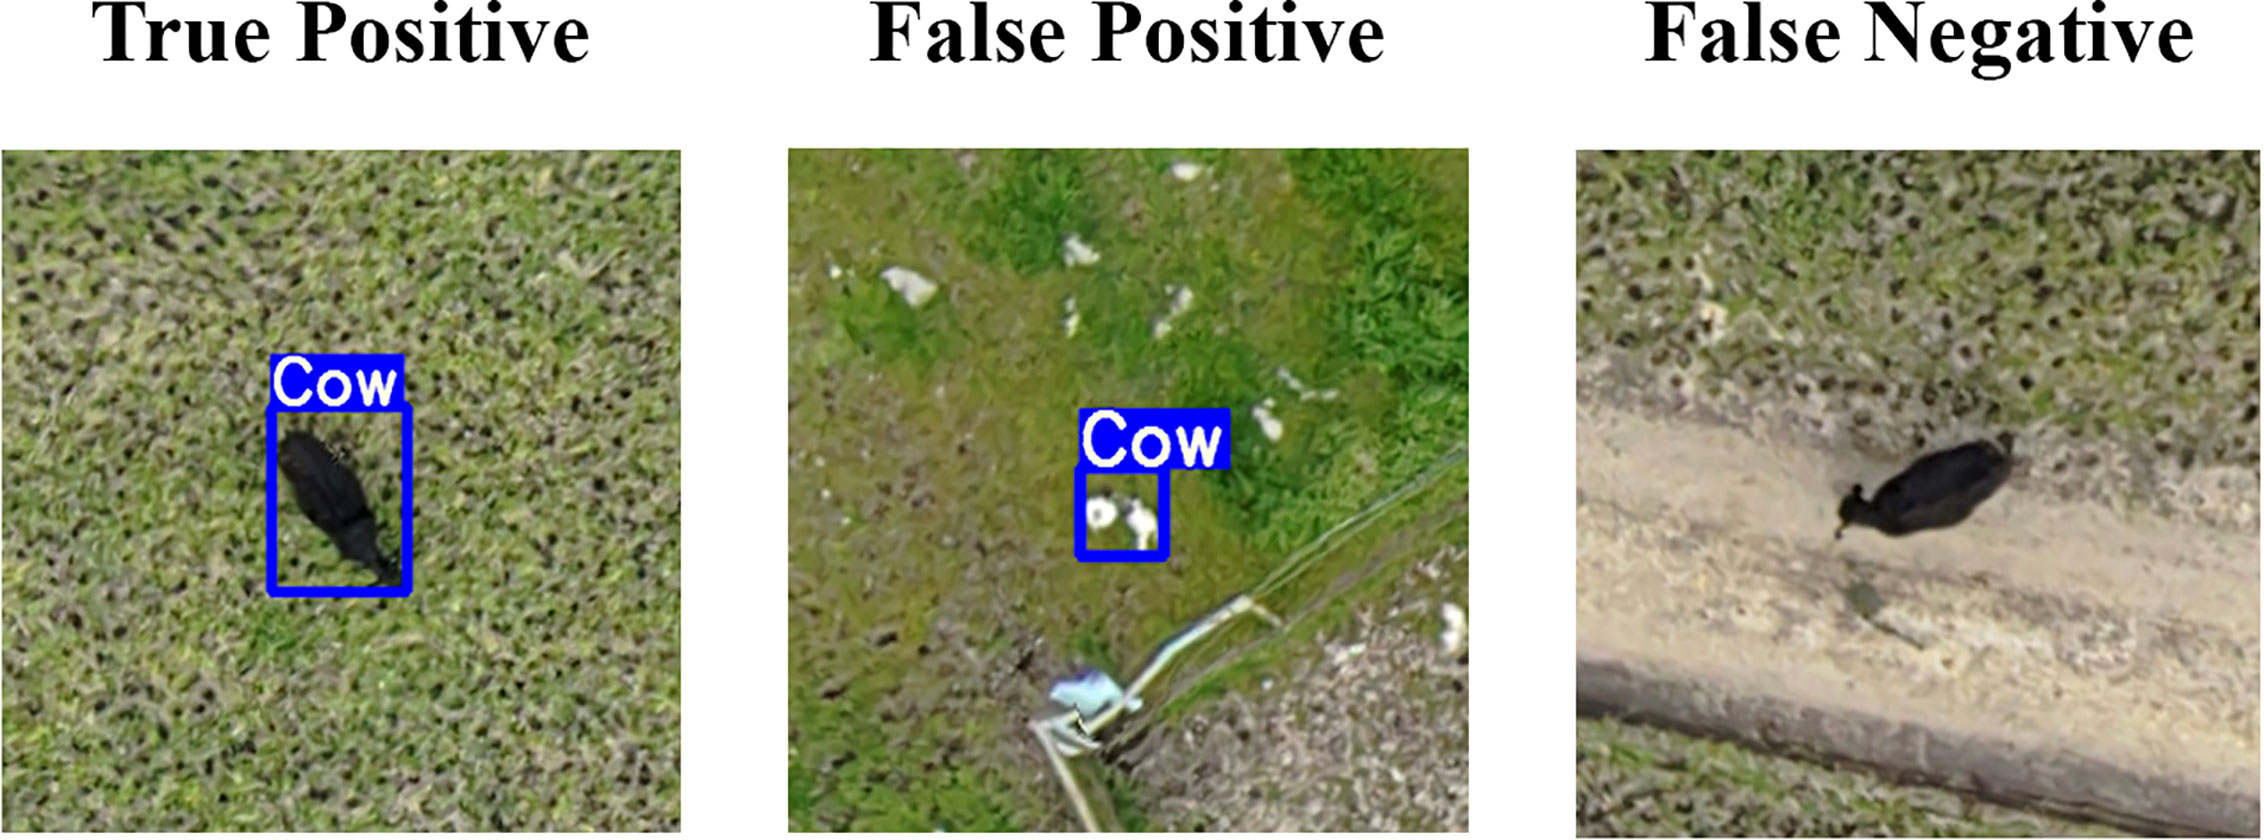
Figure 4 Object detection metrics: True Positive is a correctly detected cow; False positive is the incorrect detection of an object that is not a cow; False Negative is a failure to detect an existent cow.
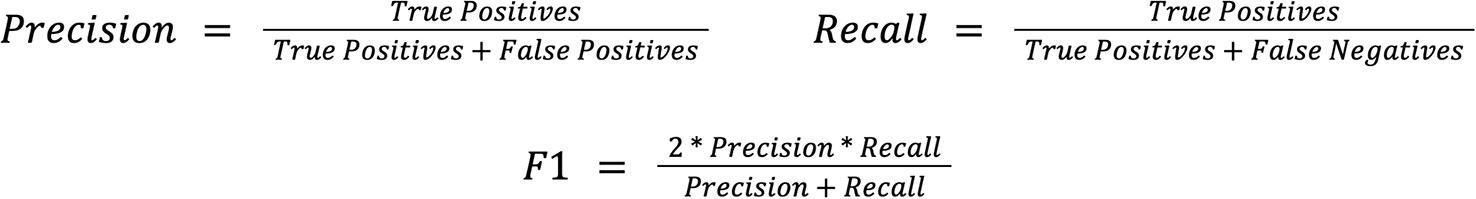
Figure 5 .Calculation of precision, recall and F1 metrics.
Out of our herd of 31 cattle, 26 cows were correctly identified, 5 cows were not identified, and 4 objects were misidentified as cows (a rock, a shed, and bushes). This yielded a precision of 86.67%, a recall of 83.87%, and an F1 score of 85.25% (see Figure 6). The F1 Score, being a holistic combination of precision and recall, is often used to measure the overall accuracy of detection (Csurka and Larlus, 2013; Infantes et al., 2022). Thus, our object detection model detected cows in the herd with 85.25% accuracy. We consider these results as adequate to demonstrate the feasibility of the overall approach, but not indicative of what can be achieved with carefully tuned object detection models. A significant source of error in detections can likely be attributed to the varying altitudes of drone imagery on which our cow detection model was trained.
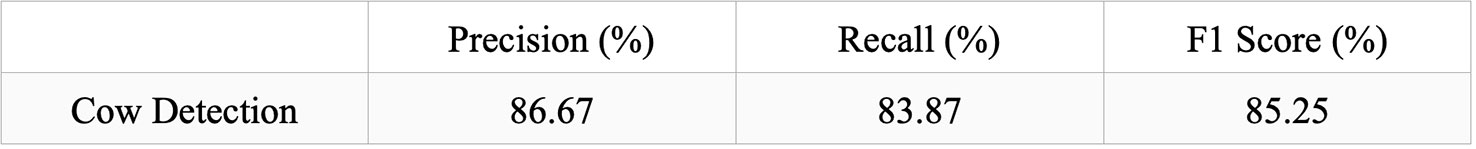
Figure 6 Statistics summary for our accuracy of cow detection.
Our main focus was to develop methodology for a cloud-based software pipeline for wildlife detection. To that effect, we were able to combine all data processing stages into a single software pipeline. This pipeline can be run in the cloud using Google Colab and therefore is not dependent on the machine or operating system. The notebook includes an example dataset, a pre-trained model, and instructions on how to run the pipeline step by step. It also contains a streamlined version that can be run in a single stage. The use of fully open-source software makes it flexible and accessible for continued experimentation. The pipeline provides interactive and descriptive outputs that allow for further analysis of the animal population being surveyed. With the ability to view data in Google Earth (Figure 7) , researchers can analyze spatial patterns, habitat preferences, and population distributions. They can easily share data with others as Google Earth is free software and runs on PC, Mac and Linux. The CSV output with GPS coordinates for each target detection allows for further numerical and statistical analysis of the population. Additionally, since all code is openly accessible, future developers have the ability to edit the functionality of the pipeline and tailor it to their own needs.
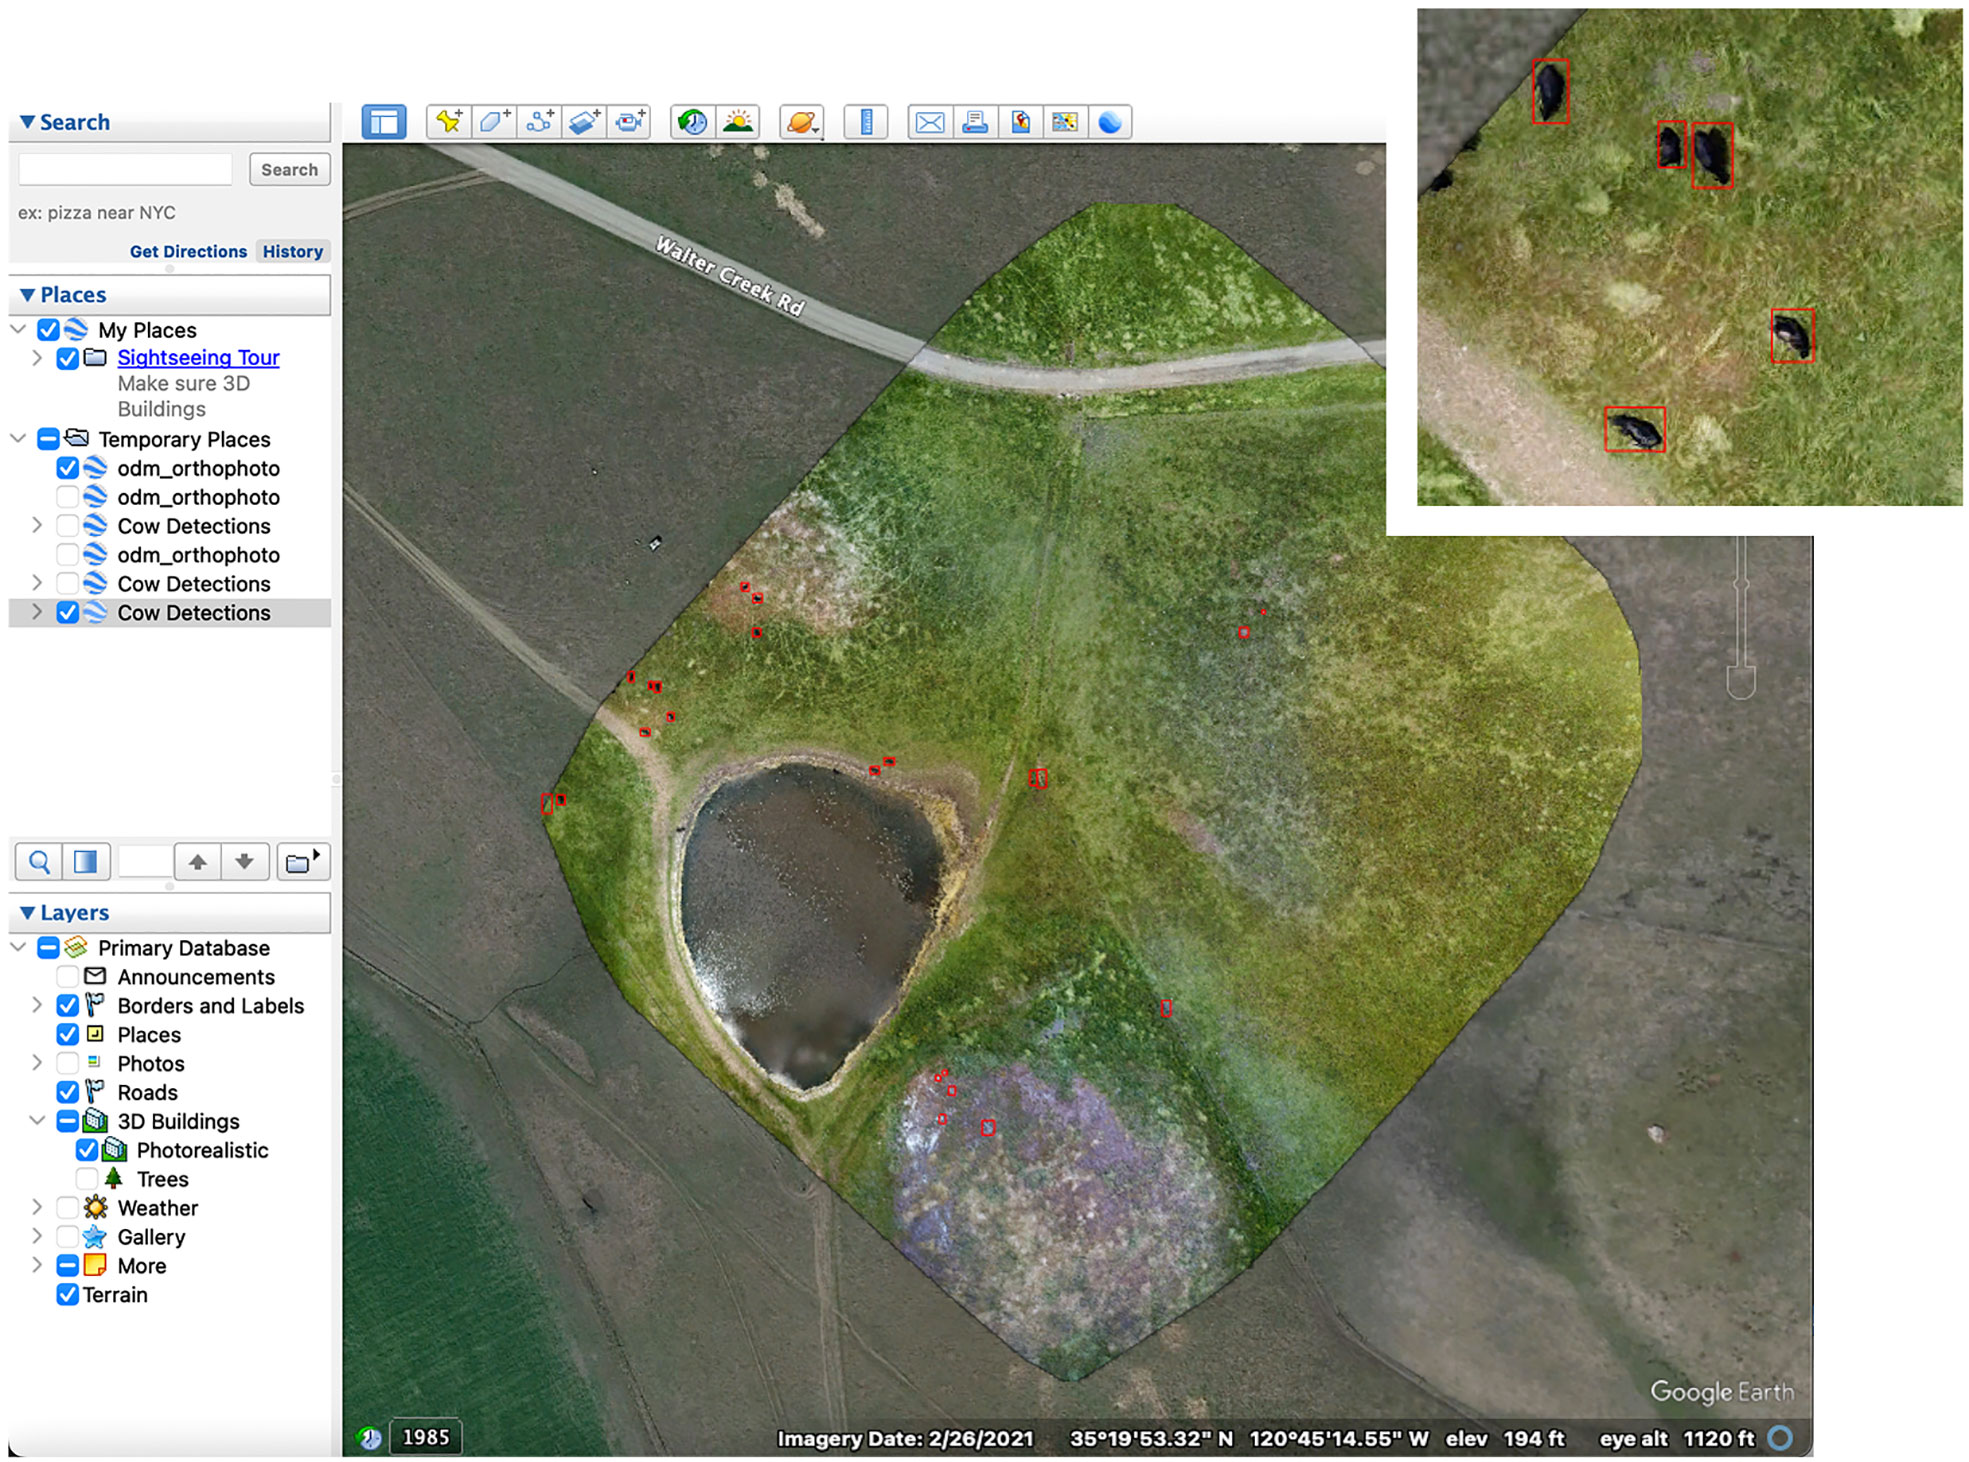
Figure 7 Google Earth visualization using polygon overlays to show Cow Detections. Map Data: ©2021 Google.
4 Discussion
The methods described in this paper exemplify how open-source software, combined with cloud computing, can be used to process aerial wildlife surveys. This lowers multiple barriers of entry for wildlife researchers to begin exploring automated surveying solutions. First, creating this pipeline in a cloud environment removes cumbersome hardware and OS dependencies which often impede progress and require advanced programming knowledge to get around. The workflow we created comes ready and accessible to researchers with little programming experience in the form of an executable Colab Notebook. Second, open-source software such as this can provide a low-cost alternative to expensive consumer software products allowing researchers to experiment with data processing without tying themselves to a specific platform.
During our tests, we identified several limitations of the proposed method in addressing the general needs of wildlife sampling. While creating a stitch of survey imagery can be advantageous for visual outputs and georeferencing, it relies on animals remaining relatively stationary during the drone flight. Movement of cows in-between image captures can create stitching artifacts and duplications that affect the accuracy of detection. On the other hand, cows tend to move more slowly, and such movement effects will be more pronounced for faster-moving animals. Footage of birds, in particular, may capture the same animal multiple times in different parts of the orthomosaic. Further work must be done in distinguishing between individuals and eliminate multiple occurrences of the same individual in one orthomosaic. Recent studies of similar nature have provided techniques to mitigate some of the accuracy problems inherent to wildlife detection. In a study of caribou by Lenzi et al. (2023), researchers trained an object detection model to specifically recognize stitching artifacts and differentiate them from true caribou detections. Such a method has clear potential for improving the accuracy of detection tools. In certain cases, however, stitching artifacts may only represent a small source of error. For example, In Infantes et al.’s study of Scandinavian Harbor Seals (2022), stitching artifacts were recognized by the researchers but generally ignored by their detection algorithm. Still, they achieved a detection accuracy of 95% - 97% when compared with ground-based counts.
The accuracy of detection will also be affected heavily by the habitat being surveyed. The open field used in our study provided a consistent line of sight from the drone to the cows allowing us to capture unobstructed aerial imagery of the target species. However, the presence of obstructions such as tree canopy and shrubbery makes detection of target individuals more difficult. As an alternative to RGB imagery, thermal imagery can be used in order to detect animals in harsher environments (Seymour et al., 2017). Efforts to survey wildlife populations vary greatly based on the environment and species surveyed and thus data collection and processing methods must be carefully tailored to the use case.
The novelty of the work done here lies in processing wildlife survey imagery in a single, cloud-based pipeline. While much research has focused on the autonomous detection of wildlife, previous methods rely on a variety of software packages which, used in sequence, provide a similar functionality to the pipeline we constructed (Infantes et al., 2022; Mattivi et al., 2021). Overall, this study establishes a starting point for wildlife researchers to utilize open-source software and cloud computing in the processing of wildlife survey data. The main outcome of the work reported here is to provide a set of tools for the detection of animals in drone surveys. It is intended for researchers with some background in the use of such tools but does not require deep Computer Science or Machine Learning expertise. As the prevalence of drone technology expands in the field of ecology, such initiatives will aid researchers in their ability to process vast amounts of survey imagery into useful population data.
Data availability statement
The datasets generated for this study can be found here: https://colab.research.google.com/drive/1KSZuuSjBSzPxzZk_3KAFWYfZr26JIssd?usp=sharing.
Ethics statement
The manuscript presents research on animals that does not require ethical approval for their study.
Author contributions
PM and FK contributed to conception and design of the study. PM wrote the first draft of the manuscript and organized the code repository. All authors contributed to manuscript revision, read, and approved the submitted version.
Funding
Funding for the overall Drones for Marine Science and Agriculture project was provided by the Santa Rosa Creek Foundation via the Center for Coastal Marine Sciences at Cal Poly, San Luis Obispo under grant numbers CPC 47496 and 47613.
Acknowledgments
We’d like to acknowledge the work of Shaina Bagri and Piper Feldman in training the YOLOv7 model we used for cow detection.
Conflict of interest
The authors declare that the research was conducted in the absence of any commercial or financial relationships that could be construed as a potential conflict of interest.
Publisher’s note
All claims expressed in this article are solely those of the authors and do not necessarily represent those of their affiliated organizations, or those of the publisher, the editors and the reviewers. Any product that may be evaluated in this article, or claim that may be made by its manufacturer, is not guaranteed or endorsed by the publisher.
References
Baxter P. W. J., Hamilton G. (2018). Learning to fly: integrating spatial ecology with unmanned aerial vehicle surveys. Ecosphere 9 (4), e02194. doi: 10.1002/ecs2.2194
Bisong E. (2019). “Google colaboratory,” in Building machine learning and deep learning models on google cloud platform: a comprehensive guide for beginners. (Berkeley, CA: Apress) 59–64.
Ceballos G., Ehrlich P. R., Dirzo R. (2017). Biological annihilation via the ongoing sixth mass extinction signaled by vertebrate population losses and declines. Proc. Natl. Acad. Sci. U.S.A. 114 doi: 10.1073/pnas.1704949114.
Csurka G., Larlus D. (2013). What is a good evaluation measure for semantic segmentation? Proc. IEEE Transaction Pattern Anal. Mach. Intelligent Meylan. doi: 10.5244/C.27.32
Infantes E., Carroll D., Silva W. T. A. F., Härkönen T., Edwards S. V., Harding K. C. (2022). An automated work-flow for pinniped surveys: A new tool for monitoring population dynamics. Front. Ecol. Evol. 10, 905309. doi: 10.3389/fevo.2022.905309
Karakaya Mevlüt, Celebi M. F., Gök AkınE., Ersoy S. (2022). Discovery of agricultural diseases by deep learning and object detection. Environ. Eng. Manage. J. (EEMJ) 21 (1), 163–173. doi: 10.30638/eemj.2022.016
Lee J., Bang J., Yang S.-I. (2017). Object detection with sliding window in images including multiple similar objects. in 2017 International Conference on Information and Communication Technology Convergence (ICTC) (Jeju, South Korea: IEEE), 803–806. doi: 10.1109/ICTC.2017.8190786
Lehikoinen A., Jaatinen K., Vähätalo A. V., Clausen P., Crowe O., Deceuninck B., et al. (2013). Rapid climate driven shifts in wintering distributions of three common waterbird species. Global Change Biol. 19, 2071–2081. doi: 10.1111/gcb.12200
Lenzi J., Barnas A. F., ElSaid A. A., Desell T., Rockwell R. F., Ellis-Felege S. N. (2023). Artificial intelligence for automated detection of large mammals creates path to upscale drone surveys. Sci. Rep. 13, 947. doi: 10.1038/s41598-023-28240-9
Ma X., Longley I., Salmond J., Gao J. (2020). PyLUR: Efficient software for land use regression modeling the spatial distribution of air pollutants using GDAL/OGR library in Python. Front. Environ. Sci. Eng. 14, 1–14. doi: 10.1007/s11783-020-1221-5
Marchowski D. (2021). Drones, automatic counting tools, and artificial neural networks in wildlife population censusing. Ecol. Evol. 11 (22), 16214–16227. doi: 10.1002/ece3.8302
Marchowski D., Jankowiak L., Wysocki D., Lawicki L., Girjatowicz J. (2017). Ducks change wintering patterns due to changing climate in the important wintering waters of the Odra River Estuary. PeerJ 5, e3604. doi: 10.7717/peerj.3604
Marchowski D., Lawicki L., Fox A. D., Nielsen R. D., Petersen I. K., Hornman M., et al. (2020). Effectiveness of the European Natura 2000 network to sustain a specialist wintering waterbird population in the face of climate change. Sci. Rep. 10 (1), 20286. doi: 10.1038/s41598-020-77153-4
Marchowski D., Leitner M. (2019). Conservation implications of extraordinary Greater Scaup (Aythya marila) concentrations in the Odra Estuary, Poland. Condor 121 (2), duz013. doi: 10.1093/condor/duz013
Mattivi P., Pappalardo S. E., Nikolić Nebojša, Mandolesi L., Persichetti A., De Marchi M., et al. (2021). Can commercial low-cost drones and open-source GIS technologies be suitable for semi-automatic weed mapping for smart farming? A case study in NE Italy. Remote Sens. 13 (10), 1869. doi: 10.3390/rs13101869
Mokrane A., Choukchou-Braham A., Cherki B. (2019). “DEM generation based on UAV photogrammetry,” in 2019 International Conference on Advanced Electrical Engineering (ICAEE) (Algiers, Algeria: IEEE). 1–5. doi: 10.1109/ICAEE47123.2019.9014805
Ophoff T., Van Beeck K., Goedemé T. (2023). “Improving Object Detection in VHR Aerial Orthomosaics,” in Computer Vision – ECCV 2022 Workshops Lecture Notes in Computer Science., eds. Karlinsky L., Michaeli T., Nishino K. (Cham: Springer Nature Switzerland), 268–282. doi: 10.1007/978-3-031-25082-8_18
Pandiya M., Dassani S., Mangalraj, P. (2023). Analysis of deep learning architectures for object detection -a critical review. (Hyderabad, India: IEEE-HYDCON) 2020 pp. 1–6. doi: 10.1109/HYDCON48903.2020.9242776
Purcell C. R., Walsh A. J., Colefax A. P., Butcher P. (2022). Assessing the ability of deep learning techniques to perform real-time identification of shark species in live streaming video from drones. Front. Mar. Sci. 2020. doi: 10.3389/fmars.2022.981897
Roff G., Brown C. J., Priest M. A., Mumby P. J. (2018). Decline of coastal apex shark populations over the past half century. Commun. Biol. 1 (1), 223. doi: 10.1038/s42003-018-0233-1
Seymour A. C., Dale J., Hammill M., Halpin P. N., Johnston D. W. (2017). Automated detection and enumeration of marine wildlife using unmanned aircraft systems (UAS) and thermal imagery. Sci. Rep. 7 (1), 45127. doi: 10.1038/srep45127
Sikora A., Marchowski D. (2023). The use of drones to study the breeding productivity of Whooper Swan Cygnus cygnus. Avian Biol. Res. 90 (1), 193–200. doi: 10.1080/24750263.2023.2181414
Wang C.-Y., Bochkovskiy A., Liao H.-Y. M. (2022). YOLOv7: Trainable bag-of-freebies sets new state-of-the-art for real-time object detectors. arXiv. doi: 10.48550/ARXIV.2207.02696
Keywords: drone, wildlife, survey, automated, pipeline, sampling
Citation: Marsh PK and Kurfess FJ (2023) A software pipeline for automated wildlife population sampling. Front. Conserv. Sci. 4:1219482. doi: 10.3389/fcosc.2023.1219482
Received: 11 May 2023; Accepted: 08 September 2023;
Published: 02 October 2023.
Edited by:
Mads Bødker, Copenhagen Business School, DenmarkReviewed by:
Timothy C. Haas, University of Wisconsin–Milwaukee, United StatesDominik Marchowski, Polish Academy of Sciences, Poland
Copyright © 2023 Marsh and Kurfess. This is an open-access article distributed under the terms of the Creative Commons Attribution License (CC BY). The use, distribution or reproduction in other forums is permitted, provided the original author(s) and the copyright owner(s) are credited and that the original publication in this journal is cited, in accordance with accepted academic practice. No use, distribution or reproduction is permitted which does not comply with these terms.
*Correspondence: Franz J. Kurfess, Zmt1cmZlc3NAY2FscG9seS5lZHU=