 Nathan Huvier
 Gilles Moyne1†
 Cécile Kaerle
- 1Centre Athenas - Wildlife rescue center, L’Etoile, France
- 2Antagene - Animal Genomics Laboratory, La Tour de Salvagny, France
The Eurasian lynx reappeared in the French Jura Mountains, in the late 1970s, as the result of the dispersion of lynxes from the Carpathian region reintroduced in Switzerland in the early 1970s. Since then, the state of this population has remained poorly known. One estimate gives the number of individuals between 120 and 150. Opportunistic observation and monitoring suggest poor connectivity with the populations in Germany or in other parts of Switzerland. Forty years after its comeback in France, we could expect a higher number of individuals, but possible inbreeding depression as well as threats such as poaching and collisions with cars may explain the limitation of number of individuals observed and may lead to a new extinction of the specie in this region. We used 23 microsatellite markers and 78 DNA samples, collected between 2008 and 2020, to establish the genetic state of the French Jura Mountain lynx population. Our results show extremely low genetic diversity with an observed heterozygosity (Ho) of 0.36 and an effective population size (Ne) of 38.2. When comparing the source population (Carpathian), the inbreeding level is very worrying (Fe = 0.41). These results are among the lowest recorded for the Eurasian lynx. To avoid extinction, which we estimate will occur in approximately 30 years, we recommend the introduction of new genetic material. Although reintroduction is controversial, solutions such as the replacement of poached lynxes and the exchange of orphan lynxes between care centers are good initial actions for population strengthening. This offers a rapid intervention while studying solutions for more sustainable conservation
1 Introduction
Historically present in most of Eurasia (Kratochvil et al., 1968), the Eurasian lynx (Lynx lynx, Linnaeus, 1758) has seen its distribution drastically reduced over time and has become extinct in parts of Western Europe, as a consequence of direct destruction and reduction of its habitat. Only a few self-sustainable populations remain in the Carpathian region, Northern Europe, and Scandinavian countries.
In France, the sub-species Lynx lynx lynx was initially present but became extinct at the end of the 19th century. It was only in the 1980s that the lynx reappeared in the French Jura Mountains (JM), which is spread along the French-Swiss border. This recolonization is the result of reintroductions of Eurasian lynxes (Lynx lynx) in the Swiss JM in the 1970s. A total of two men and two women originating from the Carpathian mountain (Lynx lynx carpathicus) were legally reintroduced, and an estimated number of three men and three women from unknown origins were illegally reintroduced (Breitenmoser et al., 1998).
Today, approximately 200 adult lynxes are estimated to be living in the JM, with a majority being in France (approximately 70%). Despite being protected and having endangered status (IUCN), this population is still highly threatened by poaching (Heurich et al., 2018), reflecting the conflict between lynxes and humans, and by road kill. These threats have caused the extinction of the reintroduced Vosges mountains population (France) in less than 20 years.
Reintroducing small numbers of individuals, of which not all become founders (Vandel et al., 2006), often results in a loss of genetic diversity compared with the source population. Small populations are more sensitive to genetic drift and mutations leading to reduced fitness and thus inbreeding depression (Keller and Waller, 2002). A high level of inbreeding in a population may cause serious damages to individuals themselves and to reproductive success (Frankham et al., 2002; Reed et al., 2003). Moreover, a genetically weak population has a reduced capacity to adapt to environmental changes (Frankham and Kingsolver, 2004).
Large-scale genetic studies (Breitenmoser-Würsten and Obexer-Ruff, 2003; Sindičić et al., 2013; Bull et al., 2016; Mueller et al., 2022) have shown concerning genetic diversity loss in reintroduced lynx population.
Studies including the JM population are rare, and studies using French samples are non-existent. Indeed, no genetic monitoring of the lynx population has been done in France. We have collected, over the past decade, samples of injured and dead lynxes. We use microsatellite data to evaluate the genetic diversity of the reintroduced French JM population after 40 years of reintroduction and compare it with the source population (Carpathian). Our goal is to define the genetic status of the French lynx population to guide the conservation actions to reinforce the population in a favorable conservation state, as well as to develop our knowledge of the evolution of small reintroduced populations of large carnivores.
2 Material and methods
2.1 Ethical statement
Capture of injured lynxes and DNA sampling licenses were approved by the French Ministry of the Environment (N°: DEVL1714207A) and by the prefectures of each departments involved by the study: Ain (N°: DDPP01 16-250), Doubs (N°: 25-2016-07-27-003), Haute-Savoie (N°: DDT-2018-0022), Jura (N°: 39-2016-05-27-004), and Territoire de Belfort (N°: 90-2016-07-13-002). No animals were trapped for DNA sampling purpose only. All manipulations of living animals were done by authorized qualified persons and the associated veterinary team. All applicable institutional and/or national guidelines for the care and use of animals were followed.
2.2 Genetic sample collection
We sampled DNA from injured adult lynxes and injured and/or orphan juvenile lynxes in the JM from 2008 to 2020 that were received by the wildlife rescue center, Centre Athenas. Additional samples were collected from dead lynxes by the Laboratoire Départemental d’Analyse (LDA) and the Office Français de la Biodiversité (OFB) (Figure 1).
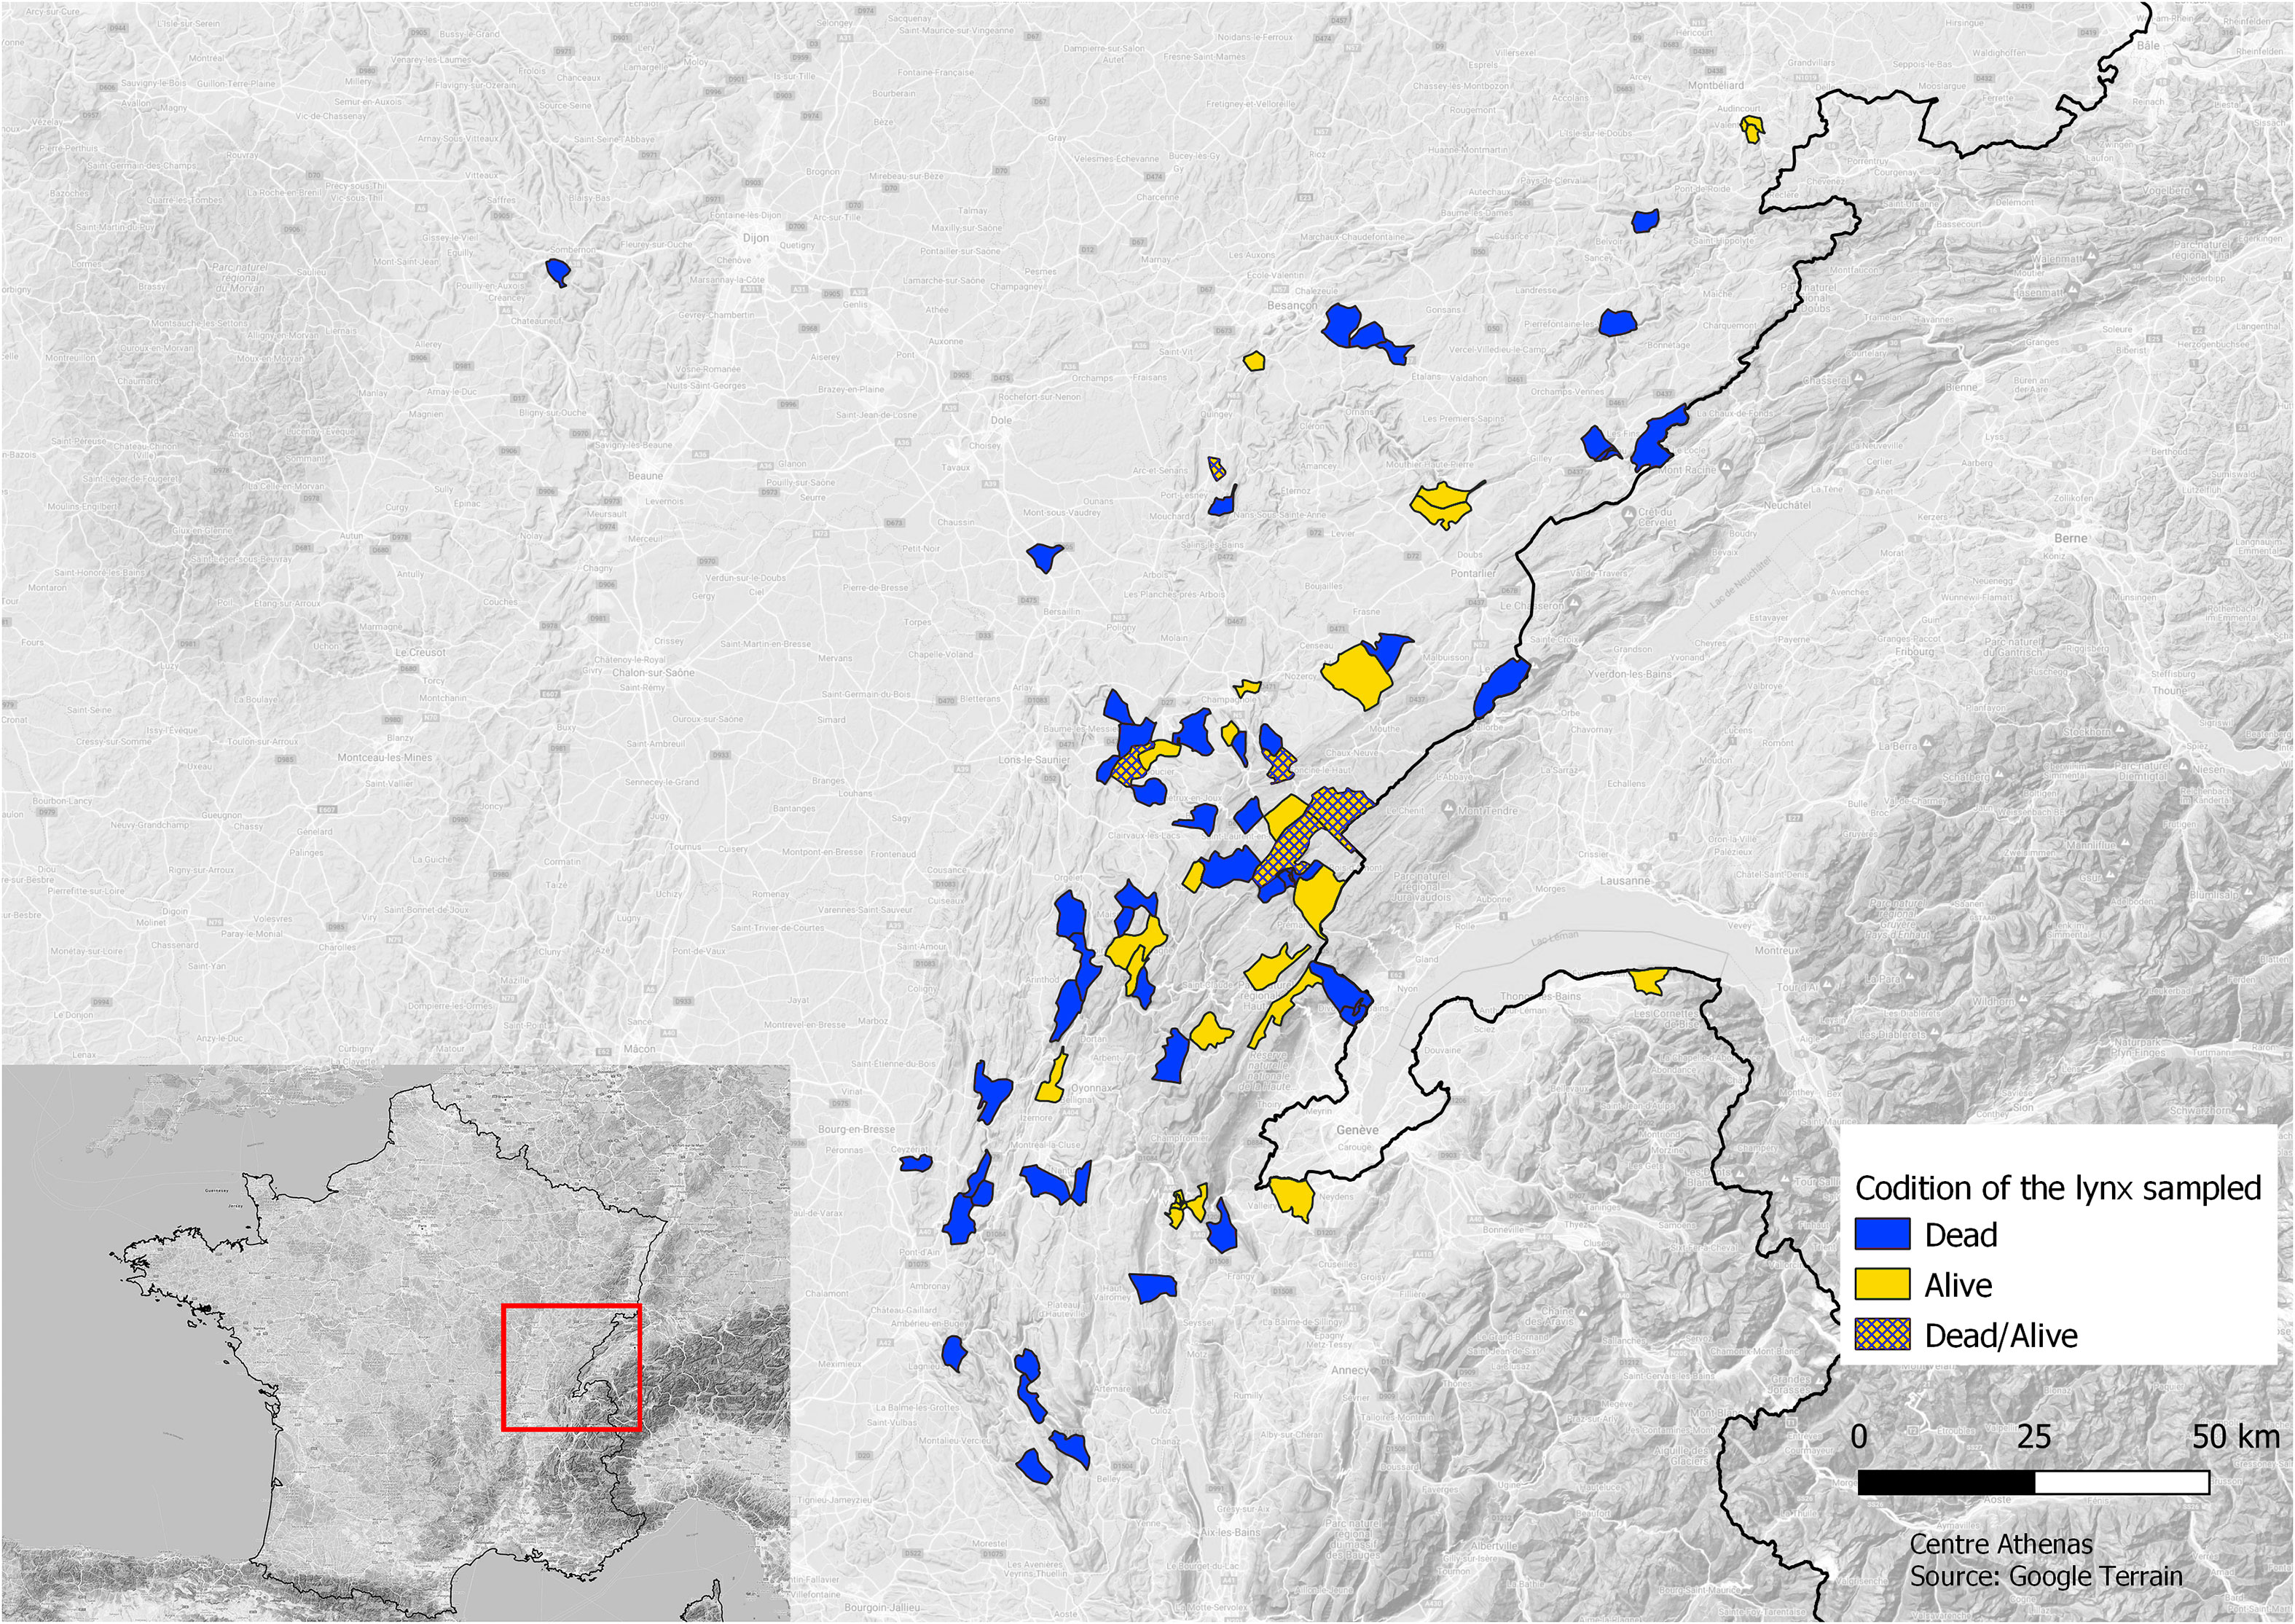
Figure 1 Map of the communes’ origin of the lynx sampled and state of the lynxes sampled: alive (light gray) or dead (dark gray) or both (hatched).
Four types of samples were collected. Thirty-eight muscles were collected from dead lynxes only and stored in ethanol; one blood sample and eight smears were collected from living individuals. The blood sample was preserved in a Venoject vacuum blood collection tube, and the smears were done using cell sampler kits (ref: 440151) from the IDEXX laboratory. Finally, 41 hair samples were collected, and we made sure that hair bulbs were harvested. These hair samples were stored in individually labelled envelopes. In total, 88 samples of L.l.carpathicus were gathered. This sampling represents approximately 44% of the estimated population in the JM.
We do not consider the sampling of dead lynxes as an issue, because they were either breeding individuals or siblings. So, the genetic background contained in these samples exists into the population.
2.3 DNA extraction and microsatellites genotyping
Each sample was prepared following a sterilized process in a specific extraction room clean of DNA. For each sample, disposable sterilized tools were used and the bench was cleaned with bleach to avoid cross-contamination. Each sample was transferred to a sterilized labelled microtube before proceeding to DNA extraction. Sample tubes were surrounded by both negative extraction controls (blanks) and positive extraction controls consisting of tissue sample previously analyzed and validated in terms of DNA quality and genotyping success on microsatellite markers. Sample tubes, as well as positive and negative extraction controls, were lysed overnight at 56°C according to the manufacturer’s instructions (Nucleospin 96 Tissue Kit, Macherey-Nagel). DNA was isolated and purified using purification columns and vacuum filtration (Nucleospin 96 Tissue Kit, Macherey-Nagel, Düren, Germany). DNA was eluted with 100 μl of elution buffer to obtain final concentrations between 20 ng/μl and 100 ng/μl.
For each DNA sample, 32 microsatellite markers (Menotti-Raymond et al., 1999) and one marker for sex identification (ZFXY, Pilgrim et al., 2005) (Supplementary Table S1) were amplified by three multiplex PCR (polymerase chain reaction) A, B, and C and analyzed with an automated sequencer in three migrations (one for each multiplex). The sex identification marker (ZFXY) and one microsatellite (FCA026) were amplified twice in two different multiplexes.
PCR reactions were prepared step by step following a unidirectional workflow starting in a clean room with positive air pressure to prepare sensitive reagents (enzymes and DNA primers) and continuing in a pre-PCR room for assembling DNA and reagents, using filtered tips. Three negative controls (blanks) and three positive controls (DNA previously analyzed and validated in terms of genotyping success and quality) were included per PCR reaction plate. PCR amplifications were then performed in the dedicated post-PCR area in 96-well microplates in a 10-μl final volume containing 5 μl of mastermix Taq Polymerase (Type-It Microsatellite PCR Kit, Qiagen), respectively, 1.66 μl of a first pool of 15 pairs of primers or 0.91 μl of a second pool of nine pairs of primers or 0.88 μl of a third pool of 11 pairs of primers at a concentration from 0.10 to 1.00 μM each, and a mean of 30 ng of genomic DNA. Each pair of primers was coupled to a fluorescent dye (Supplementary Table S1). Our PCR thermal protocol consisted of 95°C for 5 min, followed by 35 cycles of 95°C for 30 s, 56.8°C or 57°C or 59°C for 90 s, and 72°C for 60 s, ending with an extension of 60°C for 30 min.
PCR products were resolved on a calibrated ABI PRISM 3130 XL capillary sequencer (Thermo Fisher Scientific) under denaturing conditions (HiHi Formamide, Thermo Fisher Scientific) with an internal size marker prepared once and dispatched equally in all sample wells of each marker run. This internal size marker guarantees the same calibration for all samples. As all the samples were distributed on different plates and each plate contained the same positive reference controls (previously genotyped once), all positive controls were finally run multiple times on each marker and so guarantee both amplification and capillary resolution repeatability. The electropherograms were analyzed using GENEMAPPER 4.1 (Thermo Fisher Scientific) and independently by two analysts to determine the allele sizes for each marker of each individual. When the genotypes determined by each analyst did not agree, the electropherograms were read again, reading errors were resolved, and in case of persistent disagreement, ambiguous results were considered as missing data. Genotype of each positive control was compared with its known reference to ensure repeatability of analysis. An amplification rate was calculated for each sample representing the ratio of amplified markers over the total number of markers analyzed.
Null allele frequencies can be biased due to inbreeding (Van Oosterhout et al., 2006). To avoid these biases, we used the individual inbreeding model (IIM) implemented in INEST program (Chybicki and Burczyk, 2009) that, regardless of the actual inbreeding coefficient, accurately estimates the frequencies of the null alleles. For this model, we used 500,000 cycles and a burning period of 50,000. Significant results should only be considered when deviation from the Hardy-Weinberg Equilibrium (HWE) expectations are detected at a locus.
The deviation from the HWE was tested in RStudio [2021.09.0 + 351 “Ghost Orchid,” R Core Team (2013)] for each locus with the function “hw.test” of the Cran package “pegas” (Paradis, 2010) with 10,000 Monte Carlo permutation procedure. Corrected p-value for multiple tests was performed with the Holm–Bonferroni correction method (Holm, 1979) with an adjusted p-value of α = 0.05. Linkage disequilibrium (LD) was calculated with the “LD” function of the “pegas” package. A similar Holm–Bonferroni correction was applied for multiple testing. Information about chromosomal location are available for all 23 microsatellites that we genotyped (Menotti-Raymond et al., 1999).
The probability of identity (PID) calculation was used to evaluate the power resolution of the microsatellite panel and its suitability for genetic analyses. Due to the violation of the HWE and LD assumptions (see 3.1), bias may result from these calculations. Thus, Waits et al. (2001) suggest that one should use both PID and the probability among siblings (PIDsib) to obtain the upper and lower bounds of the theoretical number of individuals that can be identified with this microsatellite panel. To avoid more bias due to the sample size, we used the unbiased equation for the PID. Both the PID and the PIDsib for all loci were computed as the product of the PID and the PIDsib of each locus.
2.4 Genotypic diversity
We evaluated the dynamic of the global genetic diversity of the JM population and over time using a traveling window approach (Sindičić et al., 2013). We created temporal sub-populations, each being composed of 30 individuals, and we moved forward in time by one individual to create the next sub-population. For each 49 temporal sub-populations created this way, the genetic diversity index, namely, the sample size (N), the number of alleles (NA), the allelic richness (AR), as well as the observed and expected heterozygosity (Hobs and Hexp) were estimated in RStudio using the function “divBasic” from the CRAN “divRsity” package (Keenan et al., 2013). The effective number of alleles (Ae) was calculated using the following formula:
2.5 Inbreeding
The inbreeding coefficient (Fis) was calculated for the overall population and for each temporal sub-population in RStudio using the same function used for the genetic diversity index. The significance of this coefficient was tested using permutation tests with 10,000 permutations in FStat (v. 2.9.4) (Goudet, 1994). Additionally, individual inbreeding coefficients were calculated in the Coancestry software (v. 1.0.1.10) (Wang, 2011). This coefficient was implemented using the Triadic Maximum Likelihood (TrioML) method (Wang, 2007) and the Dyadic Maximum Likelihood (DyadML) method (Milligan, 2003). We also estimated the effective inbreeding coefficient of the French JM lynx population in comparison with the source population in Carpathians as
(Frankham, 1998), where HJM is heterozygosity of the JM population and HC is heterozygosity of the source population. Breitenmoser-Würsten and Obexer-Ruff (2003) estimated the heterozygosity of the source Carpathian population as 0.61.
2.6 Population structure and effective population size
The hypothesis of population subdivision and potential immigrants was tested using STRUCTURE software (v.2.3.4) (Pritchard et al., 2000). Analyses were done with no prior definition of population structure and with the assumption of admixture and correlated allele frequencies. For each value of k, from 1 to 10, 20 independent runs were performed with a 10,000 burning period, followed by 100,000 Markov Chain Monte Carlo (MCMC) repetitions. The k number of clusters was determined by the maximum values of ln P(D) and ΔK based on the rate of change in the likelihood of K (Evanno et al., 2005). As ΔK cannot be calculated for K = 1, this method will only be implemented for K from 2 to 10.
This hypothesis is unlikely to give a number of clusters superior at k = 1, meaning that we should have no population subdivision.
Most of the temporal methods used to calculate the effective population size assume discrete generations (non-overlapping generations). This is mostly not the case in natural populations. Sindičić et al. (2013) suggest that if the number of cohorts represented in a sample is roughly equal to the generation length, then estimation of the effective population size should approximately correspond to the effective population size for a generation. For the Lynx, the generation length corresponds to approximately 10 years, which, in our case, correspond to the entire study period. Age structure methods can give an estimation of the effective population size over time by integrating sex and class age information for each individual. Unfortunately, we do not dispose of the age information for all individuals in our dataset. Thus, we decided to calculate the effective population size for the whole dataset, without population subdivision, using the LD method in the LDNe software (Waples and DO, 2008; Robinson and Moyer, 2013).
3 Results
3.1 Sampling and microsatellite genotyping
Of the 88 original samples, 78 were usable with an amplification rate above 70%. Genotyping of microsatellite marker FCA441 failed on all samples and that of the marker F37 partially failed, giving results for 17 of the 78 exploitable samples. Thus, these two loci were removed from the dataset.
In natural populations, loci of seven microsatellite markers (FCA023, FCA031, FCA043, FCA577, FCA220, FCA229, and FCA310) were polymorphic in other European lynx populations (Ratkiewicz et al., 2014) but were monomorphic in the French JM population.
After removing samples with low amplification rate and discarding the loci that could not be genotyped and the monomorphic ones, we have a clean dataset composed of 78 samples and 23 loci. Significant (p< 0.05) deviations from the HWE were found for loci FCA668 and FCA078 due to lower observed heterozygosity than the expected heterozygosity and for locus FCA069 due to higher observed heterozygosity than the expected heterozygosity. After Holm–Bonferroni correction for multiple tests, significant deviation from HWE was confirmed for loci FCA078 and FCA069.
The null allele frequencies for these two loci were very low (0.0832 and 0.0136, respectively). For the locus FCA668, that was significantly deviant from HWE before the Bonferroni correction, the null allele frequency was similarly low (0.0363). After 253 pairwise comparisons and Holm–Bonferroni correction for multiple tests, we found 16 (6.32%) significant pairs of loci for LD. Significant LDs were found on four of 13 locus pairs (13.33%) located on the same chromosome and on 12 of 223 locus pairs (5.38%) located on different chromosomes. According to Gillespie (1998); Frankham et al. (2002), and Bensch et al. (2006), low population size and a strong founder effect can explain these LD values.
Loci FCA078 and FCA069 were discarded from the PID and PIDsib calculation, because they deviate from HWE. The most informative locus is FCA453, which has a PID (PID) and PID among sibs (PIDsib) of 0.045 and 0.44, respectively. The overall PID and PIDsib are computed as the product of PID and PIDsib of all loci. Both give a probability to obtain a specific individual according to the dataset of 4.061696e-07 and 9.121189e-05, respectively. Thus, the number of individuals that can theoretically be identified by PID is 1/PID = 2462025 and by PIDsib is 1/PIDsib = 10963.48, which means that this dataset is strong enough to support this study.
3.2 Genotypic diversity
As they deviate from HWE, loci FCA078 and FCA069 were not included in the calculation of the genetic diversity indexes. All polymorphic loci varied between two and five alleles totaling 54 alleles overall polymorphic loci. The mean number of alleles per locus (Ar) is notably low with a maximum 2.37 and decreases through time to reach 2.29 (r² = 0.2062). The estimated number of alleles per loci (Ae) is 1.63 (Table 1). Of these 54 alleles, nine are rare with a frequency below 0.06. The dimorphic loci FCA649 and FCA675 present a huge difference in allele frequencies, each with a rare allele of frequency of 0.019 and 0.03, respectively. The same observation is done for the polymorphic locus FCA026, which presents three of its four alleles as being rare with frequencies of 0.012, 0.006, and 0.006.
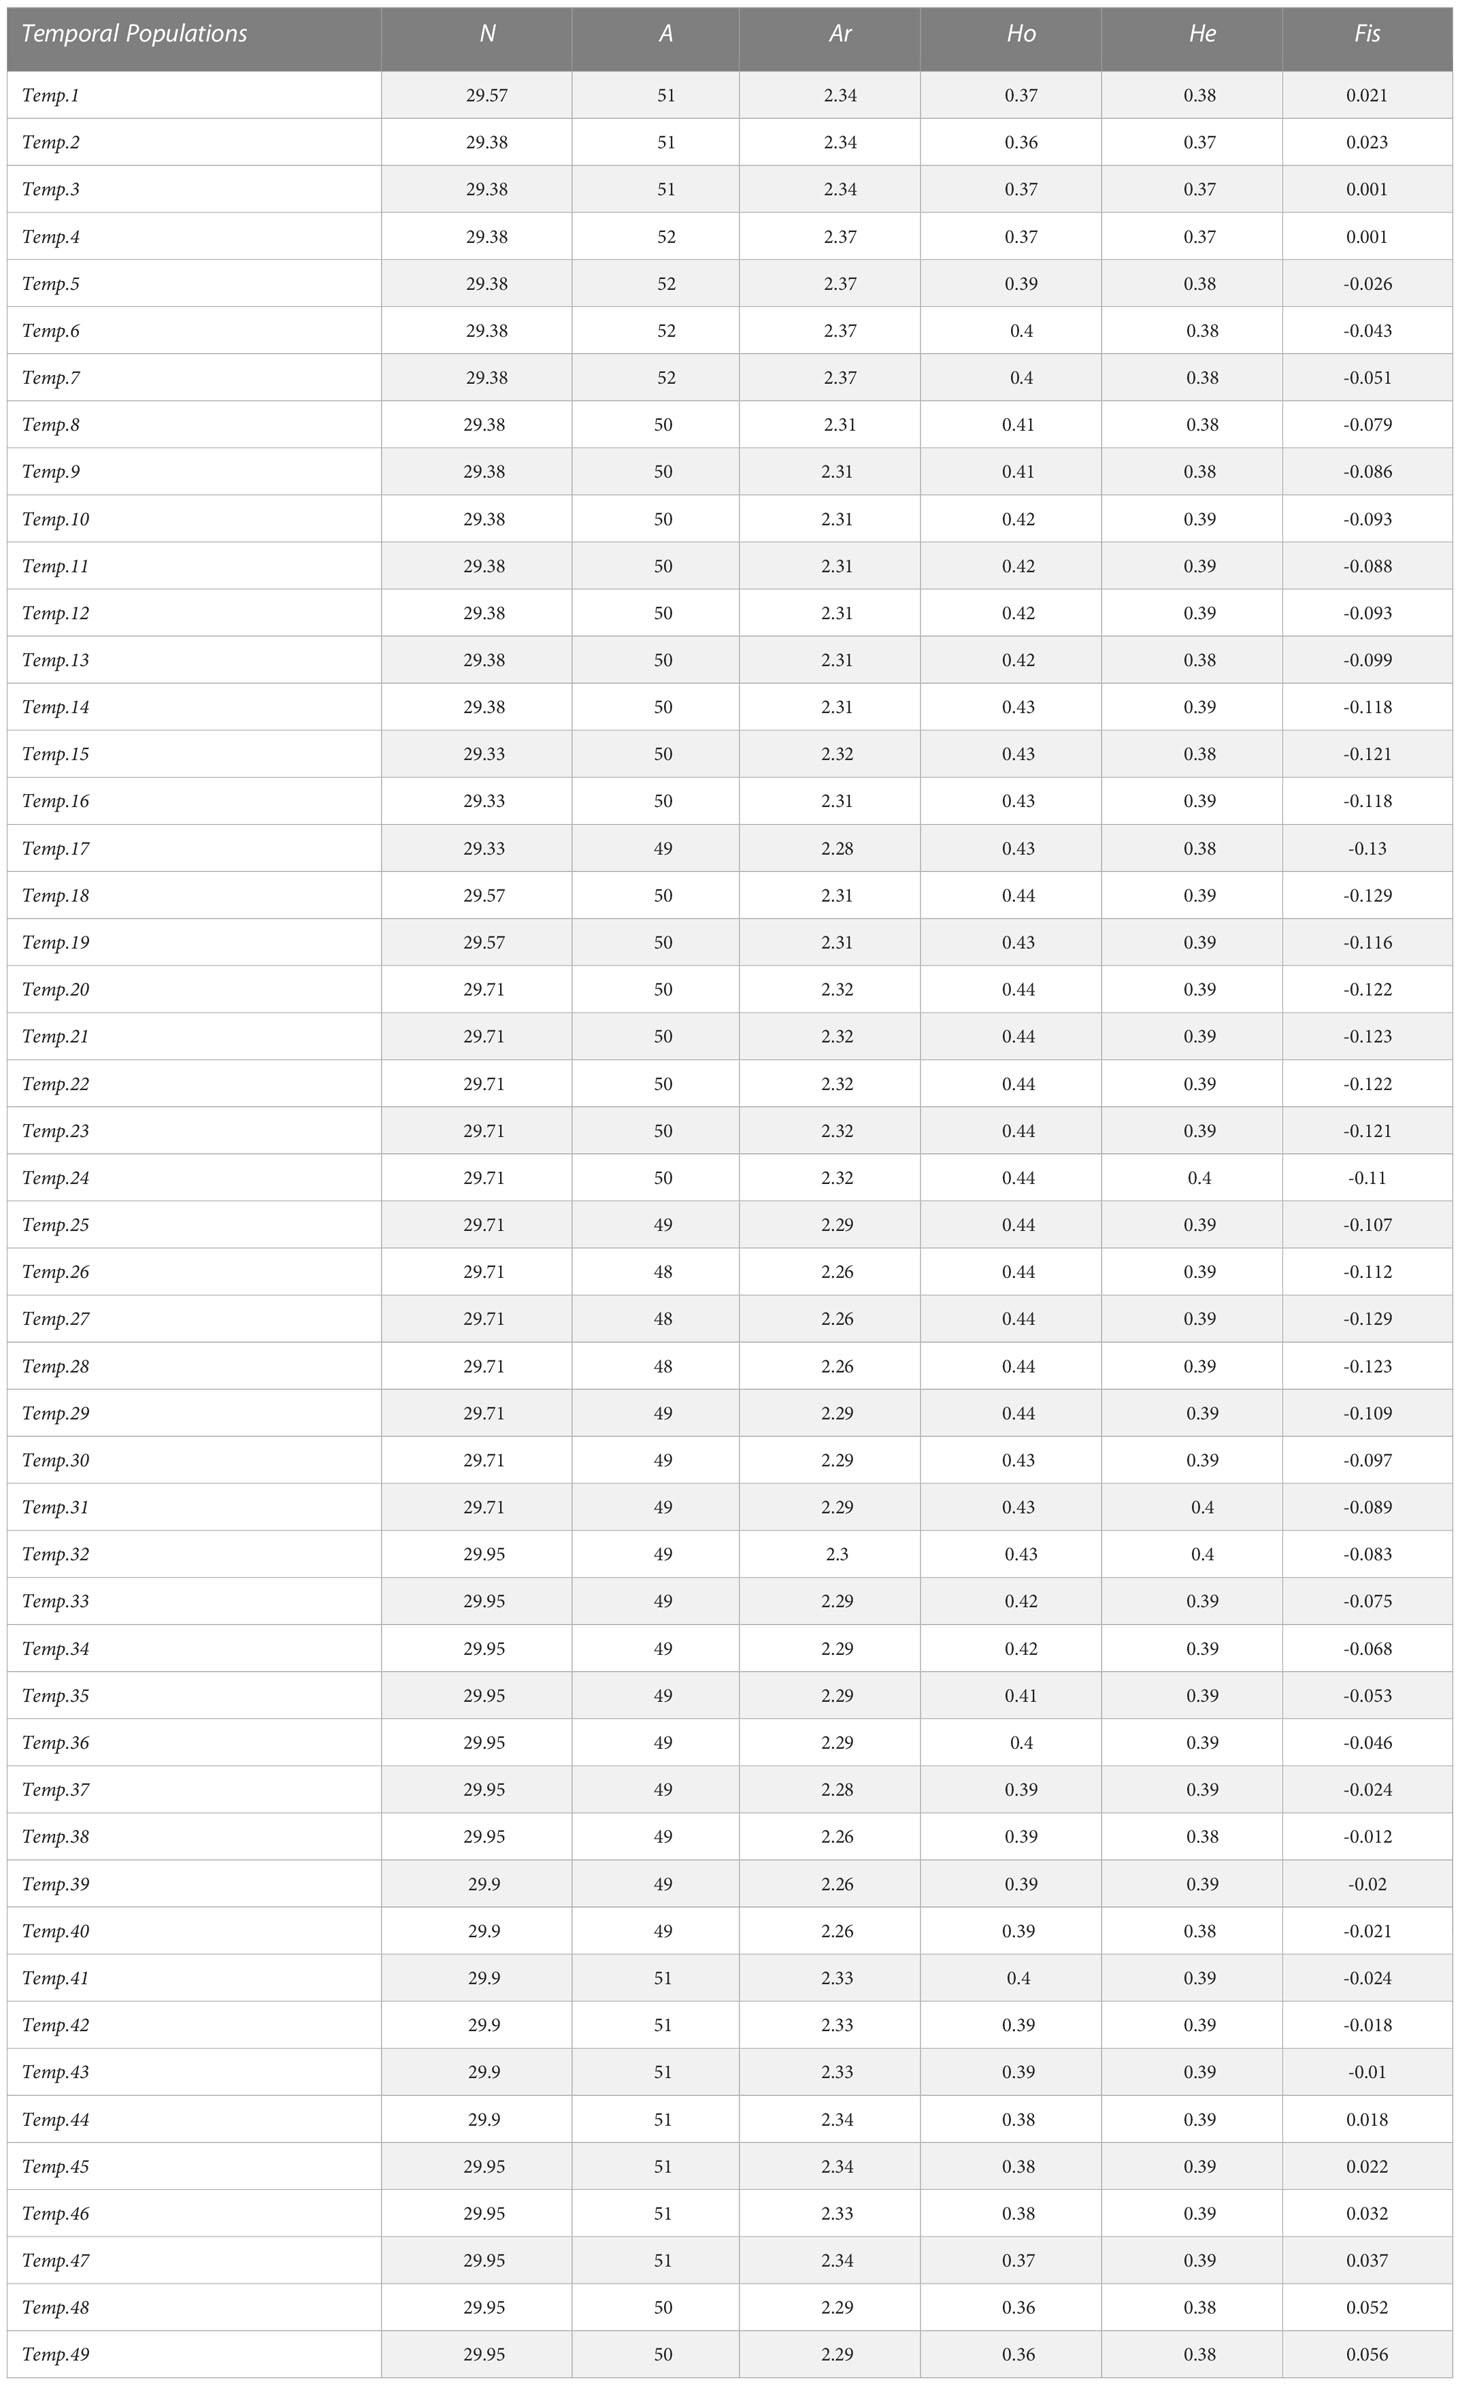
Table 1 Genetic diversity index obtained for each temporal sub-population in the chronological order.
None of the temporal sub-populations showed a significant (p< 0.05) departure from the HWE.
The overall genetic variability estimated over the whole population has an observed heterozygosity (Ho) of 0.40 and an estimated heterozygosity (He) of 0.39. We can see an increase of Ho from 0.36 to 0.44 during the first half of the study period (Figure 2) topping He for the period from August 2015 to November 2018. However, this excess in heterozygotes is not well supported as no deviation from the HWE is noticed. At the end of the study period, Ho = 0.36 and He = 0.38.
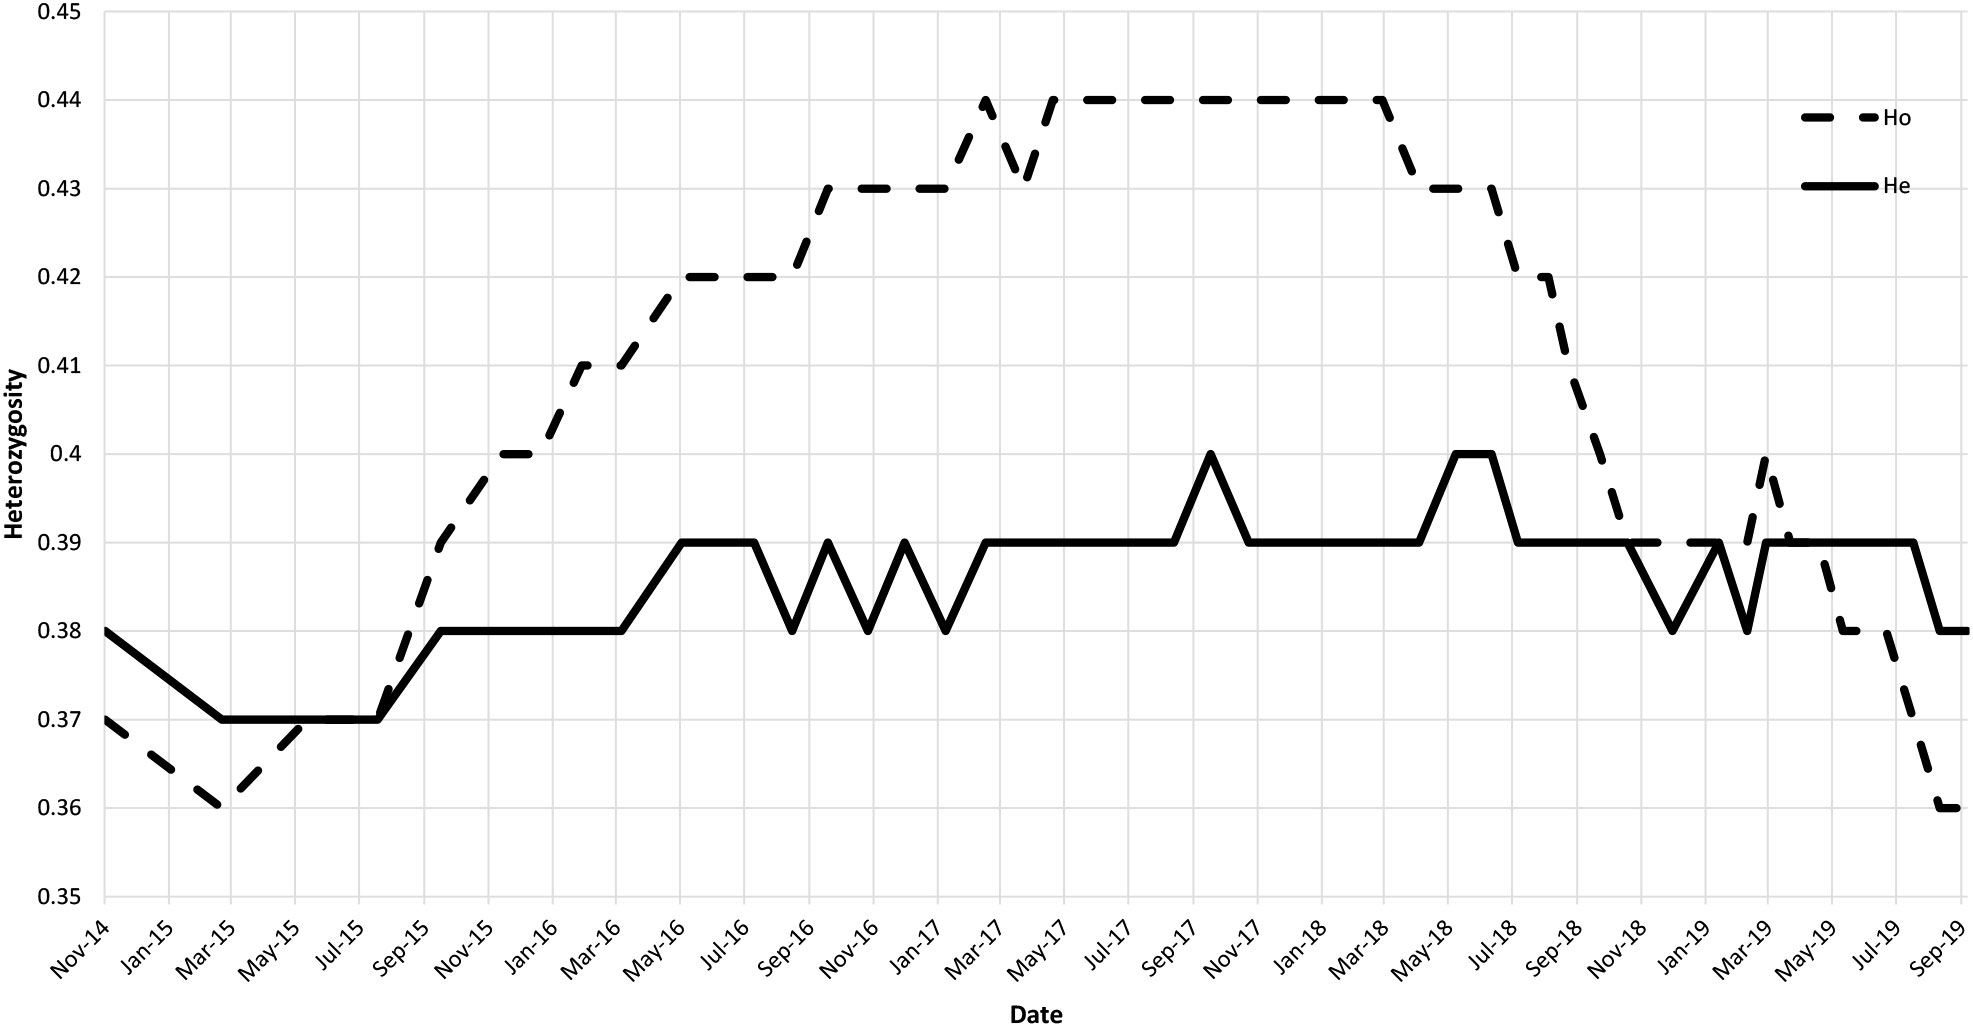
Figure 2 Graphic of the observed (dashed line) and expected (solid line) heterozygosity over time.
3.3 Inbreeding
Traveling window approach shows little variation of the Fis, plus this coefficient remains low during the study period with a mean at −0.06. At the beginning of the study, this coefficient is 0.022; it decreases gradually and become negative from 2015 to reach a minimum of −0.13 in 2017. It then increases and becomes positive again in 2018. The maximal value Fis = 0.056 is reached at the end of the study period. None of the pairwise tests for Fis were significant (p< 0.05), meaning that there is no departure from the panmixia hypothesis.
The individual inbreeding coefficient varies similarly to Fis. The mean for the DyadML method is 0.09 and for the TrioML method is 0.08. Both reach a maximum at the end of the study period (DyadML = 0.17; TrioML = 0.15) (Figure 3).
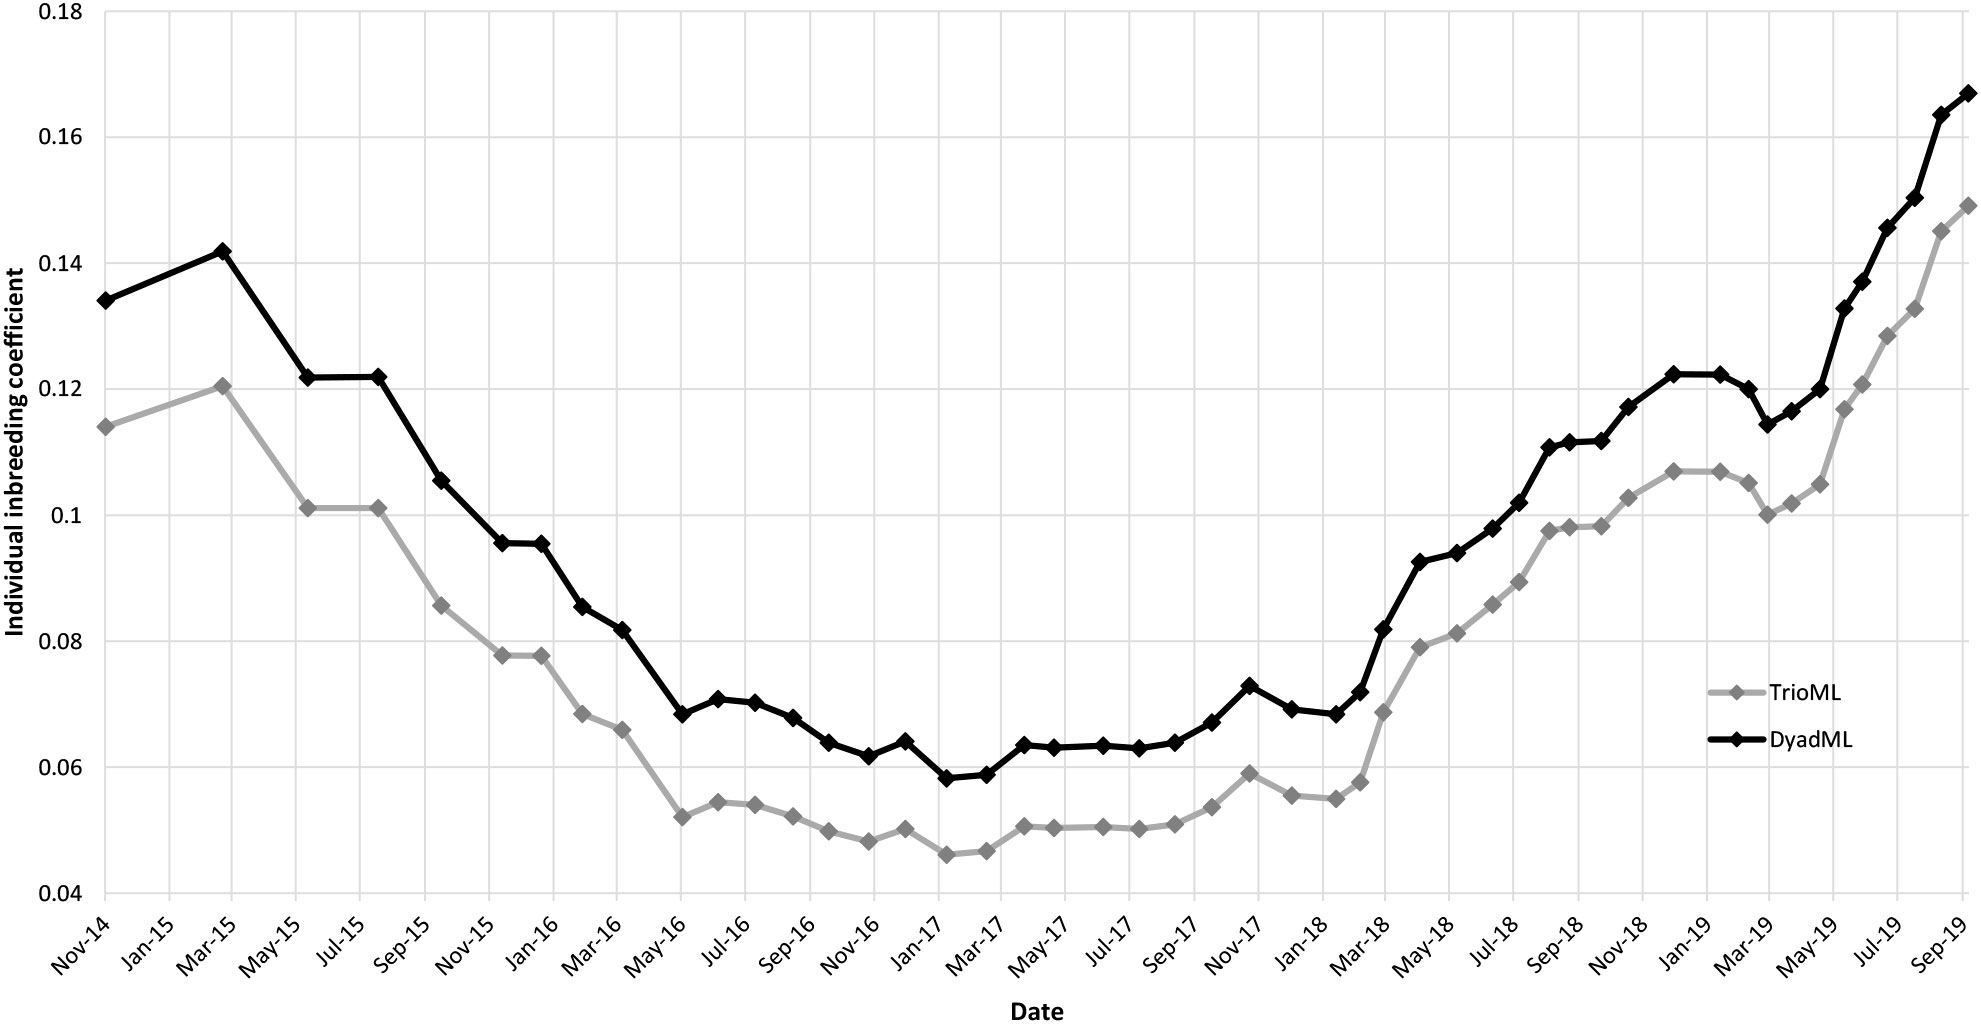
Figure 3 Graphic of the individual inbreeding coefficients obtained over time with the TriolML (gray line) and DyadML (black line) methods.
When compared with the Carpathian population, the effective inbreeding coefficient in the French Jura Mountain population (Ho = 0.36) is Fe = 0.41.
3.4 Population structure and effective population size
After 20 runs for each K (1–10), STRUCTURE software shows a maximized average ln P(D) for K = 1. The calculation of ΔK shows no clear peak for K from 2 to 10. Thus, we should consider the French JM lynx population as single genetic cluster.
Estimation of the effective population size using the LDNe method gives Ne = 32.8 (95% IC: 20.9–48.3). This corresponds to 40% of the estimated population in the JM. We should mention that the estimation of this parameter is often difficult, especially in wild population as most of the methods require discrete generation, an assumption that is violated in most of these populations. Hence, the effective population size that we estimated might be upwardly biased and, thus, the results should be lowered.
4 Discussion
With the use of microsatellites, we showed that the French Jura Mountain lynx population suffers from a large loss of genetic diversity, as well as an elevated rate of inbreeding events. Our results present low variations of the heterozygosity level during the study period, but with a mean level of 0.38, it is one of the lowest recorded, microsatellite wise, since Sindičić et al. (2013) who reported a critical level of genetic diversity in the Dinaric population (Ho = 0.43). The last microsatellite-based study that include the JM population was Breitenmoser-Würsten and Obexer-Ruff in 2003. At that time, the JM population displayed a heterozygosity level of 0.55. It dropped 0.17 in approximately 15 years. This shows how fast this population has lost genetic diversity. More recently, Mueller et al. (2022) showed, with the use of single nucleotide polymorphisms, a heterozygosity level of 0.15, which is one of the lowest heterozygosity levels that they have recorded across the Eurasian lynx populations in Europe.
Another very important parameter to consider when studying a population is the effective population size (Ne). This parameter reflects the past of the population and gives insight into the future of this population. It is a key concept that provides information on the viability of the population, as well as its vulnerability to genetic stochasticity. Here, we show a low Ne of 38.2. According to the 50/500 rule (Franklin, 1980; Franklin and Frankham, 1998), this population size is below the short-term inbreeding depression avoidance threshold. As a consequence and with no augmentation of the population size, this population will probably collapse and any environmental changes will have strong negative effects, as this population is not strong enough to adapt to these new changes (Frankham and Kingsolver, 2004; Frankham, 2005).
As we do not have data between 1970 and 2008, we cannot see how this Ne has evolved. In this study, the calculation of Ne is based on LD, which uses allele frequencies to measure the degree of association between two loci. In dataset with low alleles diversity, and frequencies close to 1 or 0, the LD calculation will lower the estimation of Ne. Hence, with the reduction of genetic diversity over time, we can suppose that Ne has significantly decreased since the reintroduction from Switzerland. This supposition is reinforced by the fact that no reintroduction or population reinforcement has occurred in this population.
Loss of alleles in highly polymorphic loci in a natural population and an allelic richness often inferior at three alleles per locus clearly show an important loss of genetic material in this reintroduced population.
This loss of genetic diversity reflects a strong bottle neck effect and inbreeding. Although there is no deviation from the panmixie hypothesis, mating between close relatives are occurring frequently in the JM population. The effective inbreeding coefficient (Fe = 0.41) recorded at the end of the study period is very concerning. If we take the same example as Sindičić et al. (2013) who consider as a reference point for inbreeding depression the Floridian panther (Puma concolor), which displayed a level of Fe = 0.47, when on the edge of extinction (Johnson et al., 2010). Thus, with a loss of heterozygosity of 1/2 Ne per generation (Crow and Kimura, 1970), giving Ht = (1-1/2 Ne)t.H0, and a generation time between 2.64 and 4 years (Spong and Hellborg, 2002; Palmero et al., 2021), it is reasonable to expect that the French JM lynx population should reach the inbreeding coefficient of the Floridian panther within the next seven generations (approximately 18–28 years).
The fixation and loss of alleles and the probability of mating with a close relative highly depend on the capacity of a species to move and disperse throughout its population range and the availability of connection between populations (Kramer-Schadt et al., 2002a; Kramer-Schadt et al., 2002b). Fragmentation of the habitat and natural barriers are the principal obstacles of population movement. Additionally, anthropic pressure weakens the stability of the population at an accelerated rate. Without protective measures to ensure protection of the species and an increased connectivity between populations, an isolated population as the JM population is vowed to extinction.
Large carnivore’s management is a very sensitive subject, especially in countries where cynegetic actions are highly presents. As Mueller et al. (2022) state, there is a real urge to act toward concrete conservation and management measures. Translocation and reintroduction are keys measures to reinforce populations (Simon et al., 2009) and are strongly recommended. However, in the actual socioeconomic and political context, these actions are hardly debated and often difficult to realize. Thus, if the reintroduction of new individuals is not considered, replacement of poached lynxes by one or two individuals is a good alternative to the loss of a lynx in the population and should discourage poachers and also exchanges between care centers of orphan lynxes is a good alternative to population connectivity for the genetic exchange. Other minor actions can be made to reduce the loss of individuals due to car collisions and poaching and thus help preserve the lynx population. For example, adding specific road signs in the relevant areas (under implementation in France) to inform people of the presence of the lynx, lower the speed limit on the roads and thus reduce the risk of car accidents involving fauna. As for poaching, reinforcement of controls and sanctions for proven cases of poaching should be applied to deter poachers. To preserve the French population of lynxes, which have suffered eradication in the past due to human actions and inaction, it is imperative to take immediate conservation and protective actions.
Data availability statement
The raw data supporting the conclusions of this article will be made available by the authors, without undue reservation.
Ethics statement
The animal study was approved by Conseil National de la Protection de la Nature.
Author contributions
NH: statistical analysis; interpretation of the results; writing. CK: writing of the DNA extraction and genotyping. GM and LM-M: supervisors and referents. All co-authors: proofreading. All authors contributed to the article and approved the submitted version
Funding
This study was co-funded by the Centre Athenas, Region Bourgogne Franche Conté (2016Y-08534), DREAL Bourgogne Franche Conté (EJ2103 646 352) and the Jura (2022_00601) and Doubs (30 03 2022) departments.
Acknowledgments
We would like to thank all people involved in the capture and care of the injured lynxes. This includes those who give the first alert of an injured lynx, the veterinary team and Manon Clerc who is one of the caretakers at Centre Athenas. We would also like to thank the team in charge of the genetic analysis at Antagene. Finally, we would like to thank Perrine Mouzon and Mary Canning Troubat who provided grammatical proofreading of this paper.
Conflict of interest
The authors declare that the research was conducted in the absence of any commercial or financial relationships that could be construed as a potential conflict of interest.
Publisher’s note
All claims expressed in this article are solely those of the authors and do not necessarily represent those of their affiliated organizations, or those of the publisher, the editors and the reviewers. Any product that may be evaluated in this article, or claim that may be made by its manufacturer, is not guaranteed or endorsed by the publisher.
Supplementary material
The Supplementary Material for this article can be found online at: https://www.frontiersin.org/articles/10.3389/fcosc.2023.1080561/full#supplementary-material
References
Bensch S., Andrén H., Hansson B., Pedersen H., Sand H., Sejberg D., et al. (2006). Selection for heterozygosity gives hope to a wild population of inbred wolves. PloS One 1, e72. doi: 10.1371/journal.pone.0000072
Breitenmoser U., Breitenmoser C., Capt S. (1998). Re-introduction and present status of the lynx ( Lynx Lynx ) in Switzerland. Hystrix: The Italian Journal of Mammalogy 10. doi: 10.4404/hystrix-10
Breitenmoser-Würsten C., Obexer-Ruff G. (2003). Population and conservation genetics of two re-introduced lynx (Lynx lynx) populations in Switzerland – a molecular evaluation 30 years after translocation, Vol. 4.
Bull J. K., Heurich M., Saveljev A. P., Schmidt K., Fickel J., Förster D. W. (2016). Theeffect of reintroductions on the genetic variability in Eurasian lynx populations: The cases of bohemian–Bavarian and vosges–palatinian populations. Conserv. Genet. 17, 1229–1234. doi: 10.1007/s10592-016-0839-0
Chybicki I., Burczyk J. (2009). Simultaneous estimation of null alleles and inbreeding coefficients. J. Heredity 100, 106–113. doi: 10.1093/jhered/esn088
Crow J., Kimura M. (1970). An Introduction to Population Genetic Theory. Population (French Edition): Harper and Row, vol. 26. doi: 10.2307/1529706
Evanno G., Regnaut S., Goudet J. (2005). Detecting the number of clusters of individuals using the software STRUCTURE: A simulation study. Mol. Ecol. 14, 2611–2620. doi: 10.1111/j.1365-294X.2005.02553.x
Frankham R. (1998). Inbreeding and extinction: Island populations. Conserv. Biol. 12, 11. doi: 10.1046/j.1523-1739.1998.96456.x
Frankham R. (2005). Genetics and extinction. Biol. Conserv. Biol. Conserv. 126, 131–140. doi: 10.1016/j.biocon.2005.05.002
Frankham R., Ballou J., Briscoe D., McInnes K. (2002). Introduction to Conservation Genetics. 1st edition. (Cambridge University Press). doi: 10.1017/CBO9780511808999
Frankham R., Kingsolver J. (2004). “Responses to environmental change: Adaptation or extinction,” in Evolutionary conservation biology, 1st ed. Eds. Ferrie`re R., Dieckmann U., Couvet D. (Cambridge University Press), 85–100. doi: 10.1017/CBO9780511542022.008
Franklin I. (1980). Evolutionary change in small populations. Conserv. Biol: Evol–Ecol Perspective, 135–149.
Franklin I. R., Frankham R. (1998). How large must populations be to retain evolutionary potential? Anim. Conserv. 1, 69–70. doi: 10.1111/j.1469-1795.1998.tb00228.x
Goudet J. (1994). FSTAT (Version 1.2): A computer program to calculate f-statisitics. J. Heredity 86, 485–486. doi: 10.1093/oxfordjournals.jhered.a111627
Heurich M., Schultze-Naumburg J., Piacenza N., Magg N., Červený J., Engleder T., et al. (2018). Illegal hunting as a major driver of the source-sink dynamics of a reintroduced lynx population in central europe. Biol. Conserv. 224, 355–365. doi: 10.1016/j.biocon.2018.05.011
Holm S. (1979). A simple sequentially rejective multiple test procedure. Scandinavian J. Stat 6, 65–70. doi: 10.2307/4615733
Johnson W., Onorato D., Roelke M., Land D., Cunningham M., Belden R., et al. (2010). Genetic restoration of the Florida panther. Sci. (New York NY) 329, 1641–1645. doi: 10.1126/science.1192891
Keenan K., Mcginnity P., Cross T., Crozier W., Prodöhl P. (2013). DiveRsity: an R package for the estimation and exploration of population genetics parameters and their associated errors. Methods Ecol Evol (Methods in Ecology and Evolution), 4, 782–788. doi: 10.1111/2041-210X.12067
Keller L., Waller D. (2002). Inbreeding effects in wild populations. Trends Ecol. Evol. 17, 19–23. doi: 10.1016/S0169-5347(02)02489-8
Kramer-Schadt S., Knauer F., Kaczensky P., Revilla E., Wiegand T., Trepl L. (2002a). Rule-based assessment of suitable habitat and patch connectivity for the eurasian lynx. Ecol. Appl. 12, 1469–1483. doi: 10.1890/1051-0761(2002)012[1469:RBAOSH]2.0.CO;2
Kramer-Schadt S., Revilla E., Wiegand T., Knauer F., Kaczensky P., Breitenmoser U., et al. (2002b). Assessing the suitability of central european landscapes for the reintroduction of eurasian lynx. J. Appl. Ecol. 39, 189–203. doi: 10.1046/j.1365-2664.2002.00700.x
Kratochvíl J., Verescagin N. K., Saint Girons M. C., Toschi A., Atanasov N., Vala F. (1968). History of the distribution of the lynx in europe. Acta Scientiarum Naturalium Academiae Scientiarum Bohemicae BRNO, 2 (4), 1–5.
Linnæus C. (1758). Systema naturæ per regna tria naturæ, secundum classes, ordines, genera, species, cum characteribus, differentiis, synonymis, locis. Tomus I. Editio decima, reformata. pp. [1–4], 1–824. Holmiæ. (Salvius).
Menotti-Raymond M., David V., Lyons L., Schaffer A., Tomlin J., Hutton M., et al. (1999). A genetic linkage map of microsatellites in the domestic cat (Felis catus). Genomics 57, 9–23. doi: 10.1006/geno.1999.5743
Milligan B. G. (2003). Maximum-likelihood estimation of relatedness. Genetics 163, 1153–1167. doi: 10.1093/genetics/163.3.1153
Mueller S., Prost S., Anders O., Breitenmoser C., Kleven O., Klinga P., et al. (2022). Genome-wide diversity loss in reintroduced Eurasian lynx populations urges immediate conservation management (Biological Conservation 266). doi: 10.1016/j.biocon.2021.109442
Palmero S., Belotti E., Bufka L., Gahbauer M., Heibl C., Premier J., et al. (2021). Demography of a Eurasian lynx (Lynx lynx) population within a strictly protected area in central Europe. Sci. Rep. 11, 1–12. doi: 10.1038/s41598-021-99337-2
Paradis E. (2010). PEGAS: an R package for population genetics with an integrated–modular approach. Bioinformatics (Oxford, England) 26, 419–20. doi: 10.1093/bioinformatics/btp696
Pilgrim K., McKelvey K., Riddle A., Schwartz M. (2005). Felid sex identification based on noninvasive genetic samples. Mol. Ecol. Notes 5, 60–61. doi: 10.1111/j.1471-8286.2004.00831
Pritchard J. K., Stephens M., Donnelly P. (2000). Inference of population structure using multilocus genotype data. Genetics 155, 945–959. doi: 10.1093/genetics/155.2.945
Ratkiewicz M., Matosiuk M., Saveljev A., Sidorovich V., Ozolins J., P. M., et al. (2014). Long-range gene flow and the effects of climatic and ecological factors on genetic structuring in a Large, solitary carnivore: The Eurasian lynx. PloS One 9, e115160. doi: 10.1371/journal.pone.0115160
R Core Team (2013). R: A language and environment for statistical computing (Vienna, Austria: R Foundation for Statistical Computing).
Reed D. H., O’Grady J. J., Brook B. W., Ballou J. D., Frankham R. (2003). Estimates of minimum viable population sizes for vertebrates and factors influencing those estimates. Biol. Conserv. 113, 23–34. doi: 10.1016/S0006-3207(02)00346-4
Robinson J., Moyer G. (2013). Linkage disequilibrium and effective population size when generations overlap. Evol Appl. 6, 290–302. doi: 10.1111/j.1752-4571.2012.00289.x
Simon M., Cadenas R., Jose María G., López-Parra M., Garcia J., Fernández L., et al. (2009). Conservation of free-ranging iberian lynx (lynx pardinus) populations in andalusia. Iberian Lynx Ex Situ Conserv: Interdiscip. Approach, 42–55.
Sindičić M., Polanc P., Gomerčić T., Jelenčič M., Huber D., Trontelj P., et al. (2013). Genetic data confirm critical status of the reintroduced dinaric population of Eurasian lynx. Conserv. Genet. 14, 1–10. doi: 10.1007/s10592-013-0491-x
Spong G., Hellborg L. (2002). A near-extinction event in lynx: Do microsatellite data tell the tale? Conserv. Ecol. 6 (1), 15. doi: 10.5751/ES-00358-060115
Vandel J.-M., Stahl P., Herrenschmidt V., Marboutin E. (2006). Reintroduction of the lynx into the vosges mountain massif: From animal survival and movements to population development. Biol. Conserv. 131, 370–385. doi: 10.1016/j.biocon.2006.02.012
Van Oosterhout C., Weetman D., Hutchinson W. F. (2006). Estimation and adjustment of microsatellite null alleles in nonequilibrium populations. Mol. Ecol. Notes 6, 255–256. doi: 10.1111/j.1471-8286.2005.01082.x
Waits L., Luikart G., Taberlet P. (2001). Estimating the probability of identity among genotypes in natural populations: Cautions and guidelines. Mol. Ecol. 10, 249–256. doi: 10.1046/j.1365-294X.2001.01185.x
Wang J. (2007). Triadic IBD coefficients and applications to estimating pairwise relatedness. Genetical Res. 89, 135–153. doi: 10.1017/S0016672307008798
Wang J. (2011). Coancestry: A program for simulating, estimating and analysing relatedness and inbreeding coefficients: COMPUTER PROGRAM NOTE. Mol. Ecol. Resour. 11, 141–145. doi: 10.1111/j.1755-0998.2010.02885.x
Keywords: lynx (Lynx lynx), microsatellite, genetic diversity, inbreeding, Jura Mountains (France)
Citation: Huvier N, Moyne G, Kaerle C and Mouzon-Moyne L (2023) Time is running out: Microsatellite data predict the imminent extinction of the boreal lynx (Lynx lynx) in France. Front. Conserv. Sci. 4:1080561. doi: 10.3389/fcosc.2023.1080561
Received: 26 October 2022; Accepted: 12 January 2023;
Published: 13 February 2023.
Edited by:
Susana Caballero, University of Los Andes, Colombia, ColombiaReviewed by:
Muhammad Ali Nawaz, Qatar University, QatarMariya Erofeeva, Severtsov Institute of Ecology and Evolution (RAS), Russia
Copyright © 2023 Huvier, Moyne, Kaerle and Mouzon-Moyne. This is an open-access article distributed under the terms of the Creative Commons Attribution License (CC BY). The use, distribution or reproduction in other forums is permitted, provided the original author(s) and the copyright owner(s) are credited and that the original publication in this journal is cited, in accordance with accepted academic practice. No use, distribution or reproduction is permitted which does not comply with these terms.
*Correspondence: Nathan Huvier, bmF0aC1odXYxNkBob3RtYWlsLmZy
†These authors have contributed equally to this work