 Rodrigo Solis-Sosa
 Christina A. D. Semeniuk
 Maxim Larrivée
 Sean Cox
- 1School of Resource and Environmental Management, Simon Fraser University, Burnaby, British Columbia, Canada
- 2Great Lakes Institute for Environmental Research, University of Windsor, Windsor, Ontario, Canada
- 3Insectarium de Montréal, Montréal, Québec, Canada
Non-profit environmental organizations (NGOs) rely heavily on external donors to fulfill their mandates. However, forecasting donations for long-term planning is an elusive task at best. The non-compulsory nature of donation requires NGOs to understand how donors’ attention and funding allocations change over time as conservation scenarios change and incorporate these insights into their budgeting plans. We hypothesize that an NGO can hinder its capacity to reach its conservation goals by neglecting its donor-NGO-natural system (DNNS), which is reactive to the socio-ecological context. To test our hypothesis, we compared the ecological outcomes derived from a budgeting strategy assuming donors have a fixed willingness to pay throughout the program (open-loop) against the reality that donor preferences change over time (closed-loop) based on the evolving ecological context, partly driven by the program’s actions. Our analysis was performed using two different willingness to pay (WTP) behavioural models, one representing donors informed about the success of the program supported (GPI), and another without such information (GPI), evidencing how the underlying assumptions about the target donors can radically change the organization’s fundraising strategy. Next, we used our closed-loop approach to estimate NGO’s optimal yearly donation requests to achieve a conservation target. Finally, we tested the consequences of presuming an incorrect WTP behavioural model while estimating optimal yearly donation requests by applying the optimization results from the previous step into a model parameterized with a different behavioural model. Our model was created by coupling a discrete choice experiment (DCE) and a systems dynamics model, developing a coupled social-ecological model of the eastern Monarch butterfly (Danaus plexippus), a charismatic long-distant migrant butterfly that has dwindled in numbers across North America mainly due to the increases in GMO agriculture. Our results showed a significant difference in donations received and ecological outcome forecasted by an open-loop model and the actual numbers obtained by the more real-life, closed-loop model, highlighting the importance of accounting for human behaviour during the planning phase of a long-term conservation strategy. Next, when we used our closed-loop to estimate optimal donation requests, the conservation objectives and funds raised were consistently and efficiently achieved, regardless of the underlying behavioural WTP model. We also designed novel visual tools from the behaviour WTP model exploration to bridge the gap between science insights obtained from DCEs and decision-making. However, when we used closed-loop optimal donation requests obtained from one WTP behaviour model into a simulation parameterized with different WTP behavioural models, considerable ecological and financial targets deviations arose. These deviations highlight the importance of acknowledging the dynamic nature of donor’s behaviour and the need to thoroughly characterize such behaviour. Finally, we introduce a novel forecasting tool that conservation managers will have at their disposal to improve the accuracy of their budget forecasting and, ultimately, increase the program’s success rate.
1 Introduction
Globally, not-for-profit, and other civil society organizations (NGOs) increasingly lead conservation initiatives that were historically exclusive to government agencies (Boli & Thomas, 1997); for example, spearheading programs via environmental education (Tidball & Krasny, 2010), science development (Howard & Laird, 2013), rulemaking (Andrews, 2010), or creation of protected areas (Meagher, 1973). Government environmental policies typically have short-term policy horizons bound by policy cycles, making it difficult to establish the long-term objectives required for biodiversity conservation (Boston & Berman, 2017). Hence, decentralizing these functions to NGOs has alleviated bureaucracy, allowing for long-term planning, and facilitating transboundary cooperation (Raustiala, 1997). This shift is of particular relevance for wicked environmental problems, where a lack of complete knowledge and a multitiered, complex, dynamically evolving system make finding optimal solutions challenging or impossible (Batie, 2008).
NGOs’ funding structures (Igoe and Brockington, 2007) heavily rely on external sources such as governments, industries, foundations, and private donors (Parks, 2008). Donors’ values and interests might differ from those supported by data-driven evidence, generating inconsistencies in funding that could undermine a conservation strategy’s effectiveness (Ebrahim, 2005; AbouAssi, 2013). Furthermore, NGOs often assume incorrectly that donor contributions will remain constant throughout the life of a project, where instead, donations may fluctuate based in part on program results (Parks, 2008). In other words, the motivating factors driving donations may change precisely because the conservation action is affecting the system’s behaviour. For example, short-term improvements in conservation performance from some NGO-funded action may lead to less urgency and slower/fewer donations, negatively impacting performance against a long-term conservation goal. This situation is particularly true for private donors that do not adhere to more controlled, multiyear funding cycles like those negotiated with governments and foundations.
Revenue from private donations changes constantly, and there is active research developing methods to improve donation forecasting accuracy in different sectors (Britto & Oliver, 1986; Nuamah et al., 2015; Adam et al., 2020; Kyei et al., 2020). Regardless of its mandate or size, any organization relying on a non-compulsory fundraising vehicle such as donations is subject to sudden and seemingly unpredictable changes (Figure 1); in particular, small organizations with narrowly defined mandates and smaller fundraising capabilities might have more difficulty buffering these changes across years. Failing to consider donation unpredictability and how the NGO’s program may influence such changes may result in considerable mismatches between targeted and realized contributions. If realized donations are lower than anticipated, the program might not reach its conservation target and, if higher than anticipated, the program might be excessively costly, undermining the NGO’s credibility for subsequent programs.
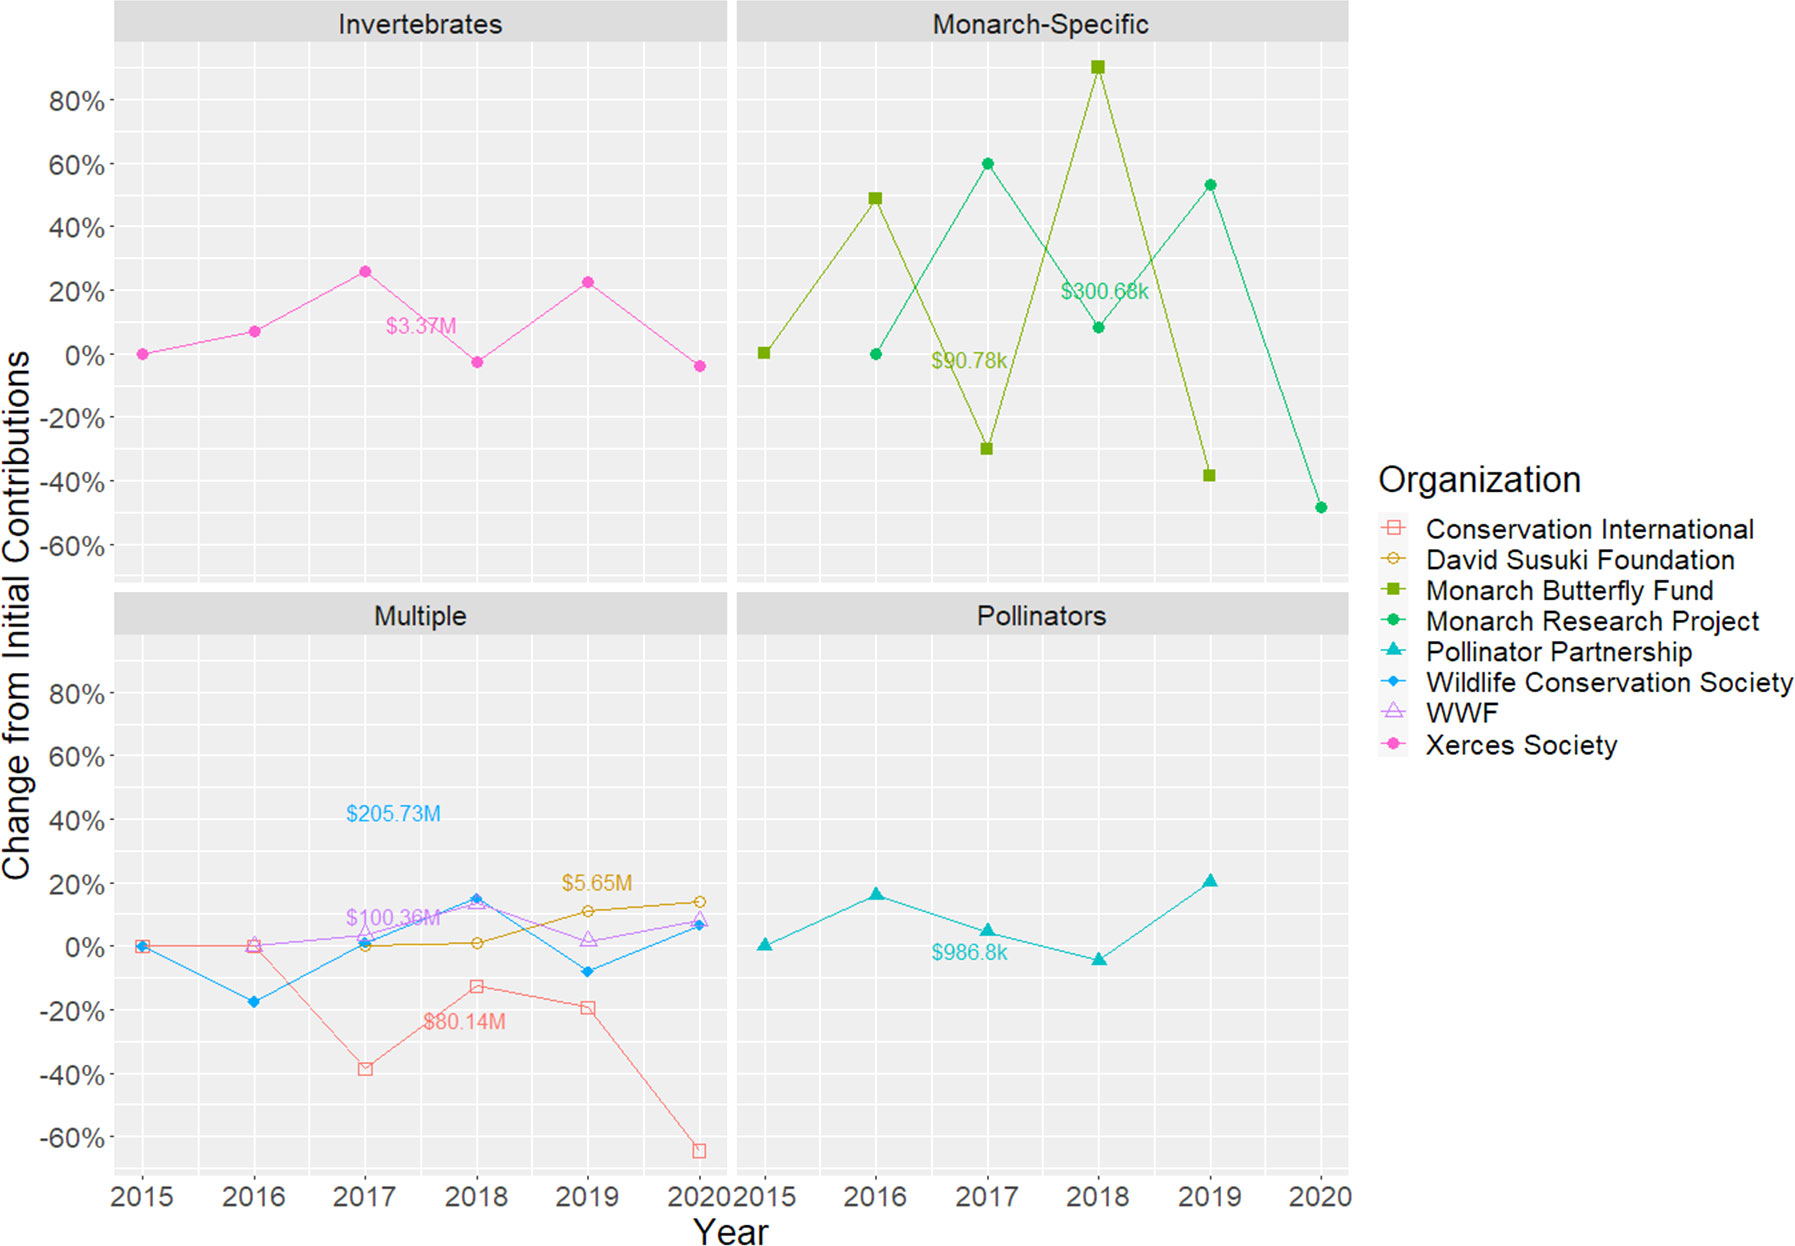
Figure 1 Yearly proportional change in revenue from donations for different environmental NGO’s. The dollar value on each plot describes the dollar amount on the first data point for each time series. Data of organizations with an open shape represent only donations from private individuals, whereas organizations with a filled shape denote total contributions, regardless of donor type. Data sources with open shapes were taken from annual reports (www.propublica.com), whereas closed shapes were obtained from each organization’s IRS Return of Organization Exempt from Income Tax Form 990 (www.propublica.com).
Such negative feedback within Donor-NGO-Natural Systems (DNNS) could be critical for long-term conservation planning. For example, in a Grey whale (Eschrichtius robustus) study, a marked decreasing willingness to pay (WTP) was identified between an initial and a subsequent increase in whale population (Loomis & Larson, 1994); the same was found in an estuarine ecosystem services valuation where respondents decreased their marginal WTP for incremental increases in water quality (Pinto et al., 2016). An organization budgeting a conservation strategy under such contexts would probably experience unexpected differences between their estimated target and realized donations. This situation suggests that a method is needed to account for donors’ evolving preferences at the planning stages of a conservation program.
We hypothesize that if target donations are estimated assuming a fixed donor’s WTP, there might be a considerable mismatch with the realized donations, which respond dynamically to donors’ context-dependent attitudes. Our goal in this paper is to test for such mismatches and, given that we find them, improve the NGO’s target donation’s accuracy by using a DNNS coupled social-ecological model. As a case study, we modelled the DNNS of the eastern population of the Monarch butterfly (Danaus plexippus) by combining Monarch-related social dynamics (Solis-Sosa et al., 2019) with migration-wide ecological dynamics (Solis-Sosa et al., 2021). This charismatic long-distant migrant butterfly has dwindled in numbers across North America mainly due to the rapid and extensive expansion of GMO agriculture (Brower et al., 2006; Pleasants & Oberhauser, 2012).
1.1 The Monarch butterfly donor-NGO-natural system
We divided the Monarch’s DNNS into an ecological domain, representing interactions between the Monarch butterfly and its environment, and a social domain, incorporating NGO-led milkweed provisioning programs and donors’ willingness to support such programs. These two domains interact dynamically via shared variables describing the state of the Monarch population and the success of the conservation program.
1.1.1 Ecological domain
The Monarch butterfly is among the most widely recognized charismatic insects in North America (Batalden & Oberhauser, 2015). Both populations have shrunk considerably over the past two decades, likely as a result of declining common milkweed (Asclepias syriaca) and nectar-flower habitats (Brower et al., 2006; Pleasants & Oberhauser, 2012), although other causes are also possible (Inamine et al., 2016; Davis et al., 2020). Scientists suggest a long-term minimum average of 6 ha for the eastern population’s overwintering colonies (Pollinator Health Task Force, 2015)—in 2021, it was half that (Rendon-Salinas et al., 2021).
Milkweed is the key host plant for Monarch butterflies; females lay eggs on its leaves, and larvae subsequently consume and assimilate the milkweed’s cardenolides, rendering the larvae toxic to most predators (Malcolm & Brower, 1989). Milkweed (alongside other plants) also provides nectar to fuel adult migration (Brower et al., 2006). Milkweed has declined across the Monarch’s breeding range, particularly within the industrialized corn-producing region of the USA encompassing Iowa, Illinois, Indiana, southern Michigan, western Ohio, eastern Nebraska, and southern Minnesota (Pleasants & Oberhauser, 2012). This region is the most important for individuals reaching the overwintering grounds in Mexico (Flockhart et al., 2013) and, thus, where habitat restoration efforts could be most effective (Solis-Sosa et al., 2021). Recent modelling efforts, such as a systems dynamics model that we used to simulate the Monarch’s ecological domain, have enough level of detail to estimate milkweed’s dynamic abundance resulting from changes in temperature, precipitation, and human activity (Solis-Sosa et al., 2021).
1.1.2 Social domain
The Monarch’s DNNS social domain encompasses NGO-led milkweed provisioning programs and donors’ willingness to support such programs. The potential actors within the social domain are numerous due to the Monarch’s extensive range across continental North America, its charismatic appeal to the public, and considerable overlap with human activity. Here, we set the scope of the analysis on the social dynamics among donors and a single hypothetical NGO operating at an international scale solely dedicated to the Monarch’s conservation with a single milkweed restoration program and investing all donations obtained from private citizens in such a program withancillary expenses assumed to be constant across any strategy established since, as it is common practice, they would not be paid from donations, but from more stable sources such as endowment funds (Srnivas, 2021). The assumed restoration program would take advantage of the vast amounts of idle roadside and railroad land across the Midwest, which previously was estimated that covering 2.26% of that land would be enough to restore the Monarchs’ population to its minimum safe size of 6 overwintering hectares (Solis-Sosa et al., 2021).
Donors are either private citizens or foundations willing to donate to NGOs to help finance conservation activities, however, donations from private citizens are, in general, considerably more that from established charities and, as well, considerably less predictable. In our specific case study, the only activity we included was milkweed provisioning across the Monarch’s breeding range. Since donations are voluntary, donors must be convinced that the conservation goals of the NGO align with their interests and that the NGO will efficiently accomplish those goals with their contributions. Of course, funding for conservation is finite, and donors face competing demands and opportunity costs associated with financing one issue over another (Scharks & Masuda, 2016). While donors cannot push an organization to take a particular decision, they can decide not to support specific actions, limiting its activity.
A recent analysis (Solis-Sosa et al., 2019), which we use in this paper, identified that, in general, urban residents across North America are more willing to pay for a given conservation strategy if it is led by an international NGO that distributes its restoration activities across the entire Monarch range and provides donors with a probability of reaching the conservation target, hereafter, program success. Also, donors were more willing to pay for a strategy when the overwintering monarch colonies area was small. Finally, when donors were provided with an expected success of the given strategy, they were more willing to pay if the overwintering colonies’ area was on a downward trend. However, in the absence of information regarding the program’s progress toward its goal, respondents were more willing to support organizations when colonies increased.
NGOs are heterogeneous, independent organizations working at local, national, and international scales, making them crucial to advancing environmental issues. In the case of the Monarch, many organizations are working at various scales, with different mandates and specific objectives and budgeting practices. Core to our approach is the realization that NGOs are not just on the receiving end of donors’ swings; publicly bringing science to light and raising awareness can also influence the donor’s perception of the problem (Jacquet & Pauly, 2007). For example, during 2020, the World Wildlife Fund spent 6.5 million USD in advertising, split approximately equally between public education and fundraising (WWF, 2020). Such considerable investment in advertising is likely to aid in increasing the organizations’ presence and, therefore, fundraising potential (Verissimo et al., 2017). However, some research suggests that advertising can sometimes decrease donation amounts, particularly when the donor does not perceive that their contribution will have any sensible impact (Van Teunenbroek et al., 2020).
1.1.3 Social-ecological interface
We defined the social-ecological interface as social aspects affecting the ecological domain and vice-versa. The aggregation of all these interactions makes the social-ecological interface an intricate bidirectional network on which one domain adapts non-linearly to the other, creating emergent dynamics and outcomes challenging to predict. Still, it is possible to describe such dynamics by systematically following the actors and their interactions. We opted to use a systems dynamics modelling approach to describe the Monarch’s DNNS based on the systems thinking paradigm, particularly useful for modelling complex systems (Meadows, 2008).
Many social-ecological interactions exist within the Monarch’s social-ecological system, and each of them is worth exploring when qualitatively analyzing the system. However, when striving for a manageable quantitative analysis, only a handful of interactions can be realistically included in any simulation. In particular, the Monarch’s DNNS relies on donations (Social) then transformed into milkweed restoration efforts (Social-Ecological), which affects the size of the overwintering colonies every year (Ecological); information that is then conveyed to donors as the progress towards the goal (Ecological-Social). Bringing such complex dynamics into the realm of quantitative simulation is still rare (Filatova et al., 2009; Schlüter et al., 2014), and the remainder of this paper presents an avenue for doing so, using the Monarch butterfly DNNS as a case study.
2 Methods
Our methods are divided into two main sections. First, we describe how our model is constructed, starting with a general overview, and then listing data sources, assumptions, and modelling details for each domain, as well as the considerations taken to form the model’s social-ecological interface. The second section is dedicated to answering our research question in three steps. First, we compare ecological outcomes and realized donations between a model that emulates a conservation strategy that forecasted its target donations assuming a steady influx of donations (open-loop model) against a baseline model that estimates the presumptive realized donations by accounting for donors’ evolving attitudes as a result of the evolving ecological context (closed-loop model). Then, we use the closed-loop model, with presumptively better donation forecasting capabilities, to estimate the optimal amount that an NGO should request of their donors to efficiently attain the Monarch’s conservation target of 6 overwintering hectares. Both previous steps—open vs closed-loop and closed-loop optimization—are repeated with two different behaviour models, representing urban residents across the Monarch’s central migratory flyway that are either informed (GPI) or not (GPU) about the probability of success of the conservation strategy they would be supporting. Finally, to test for the risks of mischaracterizing donor behaviour, we run an optimized closed-loop model where the NGO plans as if donors are to be informed of the progress towards the goal each year (GPI) when in fact they are not, and vice versa.
2.1 Coupled model
The coupled model incorporates choice models obtained from a discrete choice experiment (DCE) from Solis-Sosa et al. (2019) with the MOBU-SDyM system dynamics model from Solis-Sosa et al. (2021) to represent the social and ecological domains of the DNNS, respectively. We used the DCE estimates to calculate the proportion of respondents that would donate a specific amount to a Monarch conservation program, given i) a hypothetical Monarch’s overwintering colonies’ size, ii) a monarch-population trend generated by the MOBU-SDyM, and iii) how successful the program is in reaching an area of 6 overwintering hectares. In turn, the MOBU-SDyM’s output is derived from the amount of habitat restored by the conservation program, funded by the respondents that were willing to support it. The colonies’ area, trend, and program’s success are the three critical variables both domains share, allowing the model’s successful coupling (Figure 2). The following sections describe both domains and the interface both connecting and conforming them to the Monarch’s DNNS.
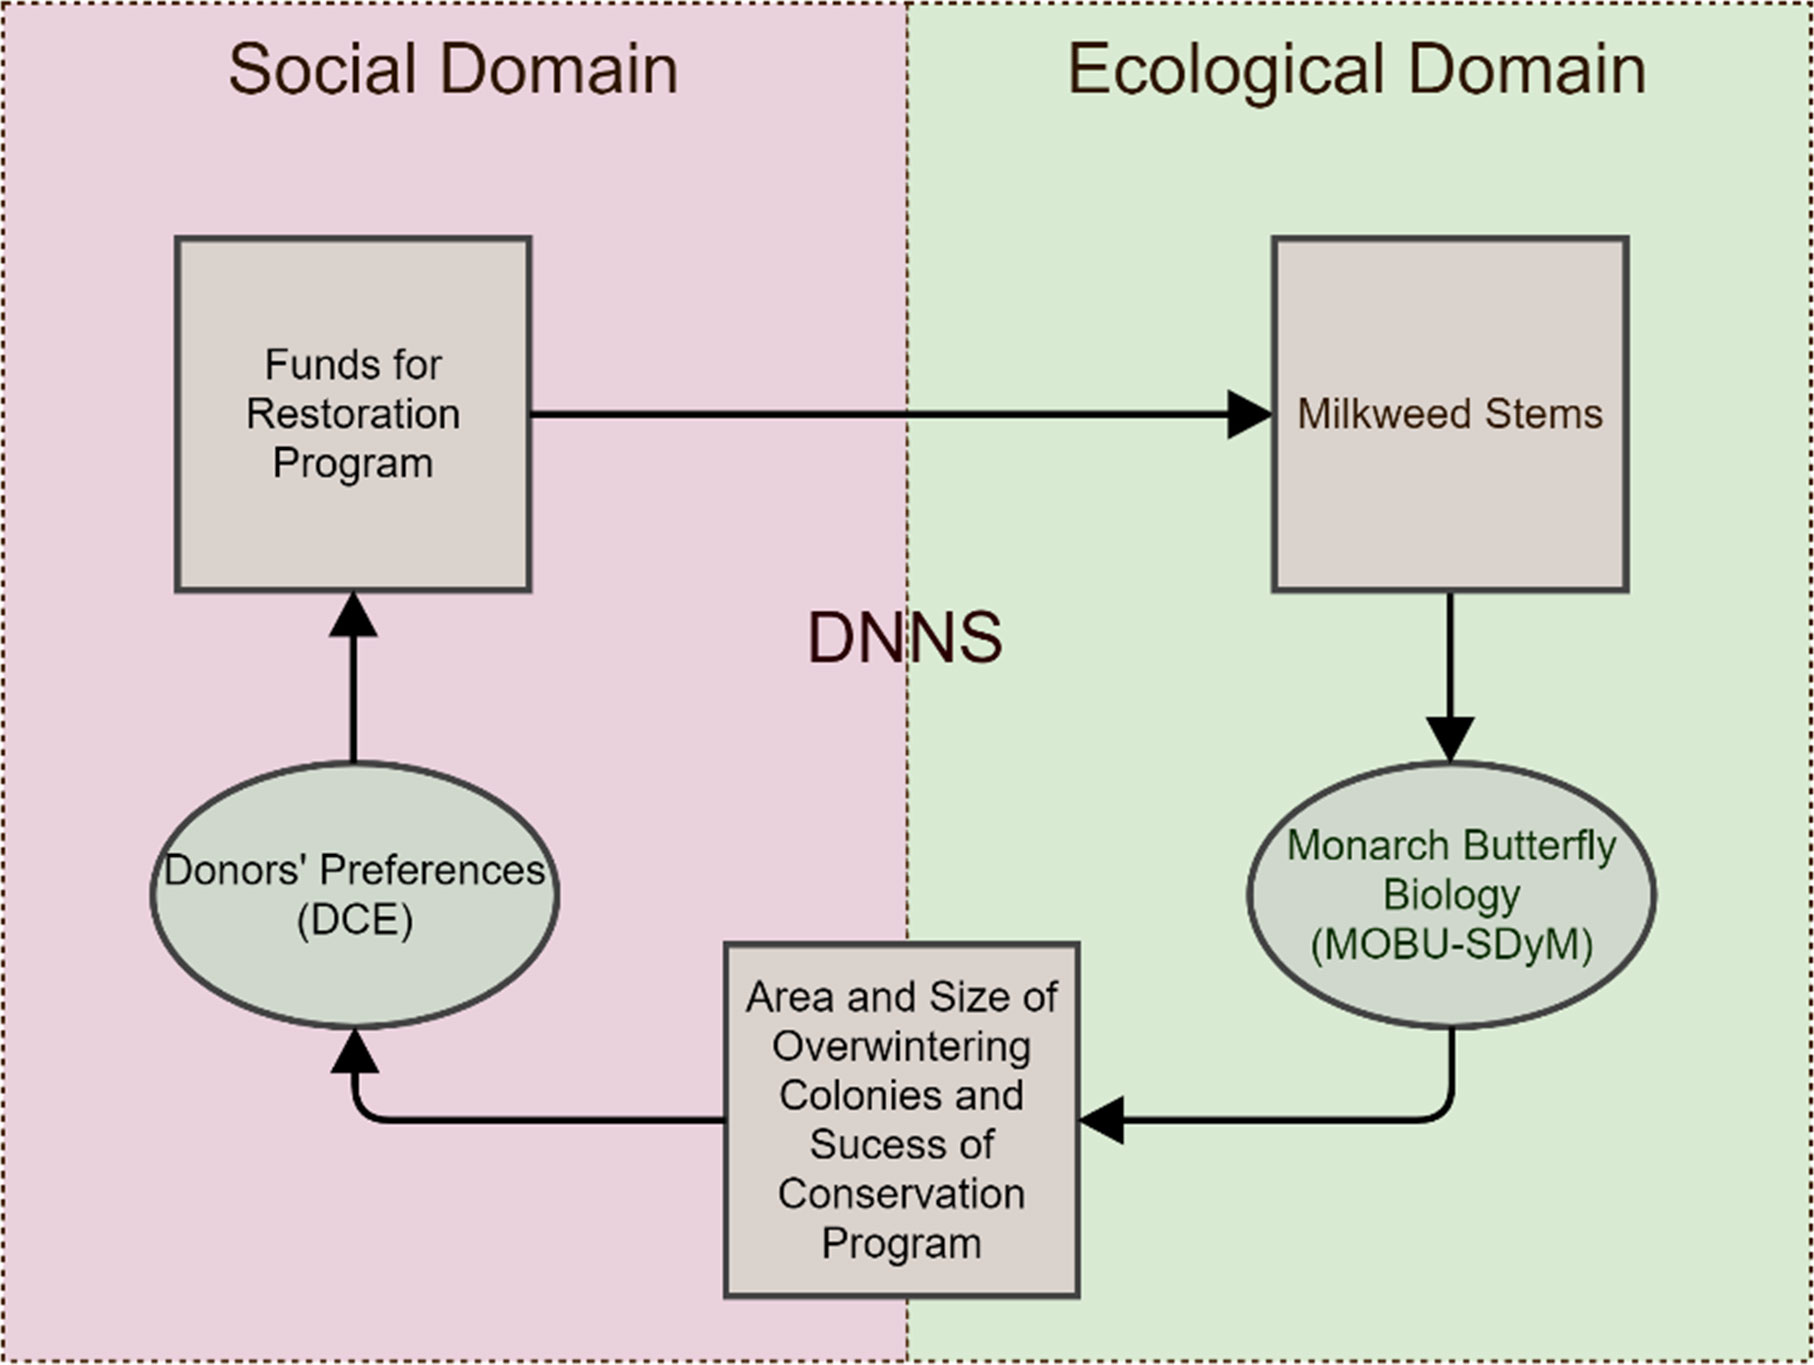
Figure 2 Model Overview. The Donor-NGO-Natural System of the Monarch (DNNS) is a dynamic system that emulates the Monarch’s habitat-dependent population dynamics (Ecological Domain). It assumes that such dynamics will affect the willingness to support a conservation program by potential donors (Social Domain), which, in turn, will affect the reach of the conservation program and success in subsequent iterations.
2.1.1 Ecological domain
The boundaries of the ecological domain is determined by Monarch butterfly interactions with its host plant, milkweed, and climatic drivers such as temperature and precipitation. We represent these dynamics via the Monarch Butterfly Systems Dynamics Model (MOBU-SDyM; Figure 3), incorporating temperature-dependent developmental times, dynamic habitat availability, and weather-related mortality (Solis-Sosa et al., 2021). For this study, milkweed stems used by the MOBU-SDyM are donated by the social domain (described below), driving changes in Monarch population dynamics and, ultimately, the estimated overwintering colonies size, which is the primary measure of conservation performance.
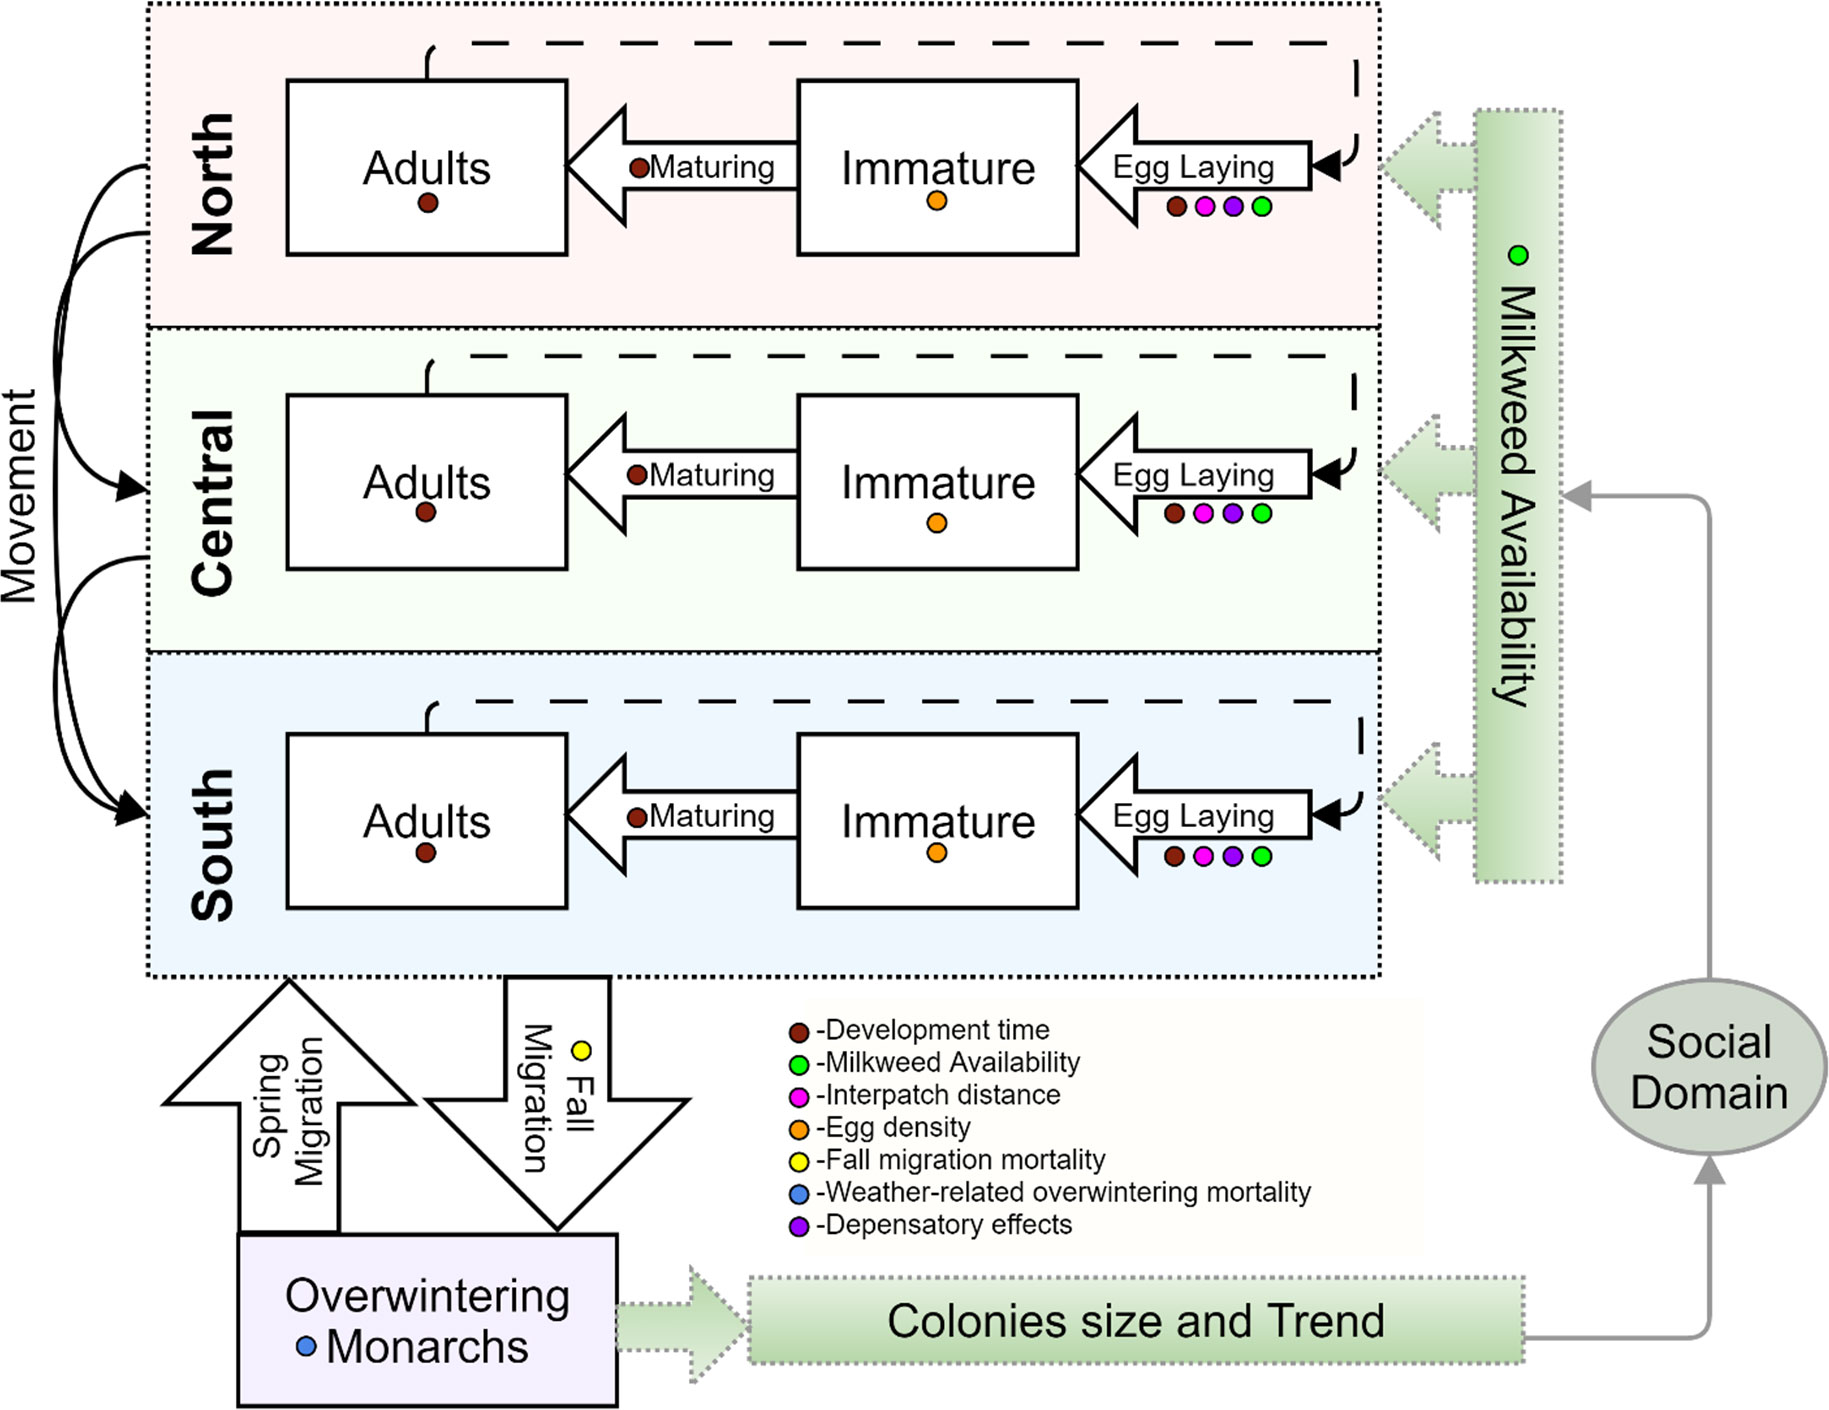
Figure 3 Spatial (vertical dimension) and stage-class (horizontal dimension) structure of the Monarch Butterfly System Dynamics Model (MOBU-SDyM). Simulated Monarchs reproduce and disperse across the three breeding regions during the breeding months and mobilize to a non-breeding overwintering region during the overwintering season. The coloured dots give the key to the system drivers that affect MOBU-SDyM dynamics. In green gradient and gray outline, the lower-right part of the diagram represents where the MOBU-SDyM is coupled with the behaviour models from the social domain. Figure modified from Solis-Sosa et al. (2021).
The MOBU-SDyM was initialized with 0.69 hectares of overwintering colonies, the (lowest-ever) area recorded in 2014. All weather parameters were also parameterized with 2014 starting values. We represented uncertainty in model parameters via the Bayes posterior distribution from Solis-Sosa et al. (2021).
2.1.2 Social domain
We modelled the social domain as the proportion of potential donors supporting a milkweed restoration strategy under a specific conservation context defined by the simulated overwintering colonies’ current overwintering area and trend. We used behaviour models obtained from the discrete choice experiment (DCE) by Solis-Sosa et al. (2019), in which they explored how respondents’ utility changed based on a series of strategic-level attributes of a Monarch’s conservation strategy. The utility is defined as the weight of outcomes in making a decision (Ariely et al., 2003), or the level of short-term happiness derived from a specific material or immaterial good (Kimball & Willis, 2006). DCEs quantify utility by a mean-centred dimensionless value representing the preference associated with a particular value of an attribute compared with the reference level. We used two contrasting behaviour models from that paper with different utility patterns describing urban residents across the Monarch’s central migratory flyway: respondents’ willingness to support a conservation program when they are provided or not information about the expected success of such program (Figure 4). We termed the former, i.e., providing donors information estimated program’s success, as ‘General Public Informed’ (GPI) and, the latter, omitting such information to respondents as ‘General Public Uninformed’ (GPU). From the set of attributes describing those two behaviour models, we used the funds requested from the donor by the organization, the expected success of the conservation strategy, and the current area and trend of the overwintering colonies to couple the models with the MOBU-SDyM. We set the remaining attributes defining the conservation program as follows: the program’s leader was an international NGO, the NGO applied the received funds locally to the donor’s country, and did not allocate any funds for research or community-science activities (Figure 5). The intent of using those two behaviour models was to provide evidence of how program support, size of donation request, and ultimately, resulting size of the overwintering colonies would change under diverse target donor populations. Furthermore, since both models of choice represent the same respondent sample, diverging only on the donors’ provision with the program’s success, we aimed to explore how information to donors can sway their willingness to pay.
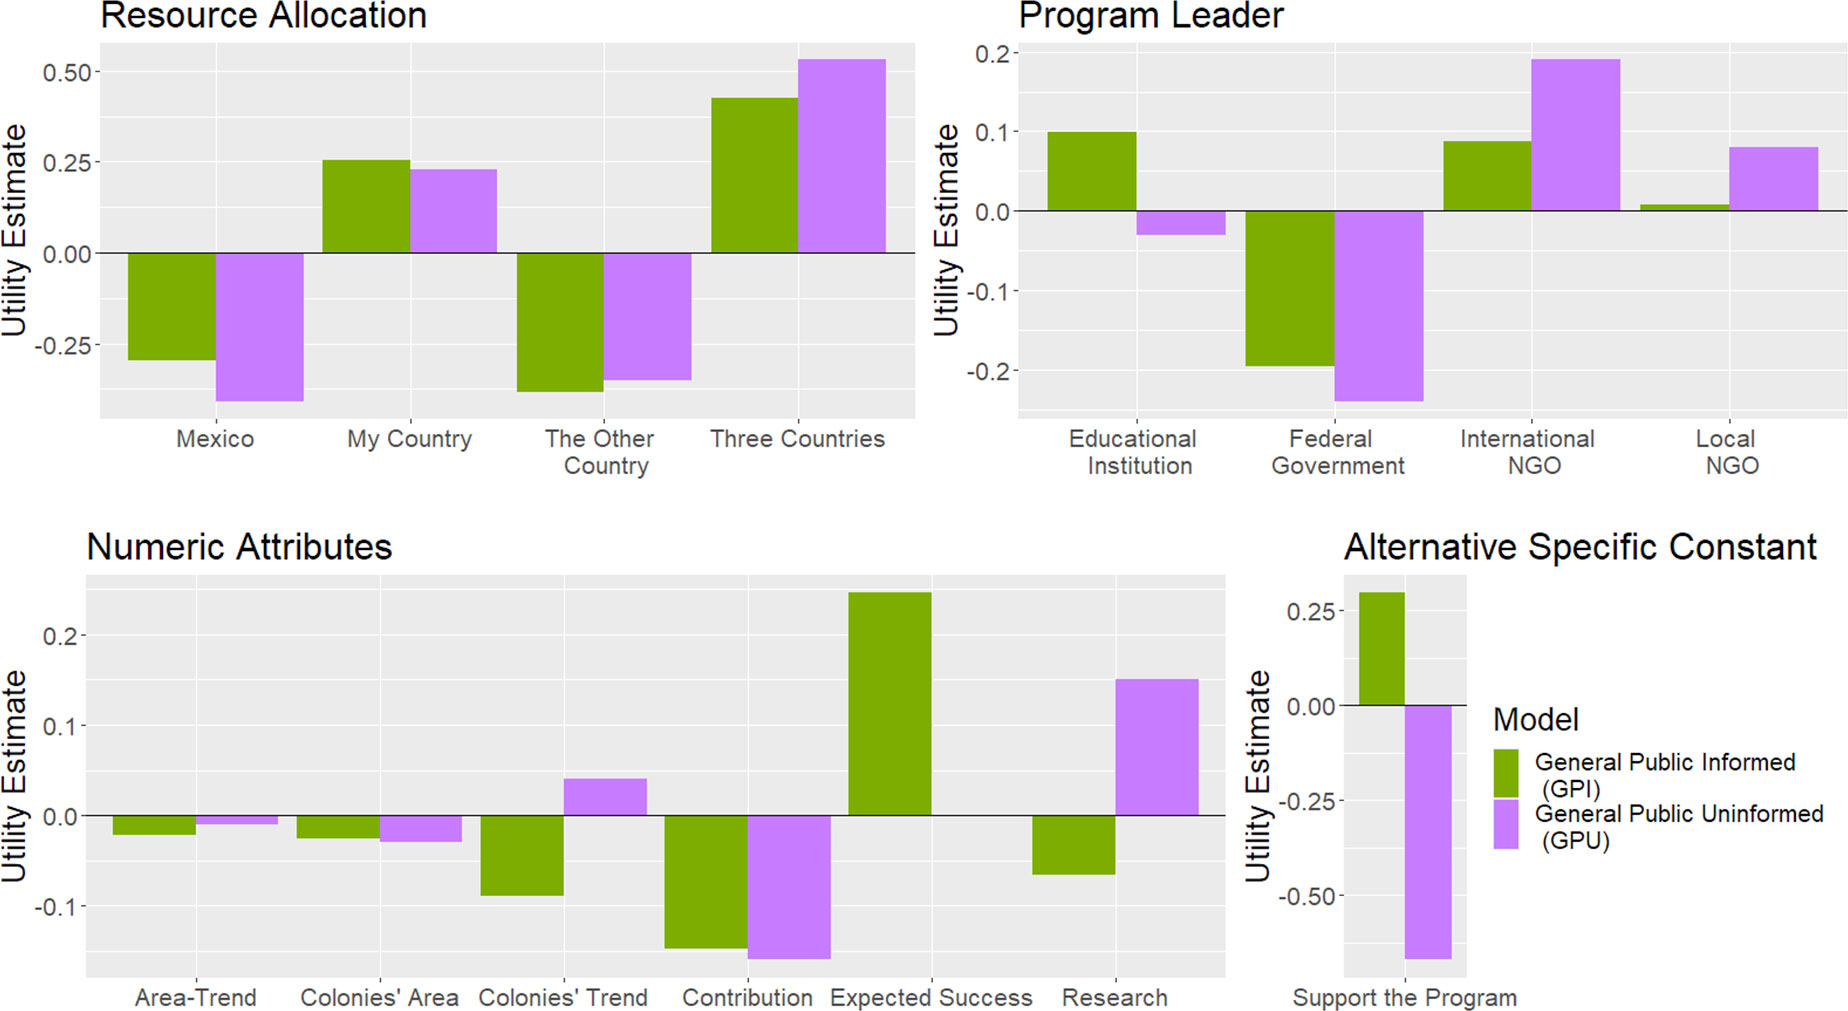
Figure 4 Utility estimates for the behaviour models of urban residents informed (GPI) and uninformed (GPU) about the likely success of a Monarch conservation strategy. The y-axis is a dimensionless representation of the utility derived from a specific level of an attribute. The Alternative Specific Constant (ASC) represents the willingness to support the program regardless of its configuration. Figure modified from (Solis-Sosa et al., 2019).
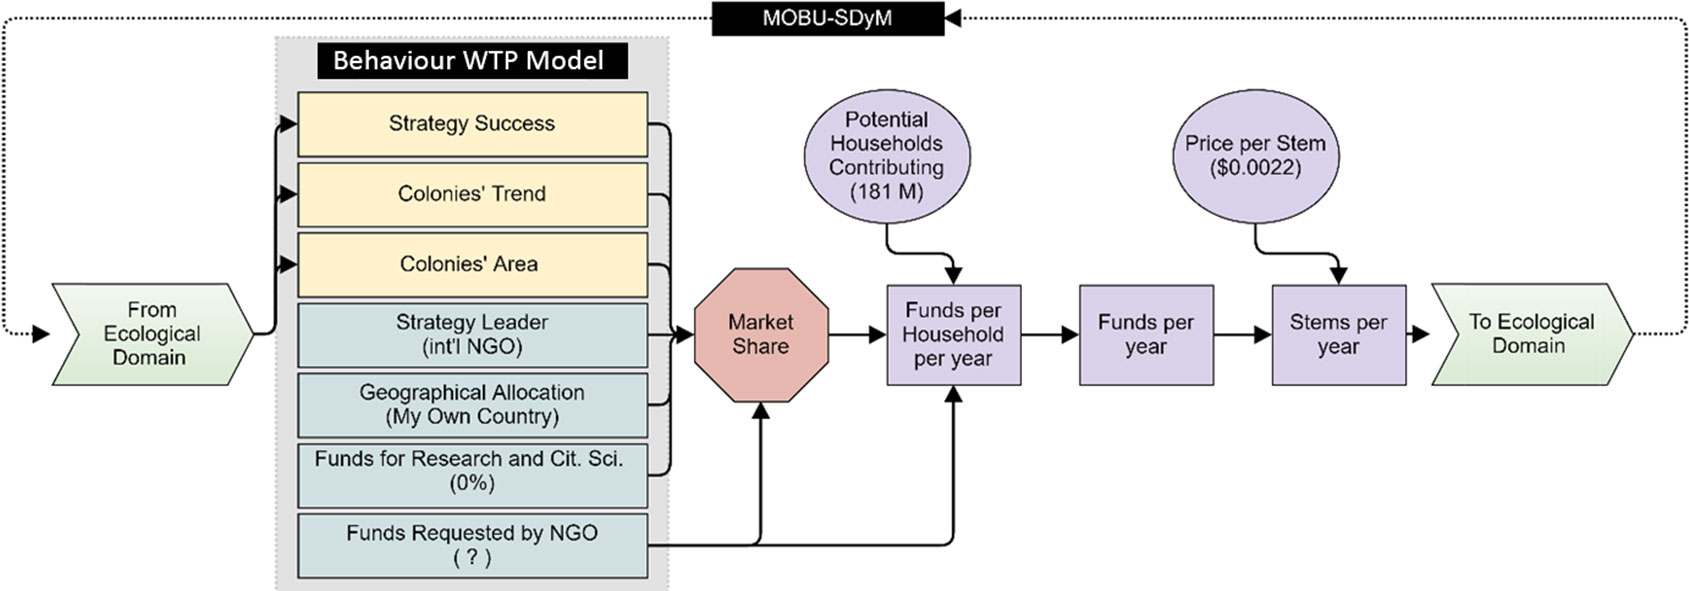
Figure 5 Coupled model overview. Black-filled squares represent the two domain models used, behaviour WTP and population dynamics (MOBU-SDyM) for the social and ecological domains, respectively. Under the behaviour WTP model’s title and within the gray box, rectangles represent the attributes defining the conservation strategy (utility estimate for each of these attributes can be found in Figure 4); yellow rectangles represent the shared variables by the two domains and are directly informed by the MOBUS-SDyM’s output. The red hexagon represents the proportion of potential donors contributing, termed market share (calculated by Eq. 1 – see text) with the input from the choice model configuration. Values in parentheses are the attribute variables used in the simulation. Question mark within the parenthesis of “Funds Requested by NGO” denotes that this variable is optimized (sections 2.2 and 2.3). The purple shapes are auxiliary variables that help convert the NGOs’ funds into stems per year that feedback into the ecological domain. We obtained the number of potential households from www.census.gov and set the price per stem based on www.edf.org.
2.1.3 Social-ecological interphase (model coupling)
Coupling the social and ecological domains involved linking the MOBU-SDyM’s output to the behaviour model attribute values for the colonies’ area, trend, and program success. In turn, the donor’s support for the strategy and their ultimate contribution (converted to milkweed stems) served as input to the MOBU-SDyM. Program success was measured as the ratio between the colonies’ current size and the minimum recommended area of 6 hectares (Semmens et al., 2016).
We first calculated the probability of donors supporting a given conservation scenario i, hereafter market share (Kuhfeld, 2005) as:
Where S indicates all the scenarios compared, x denotes the vector of attributes within the behaviour model, and β represents the vector of utility estimates associated with each attribute (Solis-Sosa et al., 2019).
We then multiplied this probability by the 181 million urban residents, 21 years and older, across western North America, which we considered potential donors (US Census Bureau, 2021), to estimate the number of donors effectively engaged in donating under a particular scenario. Then, we multiplied the number of donors by the contribution asked by the NGO to obtain the total funds raised by the NGO, which were then used to purchase milkweed stems for an estimated $0.0022 per stem (Environmental Defense Fund, 2021); Figure 5).
2.2 Open versus closed-loop models
We sought to portray the differences between forecasted donation proceeds when donor preferences are assumed to be constant over time and when the forecasting accounts for the reality that those donations will change. Our experimental design consisted of two model configurations: (1) open-loop coupling—using only the market share calculated at the beginning of the simulation and (2) closed-loop coupling—updating the market share and resulting available funds every simulation year. Each model configuration was repeated using either of two behaviour models reported by Solis-Sosa et al. (2019), i.e., where donors were kept abreast of progress (GPI) or not (GPU), otherwise using the same attribute values as in the non-coupled choice model (Table 1).
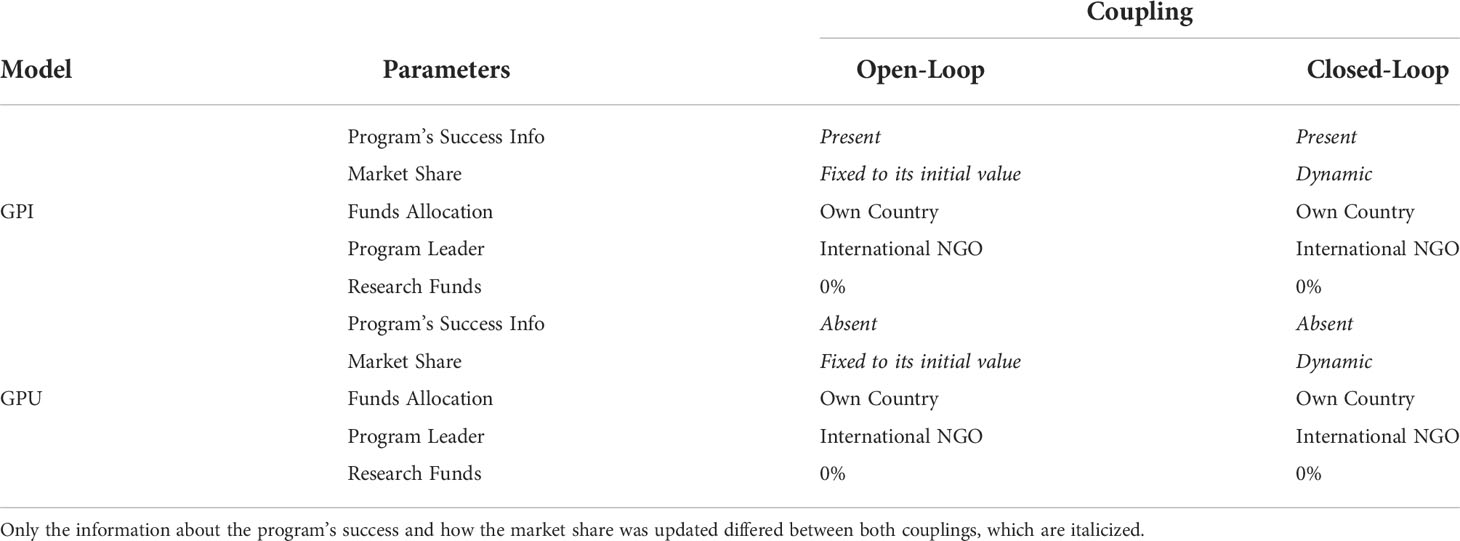
Table 1 Model configurations to compare ecological outcomes of an open-loop versus a closed-loop coupling using two different behavioural models, General Public Informed (GPI) and General Public Uninformed (GPU).
We set the goal of a hypothetical NGO to reach a 6-ha minimum overwintering colony size (Semmens et al., 2016) over a 10-year milkweed-restoration program funded solely by their donor’s contributions while minimizing the donation request. We first assumed that this hypothetical organization would set their target donations for the length of the program by presuming that contributions would remain the same from the first year and, based on that, they would request the same donation amount from their donors every year.
We created an open-loop model simulating such a fixed-donation assumption by only estimating the donor’s market share on the program’s first year and then repeating that market share every year throughout the length of the program. Then, we simulated how the NGO would estimate their target donations by optimizing the donation size requested to reach the conservation target using the open-loop model. We used a Powell optimization algorithm (hill-climbing optimization) to minimize the function in Eq. 2, describing the total (over ten years) contribution (d) that the organization asked from the donors and the residuals between the simulated area of the overwintering colonies (OW) and the recommended 6 hectares minimum safe colonies’ area throughout the ten years of the program. This optimization mimicked a situation in which the organization would try to set their target donations for the program’s lifetime based only on their knowledge about contributions received in the program’s first year. We repeated this process across the posterior sample (n=39,000) provided by the MOBU-SDyM and averaged the optimization results to obtain the optimal donation request.
Next, we wanted to compare how the optimal donation request the NGO estimated using their open-loop model would hold against a more realistic closed-loop scenario in which donors’ attitudes change every year reacting to the changing overwintering colonies’ area and trend. For that, we first modified our model to be closed-loop, in which the market share variable would be updated each year based on the current simulated overwintering colonies’ area and trend. Then, we assigned the optimal donation request value from the previous step to the donation request variable in the model and simulated it, obtaining the realized donations and ecological outcomes. We compared the results between the closed-loop and open-loop models, assuming that any discrepancies that the open-loop model had from the closed-loop were inaccuracies resulting from ignoring the dynamic change of the donors’ willingness to pay for a conservation strategy.
We tested the null hypothesis that there is no difference in donations received, overwintering colonies’ size and overwintering colony size variance throughout the program’s duration between the two model configurations using a Welch’s t-test and a Kolmogorov-Smirnov test to compare posterior and cumulative distributions, and an F-test of variance, respectively.
2.3 Closed-loop forecast
We assumed that our hypothetical NGO wished to switch their budget forecasting method from an open-loop approach to a closed-loop to account for dynamic donor preferences and WTP and, presumably, estimate target donations closer to realized contributions. The organization would need to obtain their donor’s behaviour models through a discrete choice experiment and couple them with a biological population model. Then, instead of getting one optimal donation request value for the duration of the program, they would obtain a new estimate every year, adjusting it according to the current ecological situation and resulting donor’s WTP.
For our closed-loop model, the colonies’ area and trend informing those behaviour models were updated every simulation year, adjusting the market share, and resulting donations funding the milkweed-restoration efforts the following year. Our optimization process for the closed-loop model used a similar optimization objective as in our previous analysis but obtained a vector of optimal donation requests (), one per year instead of a single value (Eq.3). We repeated this process for both behaviour models, GPI, and GPU, and across the posterior sample (n=39,000) provided by the MOBU-SDyM, averaging the optimization results to obtain the optimal donation request vector.
Although eliciting donors’ preferences for every conservation situation would be ideal, creating discrete choice experiments to capture this heterogeneity is a time-consuming and resource-intensive endeavour, and organizations might not be able to undergo that process regularly. However, suppose an organization shares their conservation objectives and target donors with many other organizations. In that case, it could be possible for them to create a basic ‘rule of thumb’ describing how donors may change their behaviour over time, and organizations could aid their decision-making with this collated information. We condensed our closed-loop optimization results with two linear regression models, showing the way colonies’ size and trend, as predictor variables, affected either the optimal donation requests or donor’s WTP as response variables. We generated heatmaps, one per behaviour model, from those regressions as an example of how seemingly abstract concepts for a decision-maker, such as a regression estimate, can be converted into a visual tool that can be readily available for decision-aiding purposes.
2.4 Misrepresentation of donor behaviour
Finally, regardless of using an open-loop, a closed-loop, or any other approach to estimate future donors’ WTP, there is the latent risk for mischaracterizing donors’ behaviour. We tested the sensitivity of not reaching the conservation objective with the donation plan proposed by our closed-loop optimization when using a behaviour model that fails to capture donor behaviour. We used the optimal donation-request vectors obtained for our two behaviour models, GPI, and GPU, on our previous analysis. We used a closed-loop model parameterized with behaviour model and the donations’ vector obtained using its counterpart behaviour model instead of their own. In other words, we used the optimal donation request estimated from GPI for respondents behaving as GPU and vice-versa. To avoid confusion, the abbreviation for these two models will have an asterisk next to them, e.g., GPU* and GPI*. We analyzed the total donations received and overwintering colonies area similarly to our previous step. We made all the graphing and statistical analysis with R 4.1.2 (R Core Team, 2013) and utilized VENSIM DSS V 9.0 (Ventana Systems) as our systems dynamics modelling environment on a Microsoft Windows 10 platform.
3 Results
3.1 Open versus closed-loop models
The open-loop model played the role of the forecasting approach our hypothetical NGO would initially use to budget their target donations and set the value of their donation requests. Through this approach, the NGO would need to ask their donors $4.86 or $8.77, depending on whether they would assume their population as described by either GPI or GPU, respectively. By setting that amount to be requested, the NGO expected to reach a market share (i.e., the proportion of potential donors who were willing to donate) of 76.1% (GPI) and 42.4% (GPU) and fundraise a total of $ 184,077 and $ 185,386 every year, adding up to $1.84 and $1.85 million, respectively, over ten years (Figure 6). The open-loop model also predicted that, through the forecasted donations, the ecological objective of reaching an overwintering colonies’ minimum size of 6 hectares would be achieved and remain relatively stable after the program’s third year; mean=5.98 ha, SD= 1.408 for GPI, and mean=6.04 ha, SD=1.417 for GPU (Figure 7).
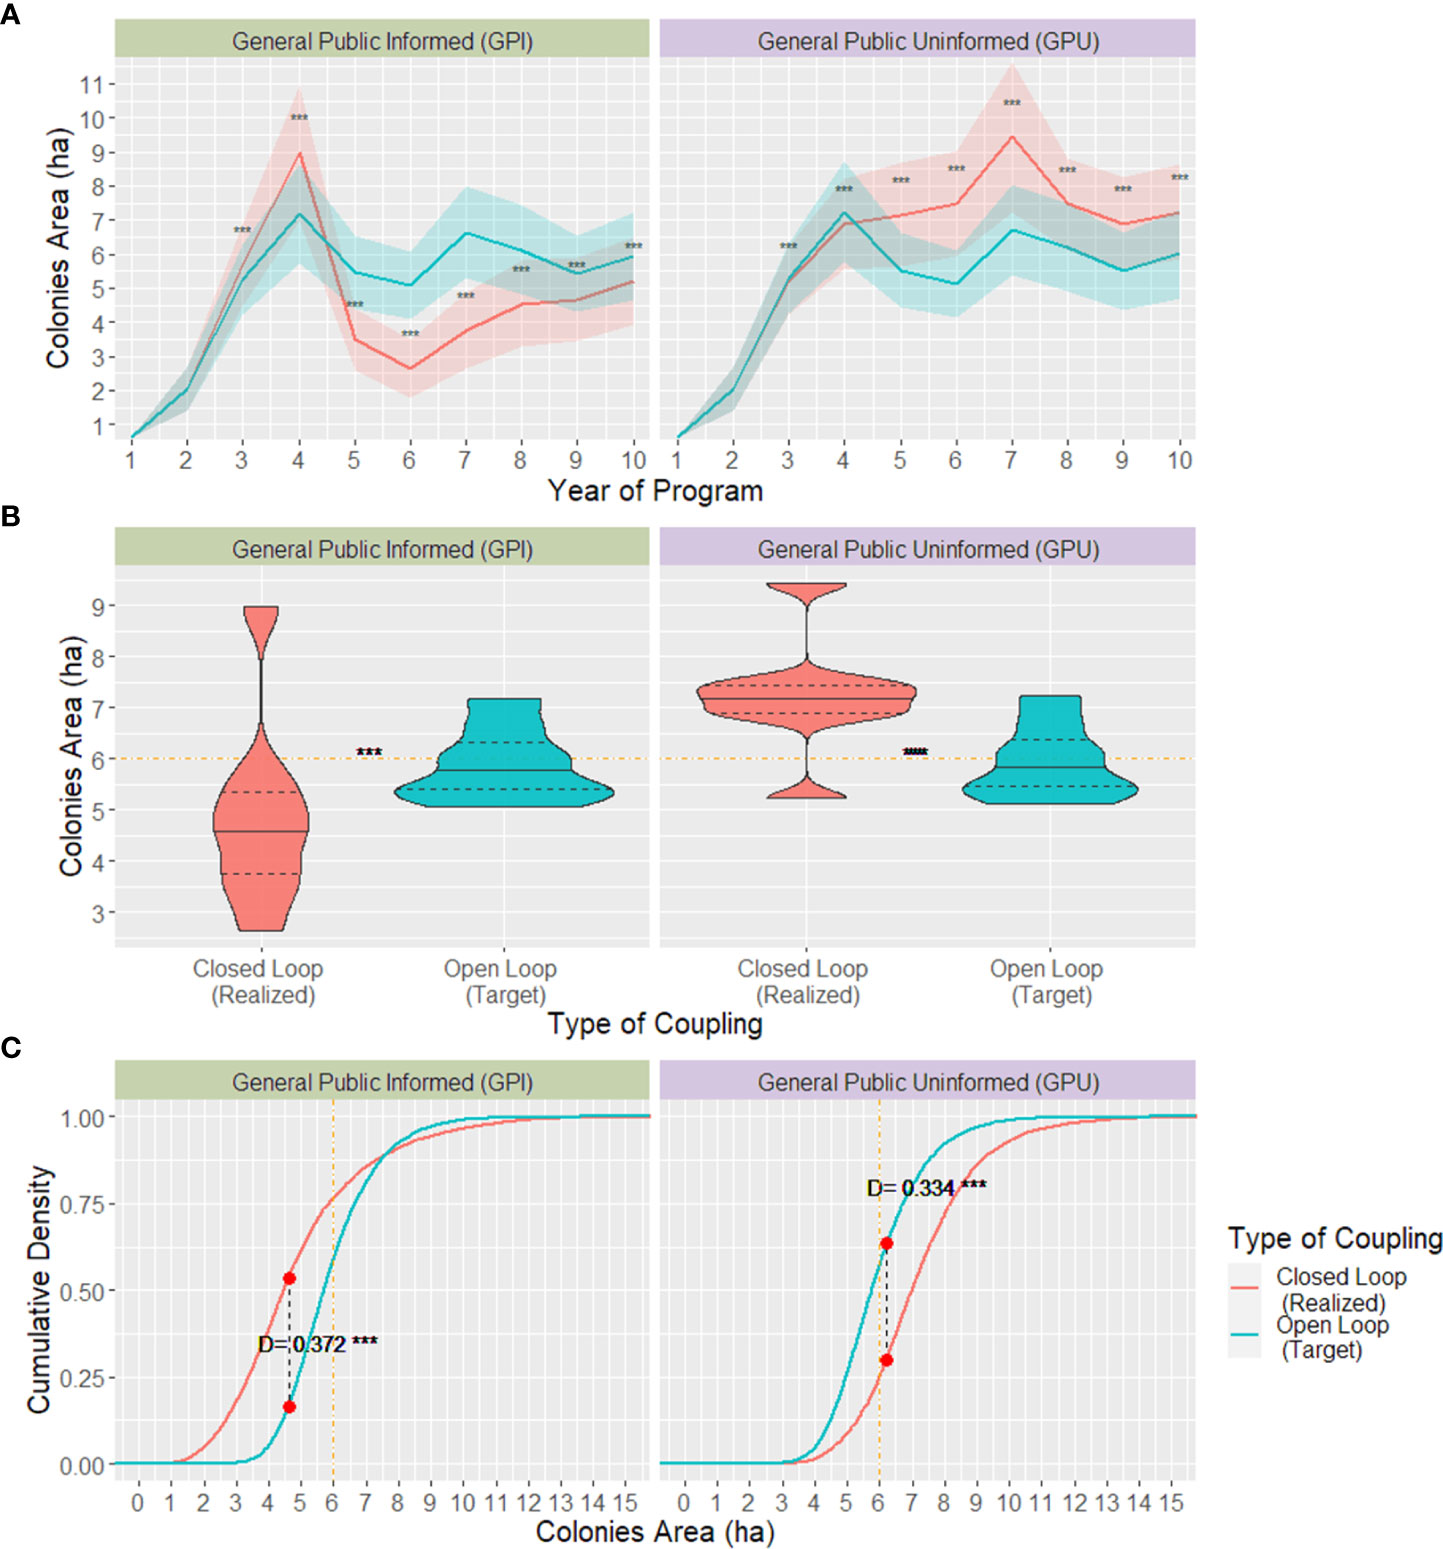
Figure 6 Donations. (A) Time series of target total donations using an open-loop coupling (teal) and realized donations received (salmon), as forecasted by the closed-loop coupling. (B) proportion of potential donors (market share) contributing in a specific year as forecasted by an open-loop coupling (teal) compared to the market share realized participation modelled by the closed-loop coupling(salmon). (C) realized donations’ posterior distribution (salmon) against the realized value (teal). ***1% significance level with two-tailed t-Test.

Figure 7 Overwintering Colonies. (A) Time series of target overwintering colonies’ area using an open-loop coupling (teal) and realized colonies’ area (salmon), as forecasted by the closed-loop coupling. (B) realized overwintering colonies’ posterior distribution (salmon) against the target area (teal); Horizontal dashed line (orange) at 6 hectares represents the minimum recommended area for the overwintering colonies. (C) Cumulative distribution for the realized (salmon) and target (teal) overwintering colonies posterior; Vertical dashed line (orange) at 6 hectares represents the minimum recommended area for the overwintering colonies. A vertical dashed line (black) with red circles represents the maximum distance between both distributions (“D”) as estimated by the Kolmogorov–Smirnov test. ***1% significance level with two-tailed t-Test for panel (A–C) and Kolmogorov–Smirnov test for panel (C).
Alternatively, the closed-loop model, which simulated how the donation requests recommended by the open-loop model would perform on a more realistic scenario where donors’ WTP changed over time, showed the program’s results considerably deviating from its financial and ecological targets. By requesting the open-loop model’s recommended amount from donors, the market share and, consequently, realized total donations received added up to $1.57 million for GPI and $2.06 million for GPU. Since the donor’s realized WTP in the closed-loop model changed according to every year’s new ecological context, the size of donations received every year varied considerably in both behaviour models, although with more drastic changes for the GPI model with a $66,907 interquartile range, whereas that of the GPU model was $28,850. The direction donations changed every year was almost inverted between GPI and GPU models, i.e., on years that realized donations for GPI increased, contributions for GPU decreased and vice-versa (Figure 6).
The simulated overwintering colonies’ size and cumulative density distribution from the closed-loop model significantly differed between the GPI and GPU behaviour models. For the GPI, the colonies’ size steeply increased at the beginning of the program, reaching an average of 9 hectares by the program’s fourth year and soon after collapsing down to a 2.5 ha mean size by year 6; the colonies’ mean size increased approximately one ha per year from that year onwards. Alternatively, when using the GPU behaviour model to describe donor’s behaviour, the colonies’ area was more stable, and, after surpassing the recommended threshold of 6 ha on the fourth year, it remained above that threshold by the rest of the program’s duration, reaching up to an average of 9.5 ha in the program’s 7th year. Same as the variation in donations’ amount every year, colonies’ size across years was considerably larger for the GPI behaviour model than the GPU, with an interquartile range of 2.48 for the former and 1.76 for the latter.
NGOs setting their target donations using an open-loop forecasting approach for the duration of their programs might not reach their conservation objective efficiently. If the realized donations are lower than anticipated, missing its conservation target and, if higher, the program might be excessively costly from the donor’s perspective, undermining the NGO’s credibility for subsequent programs. Based on the two behaviour models we used to describe donors, the open-loop forecast and optimization results used by an NGO deviated from reality, described by the closed-loop model, in two possible ways. On the one hand, if the GPI model better describes their donors, there is the risk of receiving considerably fewer donations than their target after the program’s 4th year, with a mean deficit as large as $94,736 in one year. As a result, the NGO would start off surpassing the conservation target of 6 ha colonies by almost 33% three years into the program and then collapse to sizes as small as 2.5 ha by the program’s sixth year. Alternatively, if the GPU model better describes donor behaviour, the NGO would reach and surpass its financial target for as much as $54,000 on year five and its ecological target by an average of 2.5 hectares for the duration of the program.
3.2 Forecast with closed-loop models
Since our hypothetical NGO did not obtain accurate enough ecological and financial targets utilizing the open-loop model forecast (section above), we used our closed-loop approach, optimizing donation requests via Eq. 3, to improve such forecasts. Through that approach, our hypothetical NGO reached its conservation target of 6 overwintering hectares three years into the program, fundraising approximately $200,000 per annum regardless of the donor’s behaviour (as described by the behaviour model) by adjusting the yearly amount requested in response to the donor’s evolving preferences. The optimal donation request followed a similar pattern through both behaviour models, averaging $4 lower for GPI (Figure 8).

Figure 8 Total donations received (Lines, primary y-axis), as a result of an optimal donation request (Dashed lines, secondary y-axis) every year, as prescribed by the closed-loop model parameterized with either a General Public Informed (Purple) or General Public Uninformed (Green) behaviour model, and the resulting colonies’ size (Bars).
From the closed-loop optimization results, we summarised the relationship between the colonies area and trend, the optimal donation to be requested to donors, and their expected level of participation (Figure 9). Our analysis showed that, regardless of the model, the donation request is lower when the trend was steeply positive, or the colonies’ size was considerably above the 6 hectares threshold. However, that was not the case if both metrics were highly positive or negative at the same time, probably because in both of those cases, there is a minimum risk of the colonies being in a dire situation the following year. The proportion of potential donors willing to contribute, i.e., market share, under the same ecological contexts considerably differed between the two behaviour models. While GPI respondents were more willing to participate when the colonies size was small but recovering, respondents from GPU were the opposite, participating more with high colonies count but decreasing sharply.
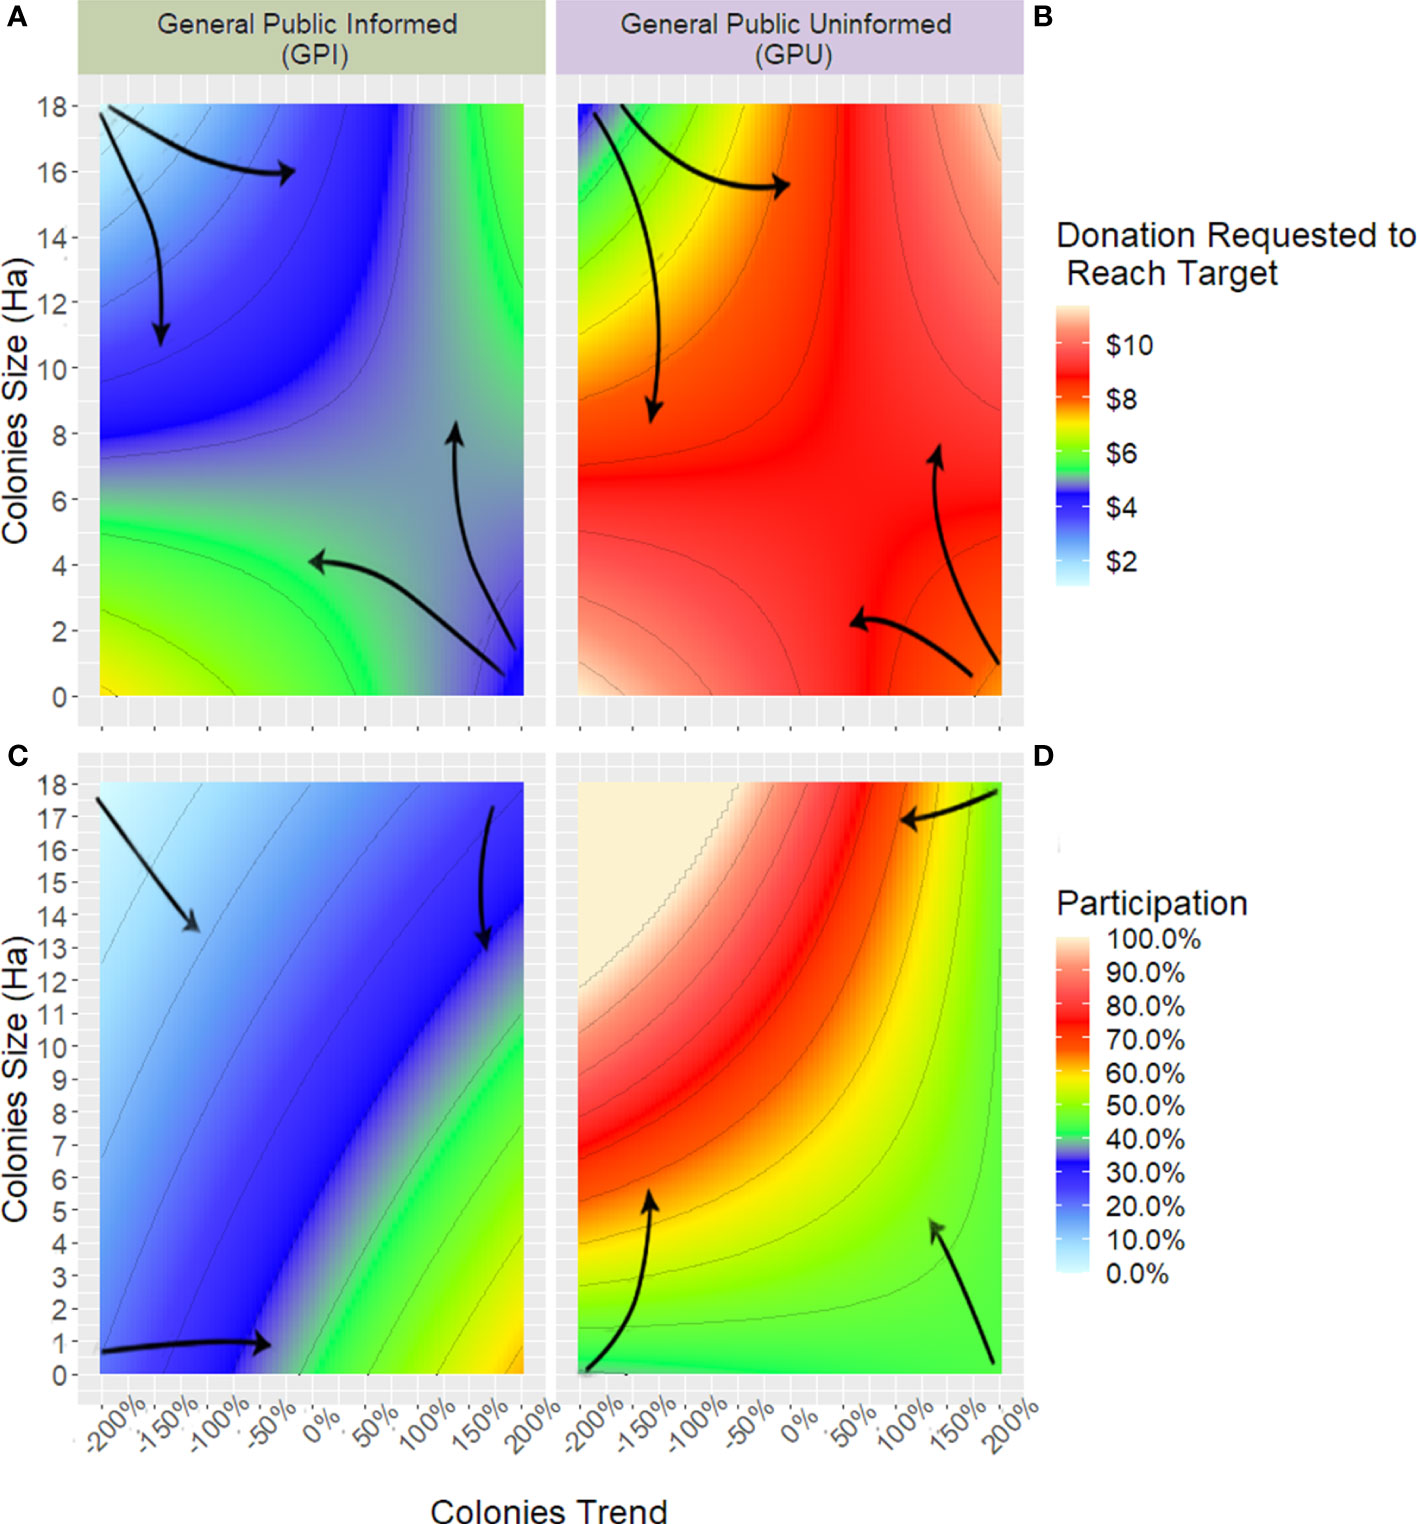
Figure 9 Heatmap of linear regression describing optimal donations request (upper panels) and market share (lower panels) as a relation of the current area of the overwintering colonies and their trend over time for both models used, General Public Informed (left panels) and General Public Uninformed (right panels). Arrows indicate the gradient’s general ascending direction.
3.3 Misrepresentation of donor behaviour
Though our hypothetical NGO has the potential to reach its conservation target by following the results from the closed-loop optimization, a key element to reach that success is to describe the behaviour of potential donors accurately. Deviations from that objective arise if the donation request estimated for one behaviour model is used into a model parameterized by the other behaviour model, akin to the NGO failing to accurately characterize their donors’ behaviour. For the GPU* model, which used the GPI optimized request, the minimum colonies’ size of 6 hectares was never met and remained at or below 3 hectares for the whole program duration. In the case of the GPI* model, parameterized with the GPU optimized request, the conservation objective was rapidly achieved in the third year of the program, and a donation surplus was evident (Figure 10). However, between years 3 and 4 of GPI*, a mix of a 13% downward trend and a vast colonies’ size (17.7 hectares) dropped participation almost to zero, as predicted in the top-left region on Figure 9C.
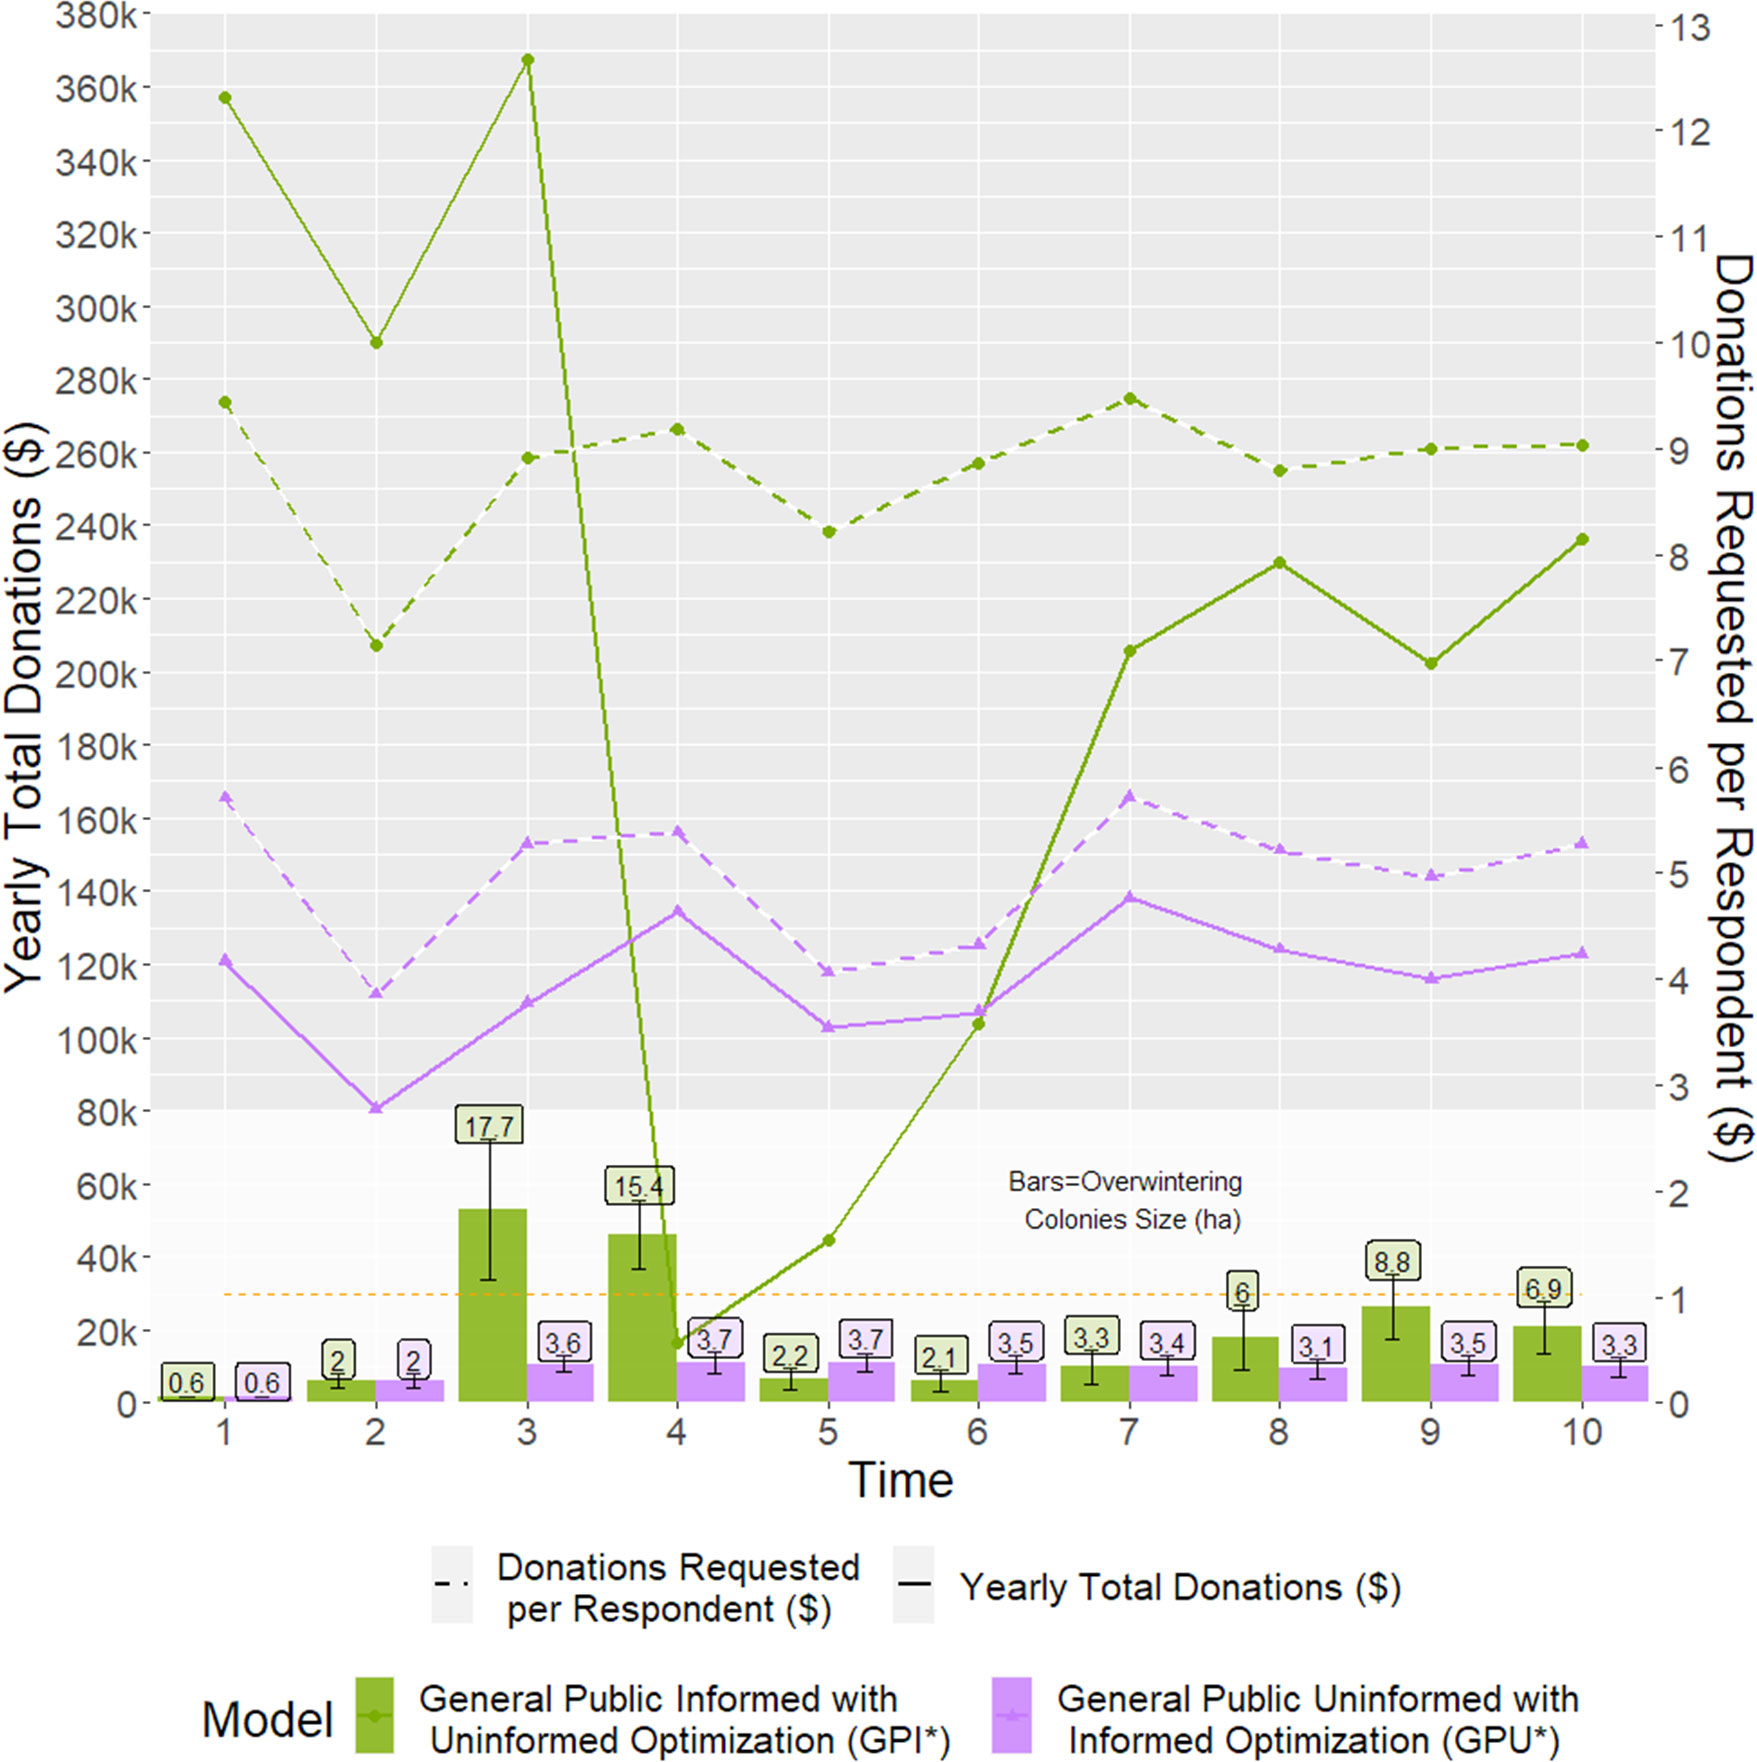
Figure 10 Total donations received (Lines, primary y-axis), using an incorrect optimal donation request dictated by the opposite behaviour model (Dashed lines, secondary y-axis) every year, parameterized with either a General Public Informed* (Purple) or General Public Uninformed* (Green) behaviour model, and the resulting colonies’ size (Bars).
4 Discussion
Our goal in this paper was to test for ecological and financial mismatches between donations forecasted assuming a fixed donor’s WTP and realized contributions, which respond dynamically to donors’ context-dependent attitudes. Given that we would find those mismatches, we aimed to improve the NGO’s target donation’s accuracy by using a DNNS coupled social-ecological model. It is important to stress that, even though the open-loop optimization seems to reach ecological and financial goals faster, easier, and remains more stable than the closed-loop model, the open-loop is an oversimplification of the real-life system, making those seemingly simpler results to be far-fetched from reality. The question arising then is, what are the potential risks an NGO would face if it decided to go through the open-loop route due to its apparent better performance? Would the advantages derived from the more real-life system’s depiction of the closed-loop approach motivate an NGO to use our approach? In addition, we aimed to highlight the potential problems that could arise from misjudging donors’ WTP behaviour when dealing with social-ecological CAS.
We used the MOBU-SDyM (Solis-Sosa et al., 2021) to simulate the ecological domain of the Monarch’s DNNS. As with any model, this model has essential assumptions needed to consider to frame the results it provides appropriately. The authors used a Bayesian inference estimation approach to parameterize some critical features of the model since there was insufficient data. Those parameters belong to one of three groups: 1) Milkweed growth: ideal temperature and humidity for milkweed growth and a moisture estimate scaling factor, 2) Fall migration: Temperature migration threshold and hurricanes estimate, and 3) Overwintering: Monarch density and exposure to open sky while overwintering. The parameter uncertainty associated with each element gets passed on to our analysis, turning our simulation’s output into posterior distributions that need to be interpreted as a probability of occurrence. Management decisions should account for such uncertainty when comparing risks associated with any given strategy (Regan et al., 2005). A thorough analysis of how the MOBU-SDyM was designed, along with its data sources and modelling assumptions, can be found in the source reference (Solis-Sosa et al., 2021).
The scenario that we set for all our simulations was of a simplified theoretical NGO on the mission of finding the best fundraising strategy to support their long-term Monarch conservation program. This hypothetical NGO had a Monarch-only conservation mandate through a single milkweed provisioning program, financed solely by donors’ contributions and investing all donations to on-the-ground activities, and with ancillary expenses assumed to be constant across any strategy. Moreover, the model assumed that this NGO was the only organization with a milkweed-provisioning program in place. In reality, there are hundreds of organizations dedicated to the Monarch conservation at different geographic scales and with different strategies in place competing for the donor’s funds and attention (Shahani et al., 2015). Nevertheless, we did not consider a specific organization or wish to overcomplicate the social domain with all the NGO intricacies within the Monarch’s DNNS since our goal was to demonstrate the downfalls of not accounting for donors’ preference dynamism rather than providing prescriptive measures for specific NGOs. Despite these simplifications, the lessons learned from our research can be a valuable addition to a program’s manager, and if an NGO sets to create a closed-loop model for its own DNNS, this paper provides a roadmap to achieve it. We compared how a donation request optimized to achieve an ecological outcome via an open-loop model reached its financial and ecological goals when applied to a more real-like closed-loop system where donors’ WTP adapts to the ecological situation. We documented considerable discrepancies between the expected, open-loop, and realized, closed-loop outcomes in terms of funds raised and the resulting size of the overwintering colonies; the size and direction of such discrepancies considerably depended on the underlying behaviour model that described the donor’s WTP, but it was consistently present and dependent on the current ecological context. Our results suggest that an organization using an open-loop approach to plan their long-term conservation plans will, most likely, fail to achieve their financial forecasts, which could put in danger the success and sustainability of their program. Each of the behaviour WTP models we used showed a considerably different financial and ecological behaviour over time; on the one hand, financial goals from GPI consistently fell short of the funds needed to achieve their ecological goals. On the other hand, GPU reached considerably higher financial and ecological outcomes than initially planned. Problems derived from the GPI’s model underachievement are straightforward, yet GPU’s overachievement also brings unwanted consequences that need further analysis to uncover. The overachievement from this model comes from the fact that the organization received more considerable sums from donors aiming to reach the conservation goal of 6 overwintering hectares. Nevertheless, even though the conservation goal was met, the price of such success was considerably higher for donors ($2.06M) than the solution obtained through the closed-loop optimization ($1.86M), which might erode the donor’s trust in the organization’s efficiency (Keating & Thrandardottir, 2017).
After demonstrating the downfalls of using an open-loop model to set donation request strategies and estimate the resulting financial and ecological forecasts, we used our closed-loop model to optimize a vector of donation requests throughout the lifetime of the conservation plan. Our closed-loop optimization consistently achieved and maintained the goal of 6 overwintering hectares. Interestingly, the behaviour over time of funds raised and optimal donations request from either of the models was remarkably similar, only scaling down the optimal donation request by approximately 40% for GPI. This result might be derived from the fact that both behaviour models represent the same population when they are either informed or not about the program’s success. As such, a closed-loop optimization can, presumably, extract the best-possible behaviour from that particular target population.
Within the social domain, assumptions were made regarding donor behaviour. The consequences of these assumptions were our third exercise’s objective, where we intentionally used donation requests optimized for one WTP behaviour model into a model parameterized with a different WTP behaviour model. This exercise showed severe consequences from this mischaracterization, either constantly falling short of the ecological target (GPI*) or inconsistently reaching that goal and having massive swings in donations from year to year (GPU*). Results from this exercise showed that optimal donation requests are susceptible to the underlying WTP behaviour model representing actual donor behaviour in terms of how they derive utility from the context under which they decide to donate or not. An organization might be at risk of missing its ecological and financial goals even if considering the dynamic donor’s WTP if it fails properly portray the way such WTP sways under different contexts. Such unexpected swings in public support have happened within the Monarch’s context in the past. For example, after the overwintering colonies discovery by western science (Urquhart & Urquhart, 1976), a ban on primary resource extraction was implemented across the region. However, the expected reduction in forestry and other potentially damaging activities to the overwintering colonies backfired on a complicated econo-politic network of illegal logging with an extraction rate considerably above the national average lasting into the 90s (Merino Pérez & Hernández Apolinar, 2004).
Despite the considerable advantages that a closed-loop approach may provide to an organization’s planning, it is undeniable that the amount of time and resources needed to undergo such a task are considerable, and many organizations might not be in a position of such undertakings. Moreover, even though the Monarch butterfly is one of the most studied insects globally (Oberhauser et al., 2008), the MOBU-SDyM’s development needed to make many modelling assumptions; such assumptions could make a model impractical with many other species considerably less researched than the Monarch. As such, we wanted to provide an example of how findings from a social characterization obtained from a DCE could aid decision-makers when building a full closed-loop model is not possible. Many stated preference papers provide valuable information for decision-makers, including the one we used to parameterize our model (Solis-Sosa et al., 2019). However, to our knowledge, this is the first time where the DCE utility estimates, seemingly cryptic for non-experts on the field, are turned into a visual tool that can help to narrow the gap between science and decision-making (Van Wyk et al., 2008).
Moreover, results obtained for the GPI or GPU behaviour models were considerably different even though they represented the same population. The only difference between the two models was that respondents from the former were told about the program’s expected success, whereas respondents from the latter did not receive such information. These differences are indicative that it is not only necessary to describe the respondent’s behaviour thoroughly but also to ensure that the surveying tool includes all the specific details of the program’s characteristics and context and be aware that the behaviour models generated may not accurately capture any changes to the program after the survey is sent. Recently, a study assessing the social acceptability of forest biomass for energy production showed that the same pool of respondents could significantly sway their WTP based on the amount of information and framing that they receive during the questionnaire application (Pinto et al., 2022) and several previous works had found similar results (Ovaskainen and Kniivilä, 2005; Bimonte et al., 2020; Li et al., 2021).
Notably, by comparing behaviour models obtained from the same population only differing on the amount of information provided, the role that flow of information had on the system was evident. The way the GPI model behaved seemed to follow an oscillating overshoot pattern, in which the system tries to correct itself responding to the new state of the system, as dictated by the ‘success’ attribute, and over and undershoots around the system’s equilibrium point (Jia et al., 2014); a typical trait on systems with considerable system state delays. Even though an oscillating pattern might be stable in the long run by hovering around the equilibrium point, it destabilizes the system’s elements and is undesirable from a social standpoint. Such archetypical behaviour can be ameliorated by reducing the lag time between the moment the system updates its state and when the rest of the system gets informed about it (Meadows, 2008); this action takes on the self-correcting traits from GPI (not seen on GPU), while strongly reducing the undesirable oscillating behaviour. In the case of the Monarch, this would entail not relying solely on the end-of-season colonies’ size report to inform the public about the Monarch’s situation but, instead, giving more weight to results from several Monarch surveying initiatives conducted throughout the breeding grounds (Ries & Oberhauser, 2015).
The relevance of our findings goes beyond the Monarch’s conservation realm; our analysis showed that donors’ behaviour is dynamic and context-dependent, which presumably is true for donors in other conservation situations (AbouAssi, 2013). Moreover, by approaching conservation issues using a social-ecological perspective, the organization’s financial goals might be better and more efficiently achieved than otherwise omitting such social-ecological interdependence, even in situations where the default donor’s attitude might be of an unwillingness to support the organization’s cause. Hence, the method we presented here provides a roadmap that organizations can use to learn about their particular DNNS, find the leverage points, and use them for more efficient and robust strategy design and, ultimately, improve their conservation efforts.
The central role human-decision making has in conservation is not exclusive to the Monarch’s context. A considerable amount of literature has focused on how changing human behaviour can strongly influence the outcome of a conservation program, positing that “Biodiversity conservation is a human endeavour: initiated by humans, designed by humans, and intended to modify human behaviour….” (Mascia et al., 2003, p.650). Donors’ WTP is subject to underlying behavioural traits and ecological context under which the decision-making process occurs (Reddy et al., 2017) and, regardless of how organizations elicit their donors’ behaviour, they must ensure to thoroughly identify subtleties driving such behaviour, how they can change over time, and how the program’s results might be partly driving that change. For example, a contingent valuation study in marine species conservation found that cultural variation between respondent groups and the specific species taxa to be conserved considerably influenced their WTP non-linearly (Ressurreição et al., 2011), validating our findings of how context and donor behaviour influences WTP. We reiterate several authors’ calls to strengthen the inclusion of social sciences during the planning stage of conservation plans, considering it as an integral element dynamically affecting and being affected by the rest of the system instead of including it only as a separate and isolated element of the system (Farmar-Bowers and Lane, 2009; Pieraccini, 2015; Reddy et al., 2017; Roy et al., 2020).
Our novel approach, which dynamically integrates results from a DCE into a rich modelling framework as systems dynamics, opens many analysis possibilities. First, a common practice after creating behaviour models from a DCE is building a decision support tool to aid decision-making. However, these decision support tools tend to be made on spreadsheets making their exploration slow and limited. Here, we included such a decision support tool as a submodel within the systems dynamics modelling environment, which allows the creation of advanced, interactive, and visually appealing dashboards which are very effective for science divulgation and decision-making. Moreover, the flexibility provided by the modelling environment allows extensive sensitivity and scenario analysis that can considerably increase the understanding of the respondent’s behaviour. Finally, systems dynamics is a modelling approach rooted in the systems thinking paradigm (Senge & Forrester, 1980; Forrester, 1989; Meadows, 1999; Meadows, 2008), which provides the researcher with the entire systems thinking toolbox, which allows understanding complex systems and finding leverage points where policy actions may have more substantial and more resilient outcomes. We strongly recommend practitioners draw from our approach to expand research in this regard with their conservation issues of interest which they identify as CAS.
4.1 Creating a dynamic social-ecological model
Finally, accepting the challenge of developing a dynamic social-ecological model is a long-term undertaking that needs thorough logistics; any inefficiency in identifying adequate shared variables (see below) in either of the domains can propagate into consequences that might be discovered too late in the modelling process. Having dealt with some of these challenges in this work, we conclude this artcile by putting forward a retrospective method that researchers pursuing social-ecological modelling can follow to avoid those pitfalls. Notably, identifying the variables that both domains share and ensuring that such variables have sufficient influence is paramount. Here, once conservation objectives and general features of the candidate conservation program have been set, shared variables with the ecological domain need to be identified. Shared variables are simply variables that would appear in both the ecological and the social models if generated independently. In the conservation program case, these variables tend to be directly related to the donors’ perceptions and subsequent actions that affect the ecological outcomes;. Here, we used the colonies trend and area, and program success as shared variables. We suggest a three-stage iterative process to determine the shared variables on a system and achieve a successful model coupling.
The process starts with creating a causal loop diagram, CLD, to explicitly represent the mental model that describes the real social-ecological system; we recommend drawing this CLD iteratively with expert consultation. Using that CLD as a guideline, the next step is to perform a classic systems dynamics conversion of the CLD into a Stock and Flow diagram followed by a thorough sensitivity analysis of the shared variables’ leverage within the ecological context. Suppose the candidate variables exhibit significant leverage effect within the ecological domain. In that case, the next step is to design a DCE (or several) incorporating those variables as attributes and, through pilot testing with a subset of respondents, assess how those levels influence response. Identifying new shared variables and revising the CLD is necessary if the social or ecological sides of the model are not sensitive to the candidates. Alternatively, if the candidate shared variables have meaningful influence in both domains, the DCE are to be released to the full respondent sample to build the choice model. Creating the coupled model begins once all those pieces are in place. This sequence (i.e. CLD → SD → DCE pilot → DCE release → Model Coupling) optimizes resources and ensures a tighter model coupling. In other words, having shared variables with low choice influence would entail redesigning and applying the DCE, even at the pilot-test stage, which is considerably more expensive and time-consuming than modifying an SD population model (Figure 11). Future research will be focused on describing in further detail this methodology.
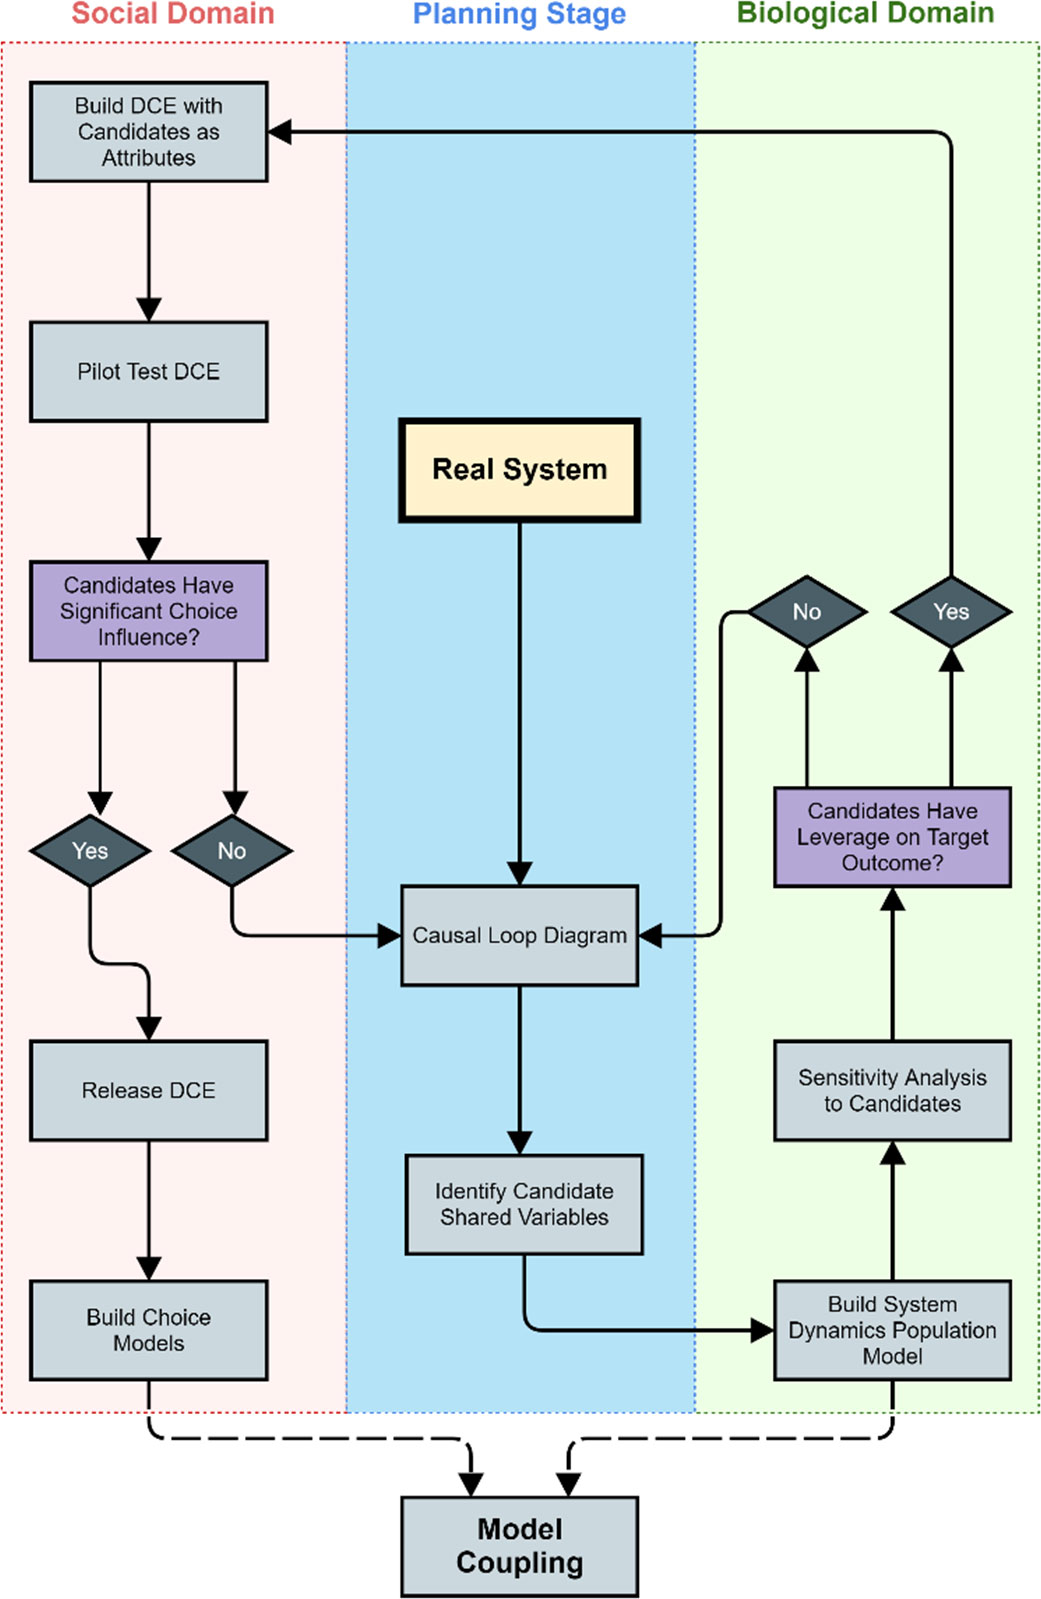
Figure 11 TIterative process to identify shared variables to translate a real system into a dynamic coupled social-ecological system. The process starts from a Real System (center of the figure) and flows counterclockwise. Two checkpoints ensure the shared variables are functioning correctly, one, once the systems dynamics simulation model is ready, and another one after pilot-testing the DCE.
While the analysis undertook in this manuscript was centred on the Monarch butterfly’s eastern migratory population, we also provided arguments as to how the method presented and the lessons obtained can be adapted to other social-ecological CAS, where anthropogenic activity has a strong influence over the fate of wildlife. We initially argued how the anthropogenic activity is creating environmental change at a global scale and how researchers and managers alike need to consider the social-ecological CAS dynamic behaviour when making management recommendations. We believe that the present work supports this position, and, ultimately, we hope we have added another cobblestone to the path leading towards more resilient, sustainable, and inclusive natural resource and environmental management.
Data availability statement
The raw data supporting the conclusions of this article will be made available by the authors, without undue reservation.
Author contributions
RS-S conceived the original idea with contributions from CS. RS-S designed and coded the model with input from CS as SC. RS-S analyzed the model’s data with guidance from SC. RS-S wrote the manuscript and revised it by SC, CS, and ML. All authors contributed to the article and approved the submitted version.
Funding
Open access publication fees covered by The SFU Open Access Fund
Conflict of interest
The authors declare that the research was conducted in the absence of any commercial or financial relationships that could be construed as a potential conflict of interest.
Publisher’s note
All claims expressed in this article are solely those of the authors and do not necessarily represent those of their affiliated organizations, or those of the publisher, the editors and the reviewers. Any product that may be evaluated in this article, or claim that may be made by its manufacturer, is not guaranteed or endorsed by the publisher.
Supplementary material
The Supplementary Material for this article can be found online at: https://www.frontiersin.org/articles/10.3389/fcosc.2022.903132/full#supplementary-material
References
AbouAssi K. (2013). Hands in the pockets of mercurial donors: NGO response to shifting funding priorities. Nonprofit Voluntary Sector Q. 42 (3), 584–602. doi: 10.1177/0899764012439629
Adam E., Kim S., Davis L. (2020). “Food donation data analysis using computational data science,” in IIE Annual Conference. Proceedings. 1–6.
Ariely D., et al. (2003). The psychology of economic decisions. 1st ed. Eds. Brocas I., Carrillo J. D. (Great Clarendon Street, Oxford: Oxford University Press Inc).
Batalden R. V., Oberhauser K. S. (2015). Monarchs in a changing world: biology and conservation of an iconic butterfly. Eds. Oberhauser K. S., Nail K. R., Altizer S. (Ithaca, New York: Cornell University Press), 215–224.
Batie S. S. (2008). Wicked problems and applied economics. Am. J. Agric. Econom 90 (5), 1176–1191. doi: 10.1111/j.1467-8276.2008.01202.x
Bimonte S., Bosco L., Stabile A. (2020). Nudging pro-environmental behavior: evidence from a web experiment on priming and WTP. J. Environ. Plann. Manage. 63 (4), 651–668. doi: 10.1080/09640568.2019.1603364
Boli J., Thomas G. M. (1997). World culture in the world polity: A century of international non-governmental organization. Am. Sociol Rev. 62 (2), 171–190. doi: 10.2307/2657298
Boston J., Berman E. (2017). Governing for the future: Designing democratic institutions for a better tomorrow (Bingley, UK: Emerald Bingley).
Britto M., Oliver R. M. (1986). Forecasting donors and donations. J. Forecasting 5 (1), 39–55. doi: 10.1002/for.3980050105
Brower L. P., Fink L. S., Walford P. (2006). Fueling the fall migration of the monarch butterfly. Integr. Comp. Biol. 46 (6), 1123–1142. doi: 10.1093/icb/icl029
Davis A. K., Smith F. M., Ballew A. M. (2020). A poor substitute for the real thing: captive-reared monarch butterflies are weaker, paler and have less elongated wings than wild migrants. Biol. Lett. 16 (4), 20190922. doi: 10.1098/rsbl.2019.0922
Ebrahim A. (2005). NGOs and organizational change: Discourse, reporting, and learning (Ithaca, New York: Cambridge University Press).
Environmental Defense Fund (2021) Here’s what you can do to help monarch butterflies. Available at: https://www.edf.org/ (Accessed September 8, 2021).
Farmar-Bowers Q., Lane R. (2009). Understanding farmers’ strategic decision-making processes and the implications for biodiversity conservation policy. J. Environ. Manage. 90 (2), 1135–1144. doi: 10.1016/j.jenvman.2008.05.002
Filatova T., Parker D., van der Veen A. (2009). Agent-based urban land markets: agent’s pricing behavior, land prices and urban land use change. J. Artif. Societies Soc. Simulation 12 (1), 3.
Flockhart D. T., Wassenaar L. I., Martin T. G., Hobson K. A., Wunder M. B., Norris D.R.. (2013). Tracking multi-generational colonization of the breeding grounds by monarch butterflies in eastern north America. Proc. R. Soc. B: Biol. Sci. 280 (1768). doi: 10.1098/rspb.2013.1087
Forrester J. W. (1989). “The beginning of system dynamics,” in System dynamics society. Ed. Forrester J. W. (Seattle, Washington: McKinsey & Company)
Howard D. J., Laird F. N. (2013). The new normal in funding university science. Issues Sci. Technol. 30 (1), 71–76.
Igoe J., Brockington D. (2007). Neoliberal conservation: a brief introduction. Conserv. Soc. 5 (4), 432–449.
Inamine H., Ellner S. P., Springer J. P., Agrawal A. A. (2016). Linking the continental migratory cycle of the monarch butterfly to understand its population decline. Oikos 125 (8), 1081–1091. doi: 10.1111/oik.03196
Jacquet J. L., Pauly D. (2007). The rise of seafood awareness campaigns in an era of collapsing fisheries. Mar. Policy 31 (3), 308–313. doi: 10.1016/j.marpol.2006.09.003
Jia C., Qian M., Jiang D. (2014). Overshoot in biological systems modelled by Markov chains: a non‐equilibrium dynamic phenomenon. IET Systems Biology 8 (4), 138–45.
Keating V. C., Thrandardottir E. (2017). NGOs, trust, and the accountability agenda. Br. J. Politics Int. Relations 19 (1), 134–151. doi: 10.1177/1369148116682655
Kimball M., Willis R. (2006). Utility and happiness (Ann Arbor, Michigan: University of Michigan), pp.1–pp67.
Kuhfeld W. F. (2005). “Marketing research methods in SAS,” in Experimental design, choice, conjoint, and graphical techniques (Cary, NC: SAS-Institute TS-722).
Kyei K., Esterline A., Mason J. (2020). “Predicting farms’ donations to food banks using the analytic hierarchical process and dempster Shafer theory,” in 2020 SoutheastCon. 1–8.
Li T., Fooks J. R., Messer K. D., Ferraro P. J. (2021). A field experiment to estimate the effects of anchoring and framing on residents’ willingness to purchase water runoff management technologies. Resource Energy Econom 63, 101107. doi: 10.1016/j.reseneeco.2019.07.001
Loomis J. B., Larson D. M. (1994). Total economic values of increasing gray whale populations: results from a contingent valuation survey of visitors and households. Mar. Resource Econom 9 (3), 275–286. doi: 10.1086/mre.9.3.42629085
Malcolm S. B., Brower L. P. (1989). Evolutionary and ecological implications of cardenolide sequestration in the monarch butterfly. Experientia 45 (3), 284–295. doi: 10.1007/BF01951814
Mascia M. B., Brosius J. P., Dobson T. A., Forbes B. C., Horowitz L., McKean M. A., et al. (2003). Conservation and the social sciences. Conserv. Biol. 17 (3), pp.649–pp.650. doi: 10.1046/j.1523-1739.2003.01738.x
Meadows D. H. (1999). Leverage points: Places to intervene in a system. (Hartland, Vermont: The Sustainability Institute)
Meadows D. H. (2008). Thinking in systems: A primer (White Rive Junction, Vermont: chelsea green publishing).
Meagher M. M. (1973). The bison of yellowstone national park (Washington, DC: US Government Printing Office).
Merino Pérez L., Hernández Apolinar M. (2004). Destrucción de instituciones comunitarias y deterioro de los bosques en la reserva de la biosfera mariposa monarca, michoacán, méxico. Rev. Mexicana Sociol 66 (2), 261–309. doi: 10.2307/3541458
Nuamah I. A., Davis L., Jiang S., Lane N. (2015). “Predicting donations using a forecasting-simulation model,” in 2015 Winter Simulation Conference (WSC). 1880–1891.
Oberhauser K., Cotter D., Davis D., Decarie R., Behnumea A. E., Galino-Leal C., et al. (2008). North American monarch conservation plan (Montrel, Canada: Commission for Environmental Cooperation).
Ovaskainen V., Kniivilä M. (2005). Consumer versus citizen preferences in contingent valuation: evidence on the role of question framing. Aust. J. Agric. Resource Econom 49 (4), 379–394. doi: 10.1111/j.1467-8489.2005.00309.x
Parks T. (2008). The rise and fall of donor funding for advocacy NGOs: understanding the impact. Dev. Pract. 18 (2), 213–222. doi: 10.1080/09614520801899036
Pieraccini M. (2015). Rethinking participation in environmental decision-making: epistemologies of marine conservation in south-East England. J. Environ. Law 27 (1), 45–67. doi: 10.1093/jel/equ035
Pinto R., Brouwer R., Patrício J., Abreu P., Marta-Pedroso C., Baeta A., et al. (2016). Valuing the non-market benefits of estuarine ecosystem services in a river basin context: Testing sensitivity to scope and scale. Estuarine Coast. Shelf Sci. 169, 95–105. doi: 10.1016/j.ecss.2015.11.028
Pinto L. C., Sousa S., Valente M. (2022). Forest bioenergy as a land and wildfire management tool: Economic valuation under different informational contexts. Energy Policy 161, 112765. doi: 10.1016/j.enpol.2021.112765
Pleasants J., Oberhauser K. (2012). Milkweed loss in agricultural fields because of herbicide use: effect on the monarch butterfly population. Insect Conserv. Diversity 6 (2), 135–144. doi: 10.1111/j.1752-4598.2012.00196.x
Pollinator Health Task Force (2015). National strategy to promote the health of honey bees and other pollinators (Washington: The White House).
Raustiala K. (1997). States, NGOs, and international environmental institutions. Int. Stud. Q. 41 (4), 719–740. doi: 10.1111/1468-2478.00064
R Core Team (2013) R: A language and environment for statistical computing. Available at: https://www.R-project.org/.
Reddy S. M., Montambault J., Masuda Y. J., Keenan E., Butler W., Fisher J. R., et al. (2017). Advancing conservation by understanding and influencing human behavior. Conserv. Lett. 10 (2), 248–256. doi: 10.1111/conl.12252
Regan H. M., Ben-Haim Y., Langford B., Wilson W. G., Lundberg P., Andelman S. J., et al. (2005). Robust decision-making under severe uncertainty for conservation management. Ecol. Appl. 15 (4), 1471–1477. doi: 10.1890/03-5419
Rendon-Salinas E., Gibbons J., Kaiser M., Dentinho T. P., Zarzycki T., Bentley C, et al. (2021). Superficie forestal ocupada por las colonias de mariposas monarca en Mexico durante la hibernacion de 2020-2021.
Ressurreição A., et al. (2011). Different cultures, different values: The role of cultural variation in public’s WTP for marine species conservation. Biol. Conserv. 145 (1), 148–159. doi: 10.1016/j.biocon.2011.10.026
Ries L., Oberhauser K. (2015). A citizen army for science: quantifying the contributions of citizen scientists to our understanding of monarch butterfly biology. BioScience 65 (4), 419–430. doi: 10.1093/biosci/biv011
Roy H. E., Peyton J. M., Booy O. (2020). Guiding principles for utilizing social influence within expert-elicitation to inform conservation decision-making. Global Change Biol. 26 (6), 3181–3184. doi: 10.1111/gcb.15062
Scharks T., Masuda Y. J. (2016). Don’t discount economic valuation for conservation. Conserv. Lett. 9 (1), 3–4. doi: 10.1111/conl.12234
Schlüter M., Hinkel J., Bots P. W., Arlinghaus R. (2014). Application of the SES framework for model-based analysis of the dynamics of social-ecological systems. Ecol. Soc. 19 (1), 36.
Semmens B. X., Semmens D. J., Thogmartin W. E., Wiederholt R., López-Hoffman L., Diffendorfer J. E, et al. (2016). Quasi-extinction risk and population targets for the Eastern, migratory population of monarch butterflies (Danaus plexippus). Sci. Rep. 6, 23265. doi: 10.1038/srep23265
Senge P. M., Forrester J. W. (1980). Tests for building confidence in system dynamics models. System Dynamics TIMS Stud. Manage. Sci. 14, 209–228.
Shahani P. C., Oberhauser K. S., Nail K. R., Altizer S. (2015). Monarchs in a changing world: Biology and conservation of an iconic butterfly (Ithaca, New York: Cornell University Press), 31–41.
Solis-Sosa R., Semeniuk C. A., Fernandez-Lozada S., Dabrowska K., Cox S., Haider W. (2019). Monarch butterfly conservation through the social lens: Eliciting public preferences for management strategies across transboundary nations. Front. Ecol. Evol. 7, 316. doi: 10.3389/fevo.2019.00316
Solis-Sosa R., Mooers A. Ø., Larrivée M., Cox S., Semeniuk C. A. (2021). A landscape-level assessment of restoration resource allocation for the Eastern monarch butterfly. Front. Environ. Sci. 9, 147. doi: 10.3389/fenvs.2021.634096
Srnivas H. (2021) The NGO funding mix: a continuum of sources. Available at: https://www.gdrc.org/ngo/funding/funding-mix.html (Accessed 13 June 2022).
Tidball K. G., Krasny M. E. (2010). Urban environmental education from a social-ecological perspective: Conceptual framework for civic ecology education. Cities Environ. (CATE) 3 (1), 11. doi: 10.15365/cate.31112010
Urquhart F., Urquhart N. (1976). The overwintering site of the eastern population of the monarch butterfly (Danaus p. plexippus; danaidae) in southern Mexico. J. Lepidopterists’ Soc. 30 (3), 153–158.
US Census Bureau (2021) US Census bureau. Available at: https://www.census.gov/ (Accessed May 30, 2021).
Van Teunenbroek C., Bekkers R., Beersma B. (2020). Look to others before you leap: A systematic literature review of social information effects on donation amounts. Nonprofit Voluntary Sector Q. 49 (1), 53–73. doi: 10.1177/0899764019869537
Van Wyk E., Roux D. J., Drackner M., McCool S. F. (2008). The impact of scientific information on ecosystem management: making sense of the contextual gap between information providers and decision makers. Environ. Manage. 41 (5), 779–791. doi: 10.1007/s00267-008-9084-8
Verissimo D., Vaughan G., Ridout M., Waterman C., MacMillan D., Smith R. J. (2017). Increased conservation marketing effort has major fundraising benefits for even the least popular species. Biol. Conserv. 211, 95–101. doi: 10.1016/j.biocon.2017.04.018
Keywords: systems dynamics, monarch butterfly, socio-ecological systems, milkweed, modelling, habitat restoration, discrete choice experiments
Citation: Solis-Sosa R, Semeniuk CAD, Larrivée M and Cox S (2022) Investing in monarch conservation: understanding private funding dynamics. Front. Conserv. Sci. 3:903132. doi: 10.3389/fcosc.2022.903132
Received: 23 March 2022; Accepted: 04 July 2022;
Published: 26 July 2022.
Edited by:
Darragh Hare, University of Oxford, United KingdomReviewed by:
Shylock Muyengwa, Center for Impact Evaluation and Research Design, ZimbabweCatherine Semcer, Property and Environment Research Center Montana, United States
Copyright © 2022 Solis-Sosa, Semeniuk, Larrivée and Cox. This is an open-access article distributed under the terms of the Creative Commons Attribution License (CC BY). The use, distribution or reproduction in other forums is permitted, provided the original author(s) and the copyright owner(s) are credited and that the original publication in this journal is cited, in accordance with accepted academic practice. No use, distribution or reproduction is permitted which does not comply with these terms.
*Correspondence: Rodrigo Solis-Sosa, U29saXMtU29zYXJzb2xpc0BzZnUuY2E=