- 1Museo Argentino de Ciencias Naturales Bernardino Rivadavia (MACN-CONICET), Ciudad Autónoma de Buenos Aires (CABA), Buenos Aires, Argentina
- 2Society for the Preservation of Endangered Carnivores and Their International Study (S.P.E.C.I.E.S.), Ventura, CA, United States
- 3Centro de Investigación Esquel de Montaña y Estepa Patagónica (CIEMEP), Consejo Nacional de Investigaciones Científicas y Técnicas-Universidad Nacional de la Patagonia San Juan Bosco (CONICET-UNPSJB), Laboratorio de Investigaciones en Evolución y Biodiversidad (LIEB), Facultad de Ciencias Naturales y Ciencias de la Salud, Esquel, Argentina
The concentration of people living in small areas has increased in the last decade, with more than half of the world's population living in cities. This is particularly true for Latin America, a region with no particular high contribution to the world total population, but hosts several large cities. The increase in urbanization causes several threats to wildlife that face the loss of their habitat and novel environmental pressures. As the number of wildlife entering cities seems to have increased in the last year, we characterize the temporal and geographical events of a widely distributed carnivore, the puma, Puma concolor. We performed an exhaustive search for media news regarding the sighting, capture, and/or killing of pumas within human settlement areas, and tried to relate them with potential explanatory variables. We found a total of 162 events in Latin America in a period of the last 10 years, particularly concentrated in the year 2020. Most records came from Brazil, followed by Argentina, Chile, and Mexico. Of the total, 41% were only sightings, 58% were captures, and a minor percentage were considered as mascotism. Almost the same number of records came from highly populated areas (cities) than from low populated areas (rural) but with important differences between countries. The countries with more records in urban areas (Brazil and Mexico) showed a larger surface occupied by cities. The countries with most records in rural areas (Argentina and Chile) present the opposite pattern of occupied surface. This might indicate that different percentages of areas dedicated to cities or urban spaces might explain the differences among countries. The most important variable related to puma events in the populated areas was sky brightness, while human density and cattle density explained minor parts. The “anthropause” due to the COVID-19 pandemic might explain the larger number of records from 2020, while the absence of high-quality habitats due to fragmentation and high cattle density, might force the pumas to enter populated areas searching for food. Minor values of night lights could be related to a facilitation of efficiency of foraging behavior. Although some bias might exist in the data, the results should be taken into account as general statements for all analyzed countries.
Introduction
Global biodiversity is threatened by habitat loss and fragmentation due to urbanization (McDonald et al., 2008). The encyclopedia Britannica defines “urbanization” (or “urbanisation”) as “the process by which large numbers of people become permanently concentrated in relatively small areas, forming cities” (Britannica, 2021). Urbanization is obviously related to the spatial distribution of human populations. Actually, more than half of the world's population is living in urban areas (55%) a trend which increased from 30% since 1950 (United Nations Department of Economic Social Affairs Population Division, 2019). Particularly, in the American continent, majority of the countries present more than 60% of the population already living in urban areas, a trend that is estimated to be increased by 2050 (United Nations Department of Economic Social Affairs Population Division, 2019). In Latin America (from Mexico to Argentina), urbanization is now around 80% higher than in most of the other regions (United Nations Department of Economic Social Affairs Population Division, 2019). Particularly in this region, the urban systems stand out for their huge cities: for example, in 2000, with only 8.5% of the total world population and 13.7% of the total urban population, the region had four of the 15 most populated cities of the world (e.g., São Paulo, Mexico City, Buenos Aires, and Rio de Janeiro; Lattes et al., 2017).
Urbanization causes a decrease in mean patch size, total core area, and cohesion of habitats, while it increases patch and edge density, as well as shape complexity of habitat (Liu et al., 2016). Under this context, wildlife species will face loss of habitat and novel environmental pressures in areas proximal to urban areas, particularly: intense vehicular and pedestrian traffic and acoustic, chemical, and light pollution, among others (Grimm et al., 2008). Within wildlife species, large mammalian carnivores, which present large home ranges, low population densities, and slow growth rates (Noss et al., 1996), will be particularly sensitive to the effects of urbanization. Understanding their status across this novel landscape (e.g., suburban and urban areas), can be useful since large carnivores are considered indirect indicators of the overall health of ecosystems due to their trophic position (Noss et al., 1996; Crooks et al., 2011). It is also important to understand their status regarding the exploitation of new anthropogenic foods and shelters (Bateman and Fleming, 2012) to zoonotic importance (Reperant et al., 2009) and direct attacks (Bombieri et al., 2018).
The puma, Puma concolor (Linnaeus, 1771), is a large felid (average weight: 53.9 kg; Jones et al., 2009) distributed in almost the entire American continent (Nielsen et al., 2015). This species is particularly sensible to habitat fragmentation and human landscape variables (Crooks, 2002); it has been shown that the development of roads can reduce gene flow in its populations (Riley et al., 2014). Also, as the amount of human disturbances increased, a reduced occurrence of puma was recorded between 2009 and 2010 in Lewis et al. (2015) and between 2014 and 2016 in Guerisoli et al. (2019). Pumas require landscape connectivity to persist (Crooks, 2002; Maletzke et al., 2017), but can still survive within and next to urban ecosystems (e.g., Wilmers et al., 2013; Riley et al., 2014; Lewis et al., 2015; Zeller et al., 2017; Blecha et al., 2018). Nevertheless, moderate levels of fragmentation can affect the genomic diversity of a species, particularly of a top predator (Saremi et al., 2019). A recent study on puma genomes announced that, because of the ongoing increased habitat loss and fragmentation (caused by the rapid human population growth and land development) in South America, puma populations will tend to be smaller and isolated (Saremi et al., 2019).
Conflicts between pumas and humans include threats posed to life or economic resources, or even to the perception that puma threatens human safety or property (Nyhus, 2016). Most conflicts with puma relate to livestock predation in areas with high livestock density, low habitat steepness, low co-predator richness, and high distance to roads as focal conflict areas (see Guerisoli et al., 2020). The attack of puma on humans does not seem to be common, with nine people dead in 116 years in North America (Sweanor and Logan, 2010). However, the attention that media display toward an encounter between puma and humans, or the presence of puma in urban areas, seems to be really high (Shaw, 2010; Vardi et al., 2021). Human perceptions of puma are wide: livestock producers experience economic losses and use mitigation techniques and retaliatory killings, sport hunters resolve conflict lethally, the general public sees puma as ecologically important but demand lethal actions following attacks on humans, environmentalist aim to prohibit puma hunting, among many others (Mattson and Clark, 2010).
Pumas are considered to have high plasticity and adaptability to novel environments, making this species an excellent model to understand the exploration of atypical ecosystems (Moss et al., 2016). Given the importance of understanding wildlife-human interactions, such as visits of carnivores in peri-urban/urban areas, and given the high urbanization degree of Latin America, our broad goal is to characterize puma events in these landscapes. More specifically, we aim to: (1) characterize media reports of puma visits in peri-urban/urban areas in Latin America within the last 10 years and (2) understand if there is a relationship between the visits according to different degrees of urbanization across Latin America.
Materials and Methods
Sourcing Information
We conducted an online systematic search and review of media news, in Spanish and Portuguese, that addressed puma events in urban ecosystems in Latin America (Supplementary Material 1) using Google search. As several common names are used for Puma concolor in Latin America (i.e., puma, león de montaña, suçuarana, onça parda), we included all of them in our search and combined them (in Spanish and Portuguese) with the terms: “city,” “urban,” “town,” “capital,” “cidade.” We included all media news published from 2011 (i.e., the first recorded was from April) until May 2021. We used the Google search platform to complete the revision and additionally, we employed a snowball sampling (Goodman, 1961) to identify and include additional media news matching our criteria identified during our primary searches. After the first search of information, we found little news from some countries (e.g., Venezuela), and we completed, in those cases, a specific search by adding the name of the countries to the search. Specially, for Suriname and French Guiana, we applied the local language spoken in the search. Each locality was georeferenced to the maximum accuracy possible according to the information available, using Google Earth Pro. The coordinates were used also to ensure that no duplicates were found, checking the lack of correspondence in both latitude and longitude between two events. Henceforward, we define the information sourced as “puma event/s” when a direct encounter between the animal and humans was recorded in rural, peri-urban, and urban areas.
Temporal and Geographical Characterization
When a news article specified the exact date of the puma event, that date was used but when the news article did not specify the exact date, then the release date of the news article was used. The difference between encounter date and published date was calculated for those articles presenting such information. Articles presenting the puma events were published considerably quickly after the encounter (x = 16 h, sd = 22 h). To understand if there was a temporal pattern of the puma events, we divided them per year and to comprehend the magnitude of the relationship between the years and the quantity of puma events, we fitted an exponential regression model in R (function lm, R Development Core Team, 2020). The relationship between the quantity of puma events and the quantity of news obtained under the parameters of our search (e.g., “puma” + “city”; hereafter “news in general”) was analyzed by applying a proportion. Additionally, to study if there was a seasonal pattern, we extracted only the puma events of the Southern Hemisphere and we calculated the absolute number per season (summer: from 21 December to 20 March; Autumn: from 21 March to 20 June; Winter: from 21 June to 20 September and Spring: from 21 September to 20 December). Additionally, to establish the amount of records across Latin America, we quantified the number of puma events per country. To test if there were significant differences between the years and seasons affecting the distribution of the events, we applied a Chi-square goodness of fit in R (R Development Core Team, 2020).
Characterization of the Puma Event
From each news article, we extracted the relevant information related with the puma event. When possible, it was recorded: (a) if the event was just a sighting of the species (e.g., from security cams), (b) how the event ended (e.g., captivity), and (c) if there were extra data regarding the puma event in the urban area (e.g., related with a livestock attack). The event was categorized as “mascotism” if the information available allowed inferring that the animal was being kept within a particular house as if it was a domestic animal. Additionally, we characterized the information regarding the individuals involved. We extracted, when available, the age class into three categories: cub (less than 12 months, or when stated “cub”), juvenile (less than 2 years, or when stated “juvenile”), and adult (more than 24 months, or when stated “adult”). Moreover, we recorded the information related, when available, of the sex and the weight of the individuals involved.
Puma Events and Degree of Urbanization
The definition of “degree of urbanization” varies across each country. Since the geographic scale included in this revision is broad (Latin America), we applied the definition of “degree of urbanization” provided by the World Bank Data (Dijkstra et al., 2020). The “degree of urbanization” is categorized as cities, towns, semi-dense areas, and rural areas. (1) Cities are defined as those areas which have a population of at least 50,000 inhabitants in contiguous dense grid cells (>1,500 inhabitants per km2); (2) towns and semi-dense areas are areas with a population of at least 5,000 inhabitants in contiguous grid cells with a density of at least 300 inhabitants per km2; (3) rural areas: areas which consist mostly of low-density grid cells (<300 inhabitants per km2). We assigned these categories to each puma event using the map of human density “Gridded Population of the World” (number of persons per km2; SEDAC, 2018) at 30 arc-sec resolution. To test the significant differences between degrees of urbanization in different countries, we applied a Chi-square goodness of fit in R (R Development Core Team, 2020).
Possible Determinants of Puma's Events in Urban Areas
Explanatory Variables
To analyze the possible determinants of puma events in proximity of or inside urban landscapes, we extracted six explanatory variables from different sources.
1) Pumas are considered adaptable species, capable to expand their niche, over time and space, in areas that suffered a transformation from rural to urban landscapes (Moss et al., 2016). Thus, to understand if puma events presented a relationship with rural, peri-urban, or urban areas, we used a map of human density (number of persons per km2; SEDAC, 2018) at 1 km resolution (i.e., ca. 1 km at equator).
2) Since pumas are more likely to predate in habitats with vegetation coverage (e.g., shrubs; Guerisoli et al., 2020), we extracted from each puma record the land cover information to understand if the puma events were related to those habitats. For this, we used the map of “Land Cover GLC-SHARE” (Latham et al., 2014) at 1 km of resolution. This variable was considered as a categorical variable stating land cover and vegetation state (Latham et al., 2014).
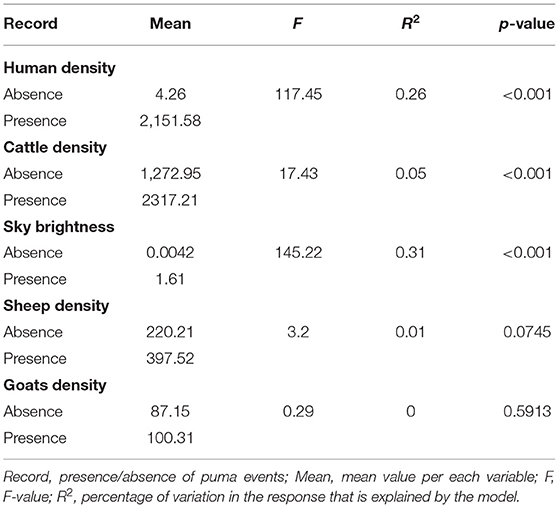
3) Little information is available on the effects of light pollution on pumas. Still, Ditmer et al. (2021) found that pumas and their prey selected areas with elevated light when surrounding radiance levels were low and in areas with elevated nightlight, pumas and their prey increasingly avoided light exposure. Another recent study found that during COVID-19 lockdown, night lights was one of the most important predictors of puma observations (Vardi et al., 2021). Thus, we extracted, per each puma event, the values of artificial brightness (expressed as millicandels/cm2) from the map of “artificial sky brightness” (Falchi et al., 2016) at 1 km of resolution.
4) Pumas are considered, across their distribution, as a conflictive species, particularly for predation of livestock species (Guerisoli et al., 2020). This conflict is specially concentrated in Latin America (Guerisoli et al., 2020). Thus, to understand if puma events were associated with livestock densities, we extracted, per each event, the density values of cattle, sheep, and goats (the main livestock prey species of pumas; Guerisoli et al., 2020). To complete this, we used, per each species, the “Gridded Livestock of the World” which included the amount of cattle, sheep, and goats per pixel size (Wint and Robinson, 2007). These latter maps were at 10 km resolution.
For the extraction of each variable, we used QGIS 3.16 (QGIS, 2021). The maximum, minimum, median values, and histograms are presented for each variable. A possible shortcoming might be seen given that variables do not represent the exact time of each particular puma event. However, we believe that this can be overcome since three of the variables have information from the 10-year analyzed period, and the other three were published only 3 years before.
Modeling the Explanatory Variables
To comprehend the importance of the explanatory variables on the puma events, we applied a Generalized Linear Model (GLM). To understand if the explanatory variables described before were correlated (i.e., r <0.7), a correlation analysis was performed in R (R Development Core Team, 2020), showing a lack of multicollinearity between variables.
Since GLM needs both presences and absences, the latter needed to be built. Thus, we created a Maxent model (Phillips et al., 2006) with the six variables above mentioned and all the records of puma in urban areas. As the variables had different resolutions, we resample “Land Cover,” “Sky brightness,” and “Human density” to 10 km resolution, and then, all variables were cut to the data extension. These were done using the package “raster” (Hijmans et al., 2020) in R (R Development Core Team, 2020). We used the default settings of Maxent and all variables were set as “continuous,” except for “Land Cover GLC-SHARE,” which was set as “categorical.” We followed Liu et al. (2013) and used Maximum Sensitivity and Specificity as threshold, to create a binary map of presences and absences. Posteriorly, the absence records were randomly selected from the absences areas of the binary output created. The amount of absence points was equally selected than the amount of presence points to create a balanced sample. The values of the six variables were extracted from these points and accounted as “absences” to be included, along with the puma events, within GLM, ANOVA, and Fisher tests (see below). A similar methodology was used in Seitz et al. (2017).
To evaluate if significant differences existed between presences and absences, we applied a one-way ANOVA for the five continuous variables, and a Fisher test for “Land Cover GLC-SHARE.” We ran these analyses in software R (R Development Core Team, 2020).
To analyze the importance of each variable in the presence of the others, a GLM was developed using the package “lme4” (Bates et al., 2015) in R (R Development Core Team, 2020). We standardized all variables, except “Land Cover GLC-SHARE” which was set as a factor. The model selection was completed following the Akaike Information Criteria (Akaike, 1973) corrected for sample size (i.e., AICc) and we presented the results applying a model average. To complete this, we used the package MuMIn (Bartón, 2020) in R (R Development Core Team, 2020). Models with similar support were considered when the difference in AICc was less than two (ΔAICc <2; Burnham and Anderson, 2002).
Results
Temporal and Geographical Characterization
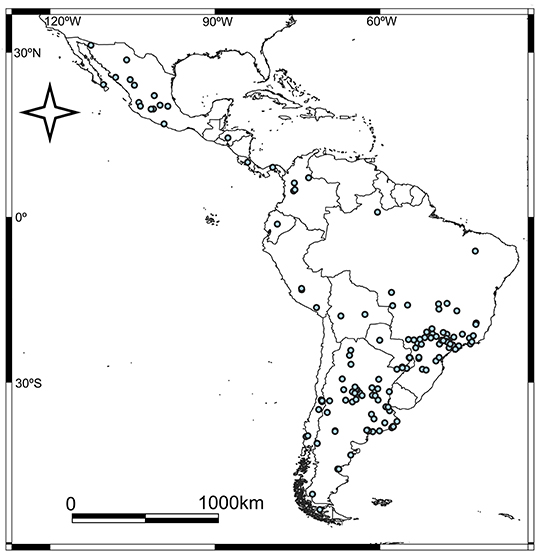
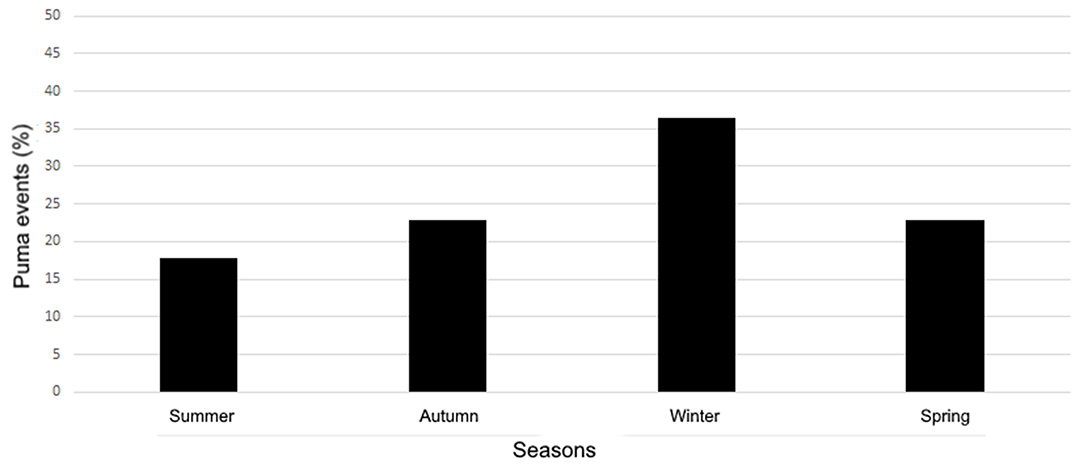
We found a total of 162 events regarding pumas in urban areas (Supplementary Material 1; Figure 1). We identified a gradual growth of puma's events from 2011 to 2021, and the year with the highest increase in news, regarding puma events, was 2020 (Figure 2). The association between the years and the quantity of puma events was positive (r2 = 72%). The relationship between the quantity of puma's events and the quantity of news in general increased, particularly in 2019, 2020, and in the first part of 2021 (13.2, 37.6, and 11.7%, respectively; Figure 2). Considering only the period 2011–2020, we found that the puma events were significantly different between years (X2 = 213.92, p < 0.001). If the COVID-19 years are not taken into account, still the amount of puma events increase from 2010 to 2019. The number of puma events fluctuated across the seasons in the Southern Hemisphere (total sample size = 140; Figure 3). Overall, the season with the less absolute number of puma events was the summer (n = 25), while the absolute number increased during winter (n = 51; X2 = 10.86, p < 0.05; Figure 3).
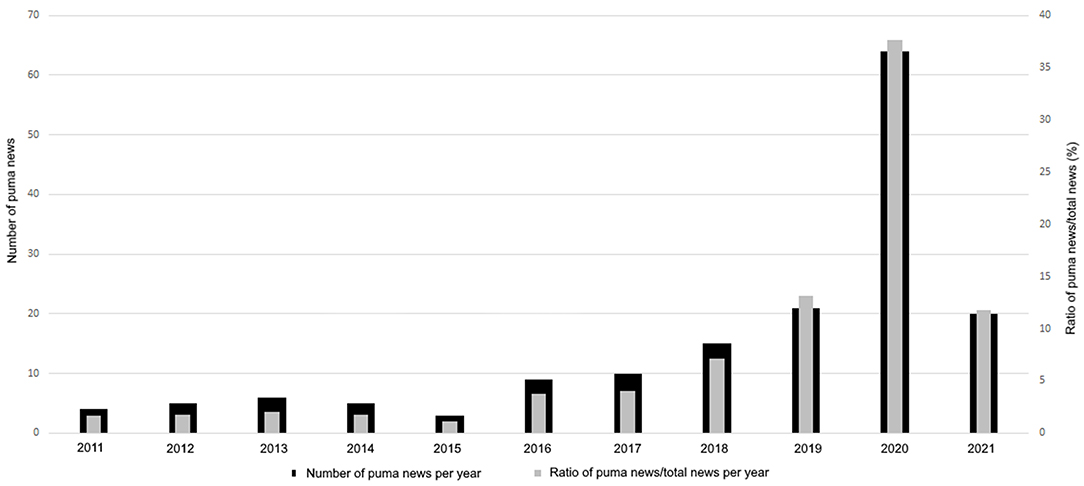
Figure 2. Number of puma events per year and ratio (in %) of puma events and the quantity of news in general (as defined in Section Materials and Methods).
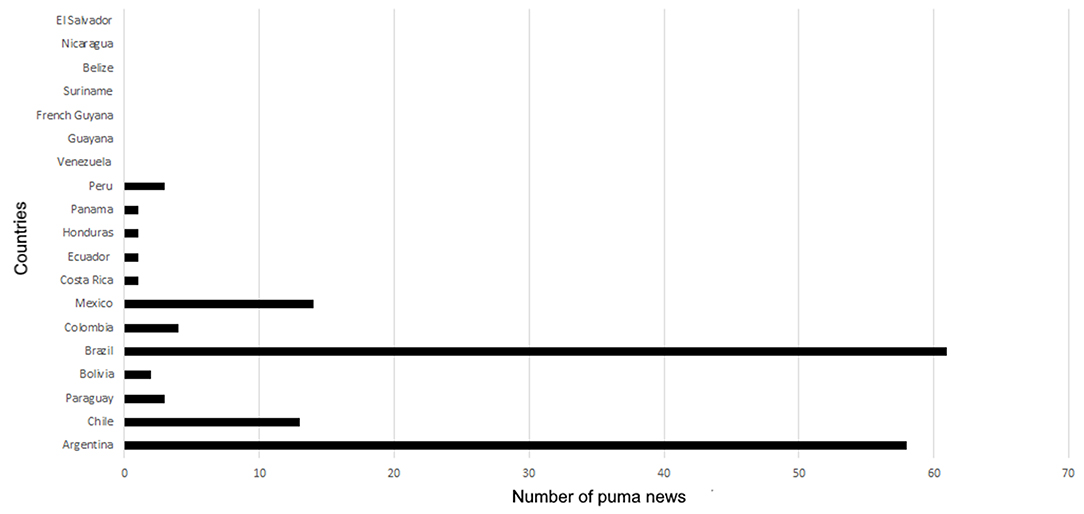
The countries with the greatest number of puma events were Brazil (n = 61) and Argentina (n = 58), followed by Mexico (n = 14) and Chile (n = 13; Figure 4; see Supplementary Material 1).
Characterization of the Puma Event
Of the 162-puma events, only two did not present detailed information. The news included that only puma's sightings or indirect signs of the species (e.g., tracks), were 67 (41.3%). The events that were related by the media as mascotism cases were only four (2.4%). Fifty-eight percent (n = 94) of the news included pumas that were captured after the sighting. In this percentage, we included also if the capture was successful (i.e., live capture) or not (i.e., death of the individual). The sighting of a female puma with cubs and the capture of the litter (i.e., the female escaped) was recorded only once (0.6%). The puma events related with livestock attacks (e.g., of cattle, sheep) were eight (4.9%), only two (1.2%) were related with attacks to humans, one (0.6%) was related with roadkill, and six (3.7%) were related to damage to human properties (e.g., cars, dogs).
Of the 75 news that presented information regarding the management of the captured individuals, 33 (44%) puma events ended under a captivity scenario (e.g., zoos). From these 33 events, 13 (40%) came from Brazil, 10 (30%) from Argentina, four (12%) from Mexico, three (9%) from Chile, two (6%) from Peru and one (3%) from Colombia. A total of 33 (44%) pumas, of the 75 news, were reintroduced into the wild: 20 (61%) were from Brazil, seven (21%) from Argentina, three (9%) from Mexico, two (6%) from Colombia, and one (3%) from Panama. Nine (12%) puma events, of the 75 news, ended with the death of the individual, either during the capture or directly killed without trying a live-capture (e.g., police that fired directly at the puma; Figure 5). From these nine events, six (67%) were from Argentina, two (22%) from Chile, and one (11%) from Mexico.
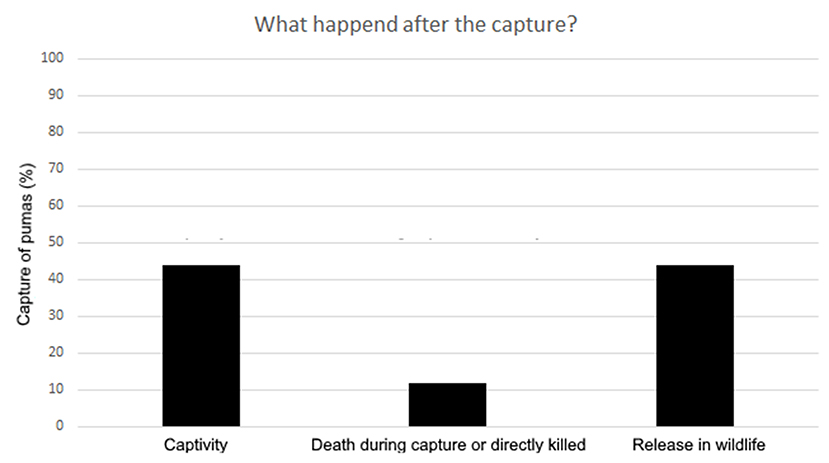
Figure 5. Percentage of the news that presented information regarding the management of the captured individuals.
The news that recorded the age (cub, juvenile, and adult) of the individuals were generally those articles that included the veterinary check-up of the puma captured. Overall, 80 news articles detailed the age of the individuals. Of these, 17 (21.2%) were cubs, 23 (28.7%) were juvenile and 40 (50%) were adults. Of the 40 adult puma events, six (15%) were events related with females with cubs. Sex was provided by a minor quantity of the events (n = 30). The females were 53.3% (n = 16) and the males were 46.6% (n = 14) of the population. The weight of the individuals was also information scarcely provided by some news sources (n = 15), ranging from 25 to 100 kg, and regrettably without relation to the age group. The records of individuals that weighed less than 30 kg were four, seven weighed between 30 and 50 kg, and four weighing more than 50 kg.
Puma Events and Degree of Urbanization
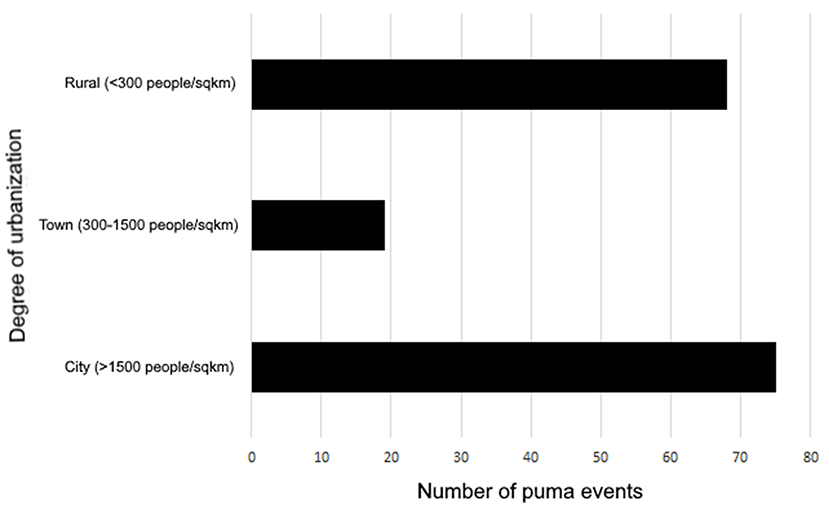
Of the 162 records, 75 (46%) came from cities (1,500 > people/km2), 68 (42%) came from rural areas (300 < people/km2), and 19 (12%) came from towns (300–1,500 people/km2; Figure 6). The majority of the puma events that occurred in cities were located in Brazil (69.3%, n = 52; X2 = 74.2, p < 0.001), followed by Mexico (14.6%, n = 10; X2 = 13.03, p < 0.001). Argentina, Chile, Colombia, Peru, and Paraguay presented less than 5% of the puma urban events in cities. Rural areas where puma events occurred were mainly, and significantly, present, in Argentina (73.5%, n = 50; X2 = 73.02, p < 0.001), followed by Chile (13.2%, n = 9; X2 = 9.3, p < 0.001). Less than 5% of puma events in rural areas were located in Brazil, Mexico, Colombia, Peru, Paraguay, and Bolivia. Towns were mainly represented by Brazil (31.5%, n = 6) and Argentina (26.3%, n = 5), followed by Colombia (10.5%, n = 2). Mexico, Panamá, Paraguay, Bolivia, Ecuador, and Honduras represented, each, the 5.3% of the events (n = 1).
Possible Determinants of Pumas in Urban Areas
The mean value for human density, according to the 162 records, was of 2,151 persons/km2, ranging from 0 to 10,966 persons/km2. However, most records were gathered between 500 and 600 persons/km2 (Figure 7A). As to “Land Cover,” 62 records (38%) came from “Shrubs Covered Areas,” followed by 35 (22%) from “Croplands,” 27 (17%) from “Artificial Surfaces,” 21(13%) from “Grassland,” nine (6%) from “Tree Covered Areas,” seven (4%) from “Baresoil,” and 1 (1%) from “Herbaceous vegetation, aquatic or regularly flooded” (Figure 7B). As to “Sky Brightness,” the mean value for all records was 1.61 mcd/cm2, ranging from 0 to 10.95 mcd/cm2; although most of the puma events were around 0.55 mcd/cm2 (Figure 7C). Regarding cattle density, the mean value for all records was of 2,317 cattle/km2, ranging from 0 to 14,394 cattle/km2. Most of the sightings were in the category of 700 cattle/km2 (Figure 7D). As to the relationship with sheep density, the mean value was 397 sheep/km2, ranging from 0 to 10,139 sheep/km2. Most sightings were seen in the category of 500 sheep/km2 (Figure 7E). Finally, the mean value for records according to goat density was of 100 goat/km2, ranging from 0 to 1,189 goat/km2; with most records coming from the 60 goat/km2 category (Figure 7F).
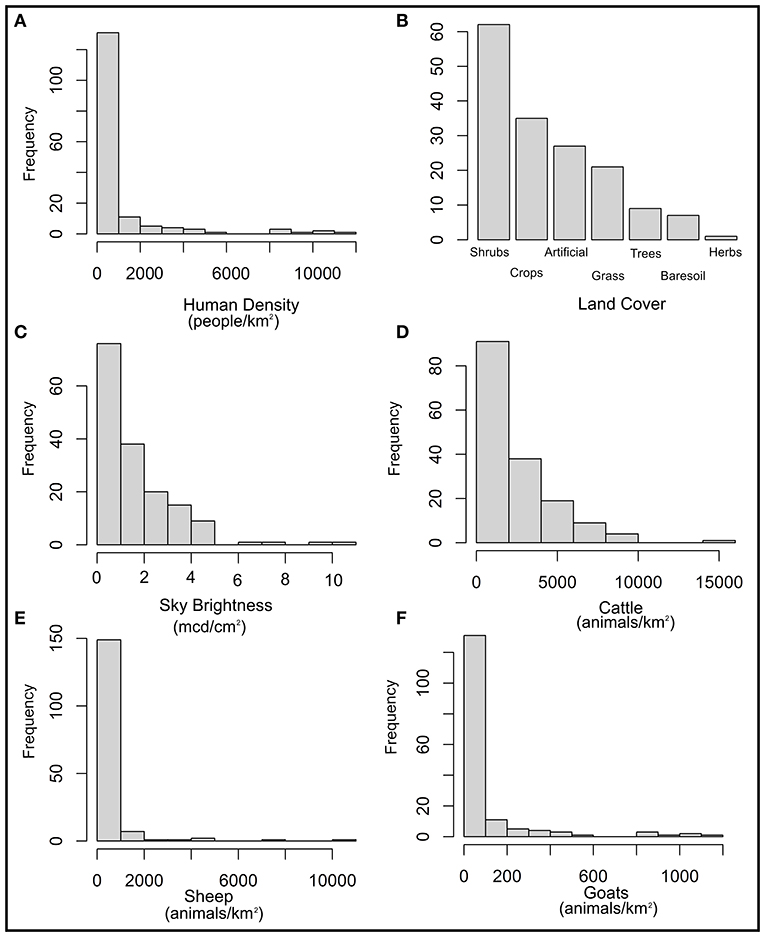
Figure 7. Histograms of the six extracted variables for the 162 records. (A) Human density. (B) Land cover. (C) Sky brightness. (D) Cattle density. (E) Sheep density. (F) Goat density.
The ANOVA indicated that significant differences existed between the presence and absence of puma events according to the explanatory variables of “Human density,” “Cattle density,” and “Sky Brightness” (Table 1). For “Human density,” areas of presence displayed much higher values than absences, with mean value of 2,151 persons/km2 for presences and only 4 persons/km2 for absences. For “Cattle density,” the presence of pumas was related with mean values of 2,317 cattle/km2 and of 1,272 cattle/km2 for absences. For “Sky Brightness,” the presence of pumas was mostly related with mean values of 1.6 mcd/cm2 and of 0.0042 mcd/cm2 for absences. No significant differences were found in the ANOVA for “Sheep and Goats densities,” neither in Fisher test for “Land Cover” (p > 0.05).
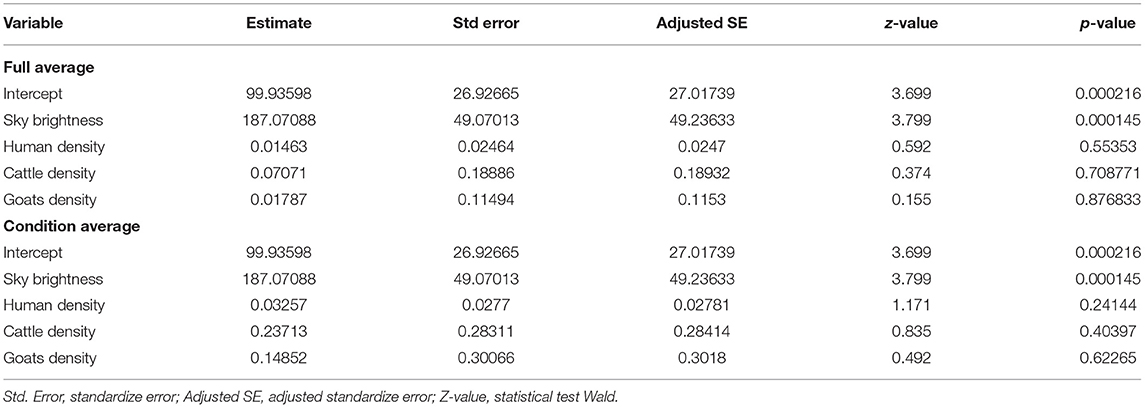
The results of GLM indicated that “Sky Brightness” was the only variable that significantly explained (p < 0.01) differences between presences and absences of puma events. The variable had a positive and high estimate value (i.e., β, Table 2).
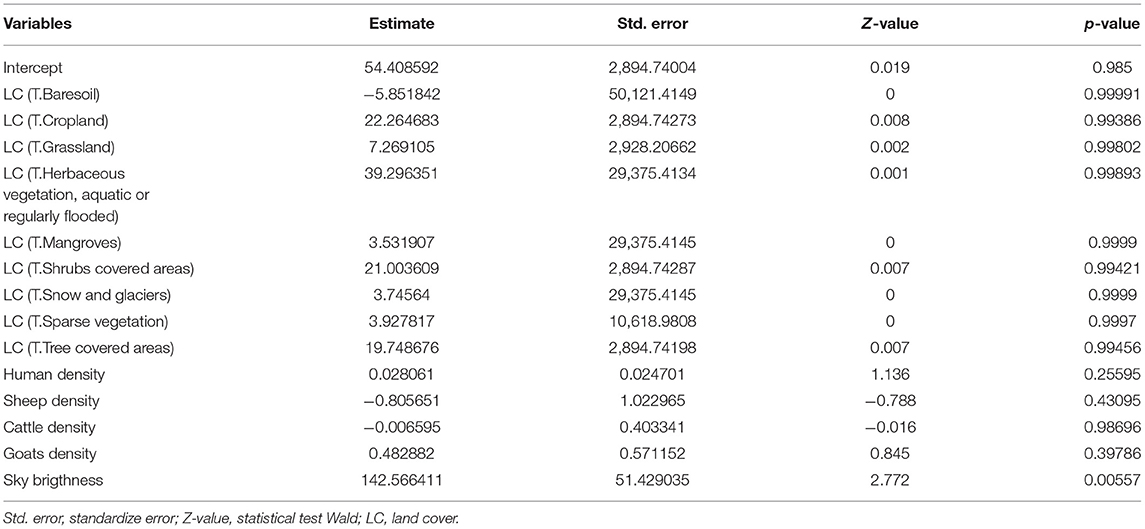
Table 2. Results of GLM using the five continuous standardized variables and “land cover” as factor.
Model Selection indicated that five models held similar support according to AICc (i.e., ΔAIC <2). Model Average can be seen in Table 3. The results indicate that “Sky Brightness” was the only variable that significantly explained (p < 0.01) differences between presences and absences of puma events, in both full and conditional models.
Discussion
Temporal and Geographical Characterization
In this review, we found an increase in puma events during the last decade, with a maximum during the lockdown-year 2020. The next step will be to understand if this rise depended on the consequences of the quarantines applied in Latin America (i.e., less people moving around) or if the mediatic environment was more concentrated on collecting this type of news. Still, there was an absolute exponential increase during the time window considered. The encounter of wildlife species in urban areas has become increasingly common to hear about in the news (Vardi et al., 2021), particularly after the COVID-19 pandemic. Several carnivore species (including puma) have been found in localities where they have not been previously recorded during 2020 (Vardi et al., 2021). One of the most important variables related to this “urban reclamation” was found to be the reduction in human mobility (Bates, 2021; Vardi et al., 2021). The lockdown of 2020 also allowed a reduction in road kills and an increase in species richness in less-disturbed areas, but also had some negative effects, such as lack of control of alien species and illegal hunting (Manenti et al., 2020; Bates, 2021).
We found a rise in the puma events between July and October (austral winter), a pattern that could be related to biological aspects of this species, such as mating season, prey availability, and food search. Although there is little information of the biology of pumas in the Southern Hemisphere, it has been shown, for the Northern Hemisphere, that the courtship and mating mainly occur during the winter/spring period, a time window where prey availability could be limited (Johansson et al., 2018). During this period, home ranges of pumas are at its minimum, food resources are crumpled, and the mating season is at the maximum (Johansson et al., 2018). So, because of the winter conditions in the Southern Hemisphere (e.g., food scarcity) pumas could be forced to cross anthropic landscapes searching for higher prey availability or mating partners (Ramírez-Álvarez et al., 2021). Future lines of research of spatial data (i.e., telemetry data) of puma's populations in this Hemisphere could contribute to comprehend better this potential relationship between the temporal patterns of the events and puma's biology.
Characterization of the Puma Event
Surprisingly, few records were related with livestock attacks. Pumas are considered a conflictive species, particularly in Latin America (Guerisoli et al., 2020). Thus, especially for those records in rural areas, a higher amount of events-livestock-attack-related was expected. We believe that this could be a consequence of geographic distance related to media concentration. In Latin America, most media enterprises are concentrated in large cities (Iturralde, 2017). Many cases involving conflicts with livestock occur in distant sites from populated areas, and livestock producers perhaps do not even report/share the attack on their stock publicly (Guerisoli et al., 2020). Even more, puma-livestock conflicts are poorly studied in Latin America, and the main method to collect such information, involves direct interviews with local ranchers (Guerisoli et al., 2020).
The management of the pumas involved in the events was mainly divided between individuals that ended in captivity and individuals released into the wild. The release of pumas into the wild occurred mainly in Brazil and Argentina. The pumas that ended in captivity were mainly because the individuals were too young or injured, or because there was a lack of support to guide a potential release (e.g., from National Research Institutes, NGOs). In Brazil, the National Environmental Council's resolutions (nos. 001, 1986 and nos. 237, 1997) establish the release of animals that were captured in animal rescue projects (Instituto Brasileiro do Meio Ambiente, 2015). In this country, NGOs and enterprises have a partnership with the Brazilian government and are officially authorized to receive, keep, and release the apprehended wildlife (Bernardo, 2012). Additionally, the government collaborates to maintain public wildlife centers that also receive, keep, and release rescued wildlife. This legislation could explain why in Brazil pumas were more successfully reintroduced into the wild than in Argentina.
In Argentina, the release of rescued wildlife is not fully regulated by any law or legislation. The release of wildlife in private captivity will depend on the owner and might be challenging, because of the livestock-puma conflict (Guerisoli comm. Pers.). In Argentinean National Parks the reintroduction of wildlife is limited by a National Park law resolution no. 157/91. Still, wildlife can be reintroduced only if a new population of the target species is meant to be funded or if the reintroduction is needed to strengthen an existing population (article no. 8 from the National Park law resolution no. 157/91). Pumas in Argentina are far from being considered an endangered species or a species that needs reinforcement of their populations, since their national status is “Least Concern” and their populations are considered “Stable” (De Angelo et al., 2019). The pumas that were released into the wild in Argentina were inside provincial or private reserves. In this country, there are private and public wildlife centers that receive, keep, and release rescued wildlife. Another issue that could be challenging for pumas captured in urban areas is that, in Argentina, most of the wildlife centers that complete rescue activities, already have a high number of pumas in captivity, and they, most of the time, do not accept this species anymore (confidential communication to Guerisoli, M.). This could be a problem for future captures of pumas, since they cannot stay in captivity and their release is complicated.
The majority of the records were from adults, followed by juveniles. This result was not expected, given that juvenile pumas (i.e., sub-adults) could be more prone to dispersal behavior (Logan and Sweanor, 2010) than experienced individuals, and thus, visiting novel environments, such as the urban one. No information about elderly or injured individuals could be obtained from the news, regarding only adults' events. As Quigley and Hornocker (2010) stated, adult survival is one of the most important factors to determine cougar society. A puma population with a higher adult survival will be characterized by an older age structure and a need for a higher dispersal of the juveniles (Quigley and Hornocker, 2010). We believe that the events where only cubs (<12 months) were involved could be related with mascotism, since it could be challenging for a cub to move from a non-urban landscape to an urban one by itself (i.e., cubs are highly dependent on the mother; Logan and Sweanor, 2010).
Puma Events and Degree of Urbanization
The majority of the puma events occurred in “city areas” and in “rural areas.” In the first, most events were located in Brazil and Mexico, while “rural areas” were represented mostly in Argentina and Chile. Brazil and Mexico territories present a higher percentage of “city areas” (ca. 0.42 and 0.99%, respectively) than Argentina and Chile (ca. 0.11% and 0.16%, respectively; SEDAC, 2018). Thus, it is not surprising that the majority of the puma events occurred in those countries with a higher concentration of “city areas.” On the other hand, Argentina and Mexico presented a higher percentage of their territories dedicated to “rural areas” (ca, 82 and 70%, respectively) compared to Brazil and Mexico (ca. 56 and 63% respectively; SEDAC, 2018). So, this could be explaining the increased puma events in those countries with territories dedicated to “rural areas.”
Possible Determinants of Pumas in Urban Areas
Human Density
The presence of the puma events was mainly characterized by areas with variable human density. Local studies have shown that pumas normally would avoid areas with human presence (e.g., Ordeñana et al., 2010; De Angelo et al., 2011; Wilmers et al., 2013; Guerisoli et al., 2019). Urbanization has been recognized as a potential genetic barrier in puma's populations; indeed, Trumbo et al. (2019) identified that urbanization restricted the gene flow of pumas in more urbanized environments. Still, pumas could explore scenarios with more anthropic disturbances searching, for example, for food resources (Moss et al., 2016; Johansson et al., 2018). Potentially, the absence of high-quality habitats, direct competitors, and the proximity to protected areas, could contribute to a higher frequency of puma's sightings in urban areas (Miotto et al., 2012, 2014). Additionally, this carnivore could be moving across these landscapes searching for alternative food sources (e.g., livestock) or reproductive partners (Ramírez-Álvarez et al., 2021), leading puma's individuals to potential ecological traps (see Section General Conclusion). Finally, it could be interesting to analyze if the global phenomenon of “abandoning rural areas” (World Bank, 2019) could be increasing sightings of pumas in urban environments as an indirect measure of puma's local populations recovery.
Cattle Density
The puma events occurred mainly in areas with higher densities of cattle. The main countries that contribute to the cattle breeding industry in Latin America are Argentina, Brazil, Mexico, and Colombia (Montaldo et al., 2012). In these countries, most of the logging activities were aimed to replace natural habitats to create pastures for cattle (Cheleuitte-Nieves et al., 2020), generating negative effects on the environment, such as loss of biodiversity, resource degradation, increased emissions of trace, and greenhouse gases (Cheleuitte-Nieves et al., 2020). Thus, in areas with cattle density we will be expecting degraded habitat. In Latin America, cattle density is almost null in the tropical rain forest of Amazonia while in the central-east of Argentina, east of Brazil, northern regions of South America, and most of Central America, it is much higher (Robinson et al., 2014). Cattle have been recognized, across the American continent, as potential prey for pumas (Guerisoli et al., 2020), thus it is not surprising that puma events could be related to the presence of this domestic prey. Still, cattle are spatially distributed in degraded areas, whereas wild prey of pumas could present a limited availability, thus this feline could be either exploring those areas searching for alternative food sources (e.g., cattle) or using those areas as migratory routes toward areas with less altered environments.
Sky Brightness
In recent decades, an increase in artificial nightlight reached 25% of the global land area (Ditmer et al., 2021), with possible ecological consequences for species with nocturnal habits, such as the puma, that developed most of its activities during the crepuscular/nocturnal hours (e.g., Soria-Díaz et al., 2016; Azevedo et al., 2018; Guerisoli et al., 2019). The response of mammals to nightlight differs among taxa and to several determinants, such as type of habitat (Pratas-Santiago et al., 2017). In this work, “Sky Brightness” was not only important individually, but in the presence of other variables as well, affecting the occurrence of pumas in urban environments. Most of the puma events occurred in areas characterized by values of artificial brightness of, ~0.55 mcd/cm2. This value means that in 1 m2 we will have 5.5 candles illuminating the scene. However, at higher values of Sky Brightness, the amount of puma records decreased, which could be explained by the absence of prey as well as a response of predation risk (see Pratas-Santiago et al., 2017). In the darkest locations, light is one of the main drivers of puma activity, particularly in those sites with deer predation (Ditmer et al., 2021). It is known that nocturnal luminosity, derived from moonlight, facilitates the efficiency of foraging behavior in predators (Prugh and Golden, 2014). Still, there is no study investigating if the moonlight intensity could be similar to some levels of artificial light. Although pumas and deer select sites with elevated light when surrounding radiance levels are low, but in sites with elevated artificial lights, pumas and their prey avoid light exposure (Ditmer et al., 2021).
General Conclusion
We found an increasing amount of puma events during the last decade, particularly during the year of maximum restrictions due to the COVID-19 pandemic. Brazil presented the highest amount of records, and these were characterized by high human density areas, and also by having the highest amount of translocated animals. On the other hand, Argentina was the second country according to events, but these were more related to low human density areas, and by less translocation events. We believe that the difference in type of events could be related to the different human population patterns of both countries. Brazil seems to have a clearer and simpler legislation regarding wildlife, allowing more quantity and more successful translocation events. This seems to be an important effort given the conservation status of the species in the country (Vulnerable, de Azevedo et al., 2013). Clearly, in Argentina, a proper legal frame for the translocation of wildlife is needed. Although in this country, the species is considered a Least Concern, local populations are thought to be suffering retractions due to lethal methods and expansion of agroecosystems (De Angelo et al., 2019). The large amount of adult individuals related to pumas in urban events could indicate an older-age population structure, but this needs to be further tested. However, in such a widely distributed species that reside in both high and low quality habitats, the matrix of fragmentation due to urbanization growth might become an “ecological trap” (Gates and Gysel, 1978; see Lamb et al., 2017 for Ursus arctos; van der Meer et al., 2014 for Lycaon pictus). Meaning, in drastically modified habitats, species might choose poor-quality habitats over available higher-quality habitats (Weldon and Haddad, 2005). Clearly, future lines of research to better understand this ongoing process should be focused on unraveling the population dynamics and habitat preference of puma.
Data Availability Statement
The original contributions presented in the study are included in the article/Supplementary Material, further inquiries can be directed to the corresponding author/s.
Author Contributions
MG and MS equally participated on the development of this manuscript. Both authors contributed to the article and approved the submitted version.
Conflict of Interest
The authors declare that the research was conducted in the absence of any commercial or financial relationships that could be construed as a potential conflict of interest.
Publisher's Note
All claims expressed in this article are solely those of the authors and do not necessarily represent those of their affiliated organizations, or those of the publisher, the editors and the reviewers. Any product that may be evaluated in this article, or claim that may be made by its manufacturer, is not guaranteed or endorsed by the publisher.
Acknowledgments
We are grateful for the time and effort that five reviewers and the editor have dedicated to this article. Their comments greatly improved this work.
Supplementary Material
The Supplementary Material for this article can be found online at: https://www.frontiersin.org/articles/10.3389/fcosc.2022.739026/full#supplementary-material
References
Akaike, H. (1973). “Information theory as an extension of the maximum likehood principle,” in Second International Symposium on Information Theory, eds B. N. Petrov and F. Csaki (Budapest: Akademiai Kiado), 267–281.
Azevedo, F. C., Lemos, F. G., Freitas-Junior, M. C., Rocha, D. G., and Azevedo, F. C. C. (2018). Puma activity patterns and temporal overlap with prey in a human-modified landscape at Southeastern Brazil. J. Zool. 305, 246–255. doi: 10.1111/jzo.12558
Bartón, K. (2020). Mu-Min: Multi-Model Inference. R Package version 1.43.17. Available online at: https://CRAN.R-project.org/package=MuMIn (accessed June 06, 2021).
Bateman, P. W., and Fleming, P. A. (2012). Big city life: carnivores in urban environments. J. Zool. 287, 1–23. doi: 10.1111/j.1469-7998.2011.00887.x
Bates, A. E. (2021). Global COVID-19 lockdown highlights humans as both threats and custodians of the environment. Biol. Cons. 263, 109175. doi: 10.1016/j.biocon.2021.109175
Bates, D., Mächler, M., Bolker, B., and Walker, S. (2015). Fitting linear mixed-effects models using lme4. J. Stat. Softw. 67, 1–48. doi: 10.18637/jss.v067.i01
Bernardo, C. S. S. (2012). Reintroduction as a conservation tool for threatened Galliformes: the Red-billed Curassow Crax blumenbachii case study from Rio de Janeiro state, Brazil. J. Ornitol. 153, 135–140. doi: 10.1007/s10336-011-0805-z
Blecha, K. A., Boone, R. B., and Alldredge, M. W. (2018). Hunger mediates apex predator's risk avoidance response in wildland-urban interface. J. Anim. Ecol. 87, 609–622. doi: 10.1111/1365-2656.12801
Bombieri, G., Delgado, M. M., Russo, L. F., Garrote, P. J., López-Bao, J. V., Fedriani, J. M., et al. (2018). Pattenrs of wild carnivore attacks on humans in urban areas. Sci. Rep. 8, 1–9. doi: 10.1038/s41598-018-36034-7
Britannica (2021). Available online at: https://www.britannica.com/topic/urbanization (accessed May 10, 2021).
Burnham, K. P., and Anderson, D. R. (2002). Model Selection and Multimodel Inference: a Practical Information- Theoretical Approach, Second ed. NewYork: Springer'-Verlag.
Cheleuitte-Nieves, C., Perotto-Baldivieso, H. L., Wu, X. B., and Cooper, S. M. (2020). Environmental and landscape influences on the spatial and temporal distribution of a cattle herd in a South Texas rangeland. Ecol. Process. 9, 1–18. doi: 10.1186/s13717-020-00245-6
Crooks, K. R. (2002). Relative sensitivities of mammalian carnivores to habitat fragmentation. Conserv. Biol. 16, 488–502. doi: 10.1046/j.1523-1739.2002.00386.x
Crooks, K. R., Burdett, C. L., Theobald, D. M., Rondinini, C., and Boitani, L. (2011). Global patterns of fragmentation and connectivity of mammalian carnivore habitat. Philos. T. R. Soc. B. 366, 2642–2651. doi: 10.1098/rstb.2011.0120
De Angelo, C., Llanos, R., Guerisoli, M., Varela, D., Valenzuela, A., Pía, M., et al. (2019). “Puma concolor,” in Categorización 2019 de los mamíferos de Argentina según su riesgo de extinción. Lista Roja de los mamíferos de Argentina, ed SAyDS-SAREM. Versión digital. Available online at: http://cma.sarem.org.ar (accessed May 20, 2021).
De Angelo, C., Paviolo, A., and Di Bitetti, M. (2011). Differential impact of landscape transformation on pumas (Puma concolor) and jaguars (Panthera onca) in the Upper Paraná Atlantic Forest. Divers. Distrib. 17, 422–436. doi: 10.1111/j.1472-4642.2011.00746.x
de Azevedo, F. C., Lemos, F. G., de Almeida, L. B., de Campos, C. B., de Mello Beisiegel, B., et al. (2013). Avaliação do risco de extinção da Onça-parda Puma concolor (Linnaeus, 1771) no Brasil. Biodiversidade Brasileira-BioBrasil 1, 107–121. doi: 10.37002/biobrasil.v%25vi%25i.377
Dijkstra, L., Hamilton, E., Lall, S., and Wahba, S. (2020). How Do We Define Cities, Towns, and Rural Areas? World Bank Blogs. Available online at: https://blogs.worldbank.org/sustainablecities/how-do-we-define-cities-towns-and-rural-areas (accessed April 30, 2021).
Ditmer, M. A., Stoner, D. C., Francis, C. D., Barber, J. R., Forester, J. D., Choate, D. M., et al. (2021). Artificial nightlight alters the predator-prey dynamics of an apex carnivore. Ecography 44, 149–161. doi: 10.1111/ecog.05251
Falchi, F., Cinzano, P., Duriscoe, D., Kyba, C. C., Elvidge, C. D., Baugh, K., et al. (2016). The new world atlas of artificial night sky brightness. Sci. Adv. 2, e1600377. doi: 10.1126/sciadv.1600377
Gates, J. E., and Gysel, L. W. (1978). Avian nest dispersion and fledging success in field-forest ecotones. Ecology 59, 871–883. doi: 10.2307/1938540
Grimm, N. B., Foster, D., Groffman, P., Grove, J. M., Hopkinson, C. S., Nadelhoffer, K. J., et al. (2008). The changing landscape: ecosystem responses to urbanization and pollution across climatic and societal gradients. Front. Ecol. Environ. 6, 264–272. doi: 10.1890/070147
Guerisoli, M. M., Caruso, N., Luengos Vidal, E. M., and Lucherini, M. (2019). Habitat use and activity patterns of Puma concolor in a human-dominated landscape of central Argentina. J. Mammal. 100, 202–211. doi: 10.1093/jmammal/gyz005
Guerisoli, M. M., Luengos Vidal, E., Caruso, N., Giordano, A. J., and Lucherini, M. (2020). Puma-livestock conflicts in the Americas: a review of the evidence. Mammal Rev. 51, 228–246. doi: 10.1111/mam.12224
Hijmans, R. J., van Eten, J., Sumner, M., Cheng, J., Baston, D., Bevan, A., et al. (2020). Package Raster. Geographic Data Analysis and Modeling, version 3.4.13. Available online at: http://CRAN.R-project.org/package=raster
Instituto Brasileiro do Meio Ambiente (2015). Instrução Normativa IBAMA N°7, de 30 de Abril de 2015. IBMA.
Iturralde, M. E. (2017). De medios e intermedias: medios de comunicación en ciudades intermedias. Iluminuras 18, 147–162. doi: 10.22456/1984-1191.79128
Johansson, Ö., Koehler, G., Rauset, G. R., Samelius, G., Andrén, H., Mishra, C., et al. (2018). Sex-specific seasonal variation in puma and snow leopard home range utilization. Ecosphere 9, e02371. doi: 10.1002/ecs2.2371
Jones, K. E., Bielby, J., Cardillo, M., Fritz, S. A., O'Dell, J., Orme, C. D. L., et al. (2009). PanTHERIA: a species-level database of life history, ecology, and geography of extant and recently extinct mammals: Ecological Archives E090-184. Ecology 90, 2648–2648. doi: 10.1890/08-1494.1
Lamb, C. T., Mowat, G., McLellan, B. N., Nielsen, S. E., and Boutin, S. (2017). Forbidden fruit: human settlement and abundant fruit create an ecological trap for an apex omnivore. J. Anim. Ecol. 86, 55–65. doi: 10.1111/1365-2656.12589
Latham, J., Cumani, R., Rosati, I., and Bloise, M. (2014). Global Land Cover Share (GLC-SHARE) Database Beta-Release Version 1.0-2014. FAO: Rome, Italy.
Lattes, A. E., Rodríguez, J., and Villa, M. (2017). “Population dynamics and urbanization in Latin America: Concepts and data limitations,” in New Forms of Urbanization (London: Routledge) 89, 111.
Lewis, J. S., Logan, K. A., Alldredge, M. W., Bailey, L. L., VandeWoude, S., and Crooks, K. R. (2015). The effects of urbanization on population density, occupancy, and detection probability of wild felids. Ecol. Appl. 25, 1880–1895. doi: 10.1890/14-1664.1
Linnaeus, C. (1771). Mantissa Plantarum altera generum editionis VI et speciorum editionis II. Stockholm: Laurentius Salvius.
Liu, C., White, M., and Newell, G. (2013). Selecting thresholds for the prediction of species occurrence with presence-only data. J. Biogeogr. 40, 778-789. doi: 10.1111/jbi.12058
Liu, Z., He, C., and Wu, J. (2016). The relationship between habitat loss and fragmentation during urbanization: an empirical evaluation from 16 world cities. PLoS ONE 11, e0154613. doi: 10.1371/journal.pone.0154613
Logan, K. A., and Sweanor, L. (2010). “Behavior and social organization of a solitary carnivore,” in Cougar: Ecology and Conservation, eds M. Hornocker and S. Negri (Chicago:The University of Chicago Press), 105–117.
Maletzke, B., Kertson, B., Swanson, M., Koehler, G., Beausoleil, R., Wielgus, R., et al. (2017). Cougar response to a gradient of human development. Ecosphere 8, e01828. doi: 10.1002/ecs2.1828
Manenti, R., Mori, E., Di Canio, V., Mercurio, S., Picone, M., Caffi, M., et al. (2020). The good, the bad and the ugly of COVID-19 lockdown effects on wildlife conservation: Insights from the first European locked down country. Biol. Cons. 249, 108728. doi: 10.1016/j.biocon.2020.108728
Mattson, D. J., and Clark, D. J. (2010). People, politics and cougar management. In: Cougar: ecology and conservation, eds M. Hornocker and S. Negri (Chicago:The University of Chicago Press), 206–220.
McDonald, R. I., Kareiva, P., and Forman, R. T. (2008). The implications of current and future urbanization for global protected areas and biodiversity conservation. Biol. Conserv. 141, 1695–1703. doi: 10.1016/j.biocon.2008.04.025
Miotto, R. A., Cervini, M., Begotti, R. A., and Galetti Jr, P. M. (2012). Monitoring a puma (Puma concolor) population in a fragmented landscape in southeast Brazil. Biotropica 44, 98–104. doi: 10.1111/j.1744-7429.2011.00772.x
Miotto, R. A., Cervini, M., Kajin, M., Begotti, R. A., and Galetti, P. M. (2014). Estimating puma Galette concolor population size in a human-disturbed landscape in Brazil, using DNA mark-recapture data. Oryx 48, 250–257. doi: 10.1017/S0030605312000841
Montaldo, H. H., Casas, E., Sterman Ferraz, J. B., Vega-Murillo, V. E., and Román-Ponce, S. I. (2012). Opportunities and Challenges From the Use of Genomic Selection for Beef Cattle Breeding in Latin America. Lincoln: Publications from USDA-ARS/UNL Faculty, 822
Moss, W. E., Alldredge, M. W., Logan, K. A., and Pauli, J. N. (2016). Human expansion precipitates niche expansion for an opportunistic apex predator (Puma concolor). Sci. Rep. 6, 1–5. doi: 10.1038/srep39639
Nielsen, C., Thompson, D., Kelly, M., and Lopez-Gonzalez, C. A. (2015). Puma concolor (errata version published in 2016). Red List Threatened Species 2015: e.T18868A97216466. doi: 10.2305/IUCN.UK.2015-4.RLTS.T18868A50663436.en
Noss, R. F., Quigley, H. B., Hornocker, M. G., Merrill, T., and Paquet, P. C. (1996). Conservation biology and carnivore conservation in the Rocky Mountains. Conserv. Biol. 10, 949–963. doi: 10.1046/j.1523-1739.1996.10040949.x
Nyhus, P. J. (2016). Human-wildlife conflict and coexistence. Annu. Rev.Env. Resour. 41, 143–171. doi: 10.1146/annurev-environ-110615-085634
Ordeñana, M. A., Crooks, K. R., Boydston, E. E., Fisher, R. N., Lyren, L. M., Siudyla, et al. (2010). Effects of urbanization on carnivore species distribution and richness. J. Mammal. 91, 1322–1331. doi: 10.1644/09-MAMM-A-312.1
Phillips, S. J., Anderson, R. P., and Schapire, R. E. (2006). Maximum entropy modeling of species geographic distributions. Ecol. Modell. 190:231–259. doi: 10.1016/j.ecolmodel.2005.03.026
Pratas-Santiago, L. P., Gonçalves, A. L., Nogueira, A. J., and Spironello, W. R. (2017). Dodging the moon: the moon effect on activity allocation of prey in the presence of predators. Ethology 123, 467–474. doi: 10.1111/eth.12617
Prugh, L. R., and Golden, C. D. (2014). Does moonlight increase predation risk? Meta-analysis reveals divergent responses of nocturnal mammals to lunar cycles. J. Anim. Ecol. 83, 504–514. doi: 10.1111/1365-2656.12148
Quigley, H., and Hornocker, M. (2010). “Cougar population dynamics,” in: Cougar: ecology and conservation,” eds M. Hornocker and S. Negri (Chicago: The University of Chicago Press) 58–75.
R Development Core Team (2020). R: A Language and Environment for Statistical Computing. Vienna, Austria: R Foundation for Statistical Computing.
Ramírez-Álvarez, D., Napolitano, C., and Salgado, I. (2021). Puma (Puma concolor) in the Neighborhood? Records near human settlements and insights into human-carnivore coexistence in Central Chile. Animals 11, 965. doi: 10.3390/ani11040965
Reperant, L. A., Hegglin, D., Tanner, I., Fischer, C., and Deplazes, P. (2009). Rodents as shared indicators for zoonotic parasites of carnivores in urban environments. Parasitology 136, 329–337. doi: 10.1017/S0031182008005428
Riley, S. P., Serieys, L. E., Pollinger, J. P., Sikich, J. A., Dalbeck, L., Wayne, R. K., et al. (2014). Individual behaviors dominate the dynamics of an urban mountain lion population isolated by roads. Curr. Biol. 24, 1989–1994. doi: 10.1016/j.cub.2014.07.029
Robinson, T. P., Wint, G. W., Conchedda, G., Van Boeckel, T. P., Ercoli, V., Palamara, et al. (2014). Mapping the global distribution of livestock. PloS ONE 9, e96084. doi: 10.1371/journal.pone.0096084
Saremi, N. F., Supple, M. A., Byrne, A., Cahill, J. A., Coutinho, L. L., Dalén, L., et al. (2019). Puma genomes from North and South America provide insights into the genomic consequences of inbreeding. Nat. Commun. 10, 1–10. doi: 10.1038/s41467-019-13096-3
SEDAC (2018). Center for International Earth Science Information Network - CIESIN Columbia University. Gridded Population of the World, Version 4 (GPWv4): Population Density, Revision 11. Palisades, NY: NASA Socioeconomic Data and Applications Center (SEDAC).
Seitz, V. P., Carrara, R., Puig, S., and Vizcaíno, S. F. (2017). Environmental factors affecting the distribution of three armadillo species (Xenarthra, Dasypodidae) in Argentina. Mammalia 81, 245–256. doi: 10.1515/mammalia-2015-0084
Shaw, H. (2010). “Death of a towncat,” in Cougar: Ecology and Conservation, eds M. Hornocker and S. Negri (Chicago and London: The University of Chicago Press), 175–176.
Soria-Díaz, L., Monroy-Vilchis, O., and Zarco-González, Z. (2016). Activity pattern of puma (Puma concolor) and its main prey in central Mexico. Anim. Biol. 66, 13–20. doi: 10.1163/15707563-00002487
Sweanor, L. L., and Logan, K. A. (2010). “Cougar-human interactions,” in Cougar: Ecology and Conservation, eds. M. Hornocker and S. Negri (Chicago: The University of Chicago Press), 190–205.
Trumbo, D. R., Salerno, P. E., Logan, K. A., Alldredge, M. W., Gagne, R. B., Kozakiewicz, C. P., et al. (2019). Urbanization impacts apex predator gene flow but not genetic diversity across an urban-rural divide. Mol. Biol. 28, 4926–4940. doi: 10.1111/mec.15261
United Nations Department of Economic and Social Affairs Population Division (2019). World Urbanization Prospects: The 2018 Revision (ST/ESA/SER.A/420). New York: UN.
van der Meer, E., Fritz, H., Blinston, P., and Rasmussen, G. S. (2014). Ecological trap in the buffer zone of a protected area: effects of indirect anthropogenic mortality on the African wild dog Lycaon pictus. Oryx 48, 285–293. doi: 10.1017/S0030605312001366
Vardi, R., Berger-Tal, O., and Roll, U. (2021). iNaturalist insights illuminate COVID-19 effects on large mammals in urban centers. Biol. Conserv. 254, 108953. doi: 10.1016/j.biocon.2021.108953
Weldon, A. J., and Haddad, N. M. (2005). The effects of patch shape on Indigo Buntings: evidence for an ecological trap. Ecology 86, 1422–1431. doi: 10.1890/04-0913
Wilmers, C. C., Wang, Y., Nickel, B., Houghtaling, P., Shakeri, Y., Allen, M. L., et al. (2013). Scale dependent behavioral responses to human development by a large predator, the puma. PLoS ONE 8, e60590. doi: 10.1371/journal.pone.0060590
Wint, W., and Robinson, T. (2007). Gridded Livestock of the World 2007 (No. FAO 636.2 W784 2007). Geneva: FAO.
World Bank (2019). United Nations, Department of Economic and Social Affairs, Population Division. World Urbanization Prospects: The 2018 Revision (ST/ESA/SER.A/420). New York: United Nations.
Keywords: carnivore, cities, night lights, rural areas, urbanization in Latin America
Citation: Guerisoli MdlM and Schiaffini MI (2022) “I Did, I Did Taw a Puddy Tat!” Pumas in Urban Ecosystems of Latin America: A Review of the Mediatic Information. Front. Conserv. Sci. 3:739026. doi: 10.3389/fcosc.2022.739026
Received: 09 July 2021; Accepted: 08 April 2022;
Published: 24 May 2022.
Edited by:
Silvio Marchini, University of São Paulo, BrazilReviewed by:
Jennifer Bond, Charles Sturt University, AustraliaNuno Miguel Negroes Soares, University of Aveiro, Portugal
Copyright © 2022 Guerisoli and Schiaffini. This is an open-access article distributed under the terms of the Creative Commons Attribution License (CC BY). The use, distribution or reproduction in other forums is permitted, provided the original author(s) and the copyright owner(s) are credited and that the original publication in this journal is cited, in accordance with accepted academic practice. No use, distribution or reproduction is permitted which does not comply with these terms.
*Correspondence: María de las Mercedes Guerisoli, bWFyaWFkZWxhc21lcmNlZGVzZ3Vlcmlzb2xpQGdtYWlsLmNvbQ==
 María de las Mercedes Guerisoli
 Mauro Ignacio Schiaffini