- 1Department of Science and Technology Teaching, China University of Political Science and Law, Beijing, China
- 2College of Artificial Intelligence, Guangxi University for Nationalities, Nanning, China
- 3Guangxi Key Laboratories of Hybrid Computation and Integrated Circuit (IC) Design Analysis, Nanning, China
Introduction: The development of the Internet has made life much more convenient, but forms of network intrusion have become increasingly diversified and the threats to network security are becoming much more serious. Therefore, research into intrusion detection has become very important for network security.
Methods: In this paper, a clustering algorithm based on the symbiotic-organism search (SOS) algorithm and a Kohonen neural network is proposed.
Results: The clustering accuracy of the Kohonen neural network is improved by using the SOS algorithm to optimize the weights in the Kohonen neural network.
Discussion: Our approach was verified with the KDDCUP99 network intrusion data. The experimental results show that SOS-Kohonen can effectively detect intrusion. The detection rate was higher, and the false alarm rate was lower.
1. Introduction
With the rapid spread of the Internet, there has also been a rapid development of online systems for shopping, banking, making payments, stock trading, and so on. However, due to the openness of the network, forms of network intrusion are becoming increasingly diversified, so that networks and systems are experiencing ever more serious threats. Therefore, detecting network intrusion has become a critical issue in network security. In recent years, increasing attention has been paid by scholars all over the world to intrusion detection. The aim is to identify any behavior that could compromise the integrity, confidentiality, or availability of the system. It can be defined as identifying the people accessing a computer system (Shitharth and Winston, 2017). Current methods of network intrusion detection can be divided into two categories: misuse intrusion detection and abnormal intrusion detection. The capability of misuse intrusion detection mainly depends on the completeness of the detection knowledge base. Its shortcoming is that it cannot find unknown forms of intrusion. Abnormal intrusion detection is based on identifying a difference between the detected and acceptable behavior.
Due to their continuous development, various swarm intelligence algorithms have been applied to intrusion detection, such as the genetic algorithm (Mabu et al., 2011), immune algorithm (Zhang et al., 2014), ant colony optimization (Feng et al., 2014), and so on. However, as the “no free lunch” theorem (Wolpert and Macready, 1997) argues, none of these group intelligence algorithms is suitable for detecting all forms of intrusion. Thus, finding a better algorithm is still a hot topic for scholars in various countries.
In recent years, various meta-heuristic algorithms have been proposed, such as the crow search algorithm (Askarzadeh, 2016; Hussien et al., 2021), monarch butterfly optimization (Wang et al., 2019), lightning search algorithm (Shareef et al., 2015; Abualigah et al., 2021), water evaporation optimization (Kaveh and Bakhshpoori, 2016), Kohonen neural network (Wehrens and Buydens, 2007; De Almeida et al., 2013), symbiotic-organism search (SOS) algorithm (Cheng and Prayogo, 2014; Ezugwua and Prayogo, 2019; Chakraborty et al., 2022), bat algorithm (BA) (Xinshe, 2010; Shehab et al., 2022), cuckoo algorithm (CS) (Yang and Deb, 2009), flower pollination algorithm (FPA) (Yang, 2012; Fouad and Gao, 2019), grey wolf optimizer (GWO) (Mirjalili et al., 2014), particle swarm algorithm (PSO) (Kennedy and Eberhart, 1995; Jordehi and Jasni, 2015), Harris hawk optimization(Hussien et al., 2022), Quantum-inspired deep neural networks (Shi et al., 2021), Gaining–sharing knowledge based algorithm (Mohamed et al., 2020) and so on.
This paper proposes a clustering algorithm based on the SOS algorithm and a Kohonen neural network. The clustering accuracy of Kohonen neural network was improved by using the SOS algorithm to optimize the weights of the Kohonen neural network. SOS-Kohonen was tested with the KDDCUP99 network intrusion data. The experimental results show that it can effectively detect intrusion detection. Compared to other standard methods, the detection rate was higher and the false alarm rate was lower.
The remainder of the paper is organized as follows. Section 2 describes the structure of a Kohonen neural network. Section 3 introduces a basic SOS algorithm. Section 4 considers the use of the SOS-Kohonen algorithm for intrusion detection. Section 5 describes the data preprocessing method. The simulation experiments and results are presented in Sections 6, 7 concludes and discusses future work.
2. Kohonen neural network
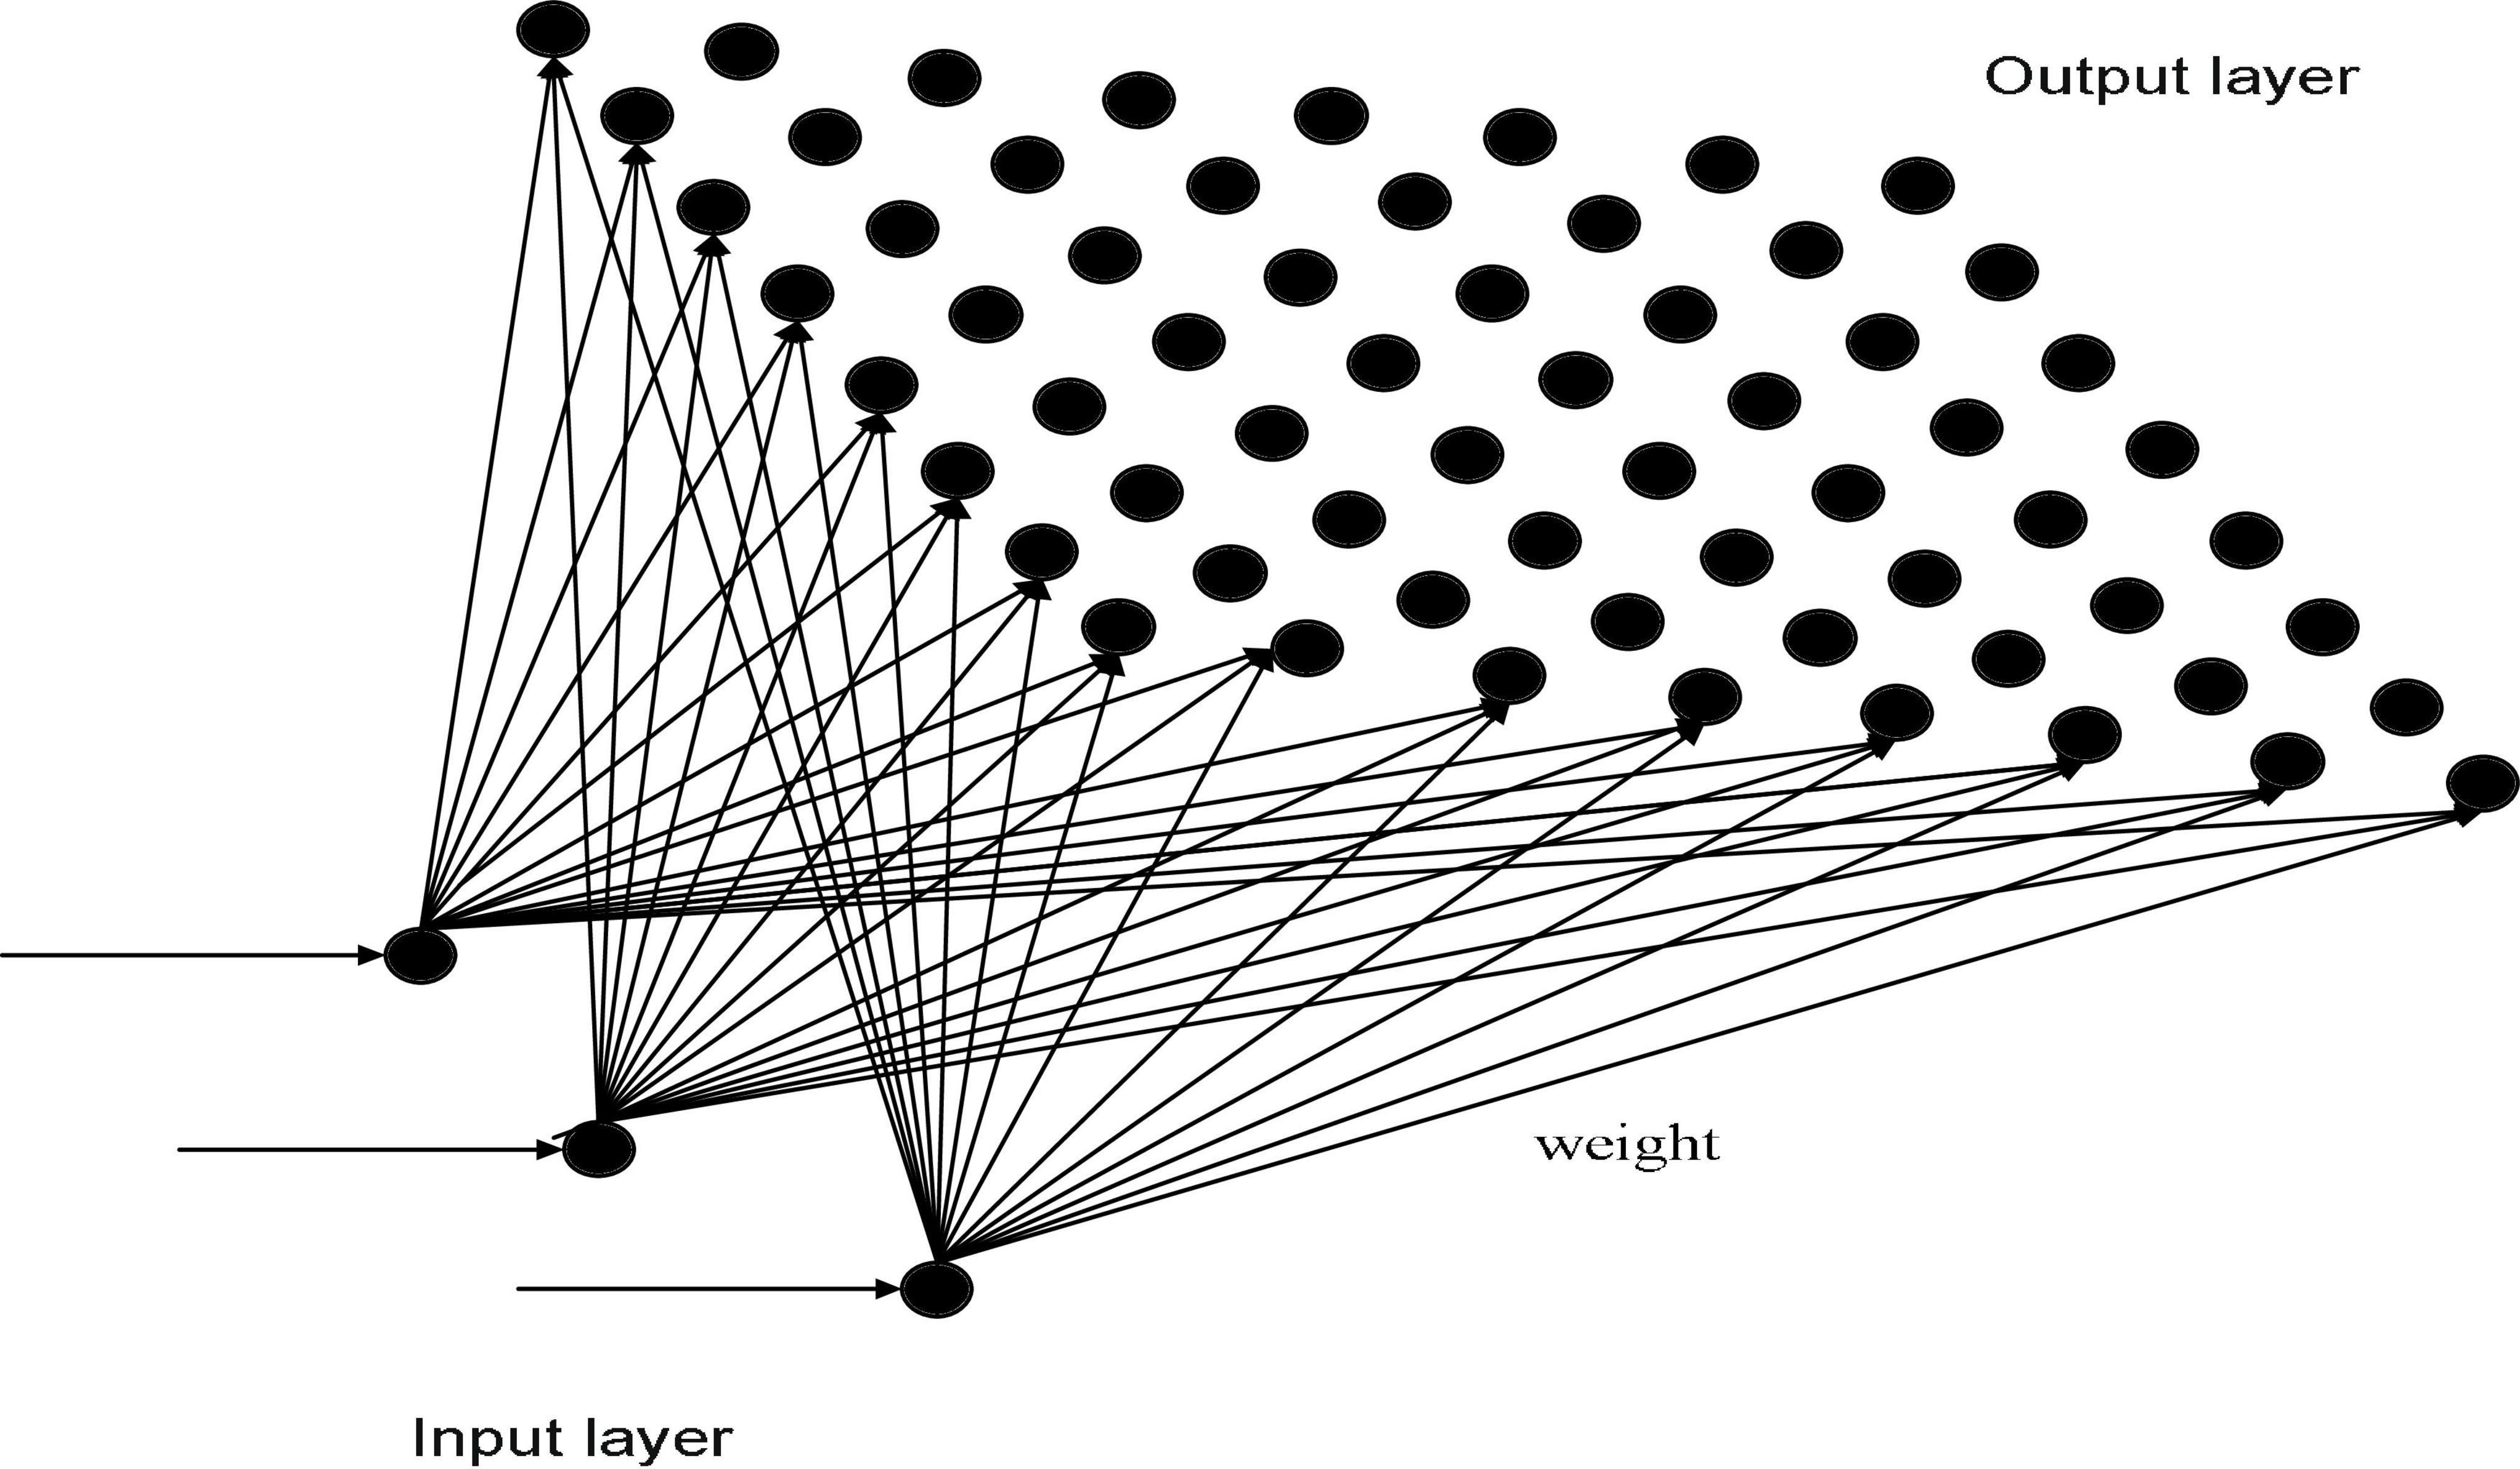
Finnish professor Teuvo Kohonen proposed an unsupervised self-organizing competitive neural network called a Kohonen neural network. It can achieve automatic clustering by using a self-organizing feature mapping to adjust network weights. A Kohonen neural network (De Almeida et al., 2013) consists of two feedforward layers, namely an input layer and an output layer. The input layer is mapped into a two-dimensional response mesh in the output layer based on weights. The topology of a Kohonen neural network is shown in Figure 1.
In a Kohonen neural network, the Euclidean distance of each neuron is obtained by calculating the input eigenvector for the corresponding output layer. The neuron with the smallest Euclidean distance is the superior neuron, and its connection weights are adjusted to make it closer to the original input vector. The area adjacent to the winning neuron is also adjusted by the connection weight to make it closer to the input vector.
In the training phase, each input vector Xs is input into the network, and only those winning neurons closest to the current weight vector of the input receive a corresponding stimulus. The pattern vector Xs is calculated as the minimum Euclidean distance from the selected winning neurons:
where c represents the winning neuron and xsi represents the ith coordinate of the input vector. In addition, the level of the ith weight of neuron j is denoted by wji. The number of neurons in a Kohonen level is denoted by N×N. Once the winning neuron is selected, the corresponding weight wji of each neuron j in the layer is updated according to the difference between the original weight and the input neuron, as follows:
where the learning rate is η, the weight of the previous generation of wji is , and the number of neurons between neuron j and the superior neuron is represented by the topological distance dr. The size of the adjacent area dmax decreases from the coverage of the entire network to the winning neurons as training progresses. In addition, the learning rate η changes during training:
where ntot represents the total number of iterations; nepoch represents the current iteration times.
3. SOS algorithm
In nature, some organisms establish symbiotic relationship, which strengthens their ability to adapt to the environment, thereby enhancing their viability. The SOS algorithm (Cheng and Prayogo, 2014) simulates the symbiotic relationships found in nature. Each organism in the ecosystem passes through three phases in the SOS algorithm: mutualism, commensalism, and parasitism. In each phase, the organism is assumed to be in a symbiotic relationship with another random organism. The interactions between the pairs of organisms are used to adjust the fitness value. The result is an optimal solution to the problem. The process is described in the following sections.
3.1. Mutualist phase
In nature, the symbiosis between bees and flowers provides a mutual benefit, as both organisms can benefit. The formulae for updating organisms in mutually beneficial symbiosis are as follows:
where Xi and Xj represent two of the organisms in the ecosystem. Xbest represent the best organism; Mutual_Vector represents the relationship between two organisms. The benefit factors are BF1 and BF2, which have a value of 0 or 1. The unequal benefits obtained by the two parties from the symbiotic relationship are controlled by the benefit factors.
3.2. Commensal phase
An example of commensalism in nature is that between a remora and a shark. The remora benefits while the shark is neither harmed nor benefits. This symbiotic relationship is called partiality. The formula for the commensalism phase is
where Xi is the party that makes a unilateral gain and Xj is the party that is not harmed.
3.3. Parasitic phase
In nature, parasitism occurs between mosquitoes and humans. The mosquitoes benefit, whereas the humans are hurt. In this stage, some of the dimensions of Xi are randomly selected and replaced by random values within the search space to form the artificial parasiteParasite_Vector. In the population randomly selected, we compare the fitness of an individualXj(j≠i) with Parasite_Vector, and keep the optimal organism as the new Xj.
4. Proposed SOS-Kohonen algorithm for intrusion detection
The SOS algorithm is based on the natural phenomenon of symbiosis between various organisms. When a virus intrudes into a system, the relation between the system and the virus can be viewed as a symbiotic relationship between the virus data and the system data.
The initial weights of the Kohonen neural network are optimized with the SOS algorithm. The optimized Kohonen neural network can reduce the length of the error vector between the training sample and the weight vector. This process helps to avoid rigidity during training, which can improve the clustering ability of the Kohonen neural network. After SOS training, the Kohonen neural network identifies subclasses with similar input patterns. Each subclass is used to train a specific radial basis network, which results in a local adjustment of the weights of the radial basis network. This can reduce the training burden of the radial basis network and improve the classification of the sample. For a Kohonen neural network trained by a sample data set, only one neuron in the competing layer is activated. A radial basis network corresponding to the activated winning neurons is used as input. Currently, the only neuron in the output layer is the transient stability index.
The steps in SOS-Kohonen intrusion detection are as follows:
Step 1. Initialize the training data set, the number of symbiotic species, and the number of iterations.
Step 2. The initial weights w are adjusted according to the Euclidean distance between the sample vector and the initial weight in the mutualist phase, commensal phase, and parasitic phase of the SOS algorithm.
Step 3. The Kohonen neural network is trained according to the initial weight w optimized by the SOS algorithm.
Step 4. The distance between the competing layer neuron j and the input vector X is calculated:
Step 5. If the minimum distance has been reached, the competing layer neuron X, which matches the sample vector C, is the output neuron of the optimal matching.
Step 6. Adjust the node weight coefficients in node c and neighborhood vector x:
The positions of neurons c and t are denoted by posc and post, respectively. The distance between the two neurons is calculated in terms of norm(). η and r represent the learning rate and the neighborhood radius, respectively. They decrease linearly as the number of iterations increases.
Step 7. If the stopping condition is met stop, otherwise return to step 3.
Step 8. Read another test data set.
Step 9. Cluster the input test data set according to the trained weight W.
Step 10. Output the classification result.
Pseudocode corresponding to the steps of SOS-Kohonen intrusion detection is given in Algorithm 1.
Algorithm 1. SOS-Kohonen neural network for virus intrusion detection.
Initialize: Populate n organisms in the
ecosystem with random values
Input: Training data set
Calculate the initial weights w by
summing the points and output nodes of
the Kohonen neural network
Calculate the fitness of each organism
Identify the best organism (Xbest) in the
initial population
Define a stopping criterion (either a
fixed number of generations/iterations or
accuracy)
while (t < MaxGeneration)
for i = 1 to n
Choose organism j randomly other
than organism i
Determine the beneficial factor and
mutual vector via Eqs. (6)
Modify organisms Xi and Xj based on
their mutual relationship via Eqs. (4)
and (5)
Calculate new weights
Evaluate the fitness of the new
solution
Accept the new solution if the
fitness is better
End of mutualist phase
Commensal phase
Choose organism j randomly other
than organism i
Modify organism Xi with the assist
of organism Xj via Eq. (7)
Calculate new weights
Evaluate the fitness of the new
solution
Accept the new solution if the
fitness is better
End of commensal phase
Parasitic phase
Choose organism j randomly other
than organism i
Create a parasite (Parasite_Vector)
from organism Xi
Calculate the fitness of the new
organism
Kill organism j and replace it with
the parasite if its fitness is lower than
the parasite’s fitness
Calculate new weights
Evaluate the fitness of the new
solution
Accept the new solution if the
fitness is better
End of parasitism phase
Update the best organism
end for
t = t + 1
end while
Calculate the weight of the network
according to the individual training
weights w
Read another test data set
Cluster the input test data set based on
the trained weights
Output: Classification result
The detection processes of BA-Kohonen, CS-Kohonen, FPA-Kohonen, GWO-Kohonen, and PSO-Kohonen can be imitated by SOS-Kohonen.
5. Data preprocessing
In intrusion detection, the network data to be assessed have multiple attributes with inconsistent units of measurement. If such data are used directly for intrusion detection, the accuracy and speed will be reduced. Therefore, the input data are pretreated, that is, normalized. The specific preprocessing method is as follows:
(1) The data are standardized so that the mean of each attribute is 0 and the variance is 1. The attributes of the initial network data are denoted by xij, and and Sj represent the mean and variance of the jth dimension, respectively. The attributes are standardized as follows:
The normalized formula for (10) is as follows:
(2) Normalize formula (10) to the range [0, 1] is as follows:
6. Simulation experiments and analysis of results
To verify the effectiveness of SOS-Kohonen in detecting network intrusion by a virus, we ran two sets of tests with the proposed algorithm. The first verified the accuracy of SOS-Kohonen in classifying five types of virus. The second verified the ability of SOS-Kohonen to detect viruses hidden in normal data. The results for SOS-Kohonen were compared with results for Kohonen neural networks combined with one of five commonly used swarm intelligence algorithms: BA, CS, FPA, GWO, and PSO. The relevant parameters for these algorithms were set as follows:
BA: As in Ref. (Xinshe, 2010), r0 = 0.5,A = 0.5,α = 0.95,γ = 0.05.
CS: As in Ref.(Yang and Deb, 2009), β = 1.5, ρ0 = 1.5.
FPA: As in Ref. (Yang, 2012),ρ = 0.8.
GWO: As recommended in Ref. (Mirjalili et al., 2014), = 0 to 2.
PSO: Weight factor ω = 0.6,c1 = c2 = 2(Kennedy and Eberhart, 1995), and population size is 15.
SOS: As in Ref. (Cheng and Prayogo, 2014), population size is 15.
6.1. Experimental setup
The development environment for this test was MATLAB R2012a. The tests were run on an AMD Athlont (tm) II*4640 processor with 4 GB of memory.
6.2. Simulation of virus classification by SOS-Kohonen
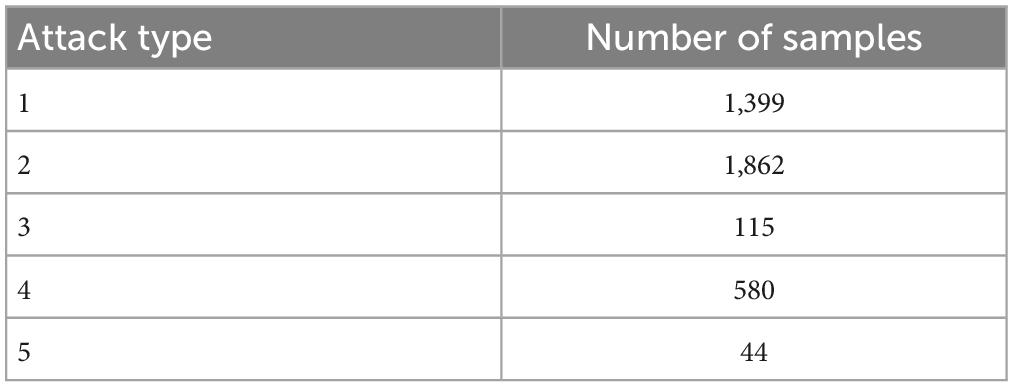
In this section, we tested the accuracy of SOS-Kohonen in virus classification. The standard network intrusion test data set contains five categories of virus data. We extracted 4000 training samples, as shown in Table 1 and Figure 2A. Each sample contained a 38-dimensional feature that is used to represent the different attributes of the network intrusion data. Attack type 5 had the fewest training samples and type 2 had the most.
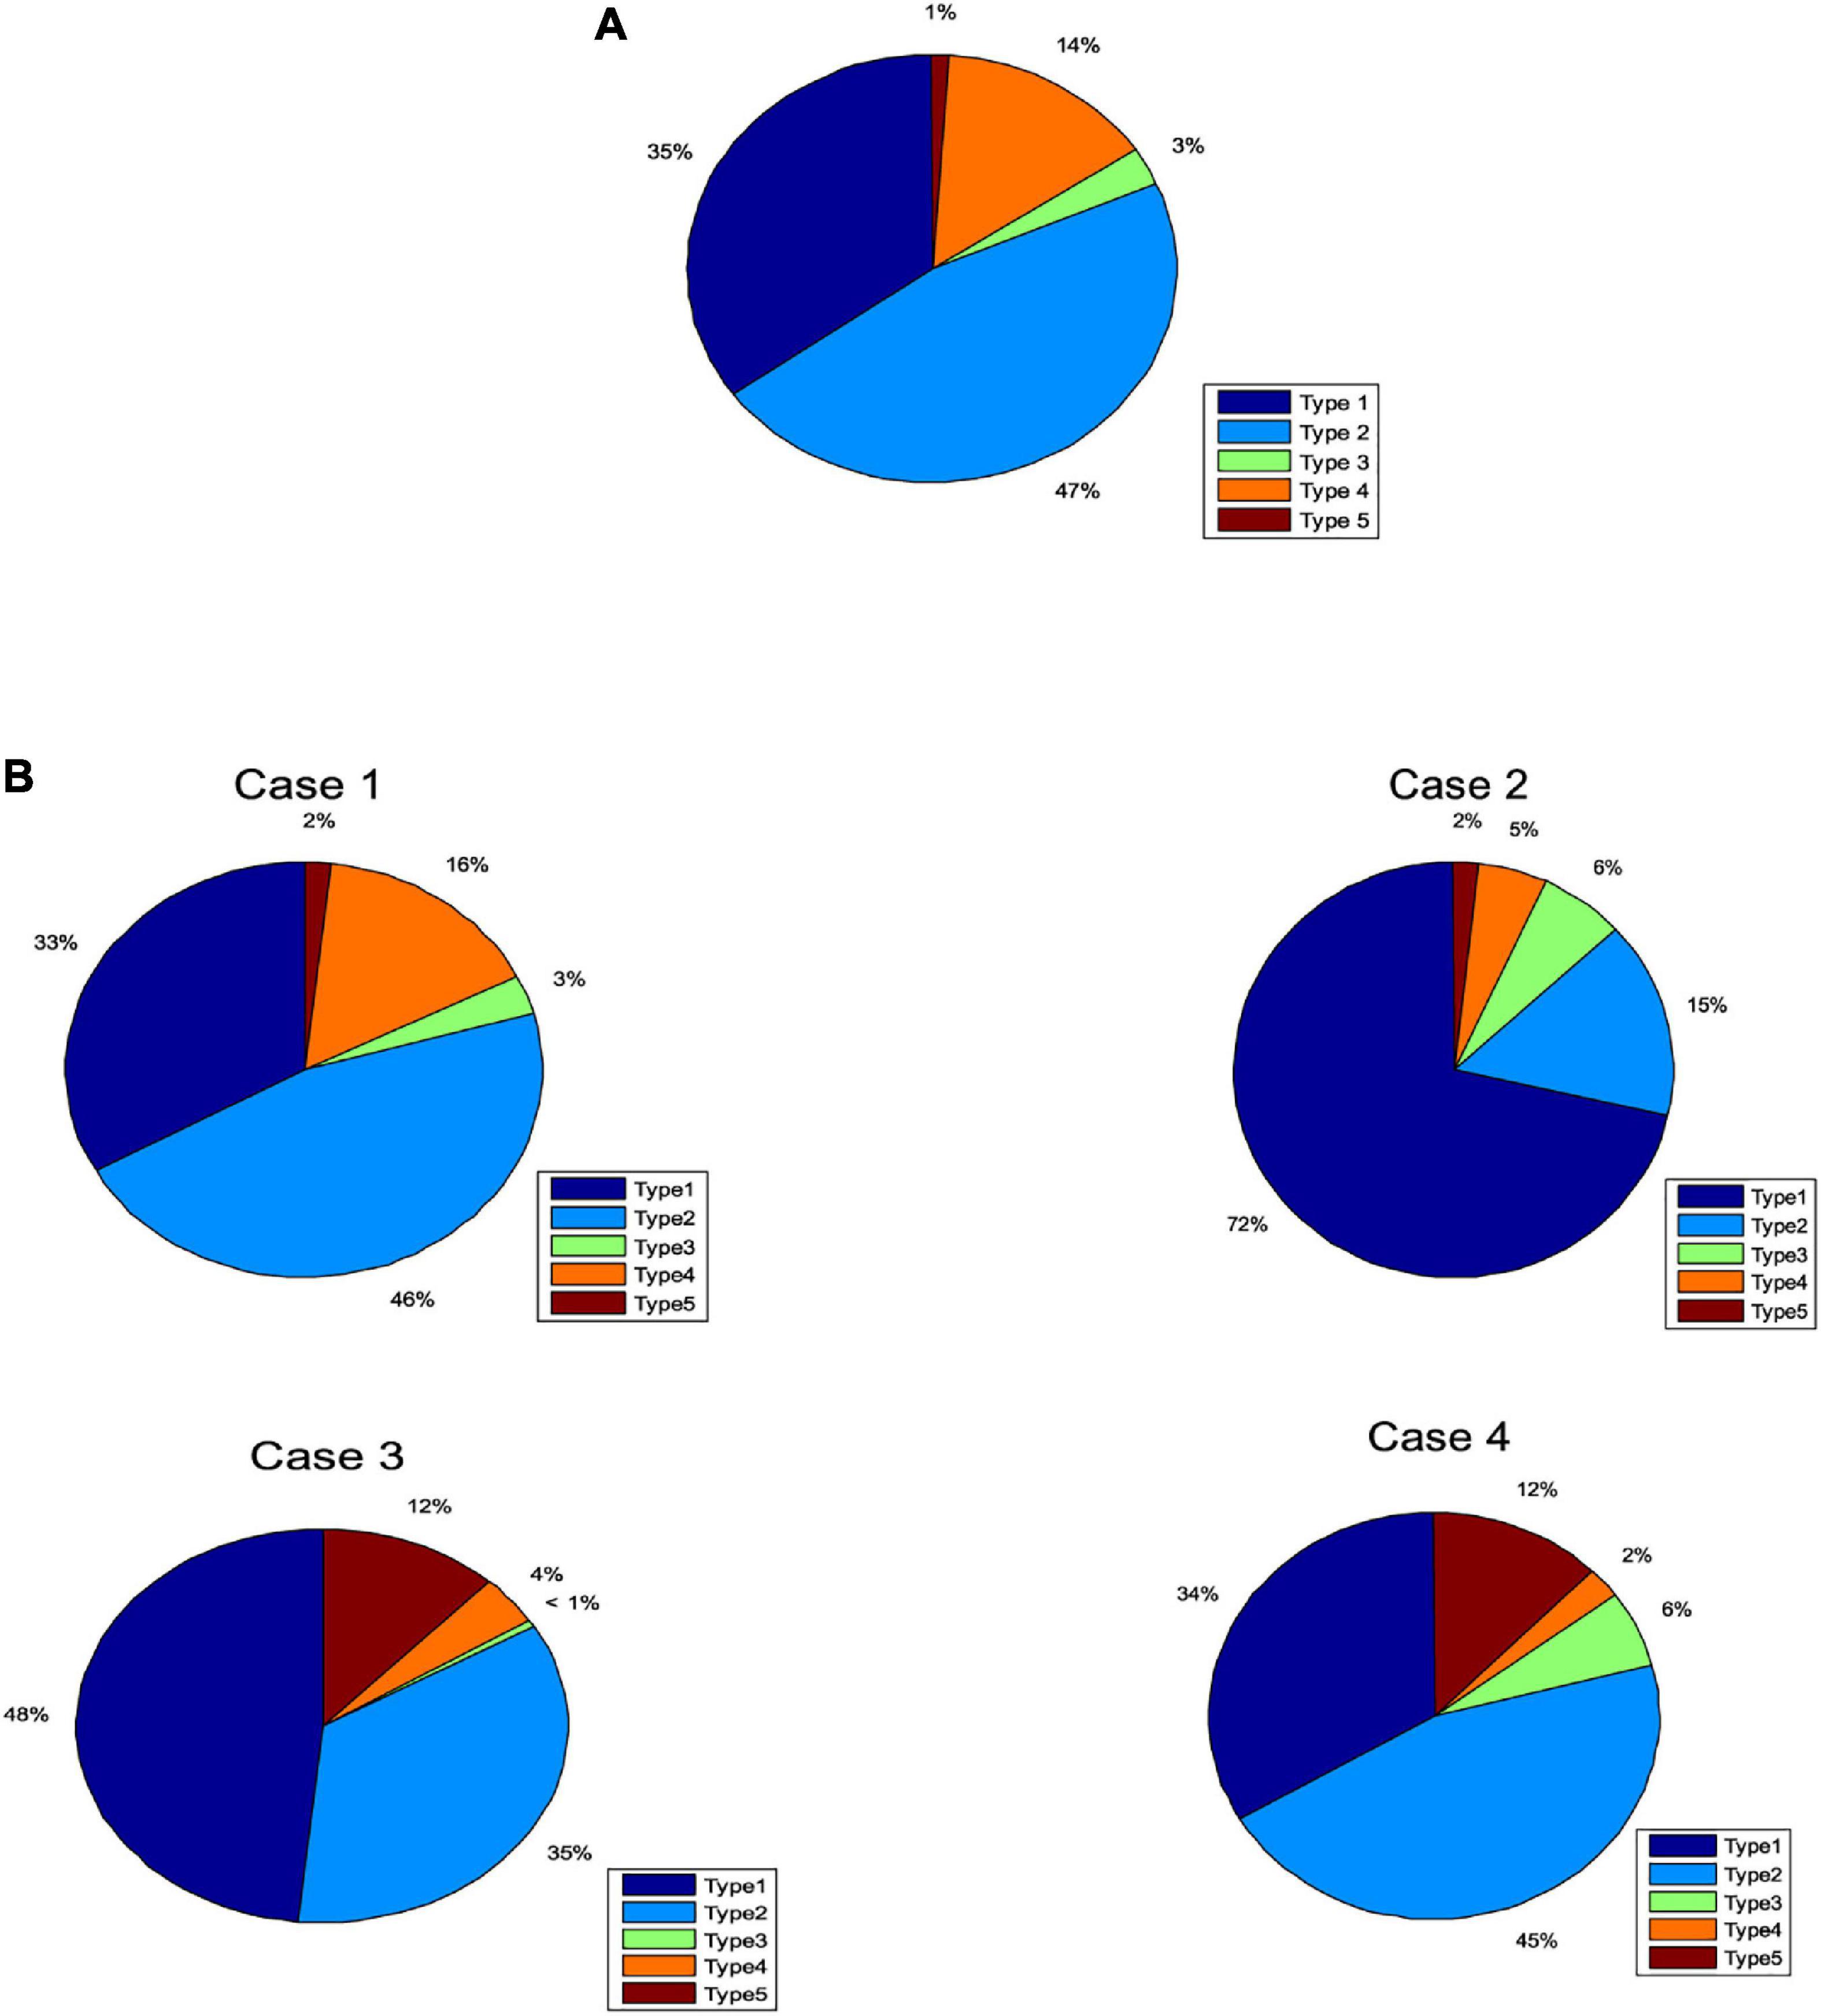
Figure 2. Percentages of each attack type for (A) training data set. (B) Four randomly selected cases.
Four subsets were randomly selected from the virus intrusion detection data set as test cases. The percentages for the five attack types in the four cases varied (Figure 2B). The number of samples in each case was different, as shown in Table 3.
For each case, we conducted 10 independent tests using each of the six group intelligence algorithms to determine the weights for the Kohonen neural network. It can be seen that the SOS-Kohonen algorithm has a preference better than BA-Kohonen, CS-Kohonen, FPA-Kohonen, GWO-Kohonen, or PSO-Kohonen, both in terms of optimal value and variance for the accuracy. It also had stronger robustness.
Figures 3C, G, K, O show the expected classification results for cases 1 to 4. Figures 3D, H, L, P show the actual results for these cases for SOS-Kohonen. Due to space constraints, we show the results only for the highest detection rate from the 10 independent runs. The detection rate is defined in Section “6.3. Simulation of virus detection by SOS-Kohonen.” The red circles indicate differences between the actual detection and the expected detection. Figures 3D, L, P have only one error, whereas Figure 3H has five.

Figure 3. Cases 1- 4 expected classification results are (C,G,K,O); actual classification results are (D,H,L,P); fitness evolution curves are (E,I,M,R); ANOVA test of optimal paths are (F,J,N,S); respectively.
Table 3 lists the detection rates for the six algorithms for the four cases. SOS-Kohonen had higher detection rates than the BA-Kohonen, CS-Kohonen, FPA-Kohonen, GWO-Kohonen, or PSO-Kohonen algorithms. It achieved an average detection rate of 99.4% in classifying intrusion data.
Figures 3E, I, M, R illustrate the convergence of the six algorithms. It can be seen that SOS converged fastest and with the highest accuracy. Figures 3F, J, N, S are variance maps for each algorithm. The SOS algorithm had the strongest stability and highest robustness compared to the other algorithms.
6.3. Simulation of virus detection by SOS-Kohonen
This section uses the internationally accepted KDDCUP99 (KDD Cup 1999 Data, 1999; MIT Lincoln Laboratory, 2009; Aggarwal and Sharma, 2015) data set to verify the detection performance of SOS-Kohonen. The KDDCUP99 data set was established by the Lincoln Laboratory of the Massachusetts Institute of Technology. The data set was collected using tcpdump from a simulated network environment over 9 weeks. This database has become a benchmark for network intrusion detection and can be used in comprehensive tests of the performance of intrusion detection algorithms. Attacks in the data set include denial of service attacks (DOS), scan attacks (probe), remote user unauthorized access attacks (U2L), and unauthorized use of local super-privilege access attacks (U2R). We apply the internationally accepted detection rate and false alarm rate as evaluation indicators, which are defined as follows (Ganapathy et al., 2012; Lin et al., 2015):
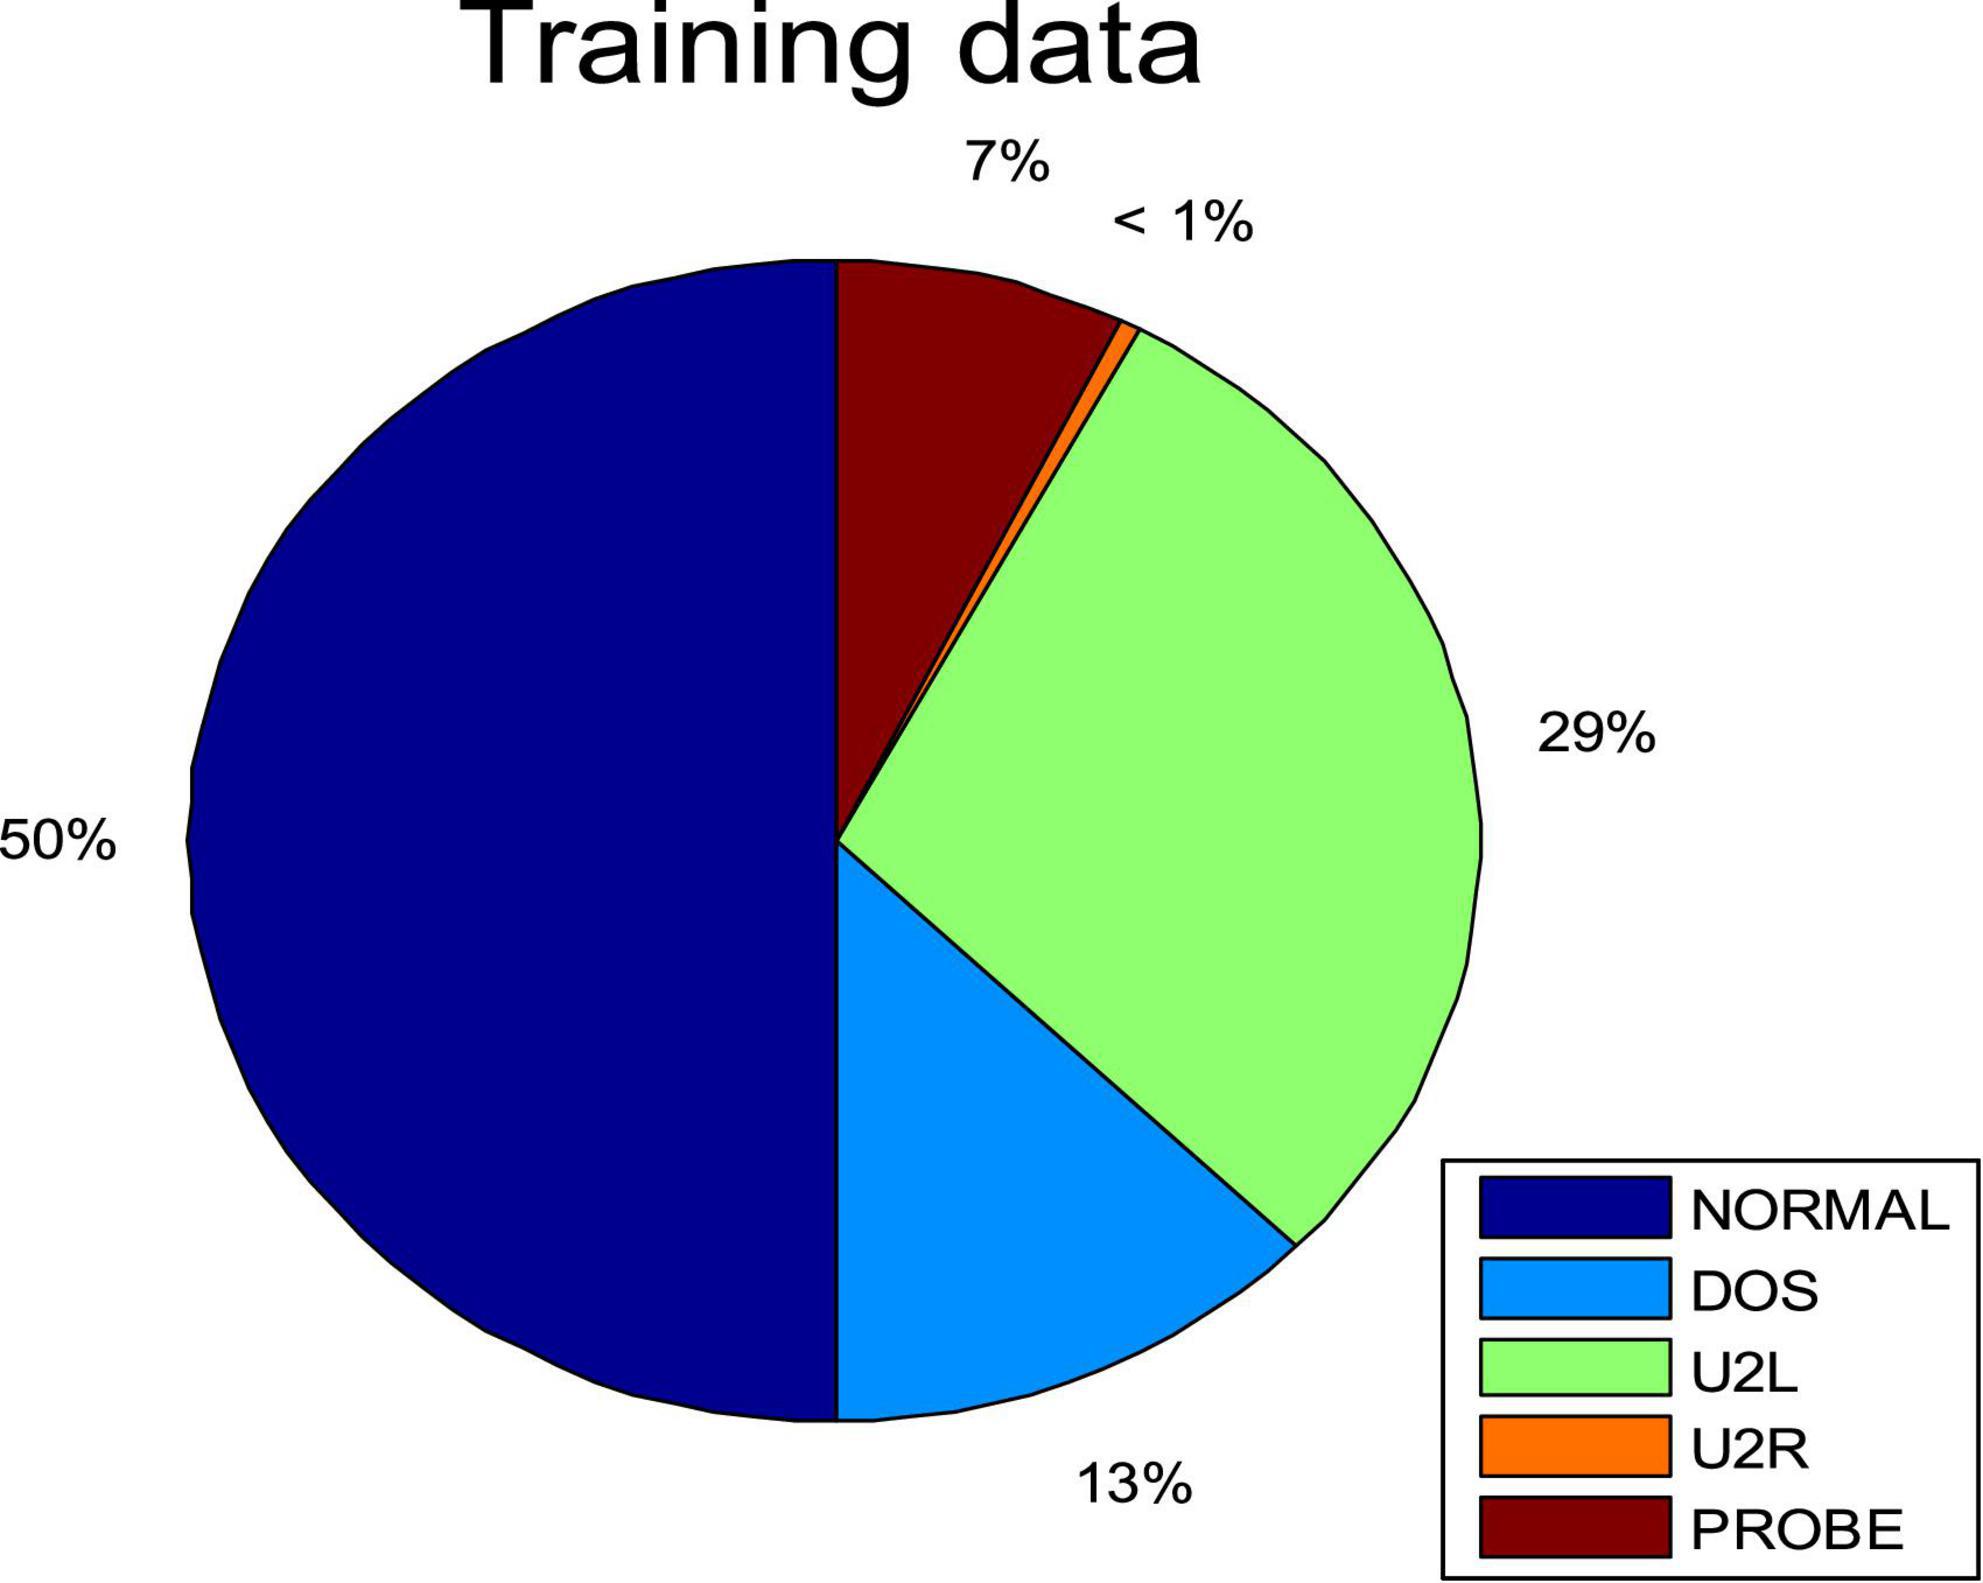
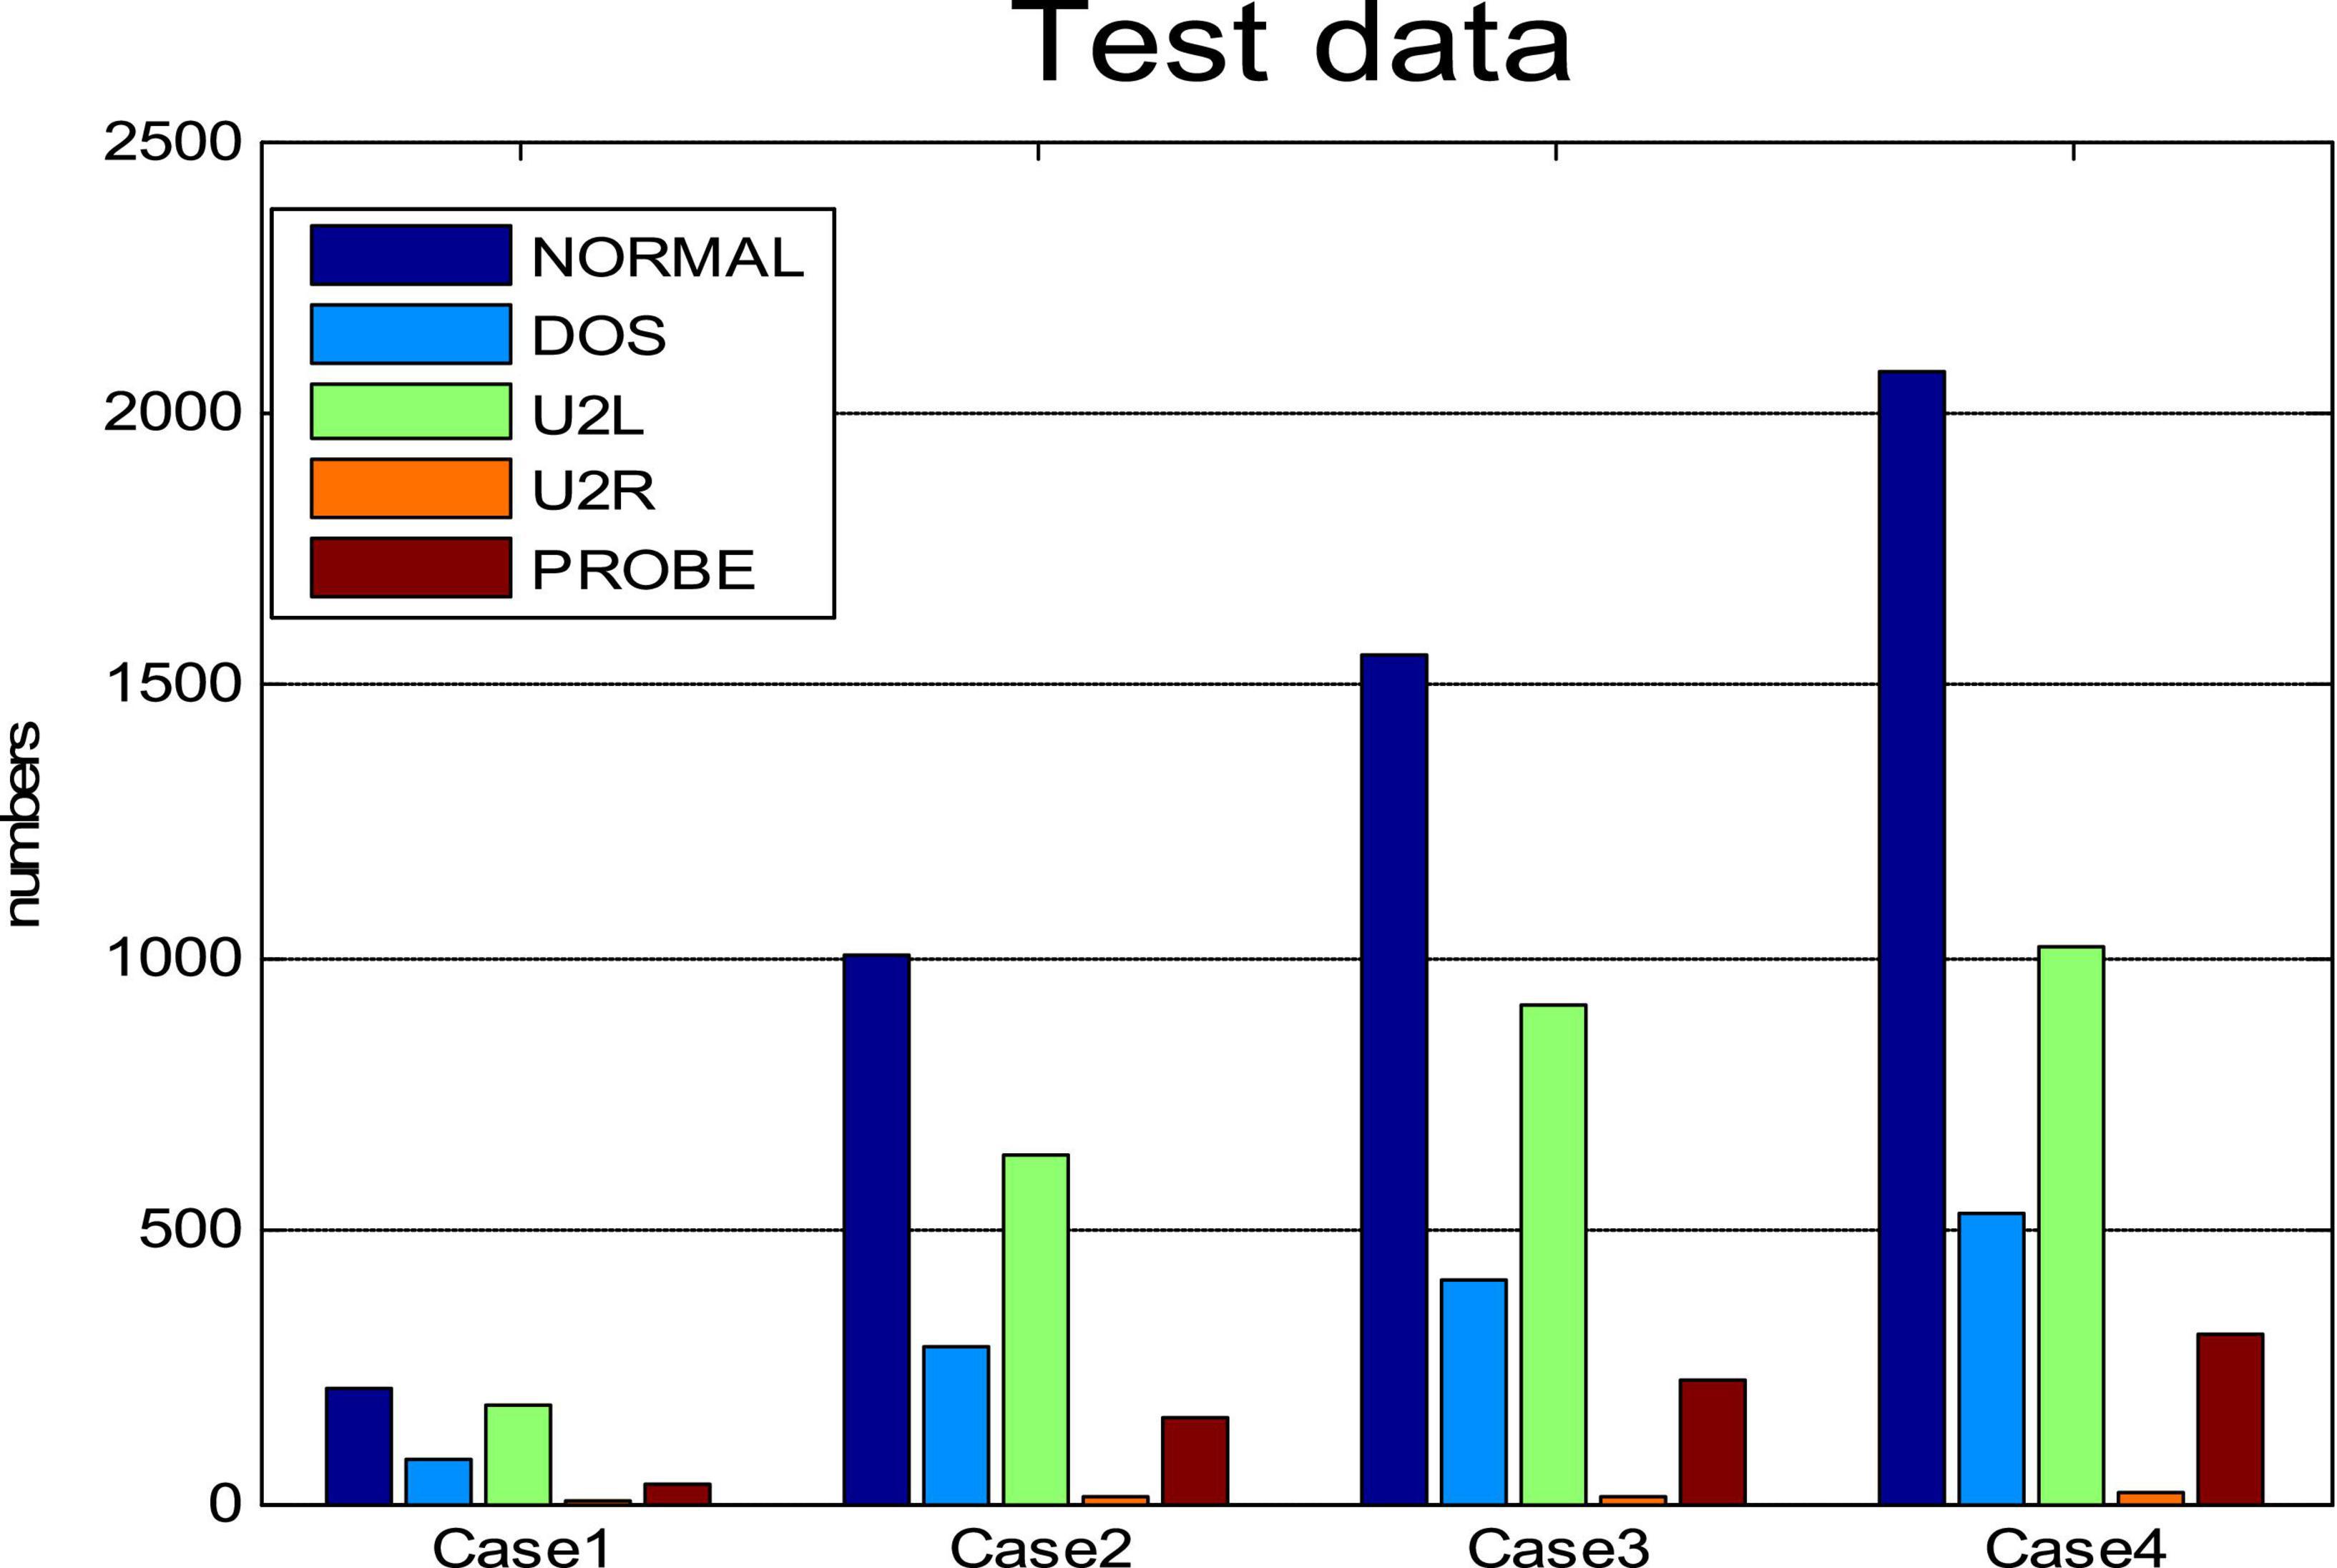
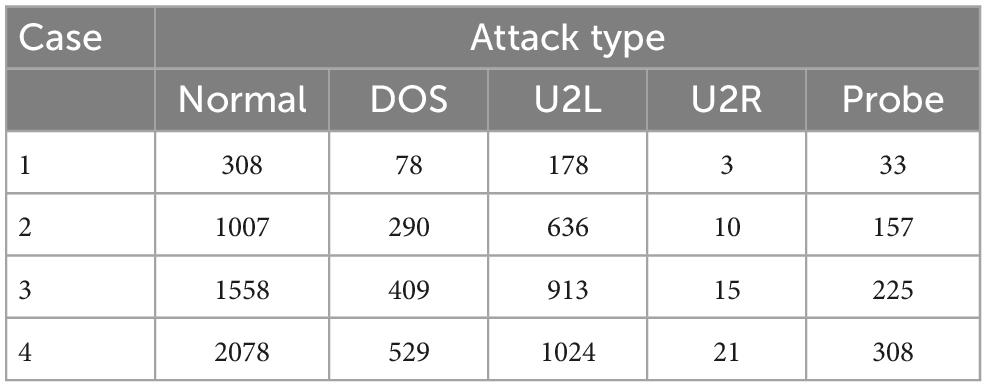
We randomly selected 6,000 samples as training data, including normal data and the four kinds of intrusion data. The percentages of these five types of data are given in Figure 4. Among them, normal samples were the most common and U2R samples the least common. We then randomly selected four subsets from the KDDCUP99 data set as test cases. The number of each attack type for each case are plotted in Figure 5 and listed in Table 4.
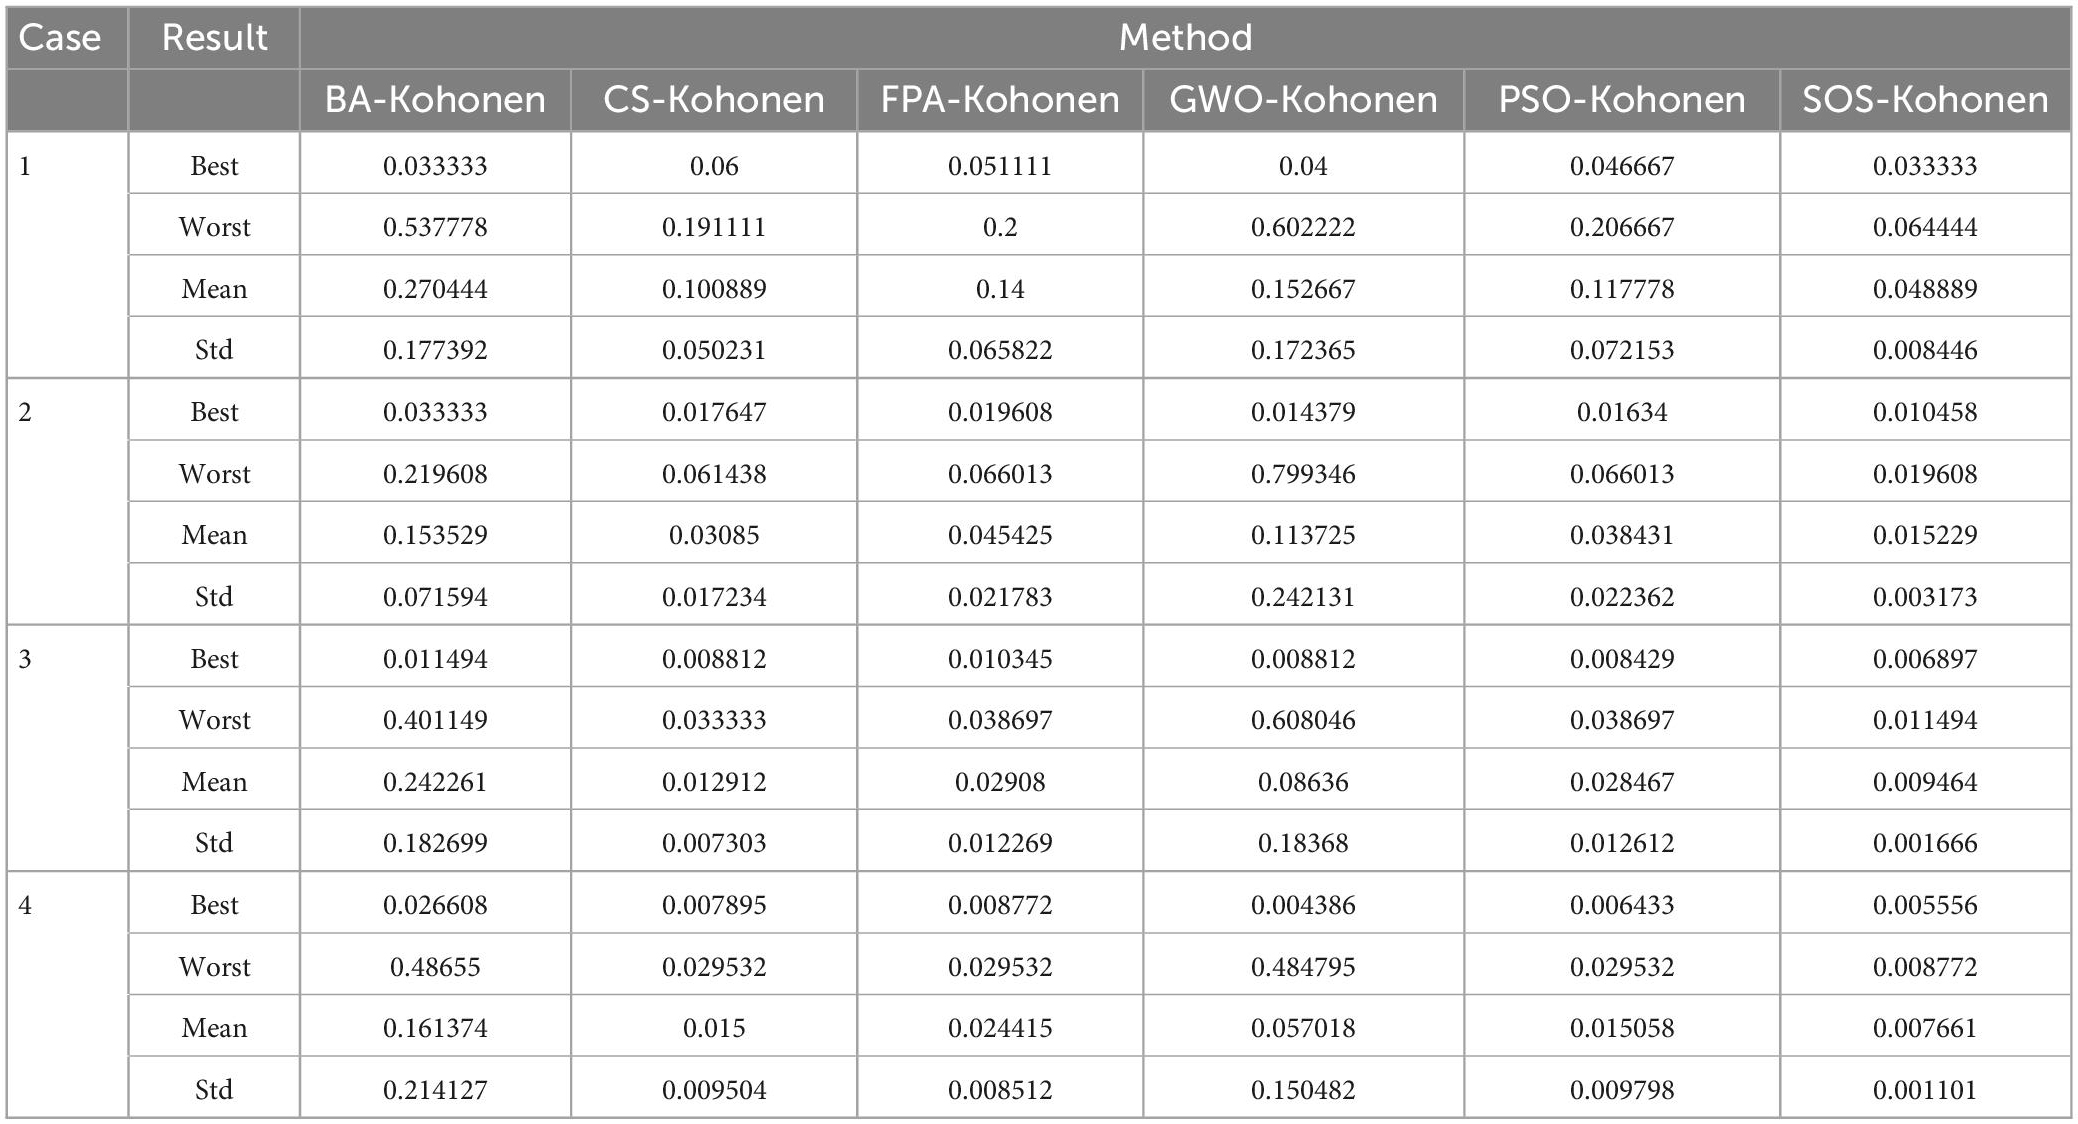
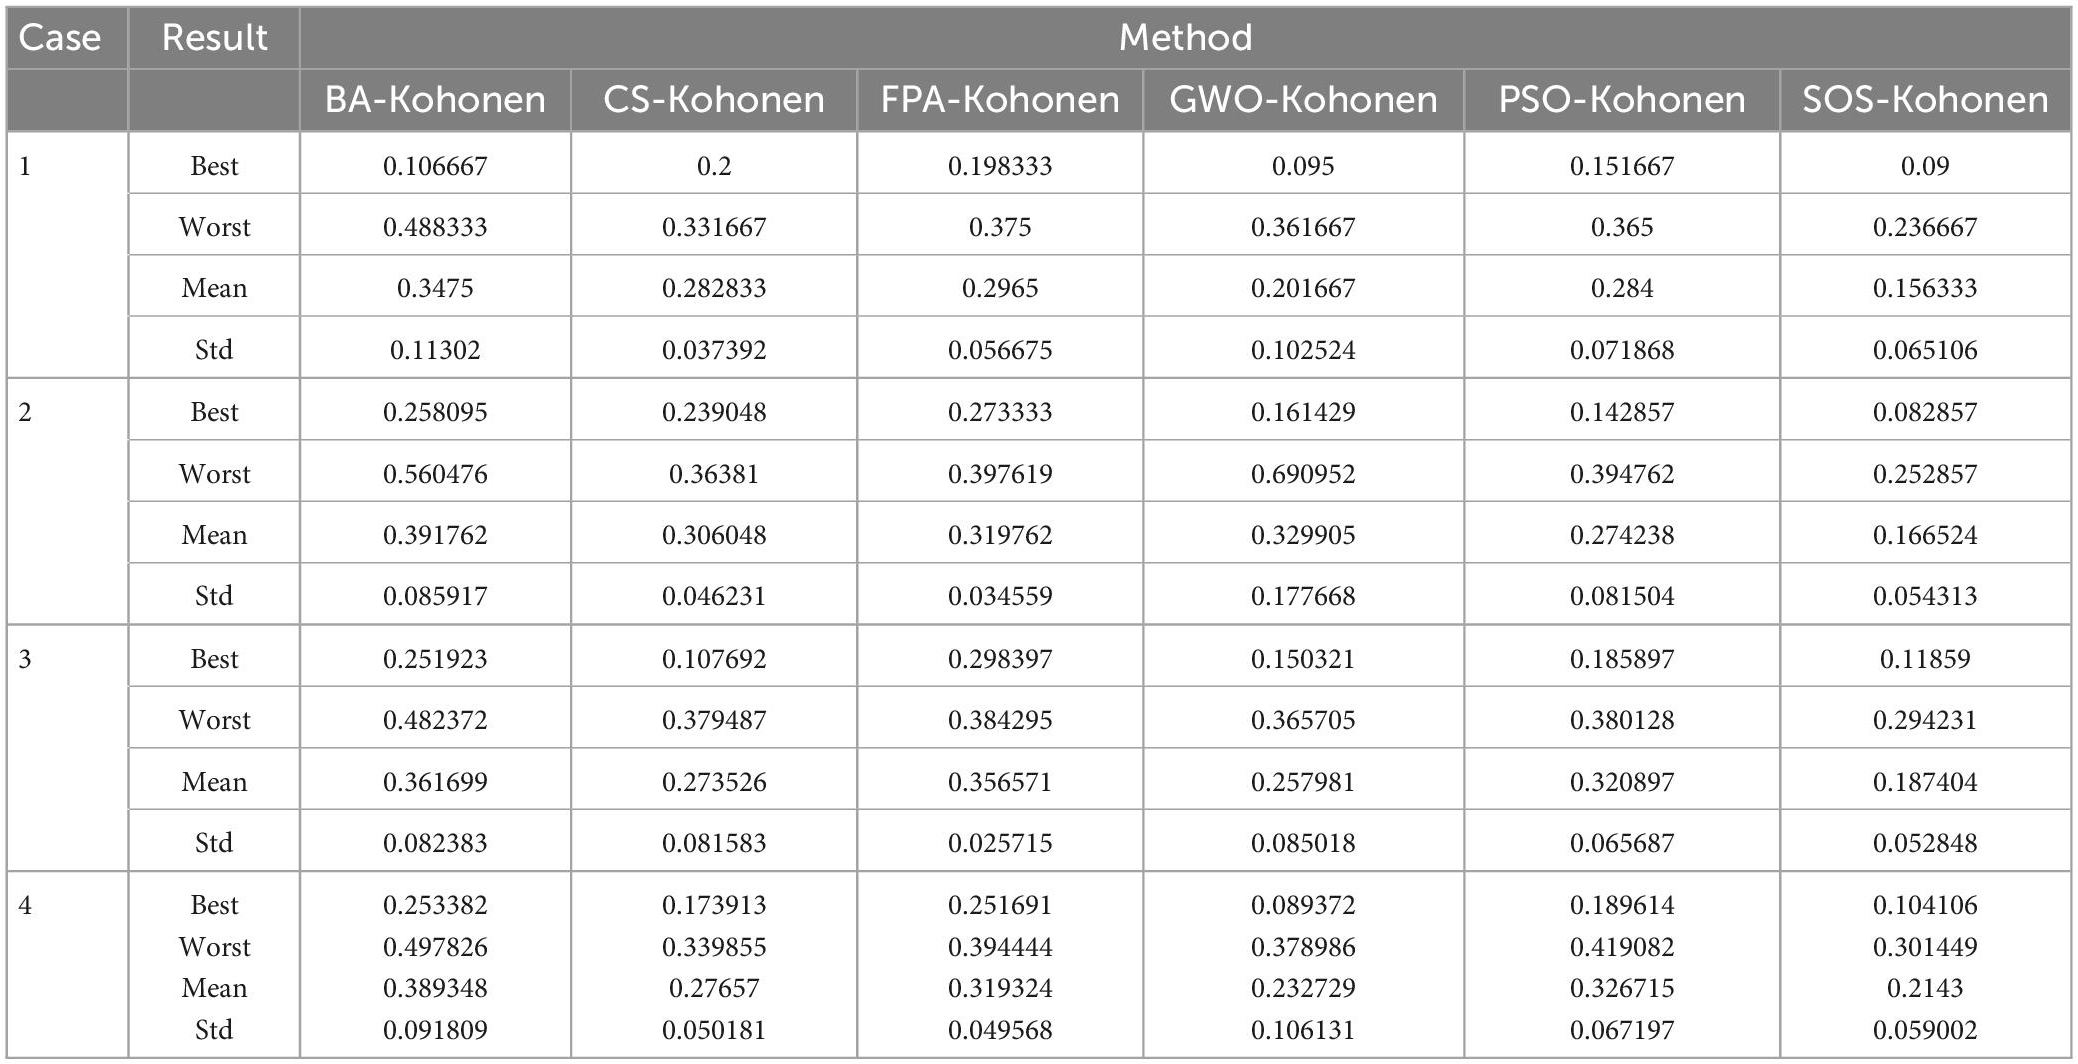
In this paper, 10 independent experiments were carried out for each algorithm for the four cases. As can be seen from Table 5, for cases 1, 2, and 3, the SOS-Kohonen algorithm has higher search accuracy than the other algorithms. In case 4, although the optimal value for SOS is slightly worse than that for GWO, the average of the 10 runs was still better than that of the other five algorithms. This shows that the SOS-Kohonen algorithm has a strong search ability and robustness as a whole.
Figures 6C1, G1, K1, O1 show the expected test results for cases 1 to 4, and Figures 6D1, H1, L1, P1 show the actual test results for SOS-Kohonen. Due to space constraints, we show the results only for the highest detection rate from the 10 independent runs. The normal data are represented as blue dots, and the other colors represent the four types of intrusion data. The red circles indicate differences between the actual detection and the expected detection.

Figure 6. Cases 1–4 expected classification results are (C1,G1,K1,O1); actual classification results are (D1,H1,L1,P1); fitness evolution curves are (E1,I1,M1,R1); ANOVA test of optimal paths are (F1,J1,N1,S1); respectively.
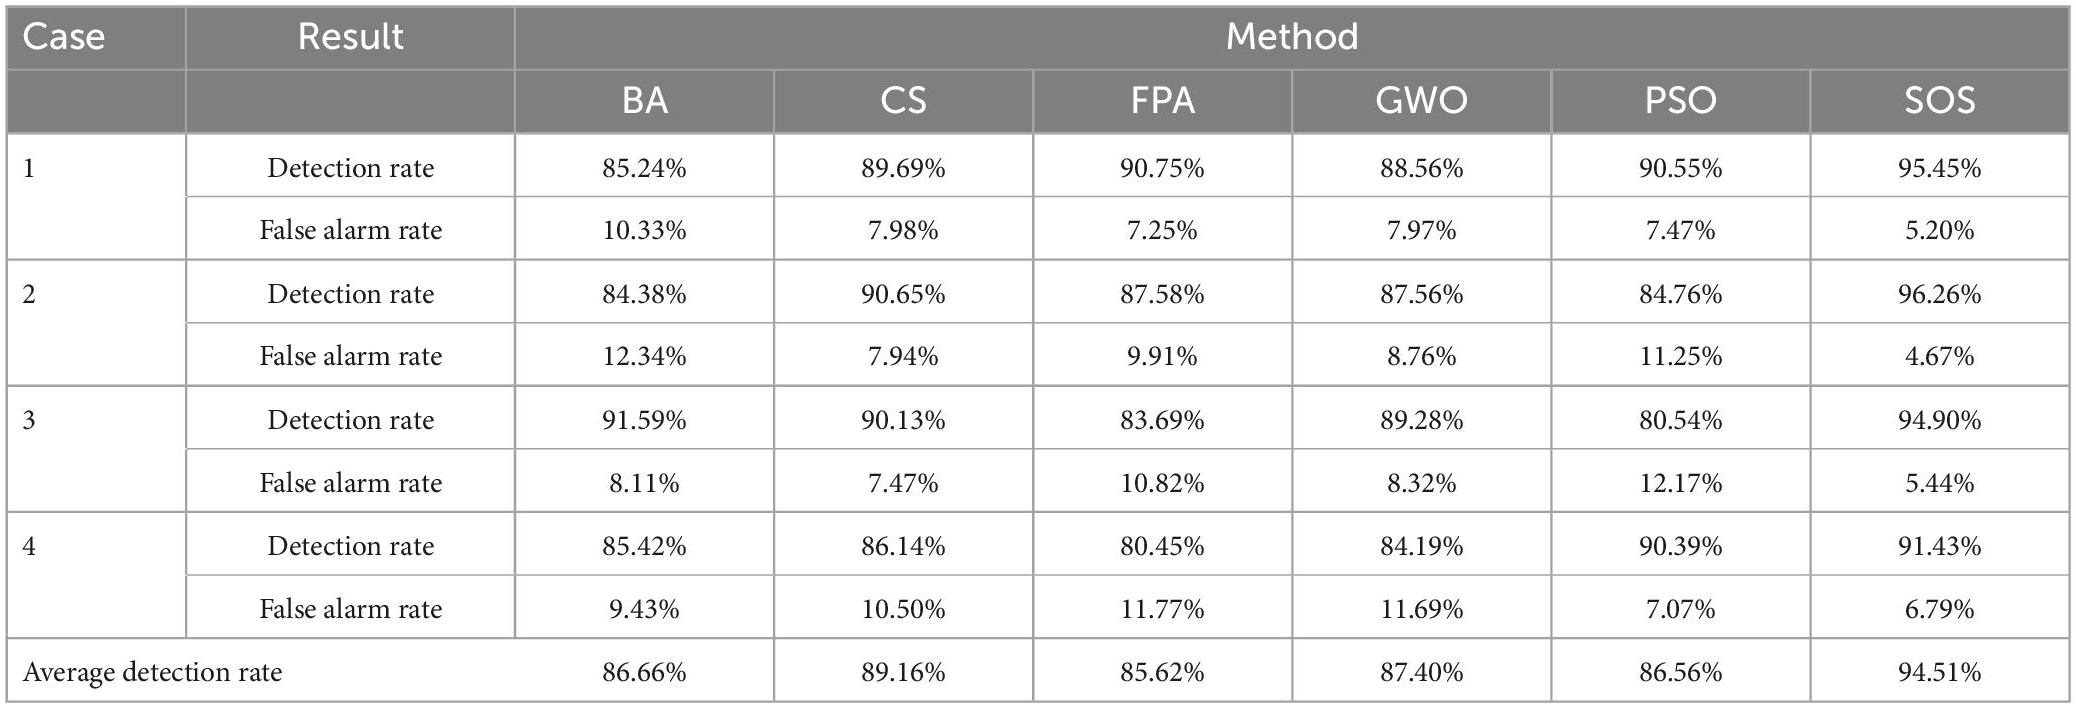
Table 6 shows the average detection rates and average false alarm rates for the six algorithms for the four cases. It can be seen that SOS-Kohonen had a higher detection rate and lower false alarm rate than BA-Kohonen, CS-Kohonen, FPA-Kohonen, GWO-Kohonen, or PSO-Kohonen. The average detection rate of SOS-Kohonen was 94.51%.
Figures 6E1, I1, M1, R1 show the convergence of the six algorithms. The convergence speed and accuracy of SOS-Kohonen were better than those of the other algorithms. Figures 6F1, J1, N1, S1 show the variance of each algorithm. For each case, the SOS-Kohonen algorithm had the second best variance ranked second but the highest search accuracy. Overall, the SOS-Kohonen algorithm performed better than the other algorithms.
6.4. p-values from the Wilcoxon rank-sum test
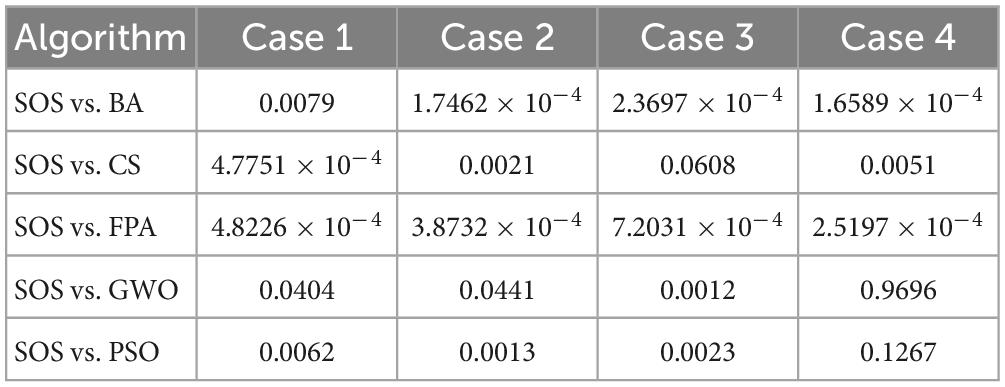
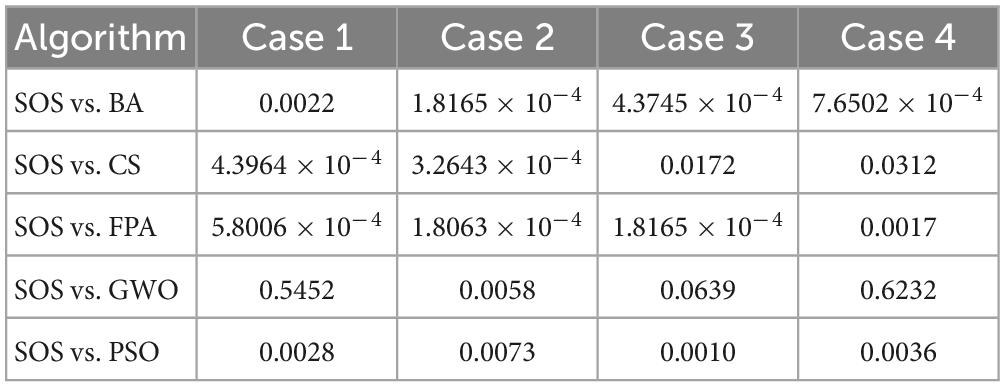
Next, we ran the Wilcoxon rank-sum test (Derrac et al., 2011; Gibbons and Chakraborti, 2011; Hollander et al., 2013) for SOS-Kohonen and the other five algorithms. We chose p = 0.05 as the level of significance. Table 7 shows the p-values for the four classification cases described in Section “6.2. Simulation of virus classification by SOS-Kohonen.” Table 8 shows the p-values for the four detection cases described in Section “6.3. Simulation of virus detection by SOS-Kohonen”
In Table 7, for case 3, the p-value for SOS vs CS is greater than 0.05. For case 4, the p-values for SOS vs GWO and SOS vs PSO are greater than 0.05. All other p-values are less than 0.05. In Table 8, the only p-values greater than 0.05 are for SOS vs GWO for cases 1, 3, and 4. Thus, for most of the eight tests cases, the differences between SOS and the other algorithms were statistically significant and not due to chance.
6.5. Analysis of results
In this paper, six common swarm intelligence algorithms were combined with Kohonen neural network and used to simulate the intrusion detection of network viruses. We ran two sets of tests. In Section “6.2. Simulation of virus classification by SOS-Kohonen,” we tested the classification accuracy of the algorithms. Figures 3C—S show the classification results, convergence, and variance maps for the four test cases. Table 2 lists the classification accuracy of the six swarm intelligence algorithms.
In Section “6.3. Simulation of virus detection by SOS-Kohonen,” we assessed the detection rate and false alarm rate for normal data and four attack types. Figures 6C1—S1 show the classification results, convergence, and variance maps for the four test cases. Table 6 compares the average detection rates and false alarm rates for the six algorithms.
In Section “6.4. p-values from the Wilcoxon rank-sum test,” we ran the Wilcoxon rank-sum test. For most of the eight tests cases, the differences between SOS and the other algorithms were statistically significant and not due to chance. Thus, the SOS-Kohonen algorithm is more effective than the other five swarm intelligence algorithms in detecting network intrusion by a virus.
7. Conclusions and future work
With the continuous development and popularization of the Internet, there is much more convenient access to network resources. However, this has led to a continuous increase in security problems due to virus intrusion. In this paper, we combined a swarm intelligence algorithm with a neural network to detect network intrusion by a virus. Our approach is described in detail, and it was tested with the international KDDCUP99 intrusion data set, which verified its effectiveness. Moreover, this is also a new method for detecting network intrusion by a virus. With the rapid development of cloud computing and big data, our future work will consider the application of SOS- Kohonen to heterogeneous distributed systems.
Data availability statement
The original contributions presented in this study are included in the article/supplementary material, further inquiries can be directed to the corresponding authors.
Author contributions
GZ: investigation, experiments, and writing the draft. FM: algorithm design. ZT: algorithm analysis. YZ: supervision, reviewing, and editing the manuscript. QL: reviewing and editing the manuscript. All authors contributed to the article and approved the submitted version.
Funding
This work was supported by National Natural Science Foundation of China under Grant Nos. U21A20464 and 62066005, and Program for Young Innovative Research Team in China University of Political Science and Law, under Grant No. 21CXTD02.
Conflict of interest
The authors declare that the research was conducted in the absence of any commercial or financial relationships that could be construed as a potential conflict of interest.
Publisher’s note
All claims expressed in this article are solely those of the authors and do not necessarily represent those of their affiliated organizations, or those of the publisher, the editors and the reviewers. Any product that may be evaluated in this article, or claim that may be made by its manufacturer, is not guaranteed or endorsed by the publisher.
References
Abualigah, L., Elaziz, M. A., Hussien, A. G., Alsalibi, B., Jafar Jalali, S., and Gandomi, A. (2021). Lightning search algorithm: A comprehensive survey. Appl. Intell. 51, 2353–2376. doi: 10.1007/s10489-020-01947-2
Aggarwal, P., and Sharma, S. K. (2015). Analysis of KDD dataset attributes: Class wise for Intrusion Detection. Procedia Comput. Sci. 57, 842–851. doi: 10.1016/j.procs.2015.07.490
Askarzadeh, A. (2016). A novel metaheuristic method for solving constrained engineering optimization problems: Crow search algorithm. Comput. Struct. 169, 1–12. doi: 10.1016/j.compstruc.2016.03.001
Chakraborty, S., Nama, S., and Saha, A. K. (2022). An improved symbiotic organisms search algorithm for higher dimensional optimization problems. Knowledge-Based Syst. 236:107779. doi: 10.1016/j.knosys.2021.107779
Cheng, M. Y., and Prayogo, D. (2014). Symbiotic organisms search: A new metaheuristic optimization algorithm. Comput. Struct. 139, 98–112. doi: 10.1007/s13369-020-05217-8
De Almeida, C. W. D., de Souza, R. M. C. R., and Candeias, A. L. B. (2013). Fuzzy Kohonen clustering networks for interval data. Neurocomputing 99, 65–75. doi: 10.1109/TNN.2007.911709
Derrac, J., García, S., Molina, D., and Herrera, F. (2011). A practical tutorial on the use of nonparametric statistical tests as a methodology for comparing evolutionary and swarm intelligence algorithms. Swarm Evol. Comput. 1, 3–18. doi: 10.1016/j.swevo.2011.02.002
Ezugwua, A. E., and Prayogo, D. (2019). Symbiotic organisms search algorithm: Theory, recent advances and applications. Expert Syst. Appl. 119, 184–209. doi: 10.1016/j.eswa.2018.10.045
Feng, W., Zhang, Q., Hu, G., Xiang, J., and Huang, J. (2014). Mining network data for intrusion detection through combining SVMs with ant colony networks. Future Gener. Comput. Syst. 37, 127–140. doi: 10.1016/j.future.2013.06.027
Fouad, A., and Gao, X. (2019). A novel modified flower pollination algorithm for global optimization. Neural Comput. Appl. 31, 3875–3908. doi: 10.1007/s00521-017-3313-0
Ganapathy, S., Kulothungan, K., Yogesh, P., and Kannan, A. (2012). A novel weighted fuzzy C-means clustering based on immune genetic algorithm for intrusion detection. Int. Conf. Model. Optim. Comput. 38, 1747–1750. doi: 10.1016/j.proeng.2012.06.213
Gibbons, J. D., and Chakraborti, S. (2011). Nonparametric Statistical Inference. Berlin: Springer. doi: 10.1201/9781439896129
Hollander, M., Wolfe, D. A., and Chicken, E. (2013). Nonparametric Statistical Methods. Hoboken, NJ: John Wiley and Sons.
Hussien, A. G., Abualigah, L., Zitar, R. A., Hashim, F. A., Amin, M., Saber, A., et al. (2022). Recent advances in Harris hawks optimization: A comparative study and applications. Electronics 11:1919. doi: 10.3390/electronics11121919
Hussien, A. G., Amin, M., Wang, M., Liang, G., Alsanad, A., Gumaei, A., et al. (2021). Crow search algorithm: Theory, recent advances, and applications. IEEE Access 8, 173548–173565. doi: 10.1109/ACCESS.2020.3024108
Jordehi, A. R., and Jasni, J. (2015). Particle swarm optimisation for discrete optimization problems: A review. Artif. Intell. Rev. 43, 243–258. doi: 10.1007/s10462-012-9373-8
Kaveh, A., and Bakhshpoori, T. (2016). Water evaporation optimization: A novel physically inspired optimization algorithm. Comput. Struct. 167, 69–85. doi: 10.1016/j.compstruc.2016.01.008
Kennedy, J., and Eberhart, R. (1995). “Particle swarm optimization,” in Proceedings of the IEEE International Conference on Neural Networks IV, Perth.
Lin, W., Ke, S., and Tsai, C. (2015). CANN: An intrusion detection system based on combining cluster centers and nearest neighbors. Knowledge-Based Syst. 78, 13–21. doi: 10.1016/j.knosys.2015.01.009
Mabu, S., Ci, C., Nannan, L., Shimada, K., and Hirasawa, K. (2011). An intrusion-detection model based on fuzzy class-association-rule mining using genetic network programming. IEEE Trans. Syst. Man Cybern. Part C Appl. Rev. 41, 130–139. doi: 10.1109/TSMCC.2010.2050685
Mirjalili, S., Mirjalili, S. M., and Lewis, A. (2014). Grey wolf optimizer. Adv. Eng. Software 69, 46–61. doi: 10.1016/j.advengsoft.2013.12.007
MIT Lincoln Laboratory (2009). Intrusion detection attacks database. Cambridge, MA: MIT Lincoln Laboratory.
Mohamed, A. W., Hadi, A. A., and Mohamed, A. K. (2020). Gaining-sharing knowledge based algorithm for solving optimization problems: A novel nature-inspired algorithm. Int. J. Mach. Learn. Cyber. 11, 1501–1529. doi: 10.1007/s13042-019-01053-x
Shareef, H., Ibrahim, A. A., and Mutlag, A. H. (2015). Lightning search algorithm. Appl. Soft Comput. 36, 315–333.
Shehab, M., Abu-Hashem, M. A., Shambour, M. K. Y., Alsalibi, A., Alomari, O., Gupta, J., et al. (2022). A comprehensive review of bat inspired algorithm: Variants, applications, and hybridization. Arch. Comput. Methods Eng. doi: 10.1007/s11831-022-09817-5 [Epub ahead of print].
Shi, J., Li, Z., Lai, W., Li, F., Shi, R., Feng, Y., et al. (2021). “Two End-to-End Quantum-inspired Deep Neural Networks for Text Classification” in Proceedings of the IEEE Transactions on Knowledge and Data Engineering, Piscataway, NJ
Shitharth, S., and Winston, P. D. (2017). An enhanced optimization based algorithm for intrusion detection in SCADA network. Comput. Secur. 70, 16–26. doi: 10.1016/j.cose.2017.04.012
Wang, G., Deb, S., and Cui, Z. H. (2019). Monarch butterfly optimization. Neural Comput. Appl. 31, 1995–2014. doi: 10.1007/s00521-015-1923-y
Wehrens, R., and Buydens, L. M. C. (2007). Self-and Super-organising Maps in R: The Kohonen package. J. Stat. Software 21, 1–19.
Wolpert, D. H., and Macready, W. G. (1997). No free lunch theorems for optimization. IEEE Trans. Evol. Comput. 1, 67–82. doi: 10.1109/4235.585893
Xinshe, Y. (2010). “A new metaheuristic bat-inspired algorithm,” in Nature Inspired Cooperative Strategies for Optimization, eds J. R. Gonzalez, D. A. Pelta, and C. Cruz (Berlin: Springer-Verlag), 65–74. doi: 10.1007/978-3-642-12538-6_6
Yang, X. S. (2012). “Flower pollination algorithm for global optimization,” in Unconventional Computation and Natural Computation, Lecture Notes in Computer Science, Vol. 7445, eds M. J. Patitz and M. Stannett (Berlin: Springer), 240–249. doi: 10.1007/978-3-642-32894-7_27
Yang, X. S., and Deb, S. (2009). “Cuckoo search via Levy flights,” in Proceedings of the World Congress on Nature & Biologically Inspired Computing (NaBIC 2009), Piscataway, NJ. doi: 10.1155/2022/5443160
Keywords: intrusion detection, symbiotic-organism search algorithm, Kohonen neural network, detection rate, false alarm rate
Citation: Zhou G, Miao F, Tang Z, Zhou Y and Luo Q (2023) Kohonen neural network and symbiotic-organism search algorithm for intrusion detection of network viruses. Front. Comput. Neurosci. 17:1079483. doi: 10.3389/fncom.2023.1079483
Received: 25 October 2022; Accepted: 06 February 2023;
Published: 22 February 2023.
Edited by:
Tien-Loc Le, Sejong University, Republic of KoreaReviewed by:
Jinjing Shi, Central South University, ChinaRamalingam Sakthivel, Chungbuk National University, Republic of Korea
Ali Wagdy Mohamed, Cairo University, Egypt
Copyright © 2023 Zhou, Miao, Tang, Zhou and Luo. This is an open-access article distributed under the terms of the Creative Commons Attribution License (CC BY). The use, distribution or reproduction in other forums is permitted, provided the original author(s) and the copyright owner(s) are credited and that the original publication in this journal is cited, in accordance with accepted academic practice. No use, distribution or reproduction is permitted which does not comply with these terms.
*Correspondence: Guo Zhou,  emhvdWd1b0BjdXBsLmVkdS5jbg==; Yongquan Zhou,
  emhvdXlvbmdxdWFuQGd4dW4uZWR1LmNu
 Guo Zhou1*
 Yongquan Zhou