- 1School of Economics, Anhui University of Finance and Economics, Bengbu, China
- 2School of Finance, Anhui University of Finance and Economics, Bengbu, China
- 3School of Business Administration, Anhui University of Finance and Economics, Bengbu, China
At present, gold and bitcoin have become mainstream assets in market transactions. Due to the volatility of gold and bitcoin prices, we can buy and sell assets like gold and bitcoin the same way we buy and sell stocks. The research goal of this article is to develop an optimal trading strategy that maximizes our post-trade returns. By studying the relationship between the two, on the one hand, it supplements and enriches the theoretical research on the rate of return of gold and Bitcoin, on the other hand, it provides a certain reference for investors to construct investment strategies. The research on the cointegration relationship between them has important practical significance. At the same time, it has important practical significance for the research on the cointegration relationship between bitcoin and gold.
Introduction
Gold is a special investment product that combines the dual nature of commodity and currency. Because of its excellent characteristics, it has a currency and commodity attributes a long time ago, and it has long been a symbol of people’s wealth and luxury. As humanity progresses, so does the role and application of gold in the economy. Under the dual role of commodity and currency, the relationship between supply and demand of gold is also more prominent (Doremus, 1964; Martin et al., 2001; Stognij et al., 2003; Jain et al., 2006; Sun and Che, 2009). As a P2P digital currency, the point-to-point transmission of bitcoin is a decentralized payment system. The biggest feature of bitcoin is its limited issuance, which is forever limited to 21 million. It is believed to facilitate trade, and its functions even go beyond monetary properties (Babaioff et al., 2011; Bryans, 2013; Andrychowicz et al., 2016).
Wuyi Ye conducted an empirical study and test on the quantile cointegration relationship between Bitcoin and gold, and proposed a semi-parametric MIDAS quantile regression model, and gave the estimation of the model and the corresponding statistical inference (Ye et al., 2020). Shibing Mo established an ARIMA-Transformer combination model based on wavelet analysis, analyzed the random fluctuations, cyclic changes, periodic changes and other changing laws of time series from different dimensions, and made time window rolling forecasts for the price of Bitcoin (Mo et al., 2022). F Jareo applied the asymmetric non-linear cointegration method (NARDL) to capture the long-term and short-term asymmetry between Bitcoin and gold price returns, and studied the sensitivity of Bitcoin returns to changes in gold price returns (Jareo et al., 2020). In terms of the cointegration relationship between Bitcoin and gold, many researchers at home and abroad have carried out a number of studies and achieved certain research results.
Research ideas and innovation points
In this review, we first use the long short-term memory network model to predict the price of gold and bitcoin, then build a decision model to get the best portfolio trading strategy, and analyze the advantages and sensitivity of the model, and finally draw conclusions and put forward corresponding suggestions.
This article combines the development status of gold and Bitcoin and fully considers the research status and data, selects the most appropriate evaluation index and model method, and makes innovation on this basis, so as to comprehensively analyze the best strategy of portfolio trading.
Data sources and assumptions
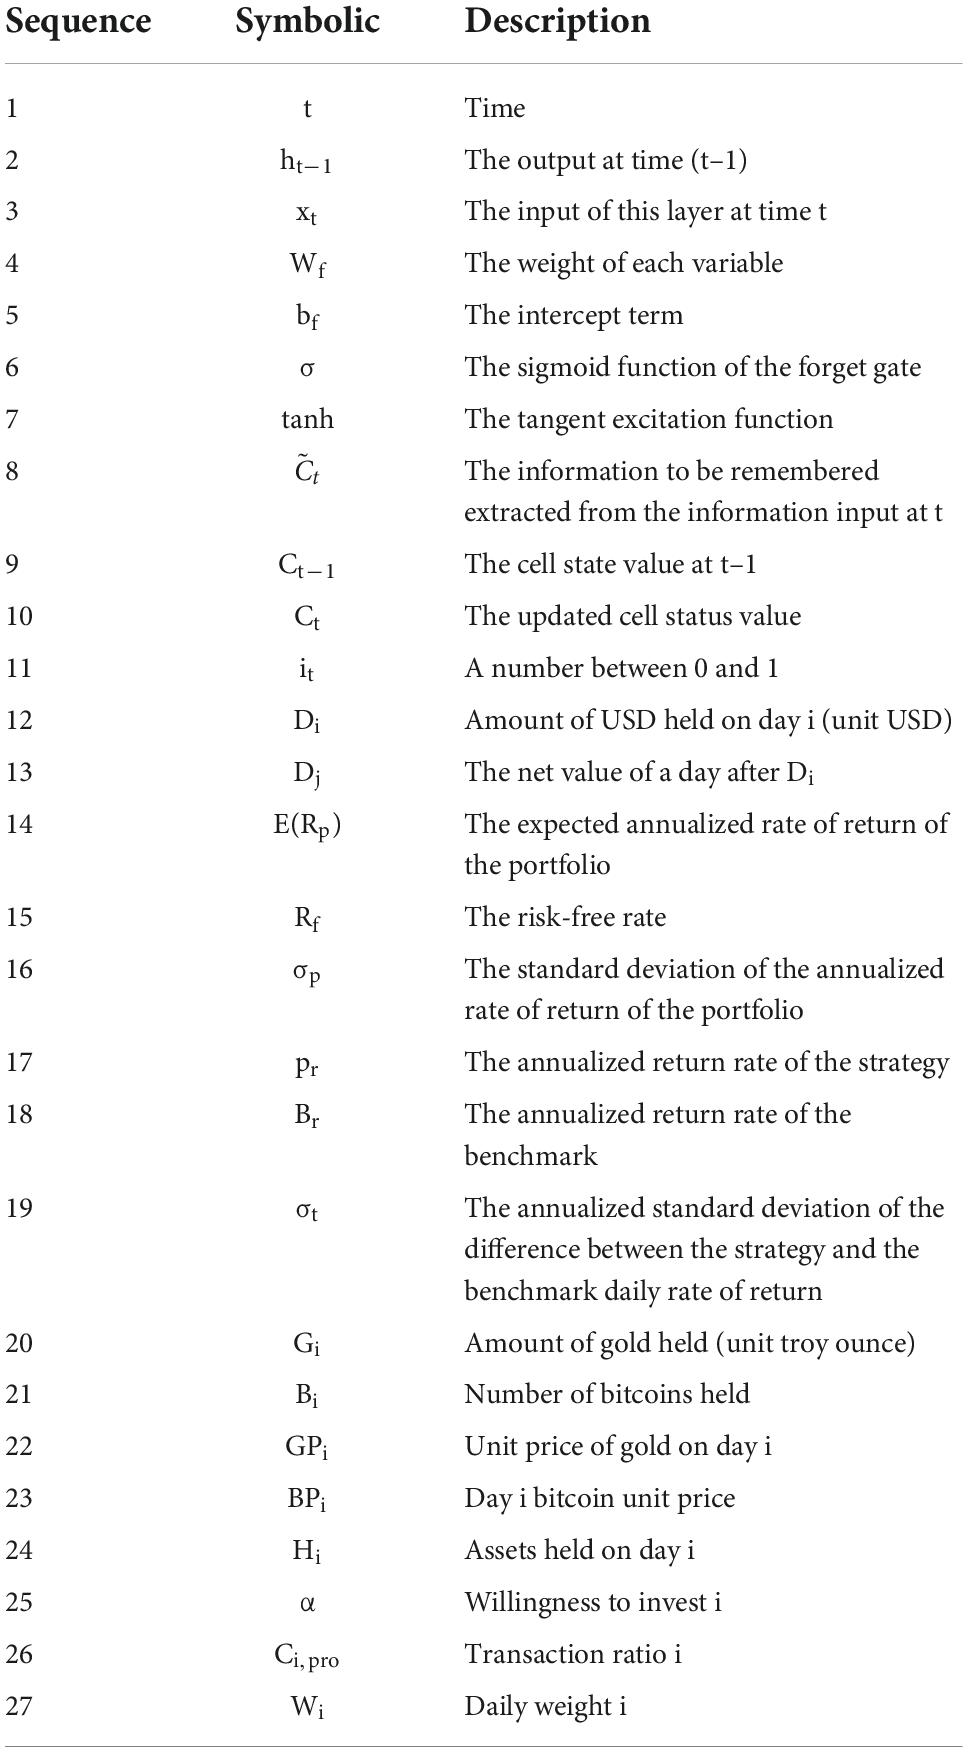
The data used in the model comes from the attachment of question C of the 2022 American Mathematical Contest in Modeling. The specific meanings of the symbols in the model are shown in Table 1. In order to facilitate the study of this problem, the following assumptions are made: (i) The market is assumed to have complete liquidity, so that any number of securities can be traded instantaneously. (ii) Assume that the impact of capital volume on the market is ignored. (iii) Assuming that the international situation is stable, the impact on market prices is negligible.
Establishment of the prediction model
Introduction to the model
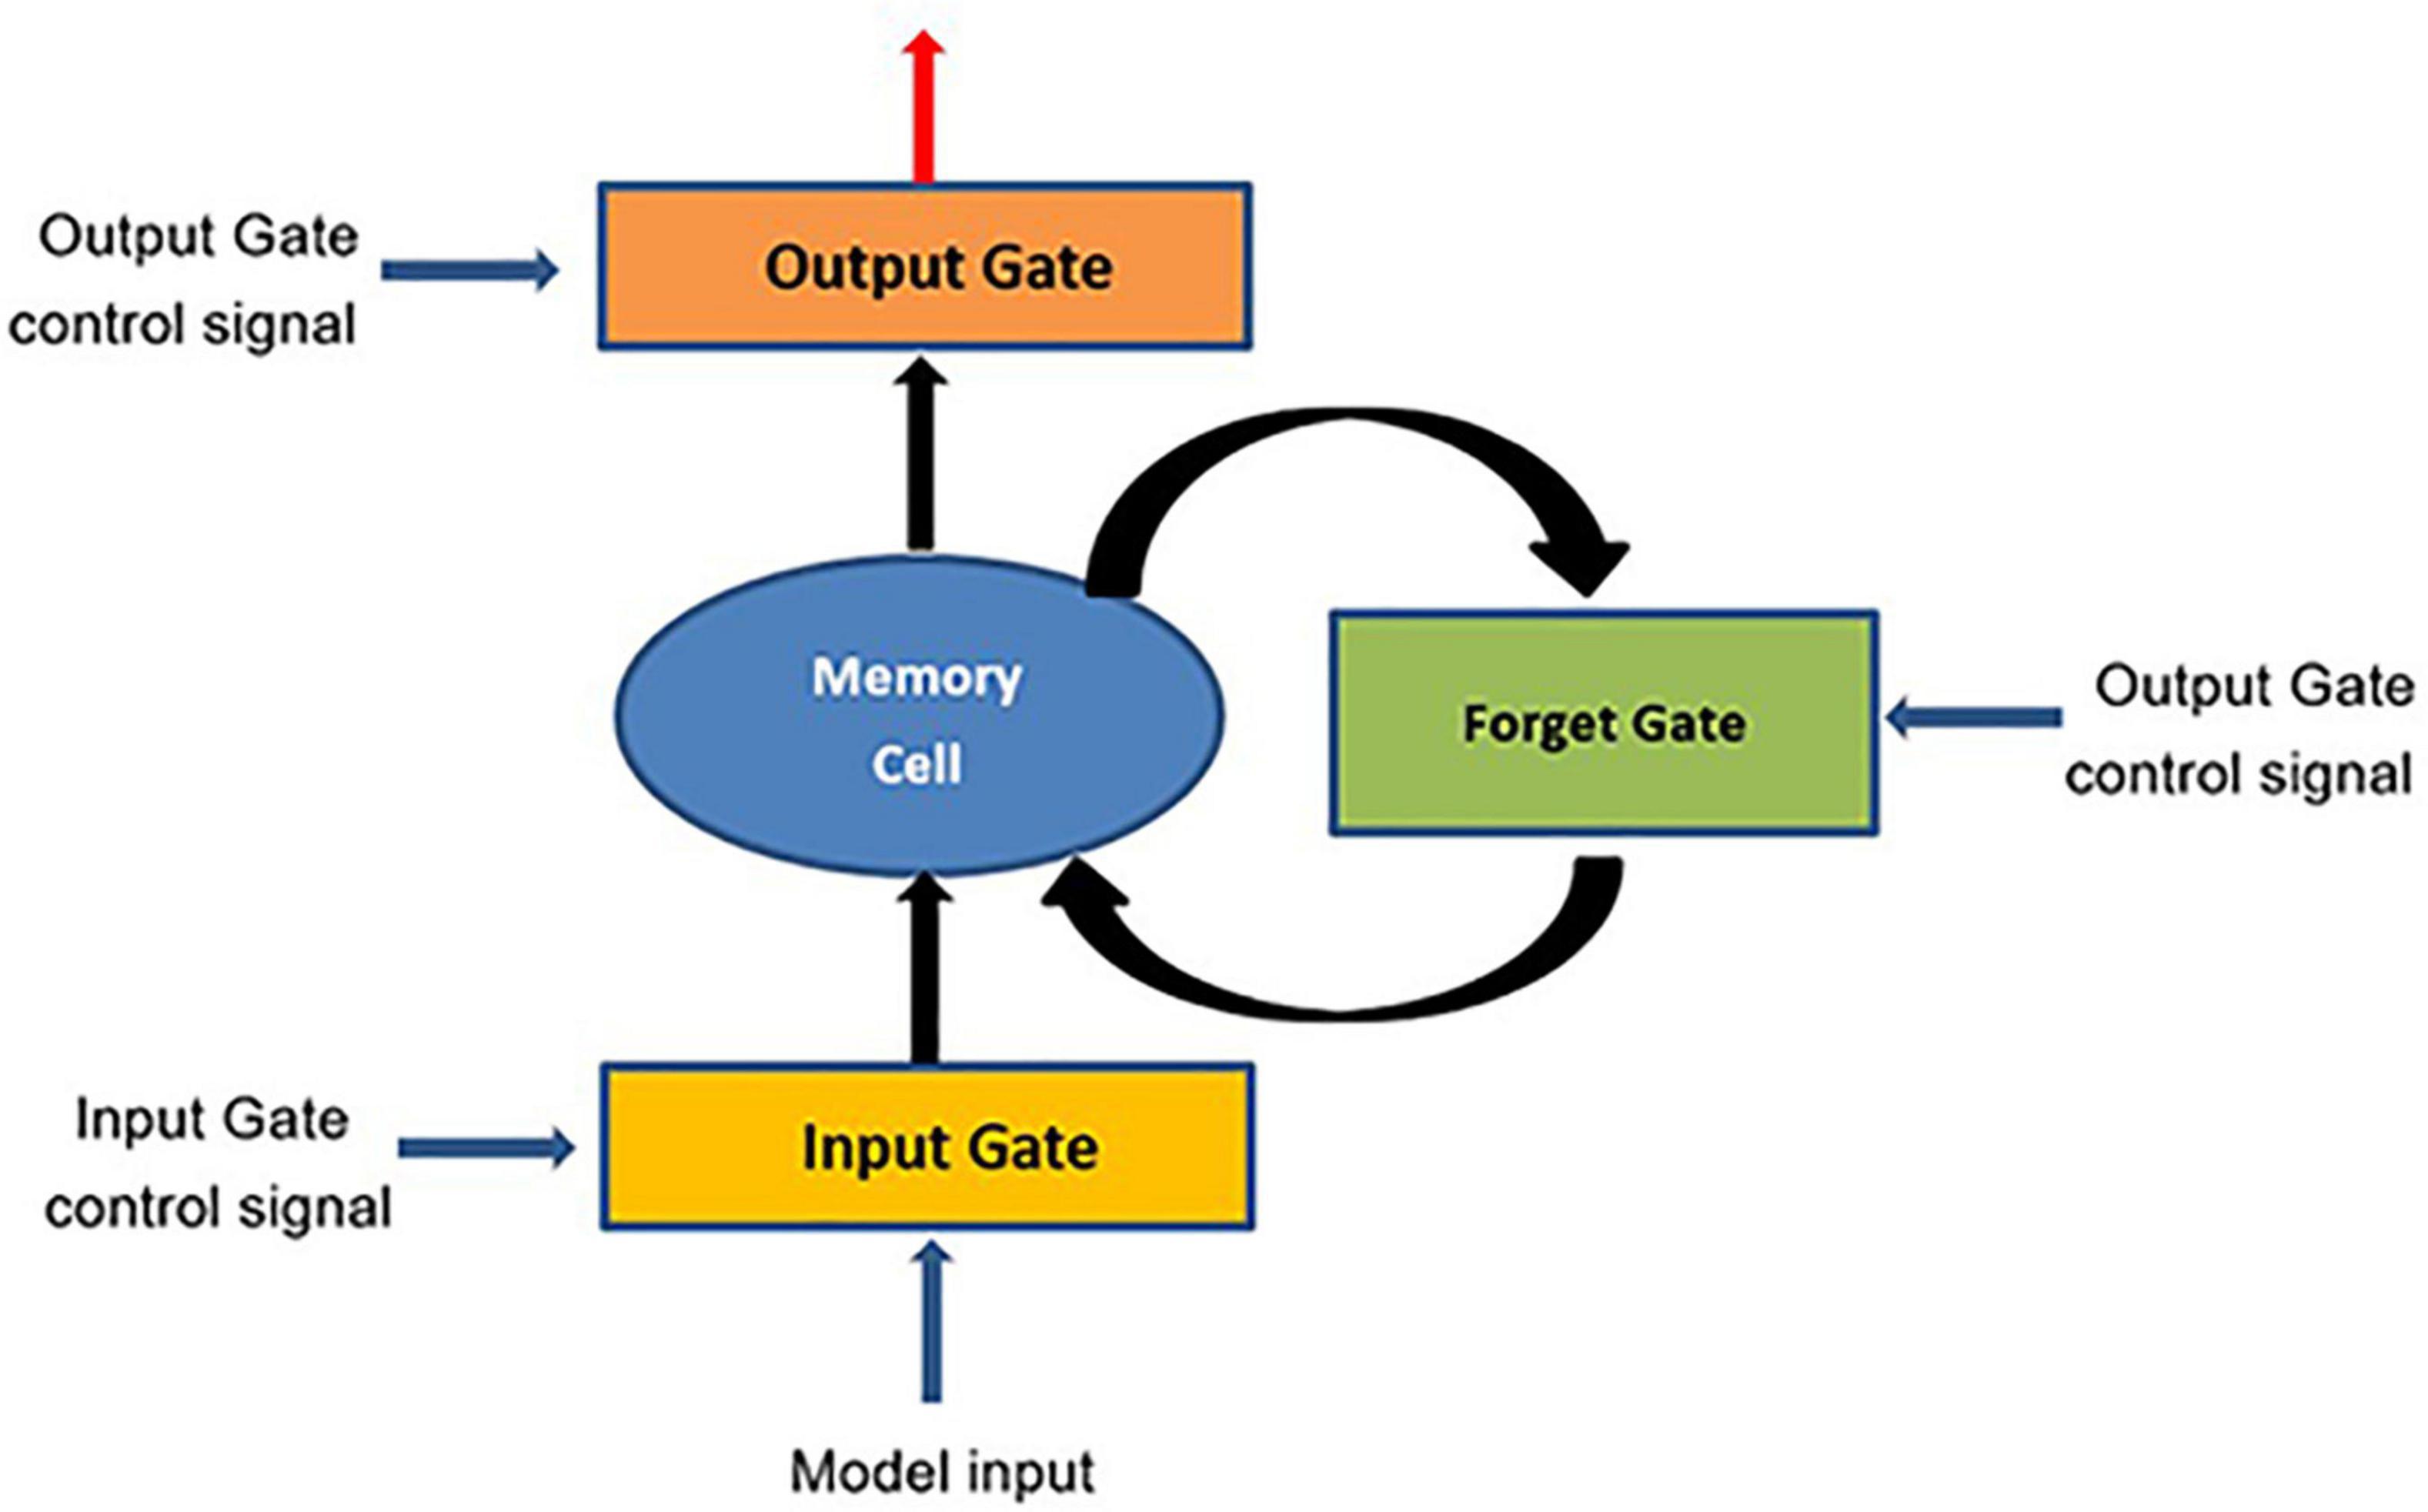
Since the purpose of neural network is to extract feature information hierarchically, it is well-adapted to the characteristics of non-linear systems (Hopfield, 1982; Srivastava et al., 2014). A recurrent neural network (RNN) is a neural network used to analyze ordered data that generally have spatial or temporal correlations (Barbounis et al., 2006; Lukosevicius and Jaeger, 2009). The long short-term memory network model (LSTM) is a special kind of recurrent neural network. It is not a separate network structure itself, but replaces the hidden units of the recurrent neural network with special structural units unique to LSTM. In LSTM, there is a connection between the networks at each moment, rather than the feedforward or feedback of the network at a single moment (Chen et al., 2014; Altan et al., 2021; Lu and Wu, 2021; Xiong et al., 2021). The unit structure diagram is shown in Figure 1.
As can be seen from the figure, the LSTM unit includes a cell state, a model input and three gate signals. In the concept of LSTM, the cell state is the memory space of the entire model. There are four kinds of input of LSTM, namely model input, input gate, output gate and forgetting gate, and the general neural network has only one input, so the parameters of LSTM are four times that of ordinary neural network. Input gate, output gate and forget gate are three gate signals. Sigmoid function and dot multiplication operation are used to selectively process data. The value of Sigmoid is between 0 and 1, and the size of dot multiplication determines the amount of information (Tanaka et al., 2016; Lyu et al., 2017).
The training algorithm of the model
Forward propagation of signals
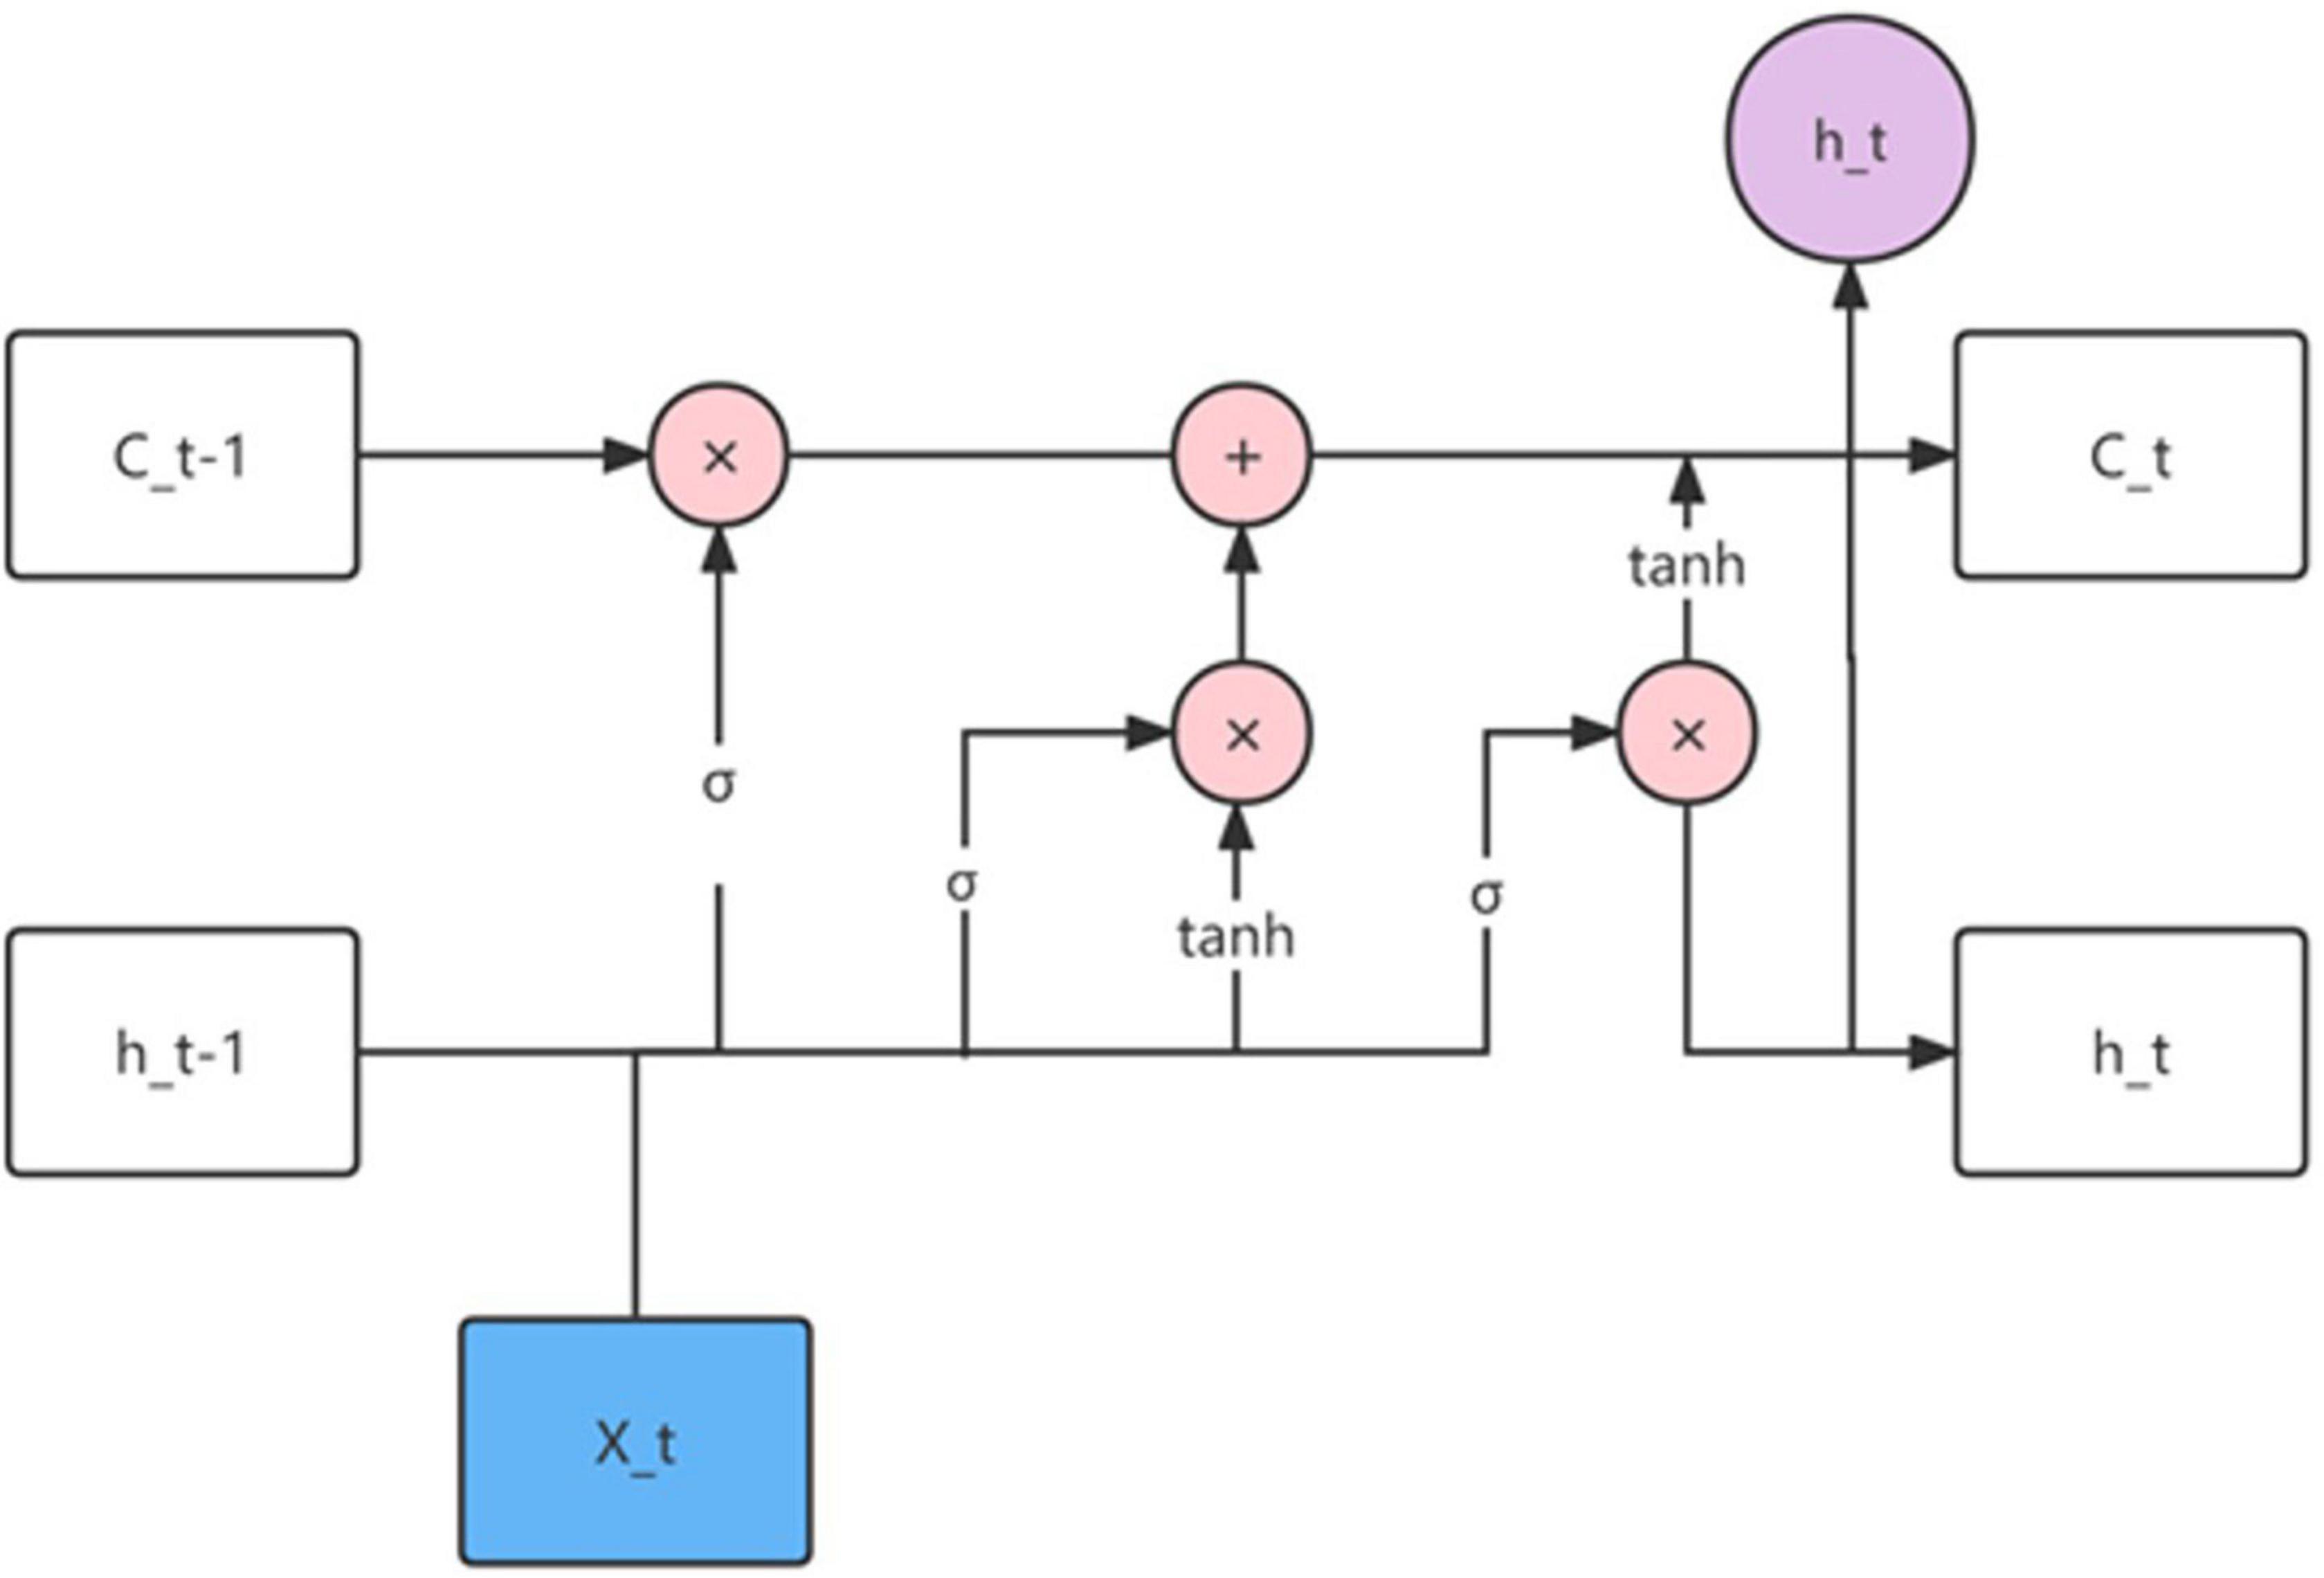
The structure diagram of LSTM is shown in Figure 2, from which we can clearly see the function of the input node and gate signal.
The input node accepts the sample input at the current moment and the output of the hidden layer unit at the previous moment.
The forget gate is used to determine whether the data in the memory unit at the previous moment can be saved. If the output of the forget gate is 1, the information in the previous memory cell is saved; if the output of the forget gate is 0, the information in the previous memory cell in the memory cell is ignored. In short, the function of the forget gate is to update the state of the memory unit and control the effect of the state of the memory unit at the previous moment. The formula is:
The function of the input gate is to update the stored information in the cell state. First determine how many activation values of the input nodes to save, and then create a new vector according to the tanh function and add it to the unit state. Finally, the old cell state is multiplied by the forget gate ft, and the new information is added to update the current cell state. The formula is:
The output gate first determines the amount of information required by the Sigmoid function, and then uses the tanh function to determine how much information will be output in the memory unit. The formula is:
where Ot is a number between 0 and 1.
Reverse transfer of error
The core problem of training the model is to continuously adjust the weight matrix and the intercept to ensure that the output error of the network is reduced as much as possible under a given loss function, and the update of the parameters is realized by the chain derivation of the reverse pass. Therefore, the purpose of backpropagation is to find the gradient of the prediction error with respect to all parameters, and the total gradient is:
Price prediction
Using the trained LSTM model, the gold price can be predicted four trading days after the current day. This LSTM model has a mean square error of 0.00324 when the number of training times is 1,000, indicating that the LSTM model performs better in predicting gold prices.
Decision model
Threshold setting
According to the prediction of the above LSTM model, it can be seen that the price of gold is above 1,100 US dollars per ounce, because our initial cash holding is 1,000 US dollars, the proportion of gold in each transaction basically does not exceed 25%, and the fee paid is 2.75 US dollars, so we treat gold price movements within $2.75 an ounce as normal fluctuations. For the same reason, due to the instability of bitcoin, the proportion of bitcoin transactions basically does not exceed 15%, and the income threshold is $3.3 per bitcoin.
We make the following settings:
Predict the price of each day in the next few days, Rgold,i and Rbit,i are the actual prices of gold and bitcoin on the i-th day. According to the price predicted in the next 5 days, the operation of the day is carried out. The risk coefficient Fij is the price predicted on the nth day after the i-th day.
Based on the above definitions and emerging situations, we discuss the upcoming situations.
Decision discussion
Helicopter type
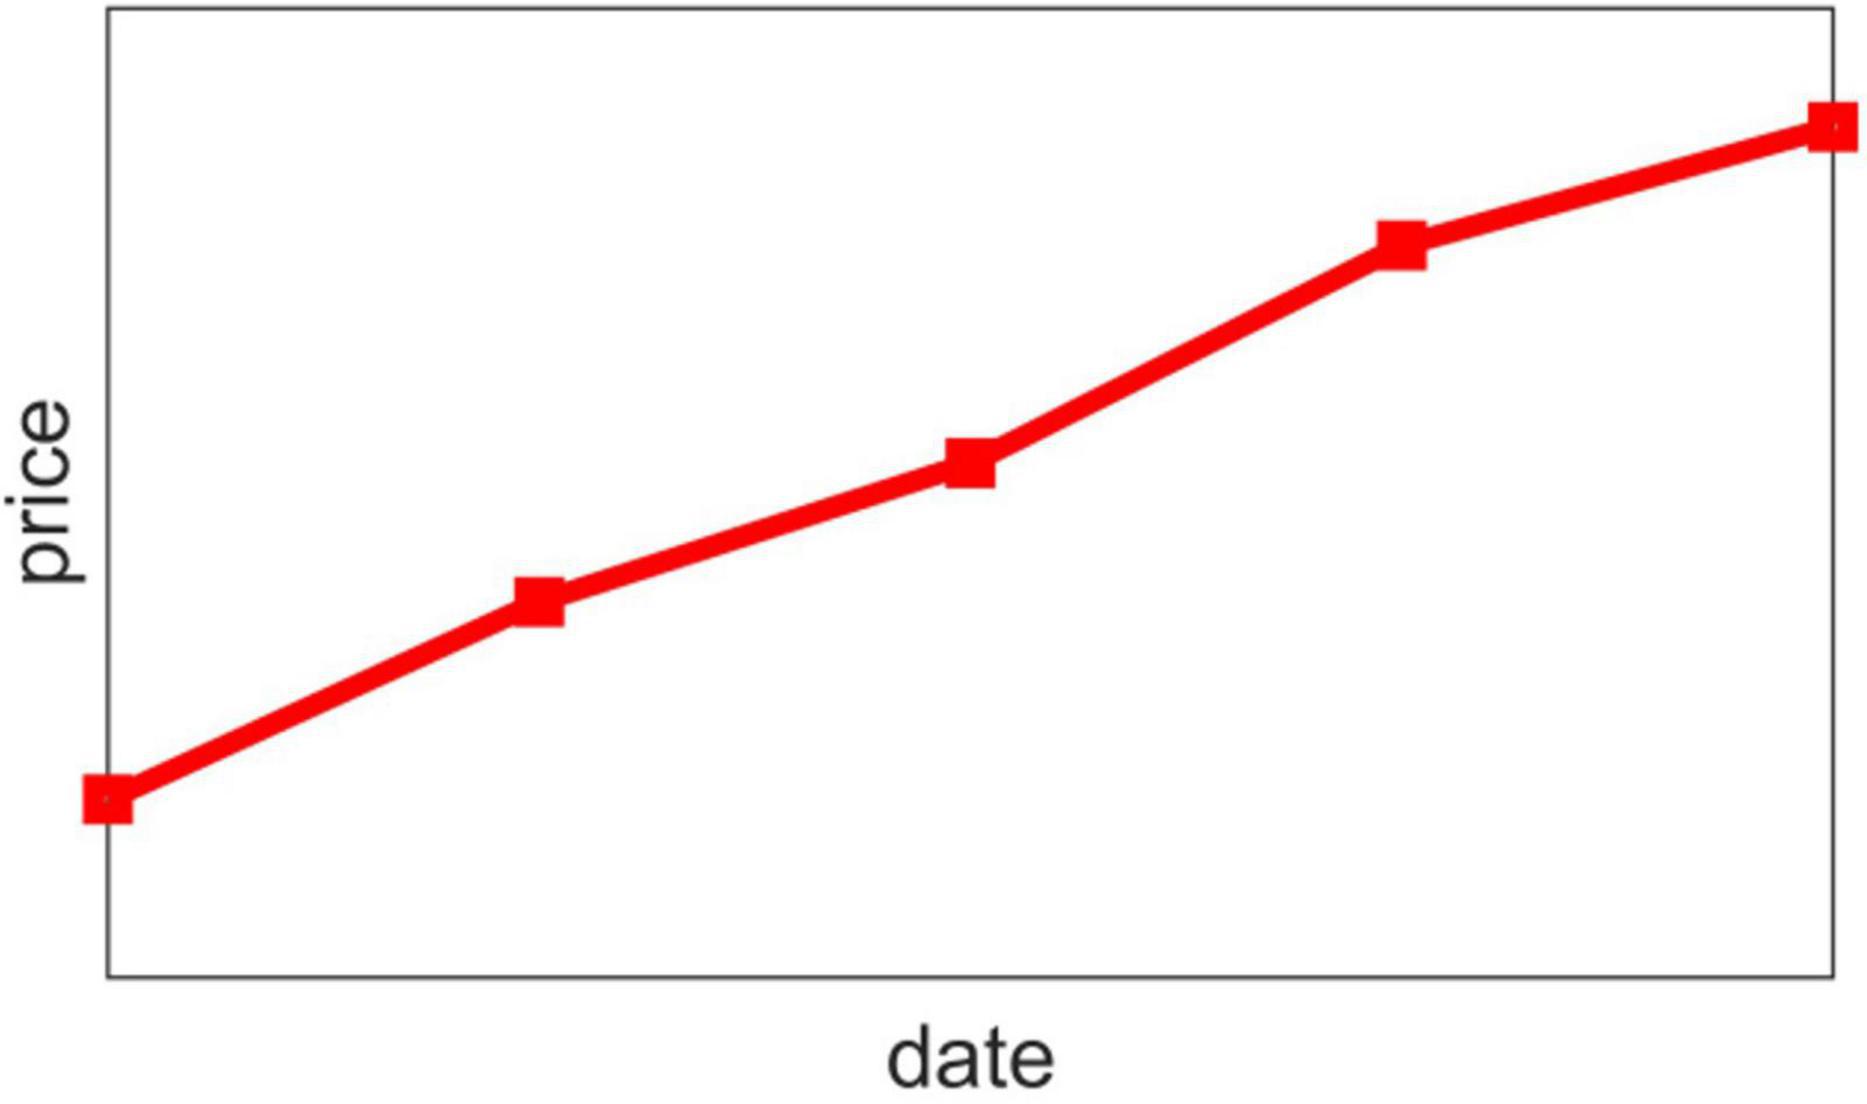
Due to the positive market conditions, the product will have a continuous upward trend, that is, Di,1, Di,2, Di,3, Di,4 are all 1, and the price of each day in the future will be higher than that of the previous day. The price action chart for the next 5 days is shown in Figure 3.
At this point, this product is considered to be a good rally in the next few days, so we made the decision to increase the proportion of this product in the mix.
Straight down type
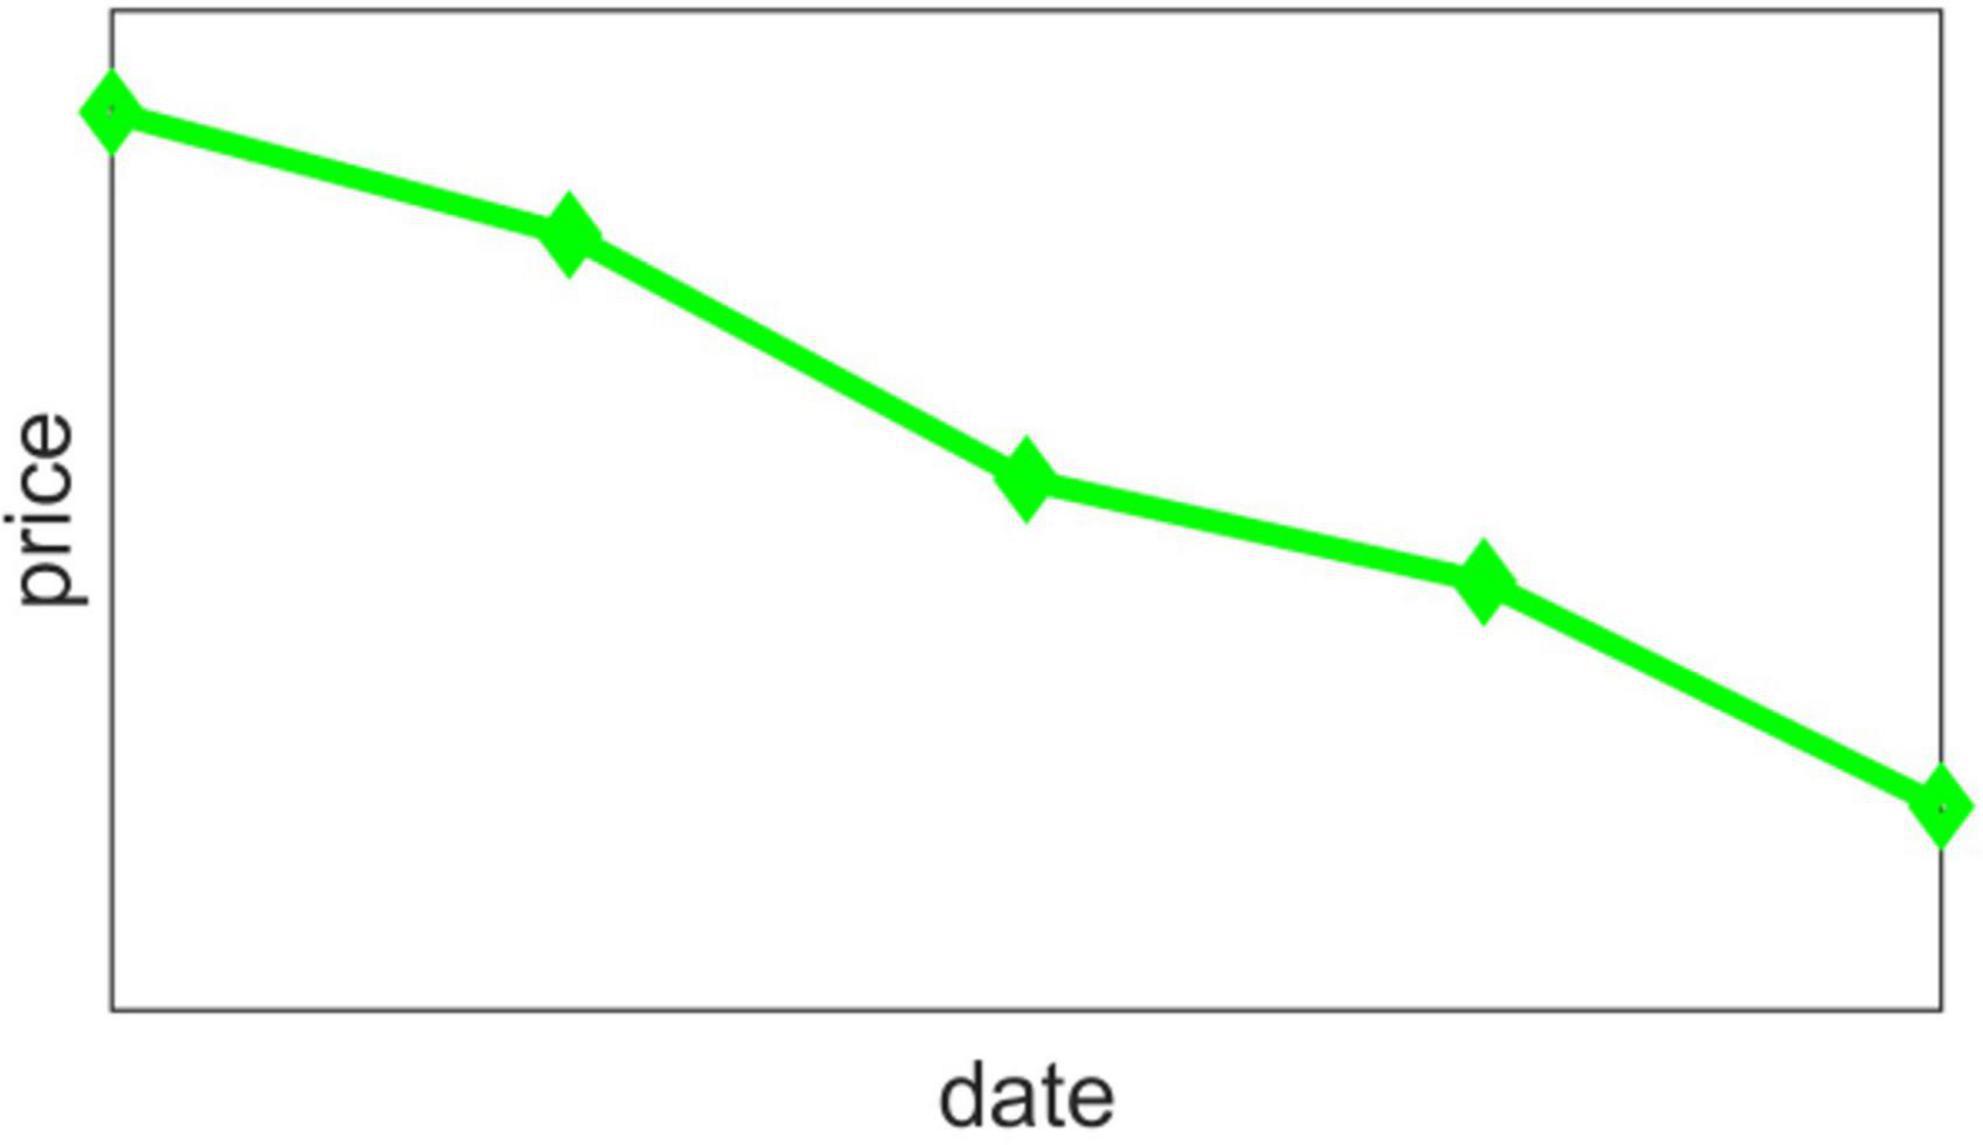
Due to the negative market conditions, the product will have a continuous downward trend, that is, Di,1, Di,2, Di,3, Di,4 are all −1, and the price of each day in the future will be lower than the previous day. The price chart is shown in Figure 4.
At this time, it is considered that this product will be regarded as a higher decline in the next few days, so we have made a decision to reduce the proportion of this product in the portfolio to avoid economic losses caused by continuous decline.
Inflection point type
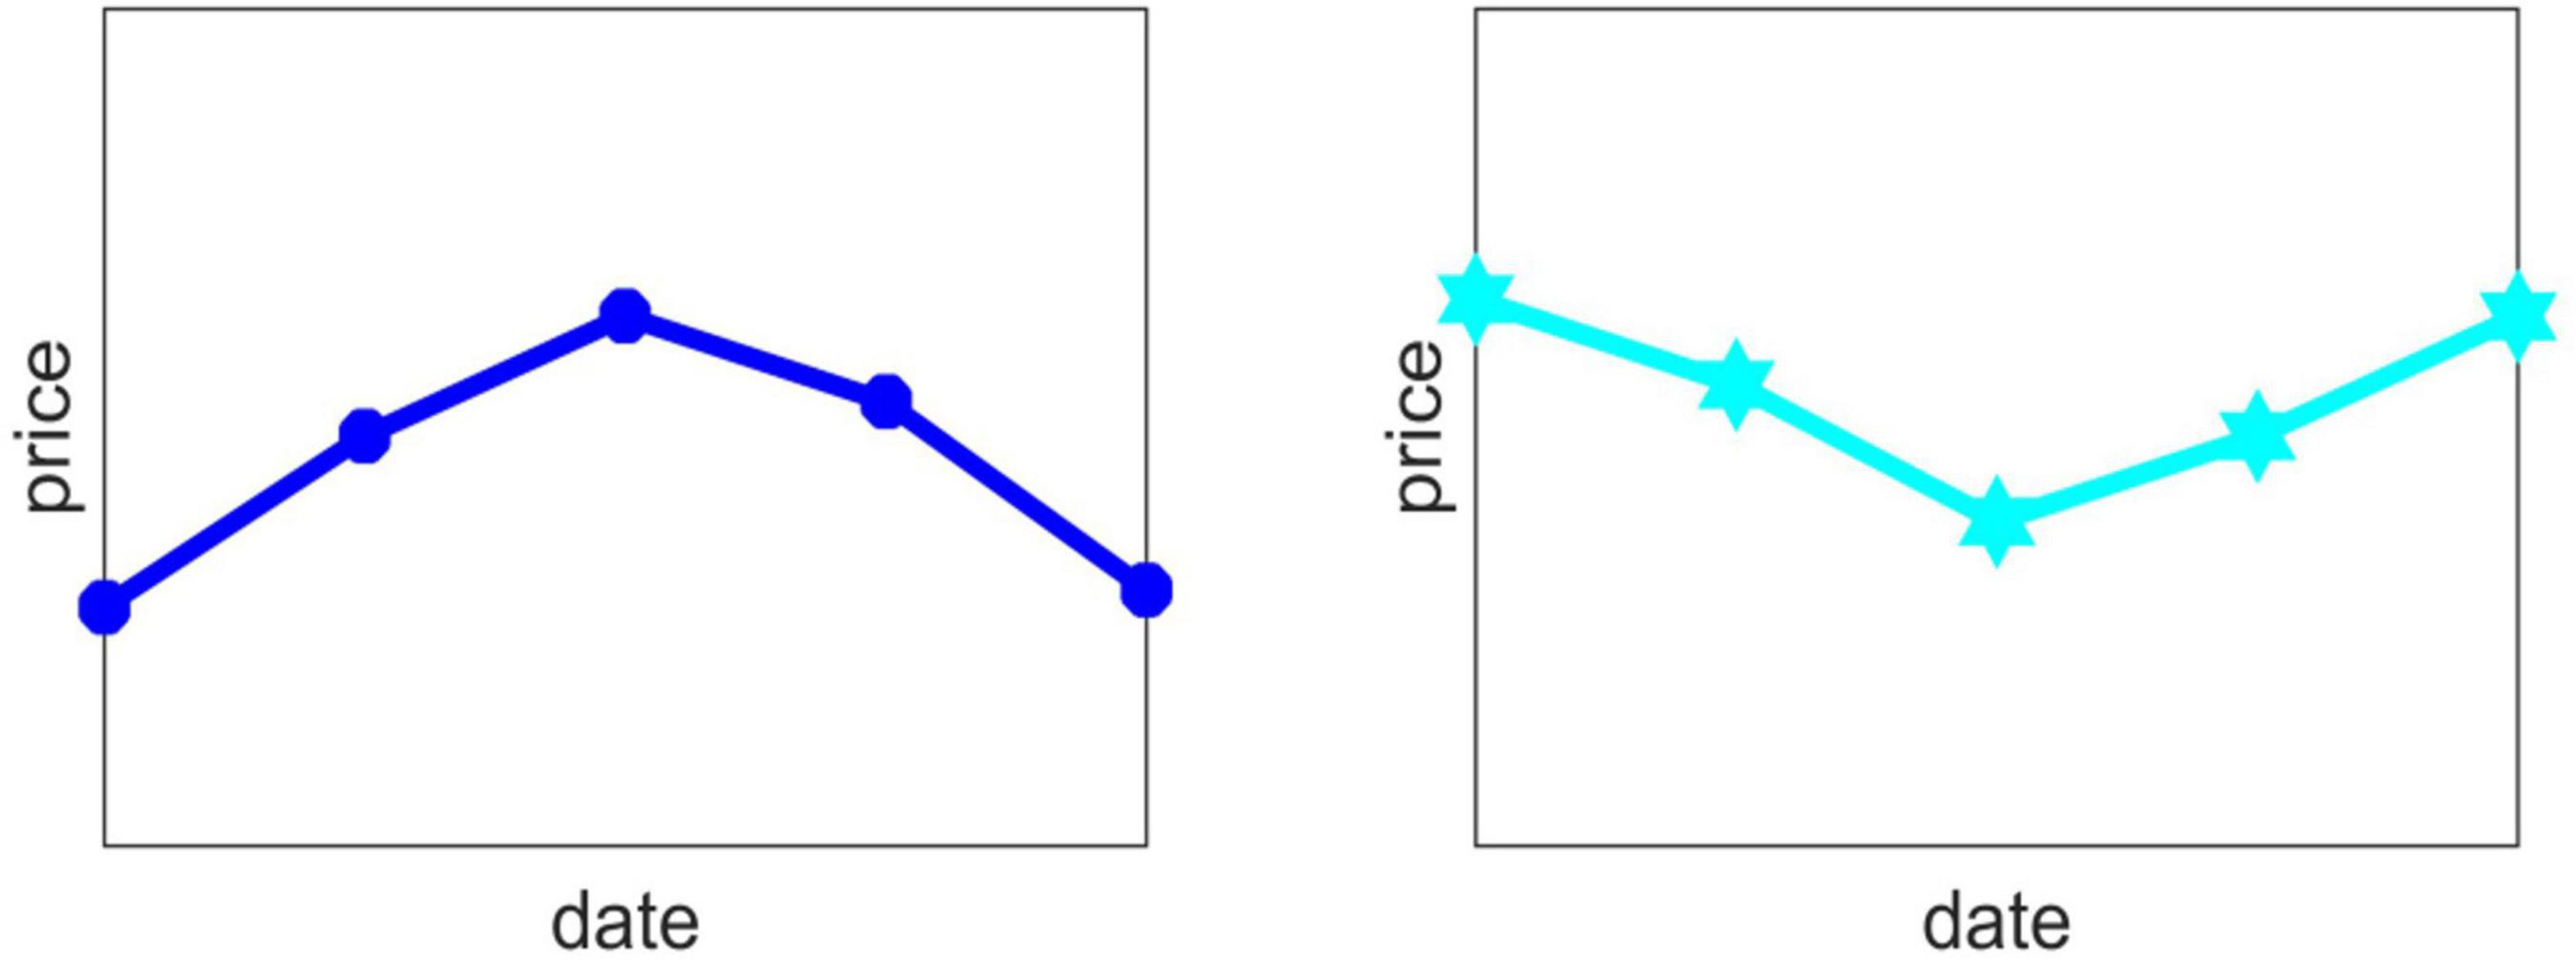
The price of the product will not rise or fall all the time. The price must rebound at a certain time, that is, there is an “inflection point.” At this time, we have to make different decisions according to the appearance of an upper inflection point (convex) or a lower inflection point (concave). The convex type is Di,1, Di,2, Di,3, Di,4, respectively 1, 1, −1, −1 or 1, −1, −1, −1 or 1, 1, 1, −1; The concave type is Di,1, Di,2, Di,3, Di,4 are −1, −1, 1, 1 or −1, 1, 1, 1 or −1, −1, −1, 1, respectively. The trend chart is shown in Figure 5.
When the price trend is convex type, it means that the highest point may appear in the next few days. In order to pursue higher interests and reduce risks, we make a decision to increase the position in a small amount and wait for the highest point to appear before selling. When the price trend is concave type, it means that the lowest point may occur in the next few days. In order to pursue higher profits and reduce losses, we make a decision to reduce the position by a small amount, and prepare enough cash to wait for the lowest point to appear.
Oscillation type
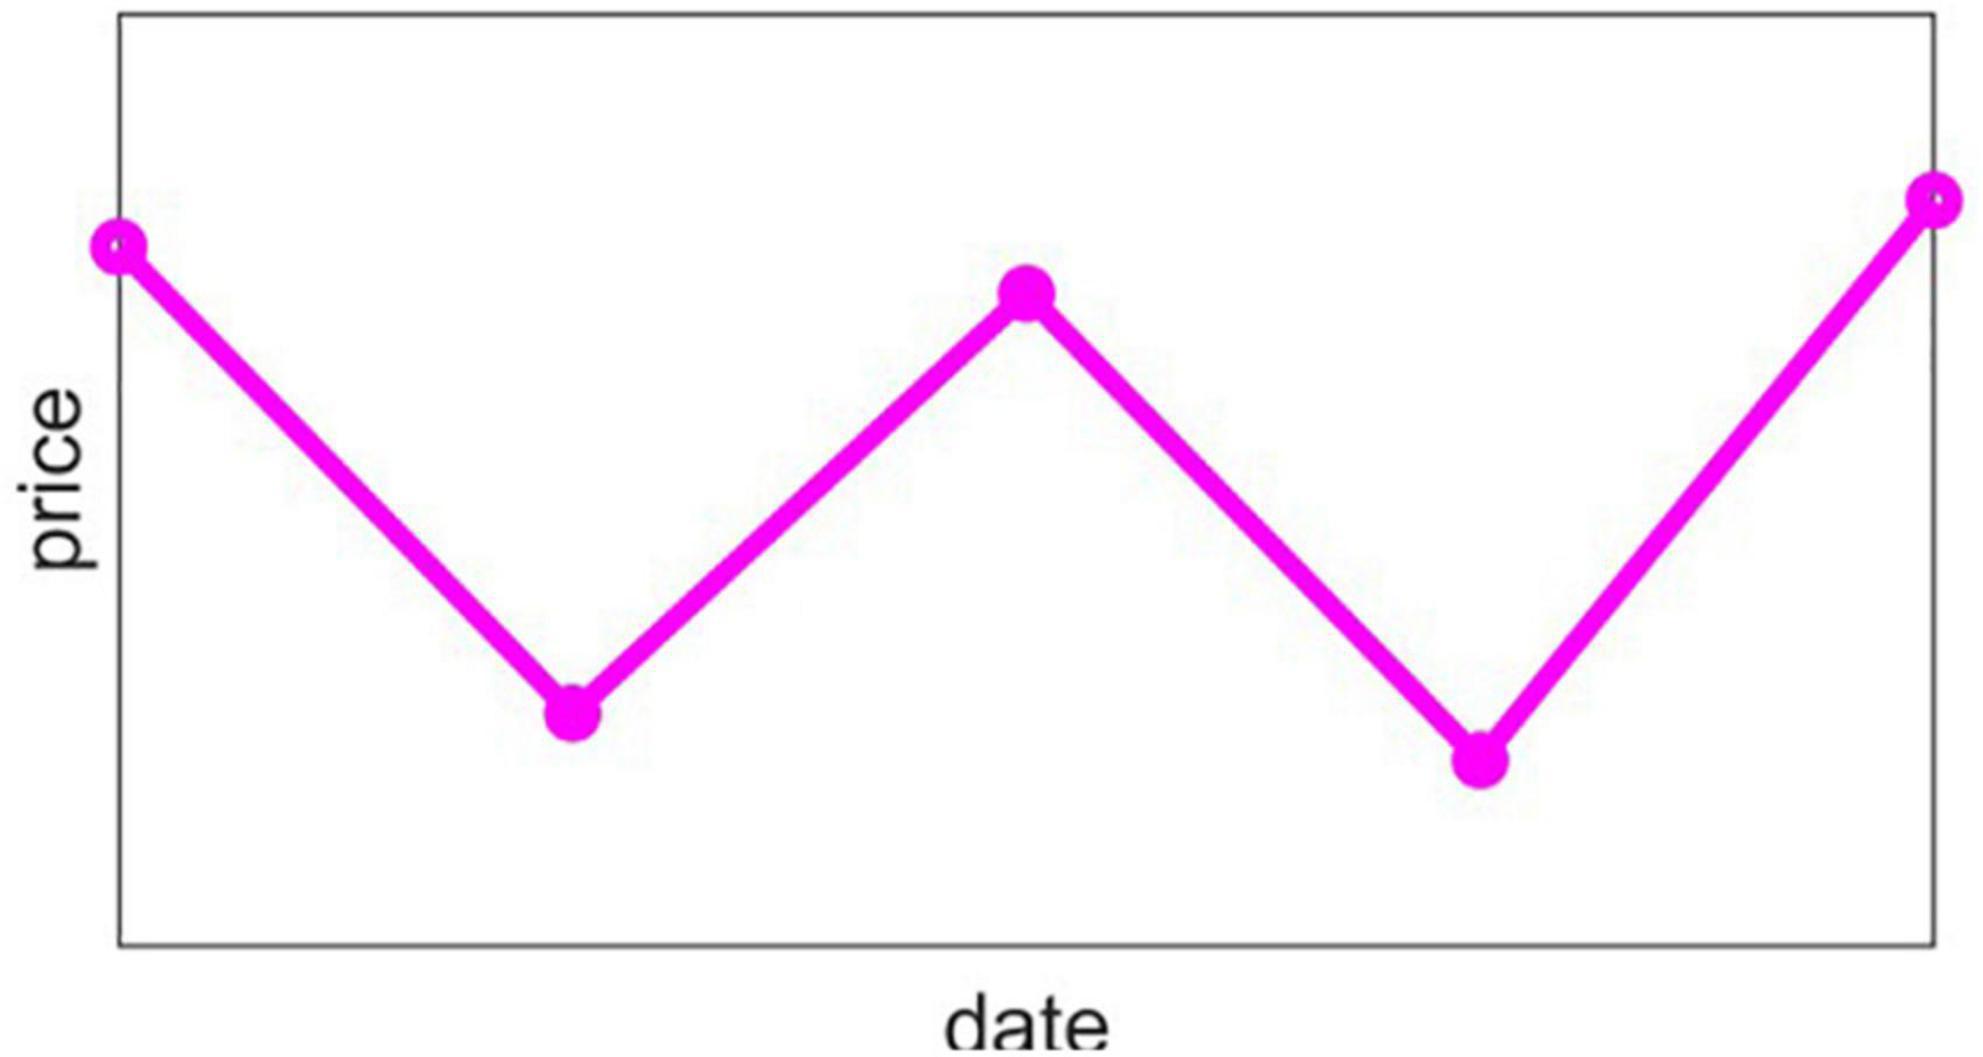
Different from the obvious ups and downs above, the oscillating type is characterized by unstable ups and downs, and is in an oscillating shape, that is, Di,n will alternate between 1 and –1, and its trend chart is shown in Figure 6.
For the oscillating type, assuming that the change after the oscillation is small, or even the income is not enough to pay the transaction fee, we believe that it is better not to trade in this case, so if the four price changes are all within the threshold, no trading operation will be performed. The weights of the predictions vary from day to day and are 1.55, 2.25, 3.15, and 4.5%.
In response to this price trend, we made a decision to reduce positions directly when both gold and bitcoin need to be reduced. When one party needs to increase the position and the other party needs to reduce the position, in order to maximize the benefits, the position reduction operation is carried out first, and then the position is increased. When both gold and bitcoin need to add positions, they will be added according to the transaction ratio.
The superiority of the trading strategy
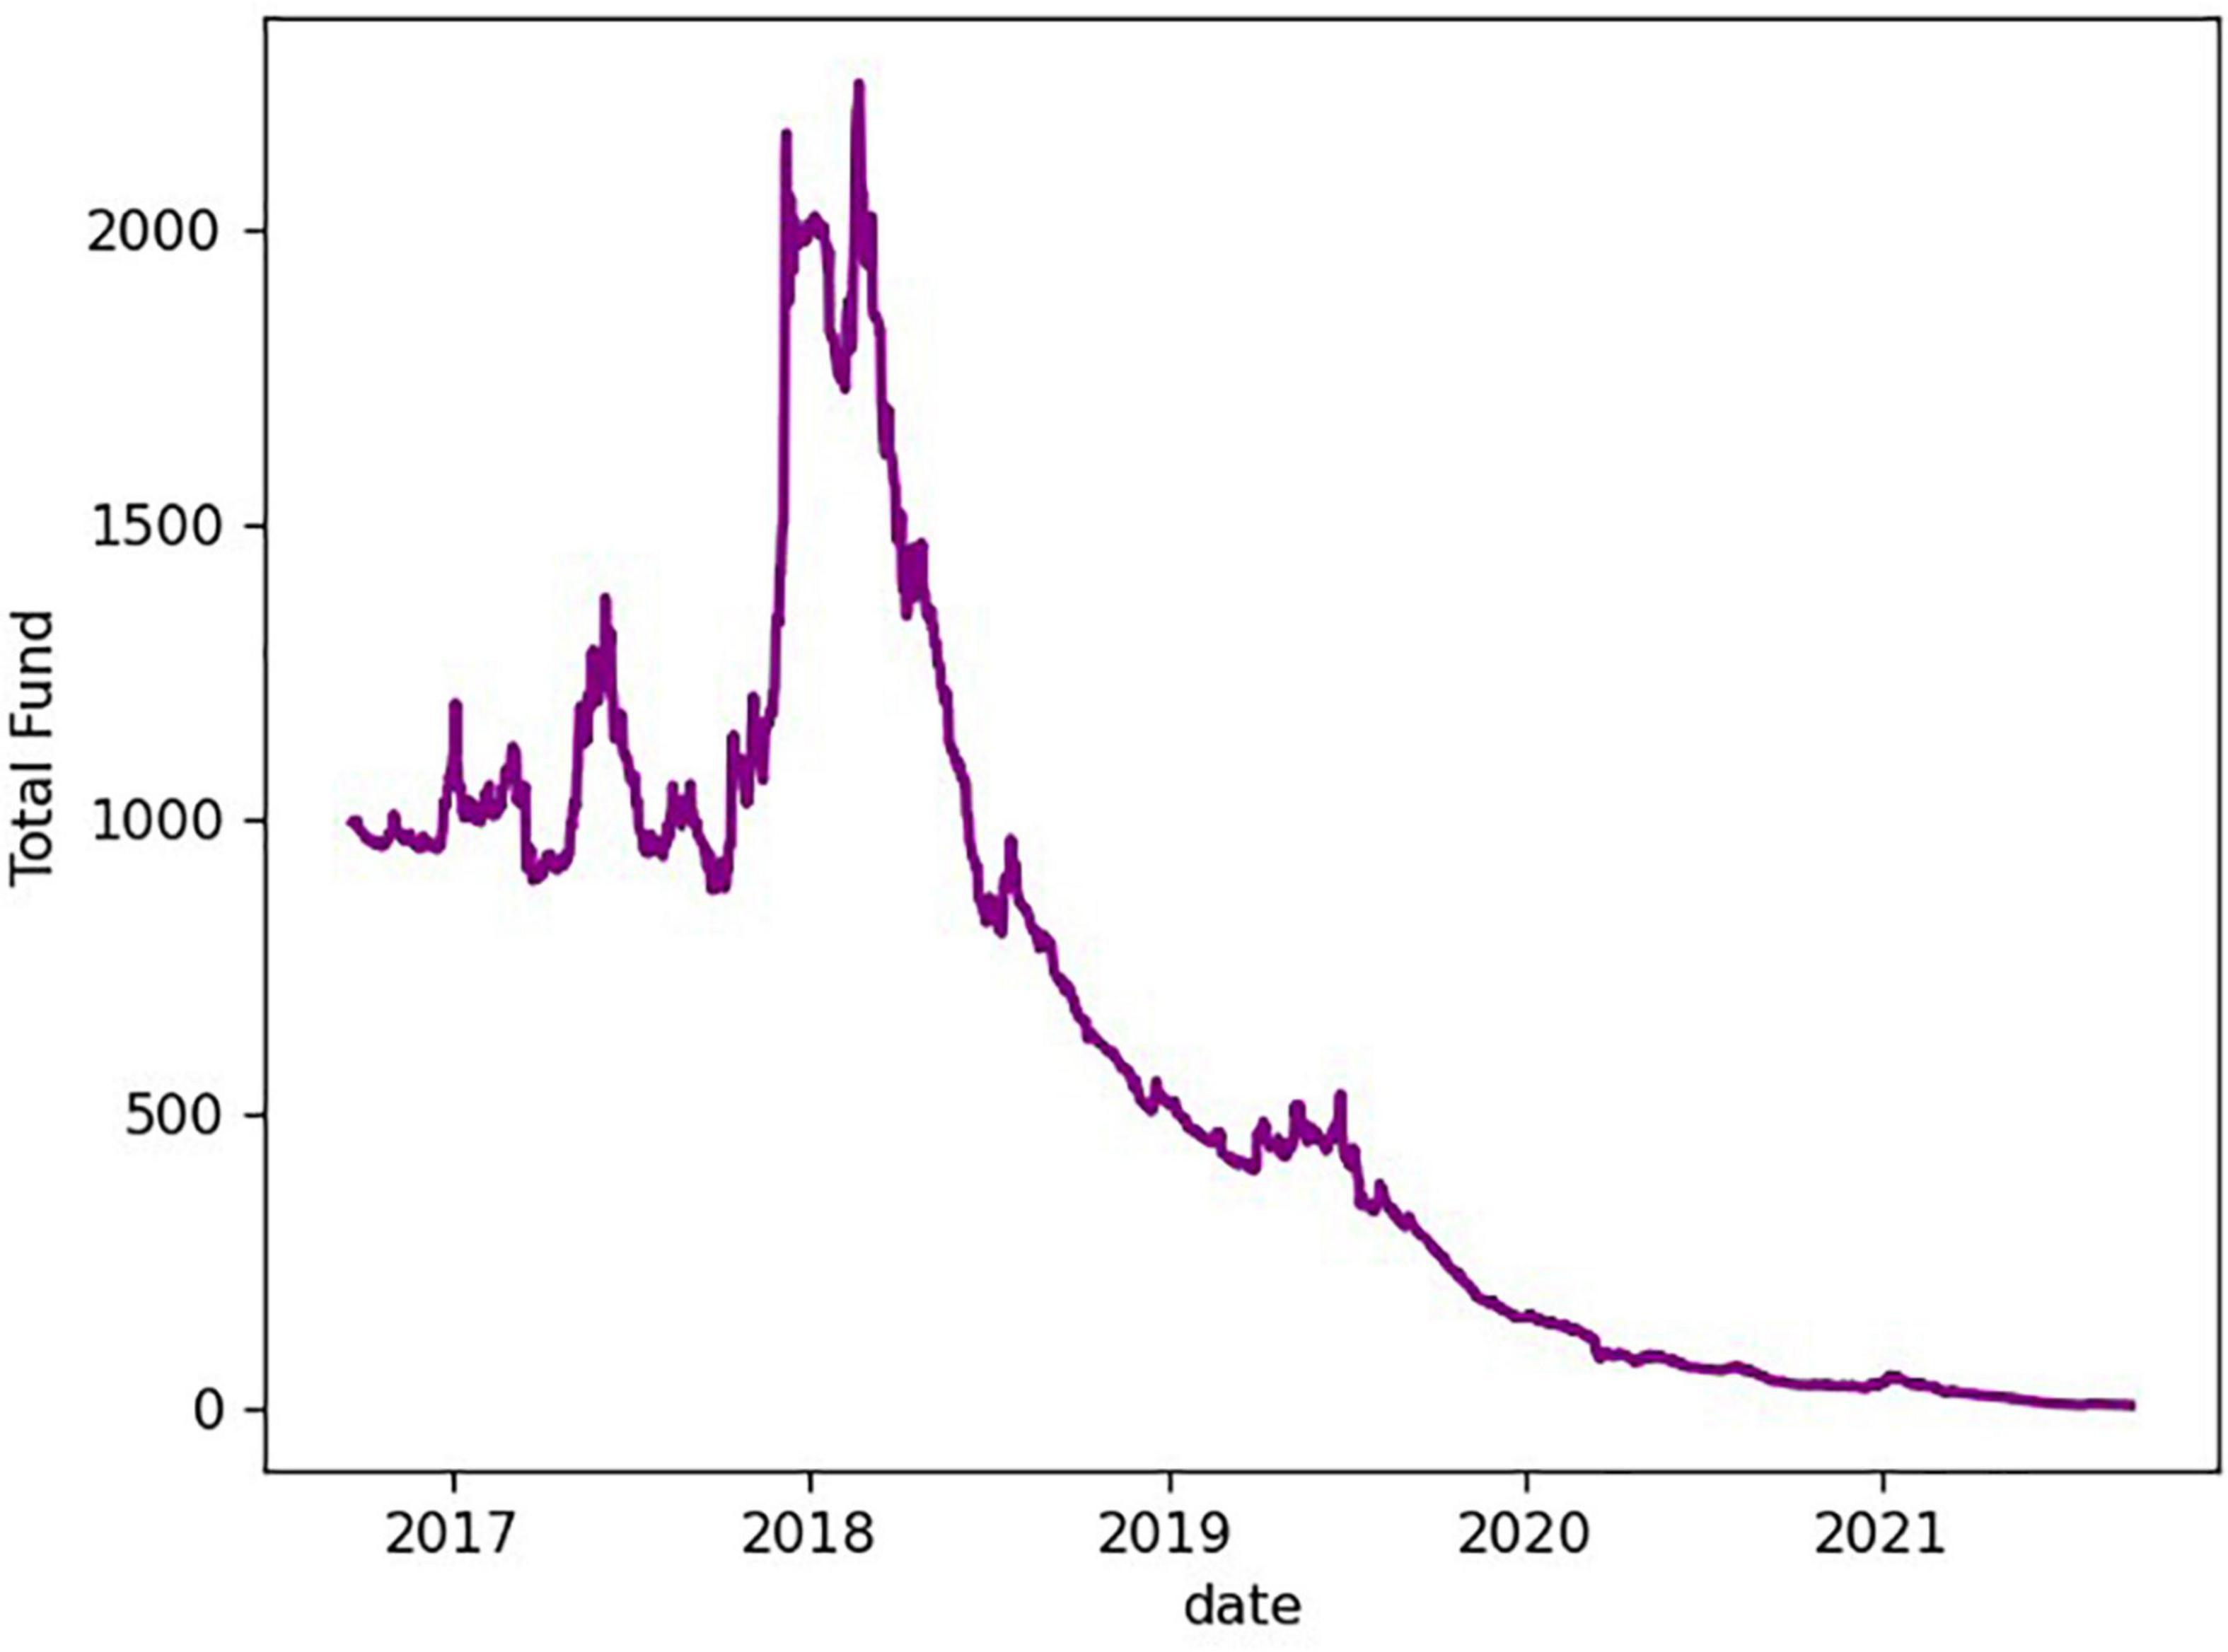
The most common trading strategy in the trading market is the strategy of chasing up and selling down, that is, there is no need to predict the future market. If the price change is within the threshold, no trade is made, if the threshold is exceeded, trade according to
The portfolio asset curve that operates according to this trading strategy is shown in Figure 7.
It can be seen from the figure that the total assets are close to 0 after 5 years, indicating that this trading strategy is not desirable.
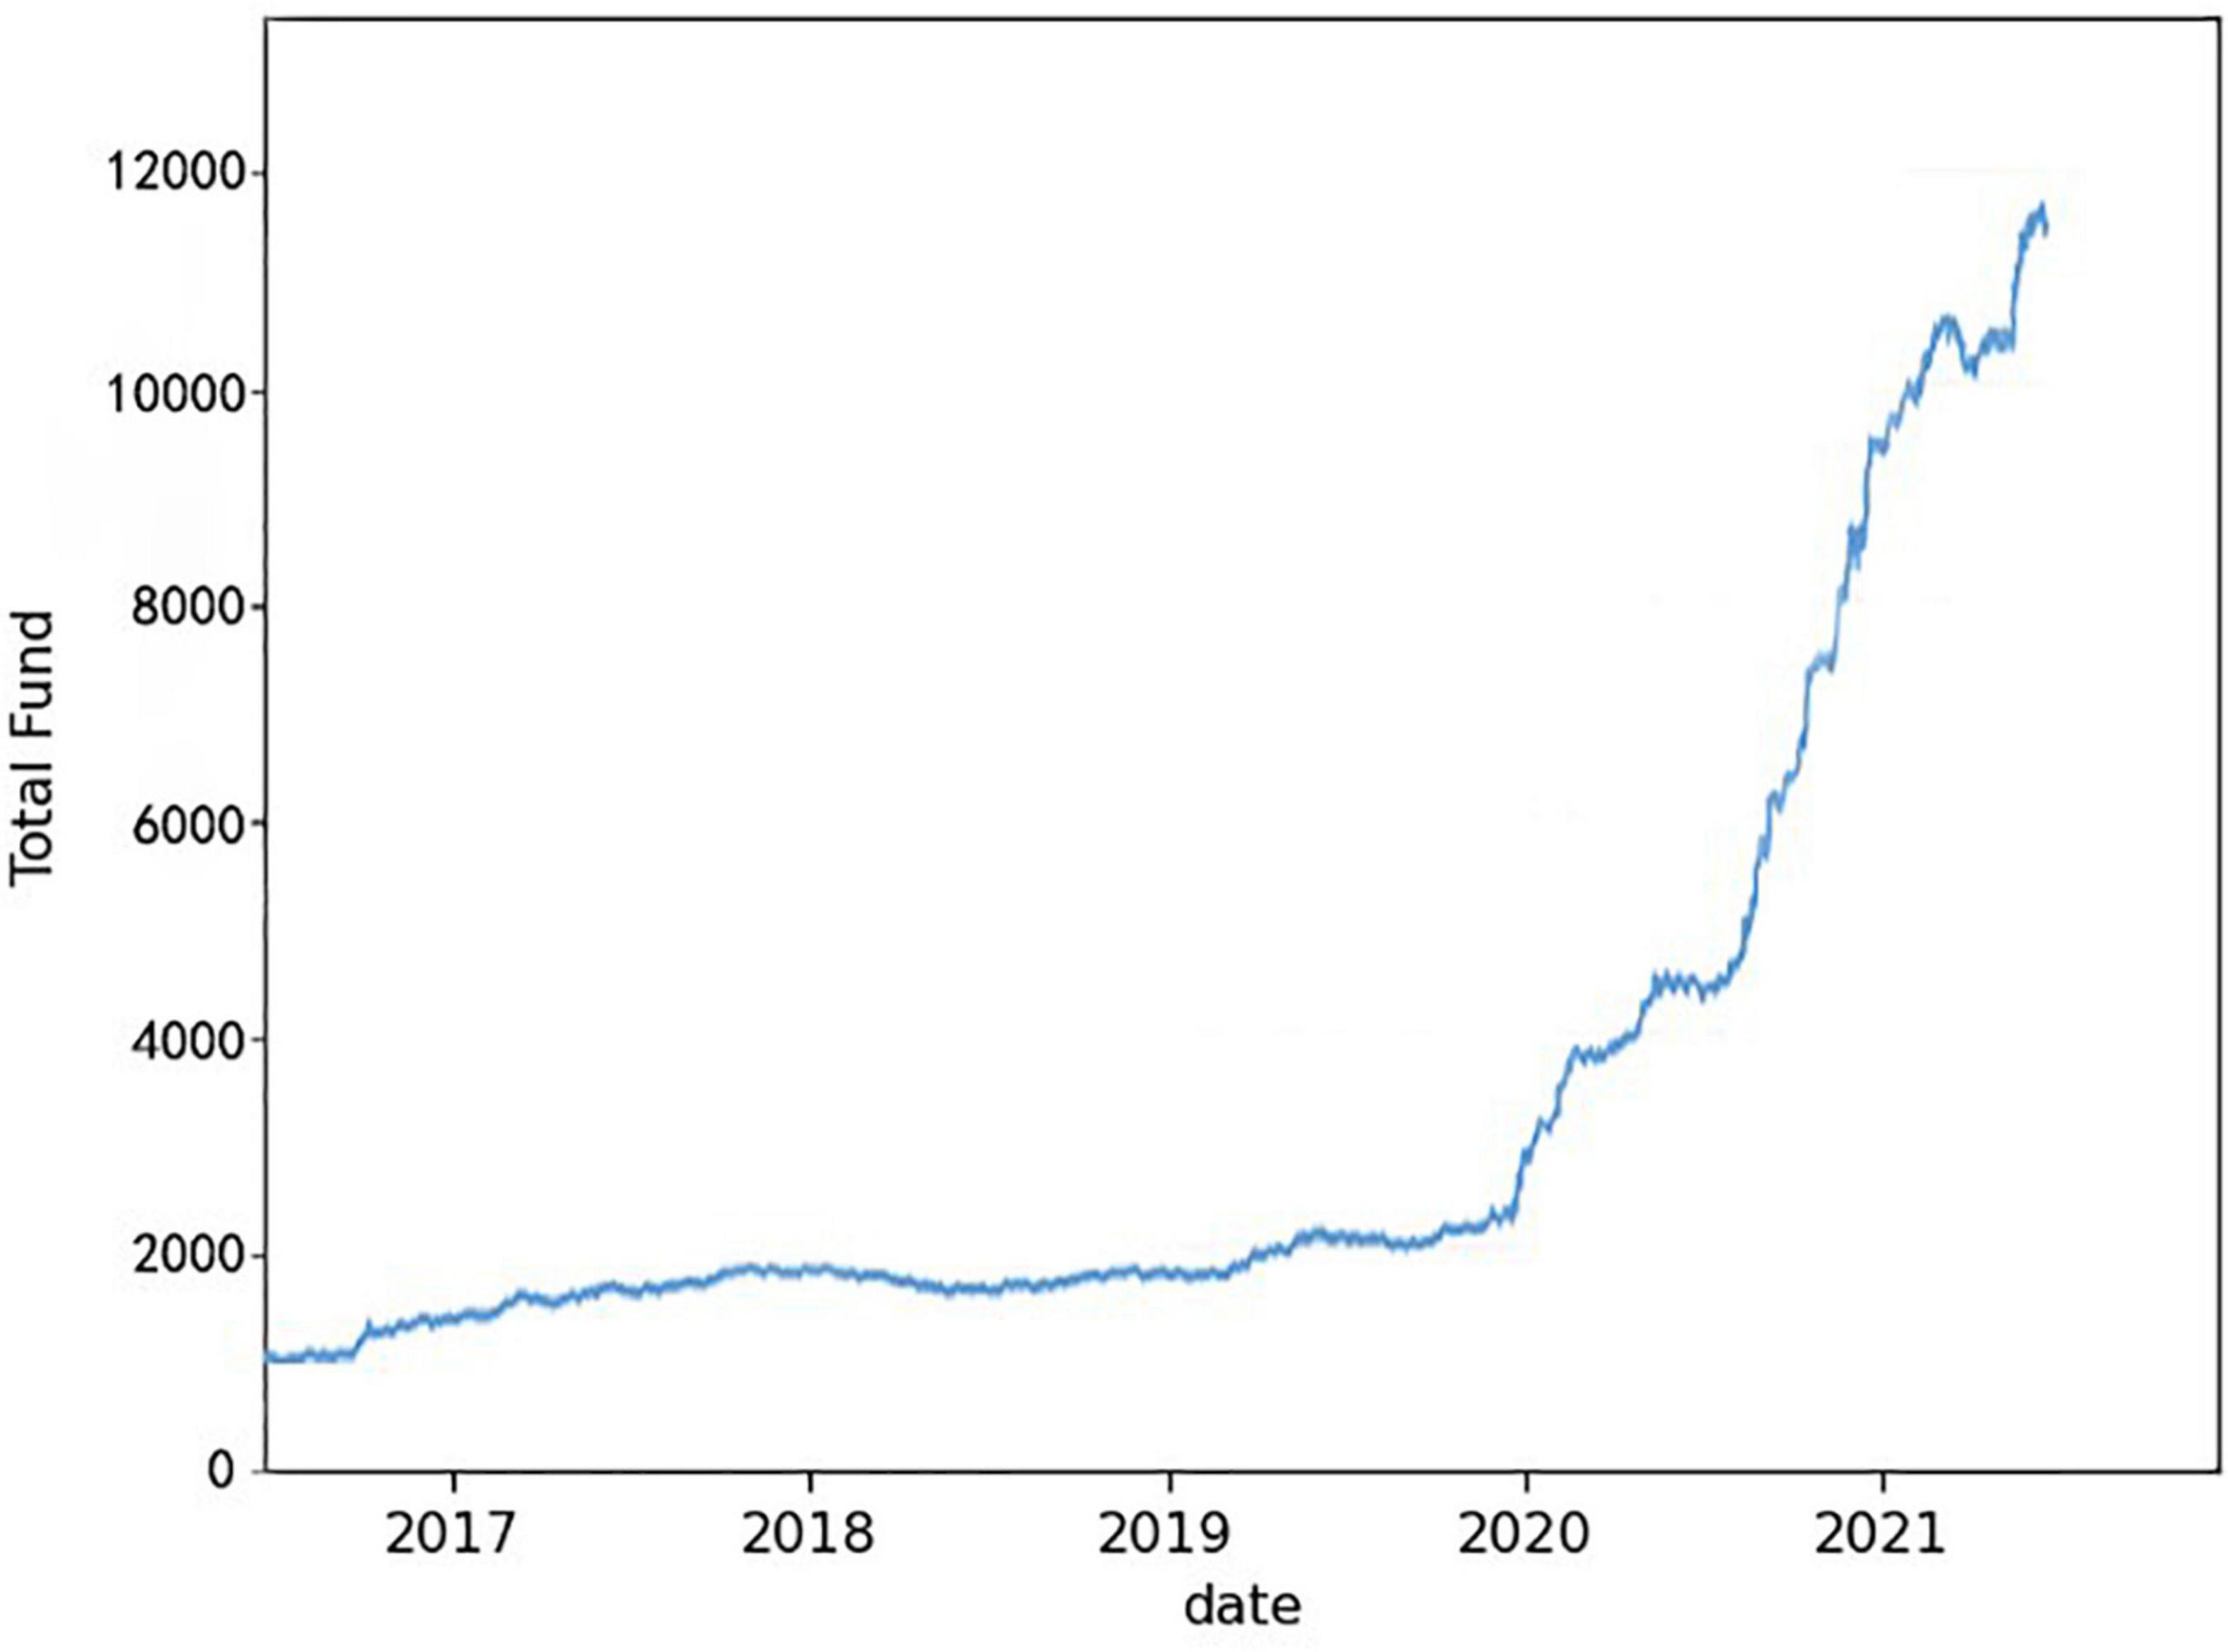
According to the above decision model, we make “today” trading decisions based on “today” and the price of gold and bitcoin before “today.” The initial amount was $1,000, and after 5 years of trading assets totaled $242,780.5, an annualized return of 199.9%. Its asset curve is shown in Figure 8.
In the trading strategy based on the long short-term memory network model, we measure the superiority of the strategy from the following aspects:
(i) Annualized rate of return.
(ii) Benchmark annualized rate of return.
Only looking at the annualized rate of return of the strategy cannot reflect the quality of the strategy, so it is often necessary to refer to the benchmark annualized rate of return (Ljungqvist and Habib, 2000; Clark and Mccracken, 2010; Ing-Haw and Konstantin, 2010). Taking the CSI 300 Index as the benchmark for strategic judgment, it can be seen that the average annualized rate of return is about 10.96%.
(iii) Maximum drawdown rate.
Drawdown is the maximum drawdown rate, that is, the maximum drawdown rate for all net values (Sharman and Whitehouse, 1993; Chai et al., 2004; Pospisil and Vecer, 2008; Jiao and Guo, 2009).
(iv) Sharpe ratio.
On the basis of a comprehensive analysis of risk and return, the overall risk assumed by the portfolio is assessed (Whatmore et al., 1995; Young, 2008; Nguyen et al., 2015).
(v) Information rate.
The information rate is used to measure the excess return brought by taking active risk, which means the excess return brought by the unit of active risk. Therefore, in the case of taking a moderate risk, try to pursue a high information rate (Dai et al., 2007; Frederiksen et al., 2008; Secondini et al., 2013).
The information ratio is equal to the ratio of strategy excess return to tracking error. Among them, the tracking error is the annualized standard deviation of the return difference between the strategy and the base day. If the same benchmark is chosen, it can be seen that a strategy with a large information ratio is better than a strategy with a low information ratio. Moreover, compared with the Sharpe ratio, the information ratio can better reflect the quality of the strategy. The Sharpe ratio takes the risk-free rate of return as the reference standard, while the information ratio takes the benchmark rate of return as the reference standard (Chun et al., 2006; Moore et al., 2009; Secondini et al., 2013; Lu and Fu, 2014; Farras et al., 2017).
The evaluation results of the trading strategy based on the long short-term memory network model are shown in Table 2.
The annualized rate of return is close to 200%, and the rate of return is relatively high. The maximum drawdown rate is only 13.122%, which means that the combination has high risk resistance and extremely low maximum loss. A Sharpe ratio of 8.29 means that for every unit of risk taken there is a return of more than 8 points, indicating that the reward of the trading strategy far outweighs the risk. The information rate is 5.9863, that is, taking 10% of the risk will bring nearly 60% of excess returns. The above indicators fully demonstrate the superiority of our trading strategy.
Sensitivity of trading strategies to transaction costs
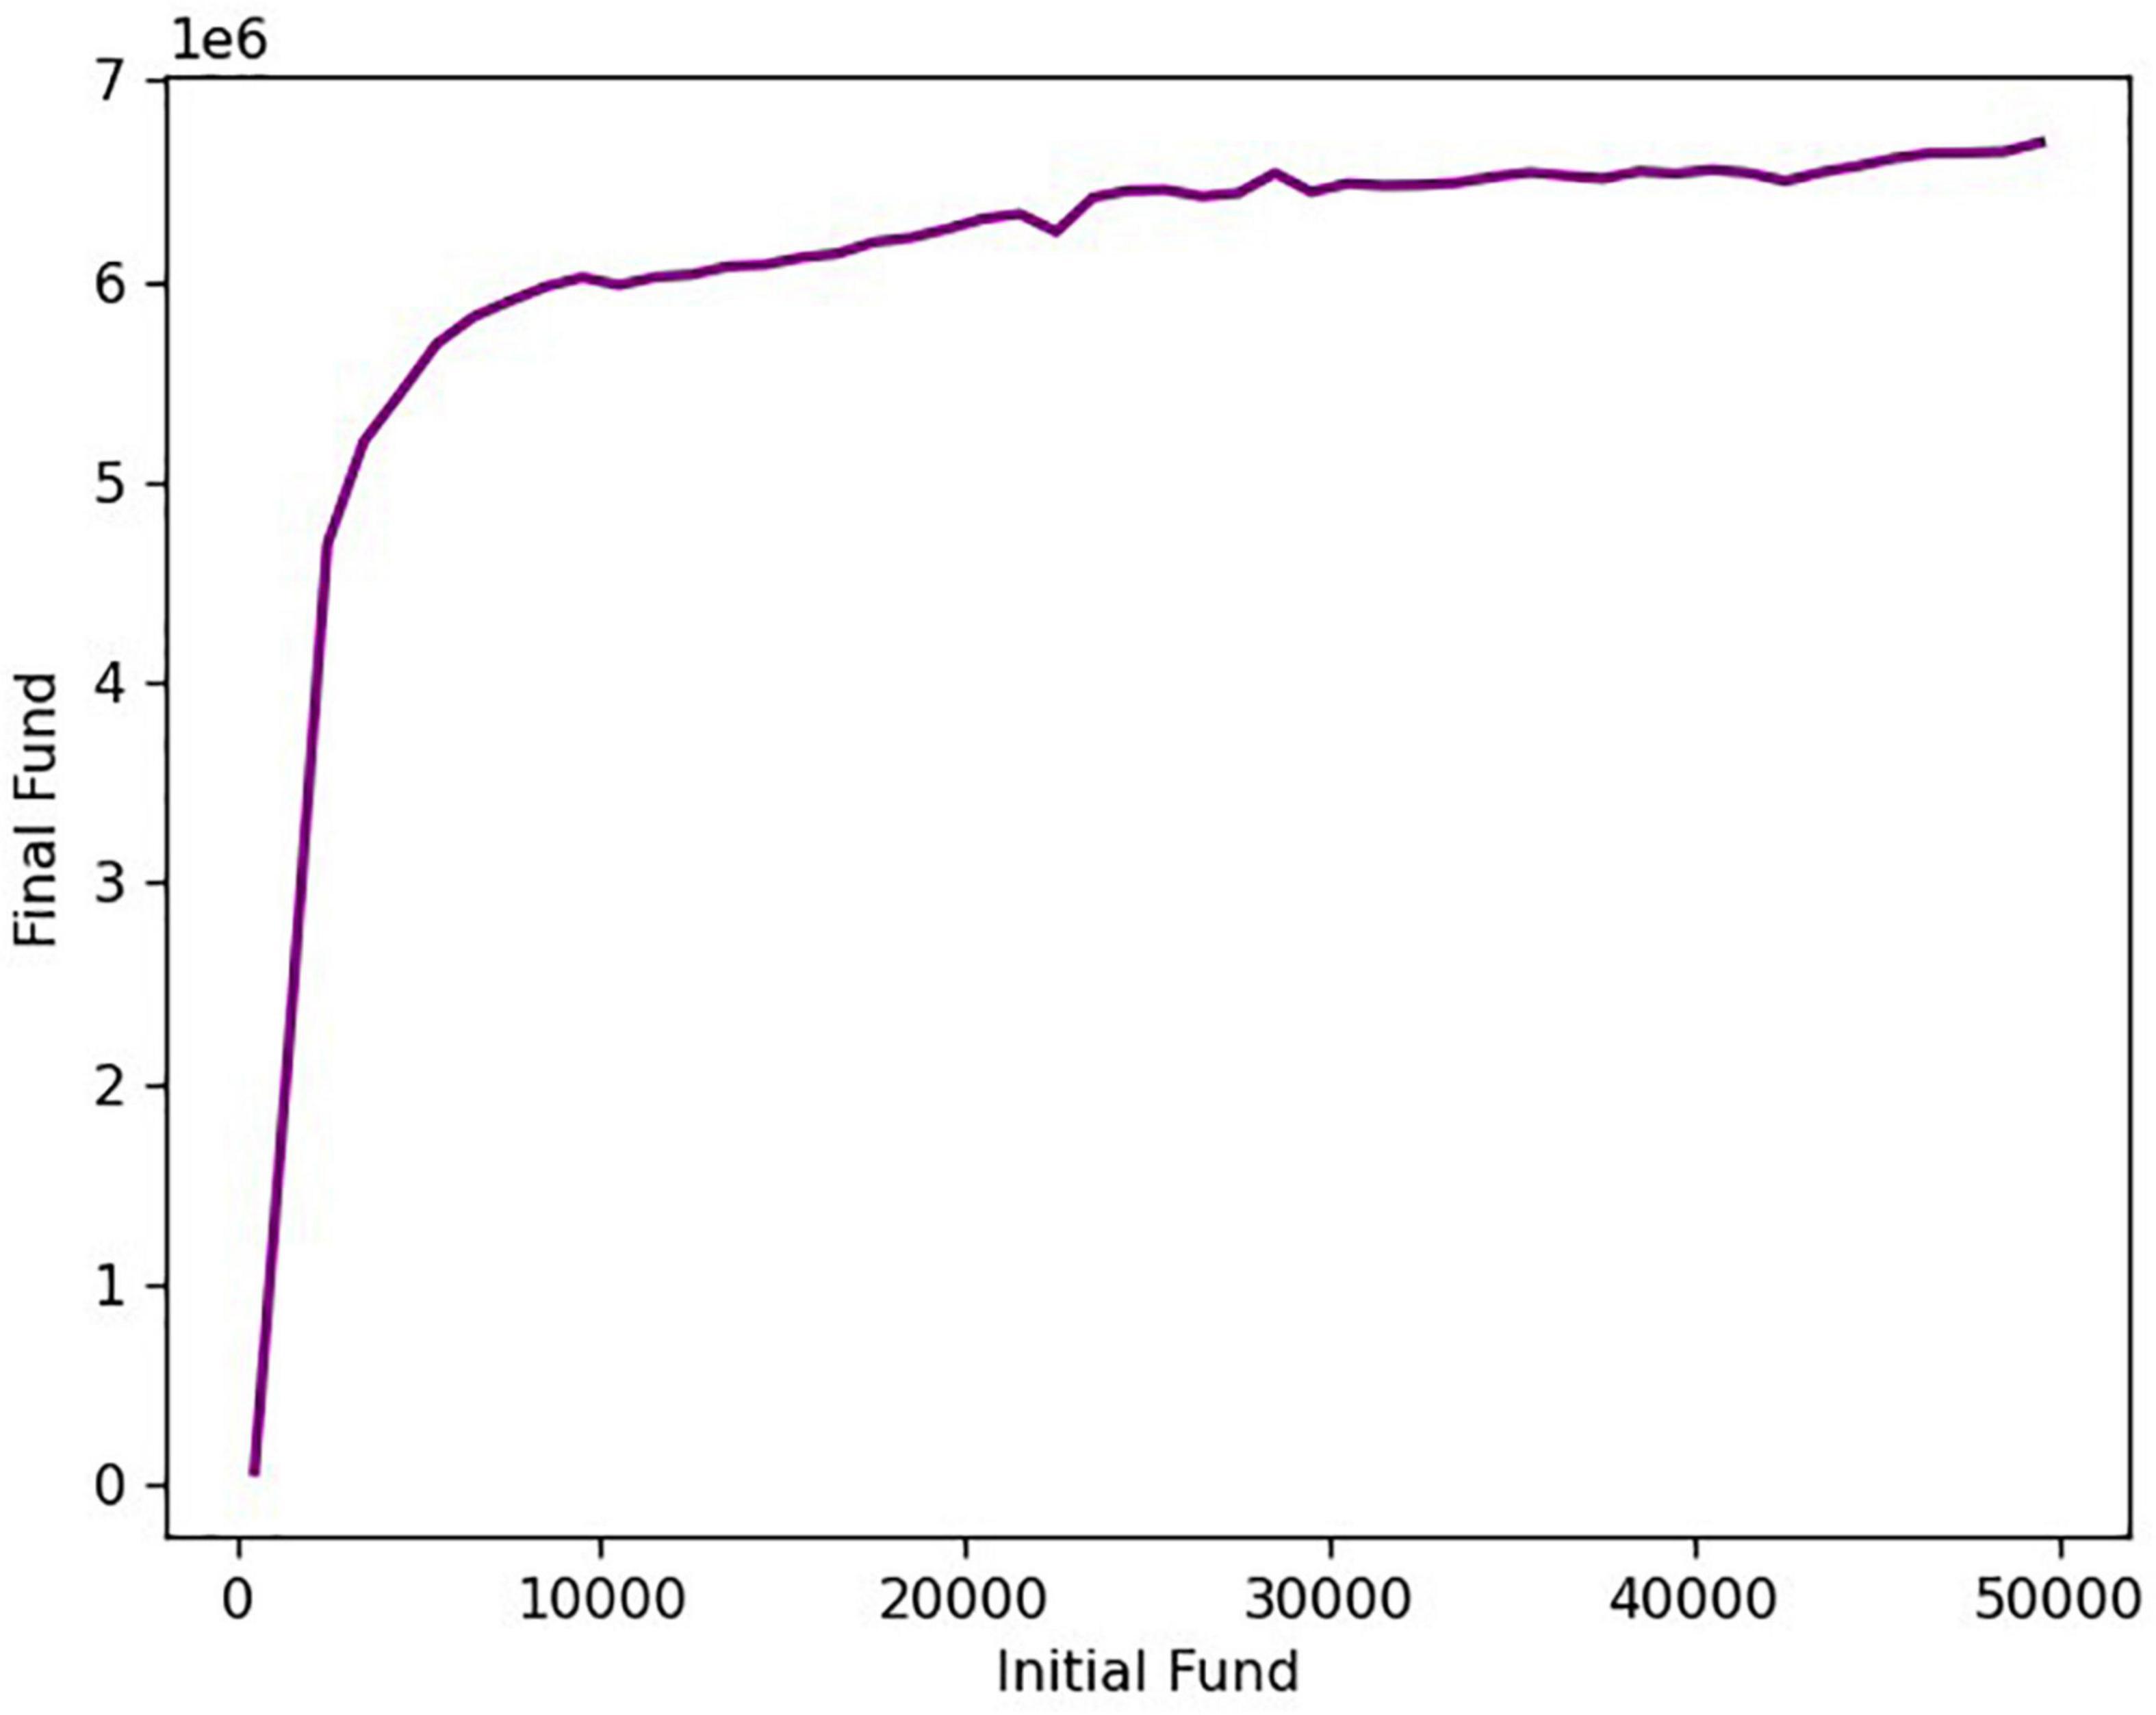
Due to too many influencing factors in the actual transaction process, the initial investment amount will undergo complex non-linear changes during the transaction process, which will affect every transaction decision (Cerny, 1994; Nishimura, 1998; Chang et al., 2011). With the difference in the initial investment amount, the yield after 5 years of the transaction will also be different. Here we discuss how sensitive a trading strategy is to transaction costs in order to determine what initial amount can yield a higher rate of return. The graph of the relationship between the initial funds and the final funds is shown in Figure 9.
It can be seen from the figure that in the range of the initial capital of 500–3,000 US dollars, the total value of assets after the transaction and the initial investment capital are basically linear, indicating that there is no significant change in the annualized return within this range. When the initial capital is greater than $3,000, the annualized rate of return decreases as the initial capital increases. When holding less funds, taking high risks in pursuit of high returns, more inclined to buy a higher proportion of gold and bitcoin. Funds with an initial capital of less than $3,000 are relatively small and will not result in a significant change in yield. When holding a lot of funds, in order to reduce the risk and get the maximum return on the premise of keeping the principal, it is more inclined to reduce the transaction ratio, so that the yield is relatively reduced (Kim and Verrecchia, 1994; Pompa et al., 2003).
Based on the above, when using our trading strategy, it is best to control the initial capital at around $3,000, which can not only maintain the yield, but also reduce the risk.
Conclusion
When considering the liquidity of the market, we can introduce liquidity parameters, add liquidity indicators to the trading ratio, and adjust the trading strategy based on the open interest. At the same time, according to the international situation, the index of international situation judgment is introduced to judge the international situation (He et al., 2021; Jia-Bao et al., 2021; Xu et al., 2022; Yang et al., 2022; Zhu et al., 2022). This article obtains a better trading strategy by studying the combined trading of gold and bitcoin, and proves the superiority and stability of the model. In addition, this trading strategy can also be extended to funds, stocks, futures and other transactions, and has a wide range of applications in the financial field.
Data availability statement
The original contributions presented in this study are included in the article/supplementary material, further inquiries can be directed to the corresponding author.
Author contributions
H-YW: methodology, conceptualization, supervision, and leadership. A-QL: conceptualization, visualization, software, validation, and writing manuscript. C-CT: data collation, visualization, verification, and investigation. C-JW: software, method design, validation, and data analysis. Y-HX: verification, supervision, and writing—review and editing. All authors read and approved the final manuscript.
Funding
This study was funded by the Anhui Quality Engineering Project Teaching Demonstration Course “Mathematical Modeling” (2020SJJXSFK0018) and the Teaching and Research Fund Project of the Anhui University of Finance and Economics (acxkjs2021005 and acyljc2021002).
Conflict of interest
The authors declare that the research was conducted in the absence of any commercial or financial relationships that could be construed as a potential conflict of interest.
Publisher’s note
All claims expressed in this article are solely those of the authors and do not necessarily represent those of their affiliated organizations, or those of the publisher, the editors and the reviewers. Any product that may be evaluated in this article, or claim that may be made by its manufacturer, is not guaranteed or endorsed by the publisher.
References
Altan, A., Karasu, S., and Zio, E. (2021). A new hybrid model for wind speed forecasting combining long short-term memory neural network, decomposition methods and grey wolf optimizer. Appl. Soft Comput. 100:106996. doi: 10.1016/j.asoc.2020.106996
Andrychowicz, M., Dziembowski, S., Mazurek, Ł., and Malinowski, D. (2016). Secure multiparty computations on bitcoin. Commun. ACM 59, 76–84. doi: 10.1145/2896386
Babaioff, M., Dobzinski, S., Oren, S., and Zohar, A. (2011). On bitcoin and red balloons. Acm Sigecom Exchanges 10, 5–9. doi: 10.1145/2325702.2325704
Barbounis, T. G., Theocharis, J. B., Alexiadis, M. C., and Dokopoulos, P. S. (2006). Long-term wind speed and power forecasting using local recurrent neural network models. IEEE Trans. Energy Convers. 21, 273–284. doi: 10.1109/TEC.2005.847954
Bryans, D. (2013). Bitcoin and money laundering: Mining for an effective solution. Soc. Sci. Electron. Publ. 89, 441–472.
Cerny, P. G. (1994). The dynamics of financial globalization: Technology, market structure, and policy response. Policy Sci. 27, 319–342. doi: 10.1007/BF01000063
Chai, J. C., Shen, S. L., Zhu, H., and Zhang, L. X. (2004). Land subsidence due to groundwater drawdown in Shanghai. Geotechnique 56, 143–147. doi: 10.1680/geot.2004.54.2.143
Chang, W. Y., Tsai, H. F., and Chang, J. J. (2011). Interest rate rules and macroeconomic stability with transaction costs. Int. Rev. Econ. Finance 20, 744–749. doi: 10.1016/j.iref.2011.01.002
Chen, L., Li, C., Huang, T., Ahmad, H. G., and Chen, Y. (2014). A phenomenological memristor model for short-term/long-term memory. Phys. Lett. A 378, 2924–2930. doi: 10.1016/j.physleta.2014.08.018
Chun, K. H., Briganti, A., Lebeau, T., Fradet, V., Steuber, T., Walz, J., et al. (2006). The 2002 AJCC pT2 substages confer no prognostic information on the rate of biochemical recurrence after radical prostatectomy. Eur. Urol. 49, 273–279. doi: 10.1016/j.eururo.2005.12.009
Clark, T. E., and Mccracken, M. W. (2010). Reality checks and nested forecast model comparisons. SSRN Electron. J. 30014:935. doi: 10.2139/ssrn.1687219
Dai, W., Liu, Y., Rider, B., et al. (2007). On the information rate of MIMO systems with finite rate channel state feedback using beamforming and power on/off strategy. IEEE Trans. Inf. Theory 551, 5032–5047.
Doremus, H. R. (1964). Optical properties of small gold particles. J. Chem. Phys. 410, 3259–3259. doi: 10.1063/1.1725708
Farras, O., Hansen, T. B., Kaced, T., and Padró, C. (2017). On the information ratio of non-perfect secret sharing schemes. Algorithmica 79, 987–1013. doi: 10.1007/s00453-016-0217-9
Frederiksen, R., Wcislo, W. T., and Warrant, E. (2008). Visual reliability and information rate in the retina of a nocturnal bee. Curr. Biol. 18, 349–353. doi: 10.1016/j.cub.2008.01.057
He, Q., Xia, P., Li, B., and Liu, J. B. (2021). Evaluating investors recognition abilities for risk and profit in online loan markets using nonlinear models and financial big data. J. Funct. Spaces 2021, 1–15. doi: 10.1155/2021/5178970
Hopfield, J. J. (1982). Neural networks and physical systems with emergent collective computational abilities. Proc. Natl. Acad. Sci. U.S.A. 79, 2554–2558. doi: 10.1073/pnas.79.8.2554
Ing-Haw, C., and Konstantin, M. (2010). The hazards of debt: Rollover freezes, incentives, and bailouts. Rev. Financ. Stud. 25, 1070–1110. doi: 10.1093/rfs/hhr142
Jain, P. K., Lee, K. S., El-Sayed, I. H., and El-Sayed, M. A. (2006). Calculated absorption and scattering properties of gold nanoparticles of different size, shape, and composition: applications in biological imaging and biomedicine. J. Phys. Chem. B 110, 7238–7248. doi: 10.1021/jp057170o
Jareo, F., Gonzalez, M. O., Tolentino, M., and Sierra, K. (2020). Bitcoin and gold price returns: A quantile regression and NARDL analysis. Resour. Policy 67:101666. doi: 10.1016/j.resourpol.2020.101666
Jia-Bao, L., Bao, Y., Zheng, W.-T., and Hayat, S. (2021). Network coherence analysis on a family of nested weighted n-polygon networks. Fractals 29, 1–15. doi: 10.1142/S0218348X21502601
Jiao, J. J., and Guo, H. (2009). Airflow induced by pumping tests in unconfined aquifer with a low-permeability cap. Water Resour. Res. 450, 5450–5464. doi: 10.1029/2009WR007760
Kim, O., and Verrecchia, R. E. (1994). Market liquidity and volume around earnings announcements. J. Account. Econ. 17, 41–67. doi: 10.1016/0165-4101(94)90004-3
Ljungqvist, A., and Habib, M. A. (2000). Firm value and managerial incentives. J. Bus. 78, 2053–2094.
Lu, H. C., and Fu, H. L. (2014). The exact values of the optimal average information ratio of perfect secret-sharing schemes for tree-based access structures. Des. Codes Cryptogr. 73, 37–46. doi: 10.1007/s10623-012-9792-1
Lu, J., and Wu, M. (2021). Classification method of carbonate reservoir welltest interpretation model based on long and short-term memory network. IOP Conf. Ser. 781:022021. doi: 10.1088/1755-1315/781/2/022021
Lukosevicius, M., and Jaeger, H. (2009). Reservoir computing approaches to recurrent neural network training. Comput. Sci. Rev. 3, 127–149. doi: 10.1016/j.cosrev.2009.03.005
Lyu, C., Chen, B., Ren, Y., and Ji, D. (2017). Long short-term memory RNN for biomedical named entity recognition. BMC Bioinform. 18:462. doi: 10.1186/s12859-017-1868-5
Martin, C. R., Nishizawa, M., Jirage, K., and Kang, M. (2001). Investigations of the transport properties of gold nanotubule membranes. J. Phys. Chem. B 105, 1925–1934. doi: 10.1021/jp003486e
Mo, S. B., Lin, H. J., Chen, Y. W., et al. (2022). Bitcoin price prediction based on arima-transformer combination model based on wavelet analysis. Mod. Inf. Technol. 6, 32–35.
Moore, M. J., Suda, T., and Oiwa, K. (2009). Molecular communication: Modeling noise effects on information rate. IEEE Trans. Nanobioscience 8:169. doi: 10.1109/TNB.2009.2025039
Nguyen, T. T., Gordon-Brown, L., Khosravi, A., Creighton, D., and Nahavandi, S. (2015). Fuzzy portfolio allocation models through a new risk measure and fuzzy sharpe ratio. IEEE Trans. Fuzzy Syst. 23, 656–676. doi: 10.1109/TFUZZ.2014.2321614
Nishimura, K. G. (1998). Expectation heterogeneity and price sensitivity. Eur. Econ. Rev. 42, 619–629. doi: 10.1016/S0014-2921(97)00119-0
Pompa, G., Caloni, F., and Fracchiolla, M. L. (2003). Dioxin and PCB contamination of fish and shellfish: assessment of human exposure. Review of the international situation. Vet. Res. Commun. 27, 159–167. doi: 10.1023/B:VERC.0000014134.23782.10
Pospisil, L., and Vecer, J. (2008). Partial differential equation methods for the maximum drawdown. J. Comput. Finance 2, 59–76. doi: 10.21314/JCF.2008.177
Secondini, M., Forestieri, E., and Prati, G. (2013). Achievable information rate in nonlinear WDM fiber-optic systems with arbitrary modulation formats and dispersion maps. J. Light. Technol. 313, 3839–3852. doi: 10.1109/JLT.2013.2288677
Sharman, K. V., and Whitehouse, M. (1993). Nitrogen drawdown index as a predictor of nitrogen requirements for Nephrolepis in sawdust media. Sci. Hortic. 54, 23–33. doi: 10.1016/0304-4238(93)90080-A
Srivastava, N., Hinton, G., Krizhevsky, A., Sutskever, I., and Salakhutdinov, R. (2014). Dropout: A simple way to prevent neural networks from overfitting. J. Mach. Learn. Res. 15, 1929–1958.
Stognij, A. I., Novitskii, N. N., Tushina, S. D., and Kalinnikov, S. V. (2003). Preparation of ultrathin gold films by oxygen-ion sputtering and their optical properties. Tech. Phys. 48, 745–748. doi: 10.1134/1.1583829
Sun, W. Y., and Che, C. M. (2009). The anti-cancer properties of gold(III) compounds with dianionic porphyrin and tetradentate ligands. Coord. Chem. Rev. 253, 1682–1691. doi: 10.1016/j.ccr.2009.02.017
Tanaka, T., Moriya, T., Shinozaki, T., Watanabe, S., Hori, T., and Duh, K. (2016). Evolutionary optimization of long short-term memory neural network language model. J. Acoust. Soc. Am. 140, 3062–3062. doi: 10.1121/1.4969532
Whatmore, A. M., Cook, N., Hall, G. A., Sharpe, S., Rud, E. W., and Cranage, M. P. (1995). Repair and evolution of nef in vivo modulates simian immunodeficiency virus virulence. J. Virol. 69, 5117–5123. doi: 10.1128/jvi.69.8.5117-5123.1995
Xiong, B., Meng, X., Wang, R., Wang, X., and Wang, Z. (2021). Combined model for short-term wind power prediction based on deep neural network and long short-term memory. J. Phys. 1757:012095. doi: 10.1088/1742-6596/1757/1/012095
Xu, F., Zhang, Y.-M., Su, Y., Li, J., and Zhu, J.-M. (2022). Intelligent application of raw material supply chain planning system based on genetic algorithm. Wirel. Commun. Mob. Comput. 2022:5054529. doi: 10.1155/2022/5054529
Yang, P.-H., Yu, Y., Feng, G., Meng-Jie, Q., and Jia-Ming, Z. (2022). Prediction and risk assessment of extreme weather events based on gumbel copula function. J. Funct. Spaces 2022, 1–13. doi: 10.1155/2022/1438373
Ye, W. Y., Sun, L. P., and Miao, B. Q. (2020). Research on dynamic cointegration of gold and bitcoin——based on semiparametric MIDAS quantile regression model. Syst. Sci. Math. 40, 1270–1285.
Young, V. R. (2008). Pricing life insurance under stochastic mortality via the instantaneous sharpe ratio. Insurance 42, 691–703. doi: 10.1016/j.insmatheco.2007.07.002
Keywords: gold, Bitcoin, long short-term memory network model, trading strategy, mathematical processing
Citation: Wang H-Y, Li A-Q, Tie C-C, Wang C-J and Xu Y-H (2022) Mathematical processing of trading strategy based on long short-term memory neural network model. Front. Comput. Neurosci. 16:1052140. doi: 10.3389/fncom.2022.1052140
Received: 23 September 2022; Accepted: 17 October 2022;
Published: 28 November 2022.
Edited by:
Shaohui Wang, Louisiana College, United StatesReviewed by:
Jia-Bao Liu, Anhui Jianzhu University, ChinaDengbao Yao, Anhui University, China
Chunli Wang, Guilin Tourism University, China
Copyright © 2022 Wang, Li, Tie, Wang and Xu. This is an open-access article distributed under the terms of the Creative Commons Attribution License (CC BY). The use, distribution or reproduction in other forums is permitted, provided the original author(s) and the copyright owner(s) are credited and that the original publication in this journal is cited, in accordance with accepted academic practice. No use, distribution or reproduction is permitted which does not comply with these terms.
*Correspondence: Yun-Hua Xu, eWh4dTIwMDVAMTYzLmNvbQ==
 Han-Yang Wang1
 Yun-Hua Xu