 Alexander V. Mantzaris1*
 George-Rafael Domenikos2
- 1Department of Statistics and Data Science, University of Central Florida, Orlando, FL, United States
- 2Department of Social Sciences, Nanyang Technological University, Singapore, Singapore
This study presents an approach to analyzing a simulation of birds flocking as a thermodynamic system. The simulation of birds is produced using standard agent-based modeling and the thermodynamic variables for the states of the trajectory using statistical mechanics. The energy of the birds is defined, and from the distribution function, the entropy, internal energy, temperature, heat flux, and pressure are defined. The trajectory of the entropy decreases as the flocks increase clustering among each other, becoming denser. As a result, internal energy generally decreases (with minor oscillations), and an overall steady decrease of the cumulative heat flux is also observed. Pressure is observed to decrease as the simulation progresses with the increase of the volume. Overall, the system displays consistency with the expected trajectories of all the thermodynamics variables in a cooling process. Thus, through this thermodynamic definition, a more in-depth representation of the state space of the system is achieved. This description offers information about both the microscopic and macroscopic behaviors of the flocks and, importantly, an understanding about the exchange of energy/information between the flock and the external environment through the heat flux.
1 Introduction
Bird flocking has been studied (Emlen, 1952) using non-computational and computational approaches (Lee et al., 2009). There are many direct applications, such as in Virágh et al. (2014), which looks to improve autonomous aerial vehicle collective behaviors and is part of the general biomimetics effort to adopt biological behaviors into robotics (Vincent et al., 2006). The effort presented here aims to use the observations of flocking behavior models to improve the techniques and theory of “social physics” (Jusup et al., 2022). An understanding of bird flocks comprised of social interactions (Wang and Lu, 2019) can help our understand of human collective behaviors. The agent-based modeling (ABM) paradigm (Helbing, 2012a) can be used to simulated various systems such as bird flocks, pedestrians, and urban movements. Using a bird flocking system as a case study provides a modeling paradigm that can apply across multiple continuous space agent-based models. What is presented is a methodology for analyzing the simulation of bird flocking as a thermodynamic system, calculating the values of the thermodynamic variables over simulation time such as energy, entropy, internal energy, temperature, volume, and pressure.
As the aim of this work is not to provide the optimal algorithm for a bird flocking mechanism but to provide a thermodynamic description of the system, a simple flocking algorithm based on known research from the literature has been used. This research expands heavily on the description of the microscopic and macroscopic aspects of bird flocks. Inspired by physics, the building block of the system is the energy microstate, which is defined based on the properties of a single bird. Using these microstates, the probability distribution function and its evolution across time is identified. Like other informational systems, the entropy is defined, but in this study the traditional methods from the kinetic theory of gases are augmented and applied to the microstates of birds. As such, it is possible to reverse-engineer the concept of temperature upon the distribution function and define it on the given system. Having the temperature and the entropy, the rest of the thermodynamic variables can be defined (internal energy, free energy, etc.). In addition, by having this in-depth understanding of the correlation of the microstates of the system with the thermodynamic variables, it is possible to uniquely define the volume and pressure in a self-consistent manner. It is demonstrated that a full thermodynamic description can be established for such a system, and furthermore the results of the simulation are seen to be consistent with both thermodynamics and real bird-flocking behaviors.
It is observed through the results that the stability a flocking system reaches can be seen through different thermodynamic variables, based on different aspects of the system. The lowering entropy trace demonstrates that the system initiates from a disordered state into a more ordered one, something that follows the traditional spatial entropy trajectory of such systems. The temperature is also seen to decrease to a steady value; based on the temperature definition, this shows that the variance of the distribution function stabilizes. Thence, from this thermodynamic perspective, the interaction of such a system with its environment can be derived a model. The heat flux is found through the first law of thermodynamics, and it is shown to be negative with a decreasing absolute value until it stabilizes at zero. This directly corresponds to a cooling system in thermodynamics, demonstrating the correlation between the heat flux and the temperature and entropy. Lastly, based on the definition of the microstates, there is only a single way to define the volume of the system while keeping the boundary conditions of the laws of thermodynamics intact. When this volume defined, it is seen that it also follows the expected thermodynamic trajectory. With a derivation for the thermodynamics of the system, the non-energy variables of volume and pressure also have behaviors that correspond to a cooling thermodynamic process. Even though the volume and pressure are not correlated to the energy of the system in their definition, the trajectories from the simulation show the expected coupling.
These results help clarify how more ABMs can be modeled with their thermodynamic state trajectory. This is vital for the field of social physics, which aims to find physical analogs of social processes in order to improve predictions. The science of thermodynamics is mature and provided a robust set of tools to analyze systems. Section 1.1 will show the consistency between this system and the expected quantities of the simulation trajectory. As a result, more ABMs which are on a two-dimensional spatial system of continuous coordinates can adopt this approach and analyze the system thermodynamically.
1.1 Related work
A brief overview of the related literature is here presented and how this current study fits into the overall body of research. In general, our research extends the efforts of social physics, which aims to incorporate methods and theories of physics into social sciences, such as group behaviors like flocks/swarms. Jusup et al. (2022) review the field of social physics, covering many of the methods that analyze and model social systems using the developments in physics. This is in line with some of the original goals of this field and can be traced as far back as James C. Maxwell (a key figure in developing statistical mechanics and thermodynamics—Porter, 1981), who proposed the idea that societal dynamics resemble the dynamics within a gas. The field can be said to have received more attention with the establishment of cybernetics (Wiener, 1948), which overlaps with social physics, and produced one of the first articulations of social physics in Stewart (1950), who discusses Wiener (1948) as a wider view of the challenge and the need to cut across academic boundaries and put social processes within a quantitative paradigm akin to that developed in physics.
Quang et al. (2018) discussed ABMs for social physics (and econophysics) in a general setting where the dynamics of agents can be defined within the context of physical analogs with many application areas. Sornette (2014) also reinforced the perspective of research of these complex systems using ABMs with a particular emphasis on Ising models which have been used in various social analogs. All these studies do emphasize the ability to translate the equation forms for unit dynamics from physics to social systems. Epstein (1999) is a seminal work which speaks generally about ABMs for social systems modeling without specifically taking a physical analog, but it is fundamental to the historic progression and exploration of ABMs as a modeling paradigm. The paradigm covers both the analysis and generative aspects, showing how experimenters can investigate dynamics which replicate observed phenomena and attempt to replicate behaviors. Helbing (2012b) focused on the key aspect of the social processes of the above studies—emergent behaviors. The group dynamics which produce emergent behaviors are not immediately evident and typically require exploration (Ouellette, 2022; Wardil and Hauert, 2014). The decentralization of decision making (Reina et al., 2015) and the complex interconnectivity (Christakis and Fowler, 2009) between agents adds complexity to the field (An et al., 2021).
One of the most popular models of physics used in social physics has been the Ising model of ferromagnetism (Cipra, 1987; Brush, 1967). The Ising model is based on a two dimensional lattice where cells are occupied by a magnetic unit which has a spin state that is affected by the aggregate of the spins from its immediate neighbors (special boundary conditions aside). These aggregates change the states, allowing for clusters of similarly orientated cells (same spin) to appear. It has been adopted by researchers to model segregation patterns in urban areas. The Schelling model of segregation is a classic segregation model (Schelling, 1969; Schelling, 1971) which also uses a lattice; Stauffer and Solomon (2007) highlight the similarities between the Ising model and the social model of Schelling. Although the models may appear to be simple, they can display non-linear phase transitions (Gauvin et al., 2009) which is one of the reasons why social process are difficult to predict, as can be seen from Tsarev et al. (2019). Another relevant model for simulating flocks of birds is the Vicsek model, which offers the flexibility of simulating various types of swarming and flocking behaviors; however, it not used in this study. The algorithm we apply is more generic, allowing for future users to insert various conditionals which permit a wide range of flocking behavior modeling. It is expected that future practitioners will apply discrete rule sets which are not easy to incorporate into an equation-based model.
There has been recent interest from researchers in investigating the thermodynamic aspects of social simulations. Mantzaris et al. (2018) investigated the Schelling model by producing an equation-based model of the system and showing how a micro- and macro-state definition of the system can be defined and sampled along the trajectory. This allows for an entropic analysis of the trajectory beyond cluster density/size. Mantzaris (2020) built upon those results, with Mantzaris et al. (2018) showing a decreasing entropy trend due to the segregation organization which violates the principle of the arrow of time (Parrondo et al., 2009) —the second law of thermodynamics (Atkins, 2010). Mantzaris et al. (2018) showed that an increasing entropy trend is produced by incorporating a dual dynamic into the Schelling model based upon monetary exchange, along lines inspired by Hatna and Benenson (2012). Domenikos and Mantzaris (2022) explored the entropy traces of a basic voter model to examine how external system injections can affect collective decision making.
More along the lines of the investigation presented here is Pomorski and Kotula (2023) and Domenikos and Mantzaris (2024). In Pomorski and Kotula (2023), the thermodynamics for the Conway Game of Life is developed by defining a temperature
Specifically related to the entropic analysis of bird flocks, Castellana et al. (2016) investigated the probabilistic aspects and densities of the distributions to a great depth but did not seek a thermodynamic analog, as is done here. In Bialek et al. (2012), a maximum entropy analysis for the flocks of birds is produced which is of great value in assessing flock stability and consistency with the distributional changes (with prior work in Cavagna et al. (2014) which reinforces the likelihood estimations). In Brown et al. (2020), information flow in bird flocks is investigated without the entropic estimation. From a more general perspective of swarm intelligence, Folino and Forestiero (2010) discussed the trajectory of bird flocks as spatial distributions which can be used for entropic investigations.
2 Methodology
The birds are modeled as agents within an agent-based model (ABM) using the Julia Lang package, Agents. jl (Datseris et al., 2022). This package provides convenient functions for the definition of agents and their dynamics within a simulation. The algorithm used for the dynamics of bird flocking is shown in Algorithm 1. Each bird (agent) has a set of properties governing their movement behavior as well as a property termed “ensemble” which will be used to calculate the energy of each bird and for the various thermodynamic variables of the system. The ensemble here refers to the number of birds that approximately point in the same direction (flocking) and are within the field of view. In order to smooth out this trajectory, the median of the past eight iterations is taken.
Key parameters for the flocking algorithm.
Algorithm 1.Agent step function for a bird.
The flocking behavior is determined by three primary vectors, each representing a different aspect of flocking behavior. The cohesion vector
where
The velocity matching vector
where
The velocity is then normalized to maintain constant speed:
The ensemble metric
where
where
Figure 1 presents the state of the birds at three different time points of a simulation governed by the dynamics of Alg 1. The first plot is from iteration 0, which is a representative image of the state of the birds at initialization where the positions are sampled uniformly across the 2D spatial coordinates. Then the middle plot is from iteration 5, and it can be seen how after a few iterations, the birds display clustering (flocking formations) with different sizes. The last plot shows the complete set of birds grouped into a single dense region. Overall, the birds can be expected to flock in such a manner as to increase their cohesion over iterations. As a group, their positions keep changing as their speeds remain aligned with their neighbors, but the direction does change, allowing the flock to cover (explore) the space while the dynamic maintaining cohesion is applied.
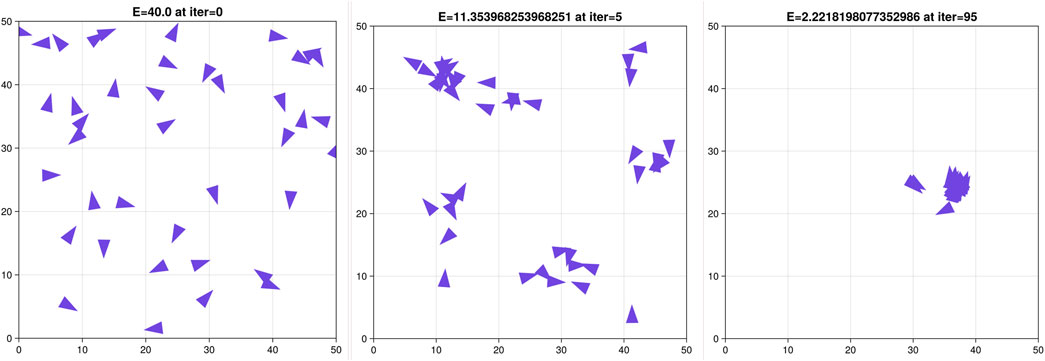
Figure 1. State of the simulated birds across the spatial positions allowed at three different time points of the simulation (iterations 0/5/95). The first subfigure shows iteration 0, where the birds are randomly distributed in the 2D space and are spread out without much flocking. The middle subfigure shows iteration 5, where multiple flock formations have begun appearing and larger empty spaces appear. In the last subfigure, it is seen that all the flocks converge to a single flock at a late stage iteration of the simulation (iteration 95).
To achieve a thermodynamic definition of such a system, the microstate first needs defining. In this case, it is defined similarly to microscopic energy, or the energy of the birds. The basic principles of statistical thermodynamics as used in the kinetic theory of gases (Sears and Salinger, 1975) are followed and applied to the given system. Given that in the algorithm used, the key variable is the bird’s trajectory with the aim of maintaining in the flock cohesion, the condition that is checked for every bird is the number of others in its vicinity (view) which point in approximately the same direction. This is similar to how in a gravitational system in physics, all the particles tend to be closer to each other over time. In a gravitational system, the energy states are defined by the gravitational potential energy. Analogously here, energy is defined as the attribute that leads to the birds to flock. Two birds that are far from each other do not form a flock, and therefore they are considered as high energy potential, while when they are close (in the same flock), they have a small energy potential. Thus, the energy of each bird is defined as the inverse of the number of birds in a given fixed radius.
where
with
Although the entropy provides a basic understanding of the system, in order to quantify its full behavior, a definition of the rest of the thermodynamic variables for a total thermodynamic definition will be established. The bin sizes do not change the results as long as a distribution that does not collapse is produced.
Based on the definition in statistical mechanics, the internal energy is defined as:
Having the entropy and the internal energy in such a system, one could contemplate the existence of a temperature. A temperature is not typically defined in such statistical systems, but based on the given thermodynamic definition, is it possible to robustly define it in this case. The temperature will be defined based on the entropy and internal energy through the
We apply the definitions of Equations 10–12. The integral forms are used for the purposes of establishing the temperature, but at a later stage they can be interchanged for the discrete summations given sufficient datapoints.
Solving the above, temperature can be defined directly upon the distribution function as:
with
Having defined the temperature of the system, it is possible to calculate the heat flux toward and out of the system based on the conservation of energy
with
The basic energy variables of the system have been defined so far, but for a system to be fully thermodynamically described, variables (volume and pressure) also need to be defined. The key variable in this case is the specific volume. Care must be taken when defining this, as at first the definition given might seem counter-intuitive, but it is the only consistent definition of this system. In the system described, the birds are equivalent to the particles of a physical system, but their microstates are their energies. In a typical physical system like a gas, the particles when left alone in a vacuum will be pushed apart due to the Coulomb forces, whilst in this case the particle was pulled together. We thus need to make our system consistent with the traditional laws of thermodynamics. Therefore, the only logical conclusion for the definition of the volume is that since the particles are attracted, the specific volume of the system will be the inverse of the average Euclidean distance between them. As such, a system where all the birds are together and the energy is minimized is equivalent to a gas that is fully dispersed.
where
The thermodynamic equations are independently applied in each iteration which is considered to be in equilibrium. In order to define thermodynamic processes across iterations, the non-equilibrium metrics would have to be used, but the goal of this study is to use thermodynamic variables as metrics and observe their evolution across time.
3 Results
The microstates that define the system are the energy states of the birds. In order to provide an overall statistical description of the system, an understanding of the distribution function is needed. In Figure 2, the histograms of the probability densities are plotted for two different time points of the simulation using energy bins. Comparing the two histograms of time points 5 (first plot) and 25 (second plot) respectively, it is seen that the step=5 system has a broader distribution of energies with a lesser number of energy bins, while after the system has evolved, the distribution is narrower, with most of the values concentrated in the lower energy bins. These distributions are to be used for the definitions of the thermodynamic variables.
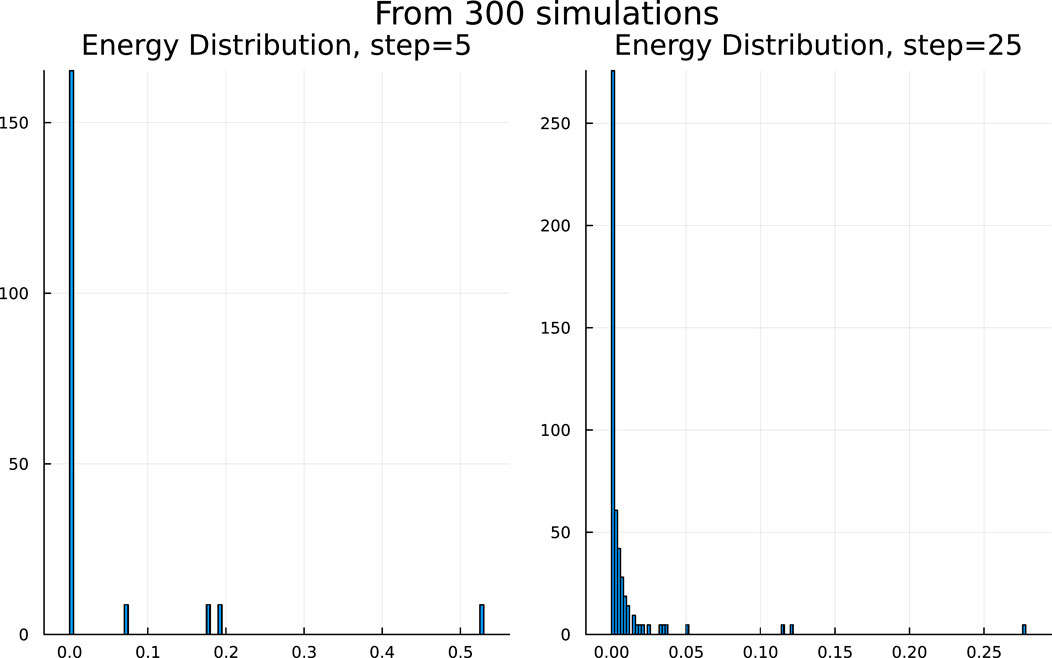
Figure 2. Probability density histogram of the energies displayed in two different iterations (iteration 5 on the left and iteration 25 on the right). The energies are calculated through Equations 8 and 9. In the early stages of the evolution of the system, the distribution of the energies is more extended (with values over a greater domain). In later stages of the simulation (right subfigure), the system converges to a distribution over a smaller domain.
Having formulated the distribution of the energy states of the system based on the derivations of the Methodology section, the different thermodynamic variables are calculated (Figure 3). First, the evolution of energy is observed to follow a decreasing trend shown in the first plot. This is expected based on the dynamics of the system, as the more the birds flock together, the lesser energy they have, leading to a converged steady minimum value when all the birds are in one flock. This behavior is also followed by the entropy trace plot, which is seen to start from a higher value and converge to stability. This behavior of the entropy comes to an agreement with the shape of the distributions (Figure 2), where in the beginning of the simulation shown in the first plot, wider distributions are observed, leading to higher entropies compared to the later iteration in the right plot. At this point, it is important to note that this decreasing energy-defined entropy trace of the system follows a behavior similar to what we would expect from a spatial entropy trace. In a traditional description of a flocking model, the entropy would be defined based on the dispersion of the bird positions, leading to higher values in the initial randomized steps and lower values when the flock is formed. It is thus demonstrated that even with an energy description of the system, the thermodynamic entropy follows the same trajectory.
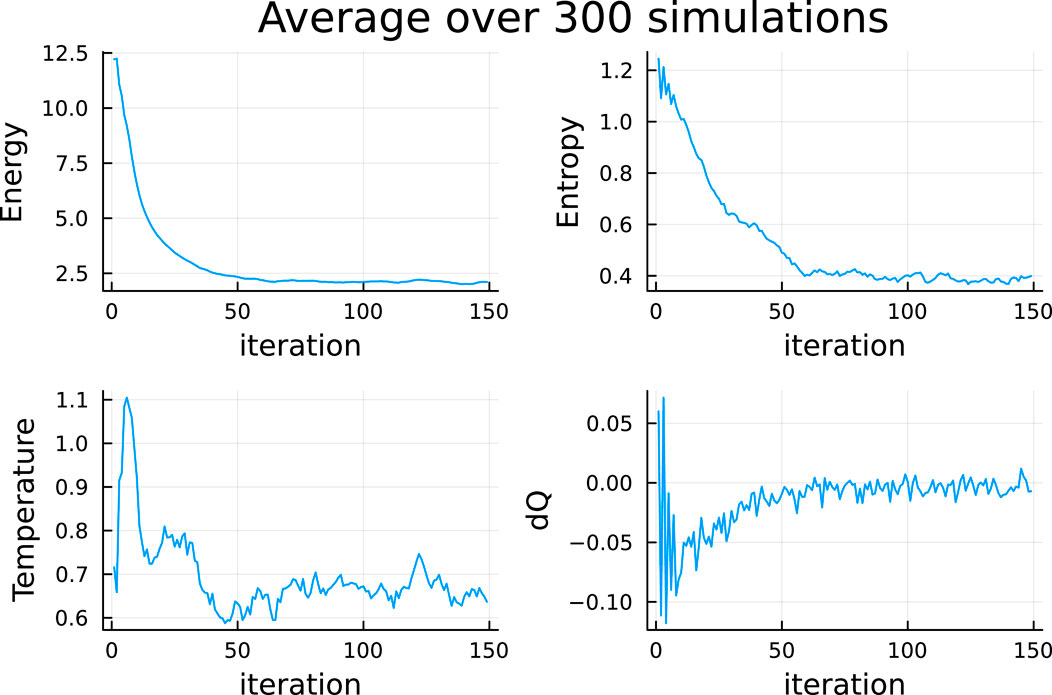
Figure 3. Traces of four thermodynamic variables: energy, entropy, temperature, and heat flux (dQ). The first subfigure displays the energy trace over simulation time in the top left. As seen through Equations 8 and 9, as more birds come closer, the energy of each bird falls. The entropy decreases in the top right, as expected, since the birds form a flock with energy level distributions outside the largest mode. Considering the temperature trace in the bottom left, the temperature of this system, as per its definition in Equation 13, is related to the variance of the distribution of the energies. Therefore, as expected, it demonstrates high values in the beginning of the evolution of the system (wider distribution function) compared with the latter stages. In the last subfigure (bottom right), it is seen that the graph predominantly displays negative values, although it oscillates greatly. The key outcome of this graph is that most of the values of the heat flux are negative, with the positive ones appearing to be circumstantial.
Based on the distribution function and the first law, the temperature is also defined in Equations 12 and 13 in the Methods. In Figure 3, the temperature trace plot is seen to initiate from larger values and converge to lower values with the evolution of the system. The temperature trace exhibits oscillations around a steady lower final value. This artifact can be attributed to the fact that the temperature definition requires numerical differentiations and integrations based on its definition, and also the final result is averaged across 300 simulations. The converged values of these simulations depend heavily on the final distributions of the energies of the birds, which are not necessarily the same in value but only in behavior. Therefore, the final temperature of this graph is seen to oscillate, but each system reaches relative stability.
Having defined the temperature and entropy of the system, the heat flux plot can now be defined based on the first law of thermodynamics. This energy flux provides key information for describing such systems as it quantifies the energy losses over time. When the flux reaches zero, the system is not exchanging energy with its environment, and therefore stability is reached. In addition, the sign of the heat flux is also of importance, since it provides a clear understanding of whether the system loses or gains energy over time. In the dQ plot of Figure 3, it is seen that the heat flux initiates from highly negative values and converges to zero. Therefore, as expected, the system is seen to radiate energy to its environment. The point when this radiation is stopped
In parallel to the previous thermodynamic values that are more specific to the behavior of the system per iteration, two more variables can be defined which help in understanding the total state of the system up to this point. First, the internal energy of the system contains information about the energy that exists in the system. In the beginning of the simulation, the system lost no energy, so it is expected to have its maximum value (Figure 4). As the system evolves, the internal energy lessens until it reaches a stable point. Again, similar to the temperature, this internal energy is seen to exhibit some oscillations, but this is attributed to the different initial internal energies and evolutions of the distributions based on the randomized initial states. In the second plot of this graph, the cumulative heat flux is displayed. This flux is seen to accumulate in the negative values, something that is expected given the decreasing nature of the energy in a radiating system. It is also seen that because this is a per iteration difference, there are minimal oscillations. This is because despite the different total values, the differences between the iterations follow a much more concise pattern.
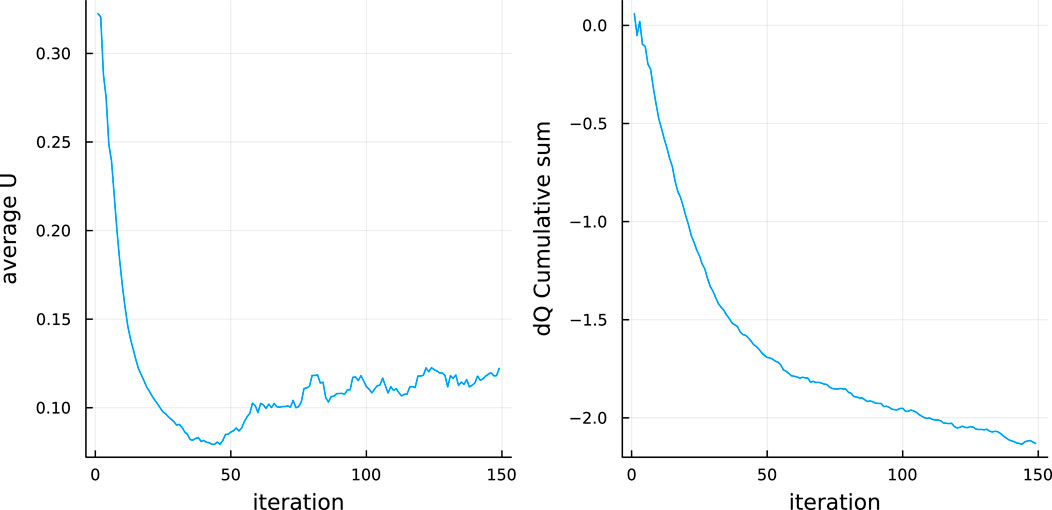
Figure 4. Traces of internal energy (left) and cumulative heat flux (right). In the internal energy subfigure, the trace is seen to initiate from high values, leading to a lower value. In the beginning of the simulation, the number of birds in each flock is highly varied, leading to a wider distribution function, while in later stages, the distribution of these energies is narrower. Cumulative heat flux of the system, with the key point being that it is negative. In any system of decreasing energy in accordance with the first law of thermodynamics, it is expected that there will be an outflux of energy of the system. This outflux is exactly what is observed through these negative values of the subfigure.
In order for a system to be fully thermodynamically defined, the spatial variables are also needed in addition to the energy variables. In this case, the specific volume and pressure are defined (see Methods section). The specific volume is seen to increase with the passage of time (Figure 5). This comes to an agreement with the energy behavior of the system, since an increase in volume leads to a cooling of the system. Conversely, the pressure is seen to initiate from a high value and drop to lower values, converging around the same time point that the entropy and temperature converge. The oscillatory behavior of the pressure is directly attributed to the behavior of the temperature, given the pressure definition (Equation 16). In accordance with a typical cooling process, the pressure is also seen to drop with the increase of volume and the decrease of temperature.

Figure 5. Traces of volume (left plot) and pressure (right plot). The (specific) volume, being related to the inverse Euclidean of the birds, starts from lower values when the birds are further apart and increases with flocking. The pressure is expected to have an inverse relation to the volume based on its definition (Equation 16), as well as a total overall thermodynamic understanding of variable relationships. It is observed that the traces initiate from their extreme values and lead up to more stable values as the flocks form.
Figure 3 presents the behavior of the energy variables of the system. All these variables are seen to be heavily interconnected with the overall trend, such that the system initiates from a disordered high energy state and leads to a more ordered low energy state. This is a behavior that conforms fully to the laws of thermodynamics applied to a non-isolated system. The system reaches an overall lower and more stable energy state, and it is also seen to radiate the excess energy to the environment (heat flux Figures 3D, 4). It is also seen that the trace of the thermodynamic entropy of the system resembles the entropy trace that a spatial definition of the entropy would provide.
In addition, the traces of the volume and the pressure are seen to behave as expected for such a system (Figure 5). The volume is small in the beginning where the energy is at a high level, and as the system cools down the volume increases. Thus, this is the equivalent of an expansion cooling of the system. Consequently, the pressure is seen to drop rapidly as the volume increases and the energy of the system decreases.
Overall, the system appears to fully obey the expected thermodynamic behaviors as well as the laws of thermodynamics (first: conservation of energy, observed through the definition (Equation 12) and heat flux; second: decreasing entropy in the system but overall increasing entropy; third: temperature and the entropy converge as they reach 0), showing that bird flocking can be fully described as a thermodynamic process.
4 Discussion
This study presents a methodology for computing the key thermodynamic variable values along the trajectory of a simulation of birds flocking. Emphasis is not placed on producing an accurate model of birds during the process of flocking but rather on how the state space can be analyzed in terms of a thermodynamic system. This is in line with the scope of the field of social physics and develops the theory of producing physical analogs of social processes. This application demonstrates that with careful definitions of the microstates and following the standard principles of statistical physics, a full and highly self-consistent thermodynamic description of the system can be devised. Specifically, the traces of the thermodynamic variables that define the stability of the system (entropy and temperature) produce converged values as the system reaches single flock cases. In addition, this stable behavior can also be observed through the values of the energy and the heat flux of the system. The system initializes in a high energy state, losing energy as the birds flock together. This energy trajectory is in accordance with the heat flux, which shows negative values (meaning that heat is radiated away) until it reaches zero, when a stable condition is reached. Lastly, the pressure and volume variables are also seen to conform with the findings. The volume itself can be used as a measure of stability, as given its definition, its maximum value signifies a single flock. The volume is indeed seen to maximize when the energy variables reach stability, corroborating that when energy stability is reached, a single flock is also formed. Furthermore, the thermodynamic behavior of the volume and pressure is valid as they behave in accordance with a cooling process (with the volume increasing and the pressure decreasing). Overall, it is seen through this description that with the additional thermodynamic variables, a more in-depth perception of the system is obtained, while these variables themselves remain consistent with one another throughout the simulation of different system sizes.
The approach formulated here can be applied to other continuous 2D spatial domains, and the choice of the application of birds can be substituted with other types of agents. The choice of the variable for energy can also be substituted with the domain value which defines the energy of the agent at each time step. Future developments can incorporate more information into the energy function and more intricate agent dynamics. Another aspect to investigate is how the group movements are affected by different degrees of noise.
Data availability statement
The datasets presented in this study can be found in online repositories. The names of the repository/repositories and accession number(s) can be found at https://github.com/mantzaris/FlockingHeat.
Author contributions
AM: conceptualization, formal analysis, investigation, methodology, project administration, resources, software, validation, visualization, writing–original draft, and writing–review and editing. G-RD: conceptualization, formal analysis, investigation, methodology, project administration, resources, validation, visualization, writing–original draft, and writing–review and editing.
Funding
The authors declare that no financial support was received for the research, authorship, and/or publication of this article.
Conflict of interest
The authors declare that the research was conducted in the absence of any commercial or financial relationships that could be construed as a potential conflict of interest.
Generative AI statement
The authors declare that no generative AI was used in the creation of this manuscript.
Publisher’s note
All claims expressed in this article are solely those of the authors and do not necessarily represent those of their affiliated organizations, or those of the publisher, the editors and the reviewers. Any product that may be evaluated in this article, or claim that may be made by its manufacturer, is not guaranteed or endorsed by the publisher.
References
An, L., Grimm, V., Sullivan, A., Turner II, B., Malleson, N., Heppenstall, A., et al. (2021). Challenges, tasks, and opportunities in modeling agent-based complex systems. Ecol. Model. 457, 109685. doi:10.1016/j.ecolmodel.2021.109685
Bialek, W., Cavagna, A., Giardina, I., Mora, T., Silvestri, E., Viale, M., et al. (2012). Statistical mechanics for natural flocks of birds. Proc. Natl. Acad. Sci. 109, 4786–4791. doi:10.1073/pnas.1118633109
Brown, J., Bossomaier, T., and Barnett, L. (2020). Information flow in finite flocks. Sci. Rep. 10, 3837. doi:10.1038/s41598-020-59080-6
Brush, S. G. (1967). History of the lenz-ising model. Rev. Mod. Phys. 39, 883–893. doi:10.1103/revmodphys.39.883
Castellana, M., Bialek, W., Cavagna, A., and Giardina, I. (2016). Entropic effects in a nonequilibrium system: flocks of birds. Phys. Rev. E 93, 052416. doi:10.1103/physreve.93.052416
Cavagna, A., Giardina, I., Ginelli, F., Mora, T., Piovani, D., Tavarone, R., et al. (2014). Dynamical maximum entropy approach to flocking. Phys. Rev. E 89, 042707. doi:10.1103/physreve.89.042707
Christakis, N. A., and Fowler, J. H. (2009). Connected: The surprising power of our social networks and how they shape our lives (Little, Brown Spark)
Cipra, B. A. (1987). An introduction to the ising model. Am. Math. Mon. 94, 937–959. doi:10.1080/00029890.1987.12000742
Datseris, G., Vahdati, A. R., and DuBois, T. C. (2022). Agents.jl: a performant and feature-full agent-based modeling software of minimal code complexity. Simul. 0, 003754972110688 100, 1019–1031. doi:10.1177/00375497211068820
Domenikos, G.-R., and Mantzaris, A. V. (2022). A model simulation of political segmentation through an estimation of the entropy. J. Stat. Mech. Theory Exp. 2022, 093401. doi:10.1088/1742-5468/ac8800
Domenikos, G.-R., and Mantzaris, A. V. (2024). A possible thermodynamic definition and equation of state for a model of political election cycles. Plos one 19, e0300113. doi:10.1371/journal.pone.0300113
Epstein, J. M. (1999). Agent-based computational models and generative social science. Complexity 4, 41–60. doi:10.1002/(sici)1099-0526(199905/06)4:5<41::aid-cplx9>3.0.co;2-f
Folino, G., and Forestiero, A. (2010). “Using entropy for evaluating swarm intelligence algorithms,” in Nature inspired cooperative strategies for optimization (NICSO 2010) (Springer), 331–343.
Gauvin, L., Vannimenus, J., and Nadal, J.-P. (2009). Phase diagram of a schelling segregation model. Eur. Phys. J. B 70, 293–304. doi:10.1140/epjb/e2009-00234-0
Hatna, E., and Benenson, I. (2012). The schelling model of ethnic residential dynamics: beyond the integrated-segregated dichotomy of patterns. J. Artif. Soc. Soc. Simul. 15 (6). doi:10.18564/jasss.1873
Helbing, D. (2012a). “Agent-based modeling,” in Social self-organization: agent-based simulations and experiments to study emergent social behavior (Springer), 25–70.
Helbing, D. (2012b). Social self-organization: agent-based simulations and experiments to study emergent social behavior. Springer.
Jusup, M., Holme, P., Kanazawa, K., Takayasu, M., Romić, I., Wang, Z., et al. (2022). Social physics. Phys. Rep. 948, 1–148. doi:10.1016/j.physrep.2021.10.005
Lee, J. M., Cho, S. H., and Calvo, R. A. (2009). “A fast algorithm for simulation of flocking behavior,” in 2009 international IEEE consumer electronics society’s games innovations conference (IEEE), 186–190.
Lior, N., and Rudy, G. J. (1988). Second-law analysis of an ideal otto cycle. Energy Convers. Manag. 28, 327–334. doi:10.1016/0196-8904(88)90054-4
Mantzaris, A. V. (2020). Incorporating a monetary variable into the schelling model addresses the issue of a decreasing entropy trace. Sci. Rep. 10, 17005. doi:10.1038/s41598-020-74125-6
Mantzaris, A. V., Marich, J. A., and Halfman, T. W. (2018). Examining the schelling model simulation through an estimation of its entropy. Entropy 20, 623. doi:10.3390/e20090623
Ouellette, N. T. (2022). A physics perspective on collective animal behavior. Phys. Biol. 19, 021004. doi:10.1088/1478-3975/ac4bef
Parrondo, J. M., Broeck, C. V. d., and Kawai, R. (2009). Entropy production and the arrow of time. New J. Phys. 11, 073008. doi:10.1088/1367-2630/11/7/073008
Pomorski, K., and Kotula, D. (2023). Thermodynamics in stochastic conway’s game of life. Condens. Matter 8, 47. doi:10.3390/condmat8020047
Porter, T. M. (1981). A statistical survey of gases: maxwell’s social physics. Hist. Stud. Phys. Sci. 12, 77–116. doi:10.2307/27757490
Quang, L. A., Jung, N., Cho, E. S., Choi, J. H., and Lee, J. W. (2018). Agent-based models in social physics. J. Korean Phys. Soc. 72, 1272–1280. doi:10.3938/jkps.72.1272
Reina, A., Valentini, G., Fernández-Oto, C., Dorigo, M., and Trianni, V. (2015). A design pattern for decentralised decision making. PloS one 10, e0140950. doi:10.1371/journal.pone.0140950
Schelling, T. C. (1971). Dynamic models of segregation. J. Math. Sociol. 1, 143–186. doi:10.1080/0022250x.1971.9989794
Sears, F. W., and Salinger, G. L. (1975). Thermodynamics, kinetic theory, and statistical thermodynamics. (No Title).
Sornette, D. (2014). Physics and financial economics (1776–2014): puzzles, ising and agent-based models. Rep. Prog. Phys. 77, 062001. doi:10.1088/0034-4885/77/6/062001
Stauffer, D., and Solomon, S. (2007). Ising, schelling and self-organising segregation. Eur. Phys. J. B 57, 473–479. doi:10.1140/epjb/e2007-00181-8
Stewart, J. Q. (1950). The development of social physics. Am. J. Phys. 18, 239–253. doi:10.1119/1.1932559
Tsarev, D., Trofimova, A., Alodjants, A., and Khrennikov, A. (2019). Phase transitions, collective emotions and decision-making problem in heterogeneous social systems. Sci. Rep. 9, 18039. doi:10.1038/s41598-019-54296-7
Vicsek, T. (1985). Formation of solidification patterns in aggregation models. Phys. Rev. A 32, 3084–3089. doi:10.1103/physreva.32.3084
Vincent, J. F., Bogatyreva, O. A., Bogatyrev, N. R., Bowyer, A., and Pahl, A.-K. (2006). Biomimetics: its practice and theory. J. R. Soc. Interface 3, 471–482. doi:10.1098/rsif.2006.0127
Virágh, C., Vásárhelyi, G., Tarcai, N., Szörényi, T., Somorjai, G., Nepusz, T., et al. (2014). Flocking algorithm for autonomous flying robots. Bioinspiration and biomimetics 9, 025012. doi:10.1088/1748-3182/9/2/025012
Wang, X., and Lu, J. (2019). Collective behaviors through social interactions in bird flocks. IEEE Circuits Syst. Mag. 19, 6–22. doi:10.1109/mcas.2019.2924507
Wardil, L., and Hauert, C. (2014). Origin and structure of dynamic cooperative networks. Sci. Rep. 4, 5725. doi:10.1038/srep05725
Keywords: entropy, thermodynamics, thermoinformatics, flocking, social physics, agent-based systems
Citation: Mantzaris AV and Domenikos G-R (2025) Exploring the thermodynamic description of a simulation of flocking birds. Front. Complex Syst. 2:1516812. doi: 10.3389/fcpxs.2024.1516812
Received: 25 October 2024; Accepted: 20 December 2024;
Published: 03 February 2025.
Edited by:
Byungjoon Min, Chungbuk National University, Republic of KoreaReviewed by:
Soumyajyoti Biswas, SRM University, IndiaJoon-Young Moon, Sungkyunkwan University, Republic of Korea
Copyright © 2025 Mantzaris and Domenikos. This is an open-access article distributed under the terms of the Creative Commons Attribution License (CC BY). The use, distribution or reproduction in other forums is permitted, provided the original author(s) and the copyright owner(s) are credited and that the original publication in this journal is cited, in accordance with accepted academic practice. No use, distribution or reproduction is permitted which does not comply with these terms.
*Correspondence: Alexander V. Mantzaris, YWxleGFuZGVyLm1hbnR6YXJpc0B1Y2YuZWR1