 Sebastián Pinto1,2*
 Pablo Balenzuela
 Marcos A. Trevisan
- 1Departamento de Física, Facultad de Ciencias Exactas y Naturales, Universidad de Buenos Aires, Ciudad Universitaria, Buenos Aires, Argentina
- 2Instituto de Física Interdisciplinaria y Aplicada (INFINA), Consejo Nacional de Investigaciones Científicas y Técnicas—Universidad de Buenos Aires, Ciudad Universitaria, Buenos Aires, Argentina
The digital revolution has transformed the exchange of information between people, blurring the traditional roles of sources and recipients as active and passive entities. To study this, we build on a publicly available database of quotes, organized as units of information flowing through media and blogs with minimal distortion. Building on this, we offer an innovative interpretation of the observed temporal patterns through a minimal model with two ingredients: a two-way feedback between sources and recipients, and a delay in the media’s response to activity on blogs. Our model successfully fits the variety of observed patterns, revealing different attention decays in media and blogs, with rebounds of information typically occurring between 1 and 4 days after the initial dissemination. More important perhaps, the model uncovers a functional relationship between the rate of information flow from media to blogs and the decay of public attention, suggesting a simplification in the mechanisms of information exchange in digital media. Although further research is required to generalize these findings fully, our results demonstrate that even a bare-bones model can capture essential mechanisms of information dynamics in the digital environment.
Introduction
To effectively understand the mechanisms that drive the flow of information in the digital environment, a pressing need exists to study how attention to novel items propagates and fades among large populations (Wu and Huberman, 2007; De Domenico and Altmann, 2020; Lorenz-Spreen et al., 2020; Gildersleve et al., 2023). Accordingly, researchers have explored the dynamics of public attention using a battery of methodological tools, including dynamical systems, analytical solutions to master equations, epidemiological models, stochastic processes, auto-regressive models, and agent-based models (Towers et al., 2015; Rizoiu et al., 2017; Shang, 2017; Teng et al., 2017; Baumann et al., 2020), revealing the difficulties of constructing a quantitative theory of information flow.
One of the classic research lines in sociophysics is the temporal dynamics of the public agenda, which involves tracking topics across various domains—economics, politics, culture—that emerge from processing large sets of articles published in the media (Pinto et al., 2019; Gozzi et al., 2020; Schawe et al., 2023). At the other end of the scale, the temporal consumption of individual words, such as X (ex Twitter) hashtags, has also been studied (Altmann et al., 2013; Lorenz-Spreen et al., 2019; Lin et al., 2021; Pardo Pintos et al., 2022). However, the gap between both extremes of the scale has not been extensively explored.
The seminal work of Leskovec and collaborators stands out as a reference for this intermediate scale, “where lies much of the temporal and textual range over which propagation on the web and between people typically occurs” (Leskovec et al., 2009). The authors compiled a massive database of short statements by public figures from news and blogs during 2008 in the United States. Notably, it is most common for the media not to use the original quotes. For instance, variants like “you can put lipstick on a pig but it is still a pig” and “you know you can put lipstick on a pig” can be found originating from Obama’s campaign quote. To associate the different instances, the authors set up a scalable algorithm that clusters the variants into “memes.” These memes act as units of information that travel undisturbed along the information flow, providing a coherent representation of the news cycle. This organization of quotes represents the main result of the original work by Leskovec et al., making this database particularly suitable as a starting point to explore the evolution of units of information that travel along the media and blogs.
Building on this, we propose an innovative interpretation of the observed temporal patterns, which we make operational using a low-dimensional model with globally interpretable parameters. In particular, we distinctly differentiate between media and blogs, considering them as proxies for sources and recipients of information, respectively. The relationship between media and public opinion was historically framed by the Agenda-Setting theory (McCombs and Shaw, 1972; McCombs and Valenzuela, 2020). Although the directionality of these dynamics (whether media directly shapes public opinion or vice versa) remains a topic of debate, recent literature suggests a more subtle two-way feedback loop (Towner and Muñoz, 2018; Pinto et al., 2019; Wang et al., 2023) which we incorporate in the structure of our model. The second ingredient of the model, inspired by observed time lags between peak volumes in media and blogs (Leskovec et al., 2009; Lorenz-Spreen et al., 2019), is a delay in media response to changes in public opinion.
Combining these two ingredients in a minimalist mathematical model reproduces the empirical time series of media and blogs remarkably well. The final picture reveals that the mean attention to information units decays within approximately 13 h in the media and within 2 h in the blogs, with rebounds typically occurring between 1 and 4 days after the initial dissemination. Our model also uncovers a functional relationship between the rate of information flow from media to blogs and the decay of public attention, suggesting a simplification in the mechanisms of information exchange in digital media. Although further research is required to generalize these findings, our results demonstrate that even a bare-bones model can capture the essential mechanisms of information dynamics in the digital environment.
Data
The database contains the mentions of approximately 70,000 quotes that appeared in English mainstream media and blogs during a period of 3 months in 2008. Most of the quotes received very few mentions and survived for 2 or 3 days both in the media and blogs, as shown in Figure 1A. In the same figure we also show a relevant subset of approximately 200 quotes that were highly mentioned in both media and blogs, with good signal-to-noise ratio along periods larger than 1 week (see Methods for details). These series are the subject of our analyses and were further re-sampled to a 1 h resolution and analyzed in a period of 24 days, starting 3 days before the peak value, and smoothed with a 24 h rolling window (see Methods for details).
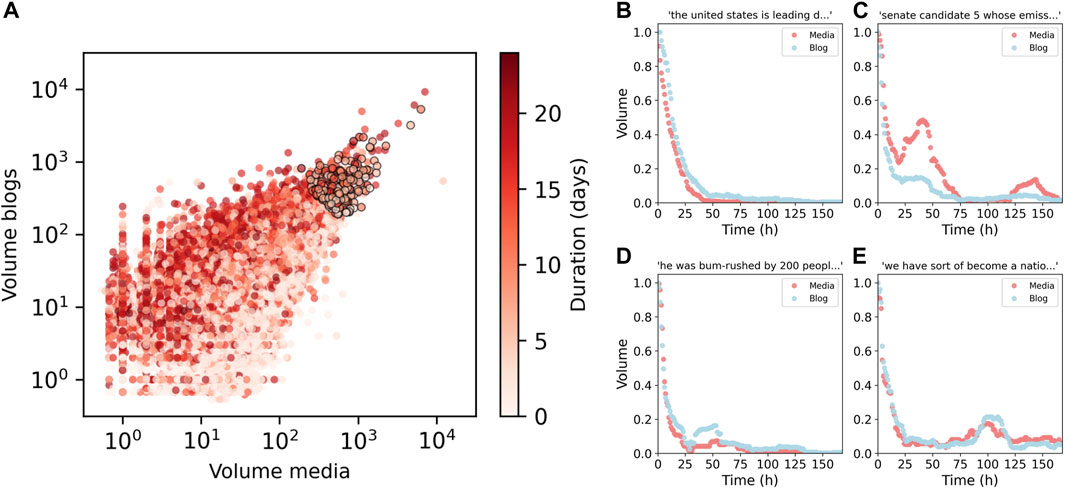
Figure 1. Volume of mentions produced by the information units and patterns of temporal evolution. (A) We estimate the volume of quotes by summing the mentions in a 3-day period around the peak. Most of the quotes receive very few mentions and survive in the system for a short time of around 2 days. However, there is a subset of approximately 200 quotes circled in black that survive in the system for more than a week, and produce time series with good signal to noise ratio. The dynamics observed for the volume of quotes can be organized in four families: (B) exponential decays, which constitutes around the 36% of the selected subset; (C) damped rebounds which are prominent in media (21% of the subset); (D) damped rebounds which are prominent in blogs (37%) of the subset; and (E) roughly similar rebounds (6%).
Results
We categorized the series upon visual inspection into four distinct families, as illustrated in Figure 1B. The quote “the united states is leading diplomatic efforts to achieve a meaningful cease-fire that is fully respected” is an example of exponential decay in both media and blogs. This behaviour constitutes around the 36% of the time series in our selected subset. The remaining time series exhibit more complex dynamics, characterized by damped rebounds of information. For instance, the quote “offered up to a million dollars to name him to the US senate federal law enforcement” demonstrates a larger amplitude rebound in media compared to blogs (about 21% of our subset share this behaviour). Conversely, the quote “he was bum-rushed by 200 people” exhibits the inverse trend (about 37% of the subset). Additionally, there are instances like “we have sort of become a nation of whiners” where the magnitude of fluctuations remains consistent across both media and blogs (observed in around the 6% of the selected subset).
To account for these experimental patterns, we present a minimal model of interaction between media and blogs with interpretable parameters, as schematized in Figure 2. We assume that the attention in the media and blogs decay at rates p and q and that information flows from media to blogs and back at rates rm and rb, respectively. This interaction is formalized as follows:
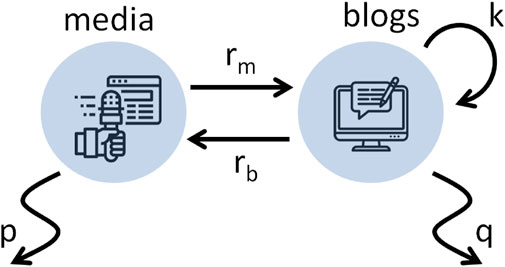
Figure 2. Two-way feedback between media and blogs. On a press release, information flows from the media to the social media at a rate rm. The reactions over a time τ produce a self-feedback effect k and also feed back to the media at a rate rb. Eventually, collective attention fades at rates p in the media and q in the blogs. This flow of information is made operational in Eq. 1 (p = 1 in the dimensionless form).
The variables m and b represent the volume of information units in the media and blogs, respectively. Eq. 1 are in dimensionless form, and therefore the decay in blogs is expressed in units of the decay in media (the same holds for the other variables, see Methods for details).
When τ = 0 and k = 0 we recover the simplest possible model for the feedback process, one in which both variables b and m interact linearly. The general solutions of a two-dimensional linear system include exponential decays and oscillations around the origin (Wiggins, 2003). Since our variables represent the volume of information units, which are definite positive, oscillations around the origin are forbidden and this system can only explain the observed exponential decays.
To account for the observed positive oscillations, and based on the observation of time lags between mass media and social media peak volume values (Leskovec et al., 2009; Lorenz-Spreen et al., 2019), we introduce a typical time delay τ in the media’s response to activity on blogs, which indeed generates oscillations mounted on the decays (Lahcen, 2006).
However, the relative intensities of these rebounds can be very different in media and blogs (see Figure 1B). We can account for this by introducing a non-linear term b(t) b(t − τ), inspired in the competition for finite resources in population dynamics of animal species (Lahcen, 2006). It states that the public’s attention is influenced not only by the volume of mentions at present time, but also by the past mentions. In this approach, we let the control parameter k to be either positive or negative, allowing for an amplification (k > 0) or inhibition (k < 0) of the feedback effects.
By construction, this model presents a set of minimum parameters needed to explain the observed dynamics. The result is a two-dimensional linear system with delay and a saturation term, described by five independent parameters: the decay q of attention in the public relative to that of media, the rates information flowing from media to blogs rm and back rb, the self-feedback k and the delay τ.
We fitted the model to the experimental series using a genetic algorithm (see Methods). Figure 3 shows examples of selected time series fitted by the model and the distribution of solutions in the projection (rb, k) of the parameter space. In this particular projection it becomes apparent that exponential decays emerge when both rb and k are small. In this case, the equation for media is decoupled from blogs (dm/dt ∼ −m) and both variables simply decay exponentially, as shown in the lower left panel of Figure 3. Information rebounds become more noticeable as the feedback from blogs rb increases, and the line k = 0 separates the ones that are higher in blogs (blue dots) than those higher in media (red dots).
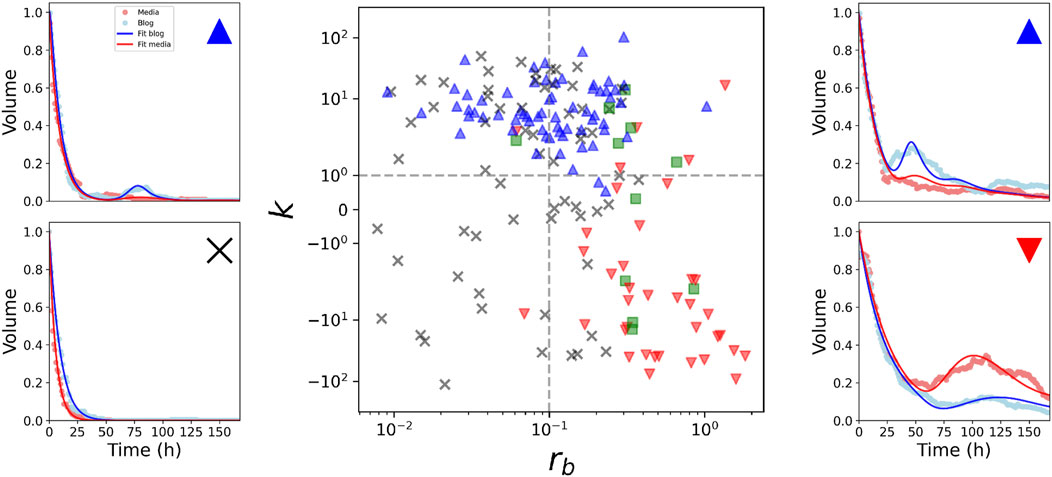
Figure 3. Data fitting and organization of patterns in the parameter space. The central panel shows the parameters of the time series fitted with the model in the plane (rb, k). Crosses represent exponential decays. Triangles pointing up show series where rebounds in blogs exceed that of media, and the opposite are marked with triangles pointing down. Similar rebounds in both platforms are marked with squares. Side panels show examples of series of the different regions of the parameter space.
Increasing the feedback from blogs is not the only mechanism that produces information rebounds. In fact, when k > 0 blogs are also affected by the delay, independently from the value of rb. In this case, rebounds are not generated by the forcing of the media, but are self-induced by the interest of blogs themselves. Interestingly, we found examples of this behavior in the experimental data (upper left panel of Figure 3).
The projections (rb, k) and (rm, k) shown in Figure 4 highlight that the information rebounds prevail in the media or in blogs when the self-feedback effect is larger than the forcing of the media, |k| > rm. In the opposite case, when |k| < rm, blogs and media display essentially the same decaying dynamics.
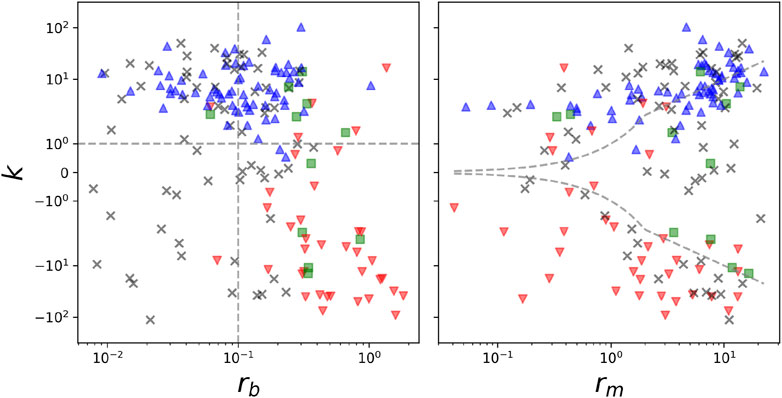
Figure 4. Self-feedback and transfer rates between media and blogs. Projections of the parameter spaces (rb, k) and (rm, k). Dashed lines in right panel correspond to |k| = rm. Color code is the same as for Figure 3.
Finally, the projection shown in Figure 5 discloses an important dynamical property of the system, as data tends to cluster around the line rm = q. This means that units of information that flow fast from media to blogs also decay fast. This finding allows a reduction in the number of free parameters of the system from five to four. In particular, when |k| is small and q is large, blogs passively follow the media (top right panel of Figure 5).
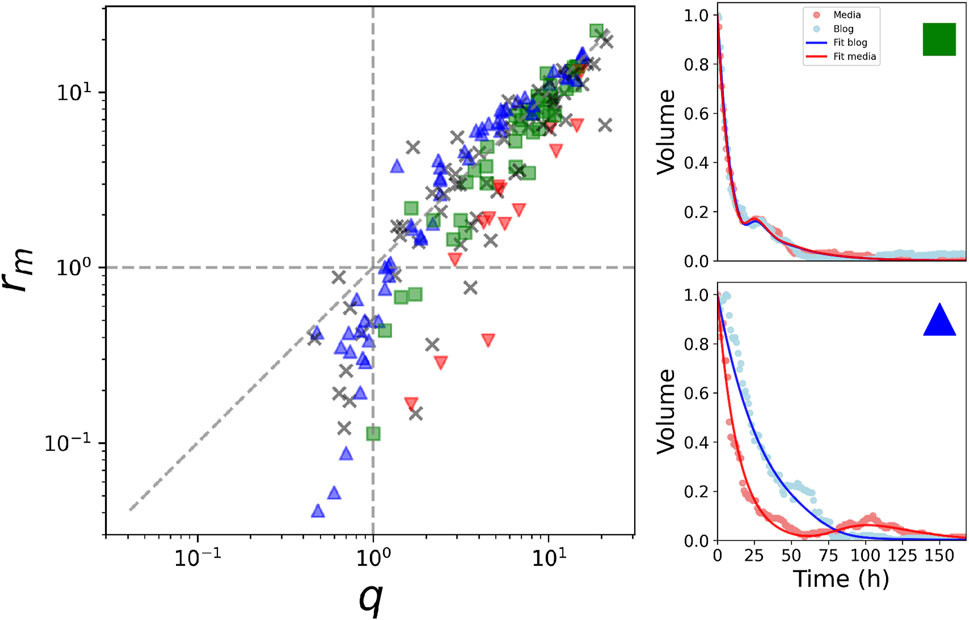
Figure 5. Reduction of free parameters. For q > 1 and rm > 1, data accumulates along the line q = rm. Colors shows different behaviours at the beginning of the series. Blue refers to a faster decay of media respect to blogs, red to a faster decay of blogs respect to media and green roughly equal decay rate. Side panels show examples of series of the different regions of the parameter space.
This first set of analyses supports the pertinence of a delay mechanism for explaining the observed patterns of information exchange. Under this hypothesis, data fitting shows that about 80% of the delays τ occur between 1 and 4 days after receiving the information, as shown in Figure 6, while the median of the attention decay is 1/p ∼ 13 h in media (with the 80% of the values lying between 8 and 18 h) and 1/q ∼ 2.5 h in blogs (80% between 1.1 and 12.3 h), comparable to the attention decay for hashtags reported in Lorenz-Spreen et al. (2019) and showing a faster reaction of blogs when compared to media. It is important to note that a signature of these delay models is the presence of rebounds at multiples of τ. Although in most of the observed time series the effect is too weak, this signature is indeed visible in some experimental series, as the ones shown in the upper panels of Figure 7 with two and three visible rebounds at multiples of τ ∼ 30 h and τ ∼ 44 h, respectively. Lower panels show simulations with rebounds at similar times, although the relative heights are not accurately reproduced with our minimal model.
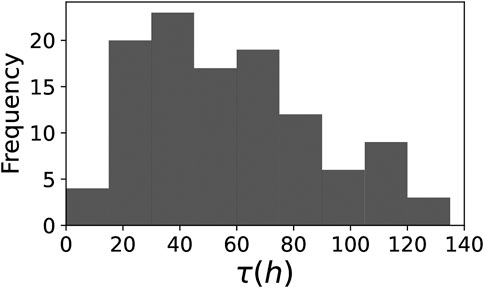
Figure 6. Distribution of the delay times τ. The model allows disclosing the typical feedback time of public opinions. Here τ is expressed in hours, computed from the dimensionless parameter τ of Eq. 1.
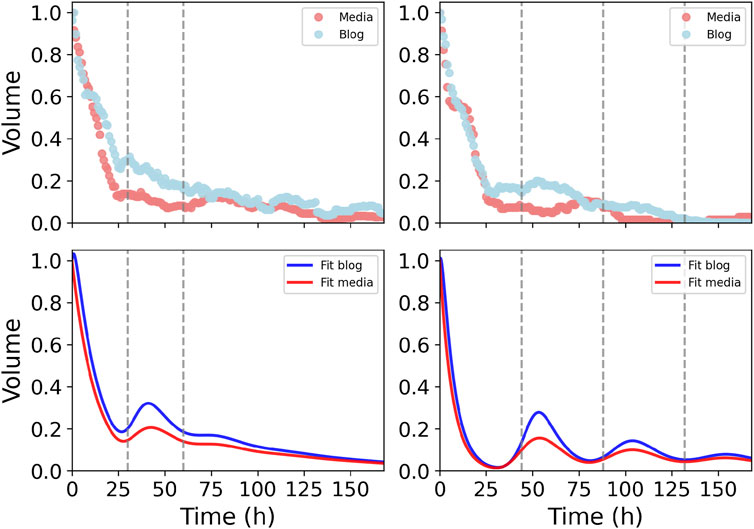
Figure 7. Time series with multiple rebounds. Our model predicts rebounds at multiples of τ. Although rebounds are usually rapidly damped, multiple rebounds can be observed in some series, such as the ones in the upper left panel at τ ∼ 30 h and 2τ, and the upper right panel at τ ∼ 44 h, 2τ and 3τ. Bottom panels show qualitative fittings.
We next investigated the relationship between the observed dynamical patterns and the semantic content of the quotes. For that sake, we first discarded effects due to the length of the quotes or the number of mentioned variants, and also effects due to the total volume of the quotes. We then performed a direct inspection of the content, which we complemented with a summary retrieved by ChatGPT (gpt3.5-turbo), which use a Large Language Model to analyze the content and the tone of each meme.
The series characterized by rebounds in the blogs driven by self-feedback (left upper panel of Figure 3) predominantly fall within the realm of gossip and entertainment, and tend to employ a more casual language, reflecting individual perspectives. This pattern reflects the fact that this content often trigger discussions on specialized or niche blogs. The second group comprises time series with rebounds that are larger in blogs compared to those of the media (upper right panel of Figure 3). This group shows references to Obama’s campaign and victory speeches. The news articles within this group are characterized by high emotional content with a significant impact on debates at both the media and blogs. The series that show larger rebounds in media than blogs (lower right panel of Figure 3) correspond to quotes that tackle harder-hitting topics, primarily revolving around economics and politics such as the acceptance speech of Obama’s candidacy. This group exhibits a more critical and sarcastic tone. Finally, the group of exponential decays (lower left panel of Figure 3) includes a diverse range of topics.
Conclusion
In this work, we re-analyzed data from a comprehensive database of quotes in the digital environment, uncovering persistent temporal patterns that signify a complex interplay between information sources and recipients. Our study departs from traditional interpretations by conceptualizing media and blogs as distinct entities within the information exchange ecosystem.
We introduced a minimalist dynamical model that effectively captures these observed patterns, establishing a novel understanding of delayed interactions between media and blogs. Our model not only successfully fits a variety of empirical data but also categorizes diverse dynamics into finite categories associated with distinct regions in the parameter space. This categorization extends beyond mere data fitting, suggesting a deeper connection between the dynamical behavior of quotes and their semantic content. Moreover, our findings suggest a functional relationship between the rate of information flow from media to blogs and the rate of attention decay. This insight implies a potential reduction in the model’s complexity, enhancing its applicability and interpretation.
Our model was build upon a two-dimensional linear model to encapsulate the basic two-way feedback interaction between the media and public opinion, grounded in existing literature (Towner and Muñoz, 2018; Pinto et al., 2019; Wang et al., 2023). However, this basic model is incapable of generating positive oscillations like the ones observed in the content volume rebounds. We explored additional mechanisms, such as introducing a third linear equation, with which the system is indeed capable of producing positive oscillations (Wilson, 2005). However, this would require the inclusion of another variable beyond the media and blogs’ content volume, which is neither observable nor interpretable. Instead of introducing a third equation, we opted for incorporating a delay in the media’s response to public opinion changes. This decision was influenced by the observation of time lags between mass media and social media peak volume values (Leskovec et al., 2009; Lorenz-Spreen et al., 2019). Conversely, this model allows for the description of the temporal evolution of the average content volume in media and blogs for the most voluminous time series, selected in Figure 1, which do not require the inclusion of stochastic noise.
Finally, modeling the interaction between mass media and social media in terms of decay and feedback times allows the extension of our analysis to different datasets. Indeed, preliminary findings on a database of the 2019 electoral period in Argentina indicate consistency with the patterns presented here for the 2008 electoral period in the United States, suggesting our model’s mechanisms may capture universally applicable information dynamics. We anticipate that a detailed comparison with this new dataset will reveal shifts in decay and feedback times, reflecting the accelerating pace of digital communication as noted in Lorenz-Spreen et al. (2019). These results, to be discussed in a forthcoming publication, will further validate our model’s applicability across different geopolitical landscapes and timeframes.
Methods
Data
In the dataset presented in Leskovec et al. (2009), the authors analyze a massive amount of news articles and blogs posts and extract a set of quoted phrases usually used to cite people literally. However, quotes are commonly published with variants, and the authors set up a clustering algorithm to identify the root phrases. We take these root phrases as our starting point to study their time evolution.
For each time series, we re-sampled to a 1 h by counting the number of quotes within each interval. We identified the global peak (number of quotes both in mainstream media and blogs) and focused on the interval of 3 days before and 21 days after this peak, in order to identify the period of largest activity. Finally, we extracted the trend of this period by performing a rolling window average of 24 h. In summary, we obtained a set of smooth time series that represent the use of quotes and their textual variants both in mainstream media and blogs.
Dimensionless model
The original model reads:
with m(t = 0) = m0 and b(t = 0) = b0, where m(t) and b(t) are the volume of quotes at time t in media and blogs, respectively. All parameters are defined positive, except k that can be either positive or negative. The dimensionless version of Eq. 2 results from the following re-scalings:
Setting p → 1, (qp) → q, (rbm0/pb0) → rb, (rmb0/pm0) → rm, and pτ → τ, results m(t = 0) = 1 and b(t = 0) = 1.
We have conducted a stability analysis confirming that the system has two fixed points. Given that all of the analyzed time series tend toward zero, the solutions for these cases were found in regions of the parameter space that favor stable fixed points near the origin, including the case where the stable point is the origin itself. Moreover, these regions are distant from bifurcations that could significantly alter the dynamics, yielding similar solutions for slight variations in the parameters. This stability underscores the robustness of our model, ensuring that the observed phenomena are not artifacts of specific parameter choices but rather inherent to the modeled dynamics.
Data fitting
The integration of delayed differential equations like our system of Eq. 1 is prone to numerical instabilities, particularly because they involve boundary conditions associated with initial values that must be appropriately addressed. Here we followed the procedure outlined in Lahcen (2006) to approximate DDEs with a system of ODEs by introducing n auxiliary variables. The advantage of this approximation lies in the possibility to apply standard ODE solvers. Here we used n = 30, obtaining a good compromise between computational time and resemblance to artificially created solutions of the original model (we found a coefficient of determination R2 > 0.95 between the solutions of the original and the approximated model for several set of parameters).
We then fitted the numerical solutions to the data using a genetic algorithm (population size = 64, recombination rate = 0.30 and mutation rate uniformly sampled between 0.1 and 1.9 in each generation) implemented in the python package scipy (Virtanen et al., 2020). We used the error as the mean squared distance between the numerical solution and data in the two-dimensional space of media and blogs. To ultimately assess the quality of the fit, we computed the coefficient of determination, R2. Eighty percent of the R2 values fall between 0.91 and 0.98 for both media and blogs data, indicating a high quality of the fit.
Data and codes
Data and codes are available at https://github.com/spinto88/Meme_project.
Discarded series
In Figure 8 we show two examples of series that were discarded despite having sufficient data for analysis. We observed cases in which the volume does not decay (left panel) and shows a strong trend (right panel) due to external variables that are not considered in our model.

Figure 8. Examples of discarded series.
Data availability statement
Publicly available datasets were analyzed in this study. This data can be found here: https://github.com/spinto88/Meme_project.
Author contributions
SP: Conceptualization, Data curation, Investigation, Methodology, Software, Visualization, Writing–original draft, Writing–review and editing. AP: Data curation, Investigation, Methodology, Validation, Writing–original draft, Writing–review and editing, Conceptualization. PB: Conceptualization, Supervision, Writing–original draft, Writing–review and editing. MT: Conceptualization, Supervision, Writing–original draft, Writing–review and editing.
Funding
The authors declare that financial support was received for the research, authorship, and/or publication of this article. This research was partially funded by the Universidad de Buenos Aires (UBA) through Grant UBACyT, 20020220100181BA, the Consejo Nacional de Investigaciones Científicas y Técnicas (CONICET) through Grant No. PIP-11220200102083CO, and the Agencia Nacional de Promoción de la Investigación, el Desarrollo Tecnológico y la Innovación through Grant No. PICT-2020-SERIEA-00966.
Conflict of interest
The authors declare that the research was conducted in the absence of any commercial or financial relationships that could be construed as a potential conflict of interest.
Publisher’s note
All claims expressed in this article are solely those of the authors and do not necessarily represent those of their affiliated organizations, or those of the publisher, the editors and the reviewers. Any product that may be evaluated in this article, or claim that may be made by its manufacturer, is not guaranteed or endorsed by the publisher.
References
Altmann, E. G., Whichard, Z. L., and Motter, A. E. (2013). Identifying trends in word frequency dynamics. J. Stat. Phys. 151, 277–288. doi:10.1007/s10955-013-0699-7
Baumann, F., Lorenz-Spreen, P., Sokolov, I. M., and Starnini, M. (2020). Modeling echo chambers and polarization dynamics in social networks. Phys. Rev. Lett. 124, 048301. doi:10.1103/physrevlett.124.048301
De Domenico, M., and Altmann, E. G. (2020). Unraveling the origin of social bursts in collective attention. Sci. Rep. 10, 4629. doi:10.1038/s41598-020-61523-z
Gildersleve, P., Lambiotte, R., and Yasseri, T. (2023). Between news and history: identifying networked topics of collective attention on Wikipedia. J. Comput. Soc. Sci. 6, 845–875. doi:10.1007/s42001-023-00215-w
Gozzi, N., Tizzani, M., Starnini, M., Ciulla, F., Paolotti, D., Panisson, A., et al. (2020). Collective response to media coverage of the COVID-19 pandemic on reddit and wikipedia: mixed-methods analysis. J. Med. Internet Res. 22, e21597. doi:10.2196/21597
Leskovec, J., Backstrom, L., and Kleinberg, J. (2009). “Meme-tracking and the dynamics of the news cycle,” in Proceedings of the 15th ACM SIGKDD international conference on Knowledge discovery and data mining, 497–506.
Lin, Y.-R., Margolin, D., Keegan, B., Baronchelli, A., and Lazer, D. (2021). “#Bigbirds never die: understanding social dynamics of emergent hashtags,” in Proceedings of the International AAAI Conference on Web and Social Media, 370–379. doi:10.1609/icwsm.v7i1.14407
Lorenz-Spreen, P., Lewandowsky, S., Sunstein, C. R., and Hertwig, R. (2020). How behavioural sciences can promote truth, autonomy and democratic discourse online. Nat. Hum. Behav. 4, 1102–1109. doi:10.1038/s41562-020-0889-7
Lorenz-Spreen, P., Mønsted, B. M., Hövel, P., and Lehmann, S. (2019). Accelerating dynamics of collective attention. Nat. Commun. 10, 1759. doi:10.1038/s41467-019-09311-w
McCombs, M., and Valenzuela, S. (2020). Setting the agenda: mass media and public opinion. John Wiley and Sons.
McCombs, M. E., and Shaw, D. L. (1972). The agenda-setting function of mass media. Public Opin. Q. 36, 176. doi:10.1086/267990
Pardo Pintos, A., Shalom, D. E., Tagliazucchi, E., Mindlin, G., and Trevisan, M. (2022). Cognitive forces shape the dynamics of word usage across multiple languages. Chaos, Solit. Fractals 161, 112327. doi:10.1016/j.chaos.2022.112327
Pinto, S., Albanese, F., Dorso, C. O., and Balenzuela, P. (2019). Quantifying time-dependent Media Agenda and public opinion by topic modeling. Phys. A Stat. Mech. its Appl. 524, 614–624. doi:10.1016/j.physa.2019.04.108
Rizoiu, M.-A., Xie, L., Sanner, S., Cebrian, M., Yu, H., and Van Hentenryck, P. (2017). “Expecting to be HIP: hawkes intensity processes for social media popularity,” in Proceedings of the 26th international conference on world wide web, 735–744. doi:10.1145/3038912.3052650
Schawe, H., Beiró, M. G., Alvarez-Hamelin, J. I., Kotzinos, D., and Hernández, L. (2023). Understanding who talks about what: comparison between the information treatment in traditional media and online discussions. Sci. Rep. 13, 3809. doi:10.1038/s41598-023-30367-8
Shang, Y. (2017). Lie algebraic discussion for affinity based information diffusion in social networks. Open Phys. 15, 705–711. doi:10.1515/phys-2017-0083
Teng, Y., Bi, D., Xie, G., Jin, Y., Huang, Y., Lin, B., et al. (2017). Dynamic forecasting of zika epidemics using google trends. PloS one 12, e0165085. doi:10.1371/journal.pone.0165085
Towers, S., Afzal, S., Bernal, G., Bliss, N., Brown, S., Espinoza, B., et al. (2015). Mass media and the contagion of fear: the case of ebola in America. PloS one 10, e0129179. doi:10.1371/journal.pone.0129179
Towner, T. L., and Muñoz, C. L. (2018). Picture perfect? The role of instagram in issue agenda setting during the 2016 presidential primary campaign. Soc. Sci. Comput. Rev. 36, 484–499. doi:10.1177/0894439317728222
Virtanen, P., Gommers, R., Oliphant, T. E., Haberland, M., Reddy, T., Cournapeau, D., et al. (2020). SciPy 1.0: fundamental algorithms for scientific computing in Python. Nat. Methods 17, 261–272. doi:10.1038/s41592-019-0686-2
Wang, X., Chen, L., Shi, J., and Tang, H. (2023). Who sets the agenda? The dynamic agenda setting of the wildlife issue on social media. Environ. Commun. 17, 245–262. doi:10.1080/17524032.2021.1901760
Wiggins, S. (2003). Introduction to applied nonlinear dynamical systems and chaos, Vol. 2. Springer.
Keywords: meme dynamics, dynamical models, delayed differential equation, sociophysics, information flow
Citation: Pinto S, Pardo Pintos A, Balenzuela P and Trevisan MA (2024) Delay model for the dynamics of information units in the digital environment. Front. Complex Syst. 2:1359092. doi: 10.3389/fcpxs.2024.1359092
Received: 20 December 2023; Accepted: 28 March 2024;
Published: 11 April 2024.
Edited by:
Rosa Maria Benito, Polytechnic University of Madrid, SpainReviewed by:
Yilun Shang, Northumbria University, United KingdomAlberto P. Munuzuri, University of Santiago de Compostela, Spain
Copyright © 2024 Pinto, Pardo Pintos, Balenzuela and Trevisan. This is an open-access article distributed under the terms of the Creative Commons Attribution License (CC BY). The use, distribution or reproduction in other forums is permitted, provided the original author(s) and the copyright owner(s) are credited and that the original publication in this journal is cited, in accordance with accepted academic practice. No use, distribution or reproduction is permitted which does not comply with these terms.
*Correspondence: Sebastián Pinto, c3BpbnRvQGRmLnViYS5hcg==