 José Jerovane Da Costa Nascimento1,2*Adriell Gomes Marques2,3Yasmim Osório Adelino Rodrigues2,3Guilherme Freire Brilhante Severiano2,3Icaro de Sousa Rodrigues2,3Carlos Dourado Jr2,3Luís Fabrício De Freitas Souza2,4*
- 1Department of Science and Technology, Federal University of Ceará, Fortaleza, Ceará, Brazil
- 2Group for research and innovation in Artificial Intelligence systems—LISIA, Juazeiro do Norte, Ceará, Brazil
- 3Federal Institute of Education, Science and Technology of Ceará, Fortaleza, Ceará, Brazil
- 4Department of Science and Technology, Universidade Federal do Cariri, Juazeiro do Norte, Brazil
According to the World Health Organization (WHO), melanoma is a type of cancer that affects people globally in different parts of the human body, leading to deaths of thousands of people every year worldwide. Intelligent diagnostic tools through automatic detection in medical images are extremely effective in aiding medical diagnosis. Computer-aided diagnosis (CAD) systems are of utmost importance for image-based pre-diagnosis, and the use of artificial intelligence–based tools for monitoring, detection, and segmentation of the pathological region are increasingly used in integrated smart solutions within smart city systems through cloud data processing with the use of edge computing. This study proposes a new approach capable of integrating into computational monitoring and medical diagnostic assistance systems called Health of Things Melanoma Detection System (HTMDS). The method presents a deep learning–based approach using the YOLOv8 network for melanoma detection in dermatoscopic images. The study proposes a workflow through communication between the mobile device, which extracts captured images from the dermatoscopic device and uploads them to the cloud API, and a new approach using deep learning and different fine-tuning models for melanoma detection and segmentation of the region of interest, along with the cloud communication structure and comparison with methods found in the state of the art, addressing local processing. The new approach achieved satisfactory results with over 98% accuracy for detection and over 99% accuracy for skin cancer segmentation, surpassing various state-of-the-art works in different methods, such as manual, semi-automatic, and automatic approaches. The new approach demonstrates effective results in the performance of different intelligent automatic models with real-time processing, which can be used in affiliated institutions or offices in smart cities for population use and medical diagnosis purposes.
1 Introduction
Melanoma is a variation of skin cancer originating from melanin-producing cells, the melanocytes. This type of cancer occurs when there is uncontrolled multiplication of these cells in specific regions, thereby forming tumors (Long et al., 2023). It can develop anywhere in the body where there is a significant presence of melanocytes, but the most common cases occur on the skin due to exposure to high doses of ultraviolet (UV) radiation (Long et al., 2023). It is worth noting that this type of pathology is more common in individuals with lighter skin due to lower melanin levels and greater sensitivity to cancerous cell mutations caused by high doses of UV rays (Long et al., 2023).
Regarding the rates of this type of cancer, the data are alarming, as reports from JAMA Dermatology indicate around 325,000 new cases in 2020, with approximately 57,000 deaths. Estimates project 510,000 new cases of this pathology, with around 96,000 deaths, by 2040 (Arnold et al., 2022). In the USA, UK, and Australia alone, there is an average of 15,500 deaths each year (Gordon et al., 2020). Thus, the importance of prevention, treatment, and monitoring of melanoma cases is emphasized, with early detection being extremely vital for patient survival. According to the studies by Sandru et al. (2014), the estimated 5-year survival rate for malignant melanoma patients ranges between 5% and 19%, a rate influenced by the location and number of metastases spreading to other organs in the body.
In addition to the high incidence rates of new cases and low survival rates for advanced cases, melanoma also results in high medical costs for countries worldwide. In the USA alone, in 2011, approximately US$4.8 billion was spent on prevention and treatment costs (Gordon et al., 2020). The average cost per patient for treating this pathology in European countries such as Sweden is around €17,408 for advanced cases; €923 for outpatient treatment, hospitalization, and consultation; and €3,511 for mortality costs. The latter cost reaches €20,418 in countries like England (Krensel et al., 2019).
The tests used in the diagnosis of melanoma can range from clinical exams, such as self-exams and dermatological exams, with the use of high-resolution dermoscopic images; biopsy, considered the definitive test to confirm the cancerous nature of a lesion, albeit at the cost of invasiveness; body mapping, documenting all moles and skin lesions for monitoring over time; computed tomography and MRI, widely applied to detect cancer metastasis; and even blood tests that may be employed in specific applications aimed at detecting tumor markers in the patient’s body (Rossi et al., 2019; Jones et al., 2019).
Among these tests, dermoscopy is a valuable and non-invasive diagnostic and monitoring technique for various skin lesions, which include melanoma, for several reasons: it enables early detection of the disease in its initial stages through high-resolution images; it increases the sensitivity and specificity rate in detection by the specialist doctor, as it allows differentiation between benign and malignant melanomas based on visual details; and it allows for effective monitoring over time through visual comparison of high-resolution images taken during different examination periods (Celebi et al., 2019).
Another important factor of dermoscopy is its ease of integration with automatic detection systems that process high-resolution dermoscopic images, generating useful medical analytics for improved diagnosis and monitoring by healthcare professionals. These systems are known as computer-aided diagnosis (CAD) systems and consist of various artificial intelligence technologies such as machine learning, deep learning, and convolutional neural networks (CNNs). They enable not only high-efficiency detection but also fine-tuning of melanoma segmentation for greater diagnostic accuracy (Gajera et al., 2023).
CAD systems are developed for melanoma detection in examination images, classifying the type of melanoma as benign or malignant, and segmenting the lesion surface, with increasingly performative methods found in the state of the art. Even edge applications can be found for this type of examination, as processing becomes increasingly close to the image acquisition point. It is possible to develop integrated, multi-platform systems that facilitate direct communication between doctors, patients, and clinics, providing timely treatment for early detection of the examination. This assistance contributes to achieving increasingly favorable and effective clinical results, while reducing clinical monitoring costs resulting from more expensive and invasive diagnostic solutions. These edge applications are included in the emerging concept of Health of Medical Things (HoMT) (Aceto et al., 2020).
In this way, coupled with IoT (Internet of Things) that facilitates the collection and sharing of real-time health data with medical devices and diagnostic systems within networks for smart cities, HoMT significantly expands the possibility of real-time medical monitoring and data information management in healthcare through image-based pre-diagnosis in melanoma detection and segmentation. These data collected in real time and analyzed can be tools for tracking and monitoring more effectively the evolution of melanoma in patients using computer vision to analyze dermatoscopic images accurately, not only enhancing the diagnosis and treatment of cancer but also contributing to the advancement of research and the development of new data sets enabling deeper studies on healthcare data, aiding the development of innovative treatments and data processing, and generating real-time information for clinical analysis.
Taking into account the urgency of melanoma diagnosis, especially due to high rates of cases and mortality in patients with advanced conditions, along with the challenges of developing automatic systems for melanoma detection and segmentation in dermoscopic images and edge applications aiming for greater dynamism and connectivity among end-users of such applications, this study proposes a new method for melanoma detection and segmentation in dermoscopic images through edge computing based on deep learning models and fine-tuning, embracing the concept of HoMT. The study primarily aims to contribute to increasingly effective, reliable, robust, and rapid methods regarding the sending, receiving, processing, and obtaining of visual pre-diagnostic identification of the melanoma region and segmentation for potential clinical assessments through image submission and cloud processing.
The proposed study emphasizes various themes, such as
• Melanoma detection in dermoscopic images using deep learning.
• Skin cancer segmentation using fine-tuning applied to computational models.
• Computer-aided diagnosis systems for medical imaging through image processing using artificial intelligence and computer vision techniques.
• System for smart cities that are integrable with cloud processing.
• Edge computing for efficient local processing at data collection points, optimizing immediate response in clinical scenarios.
2 Related works
In the vast field of medical imaging, the introduction of HoMT represents a revolution, fundamentally changing how complex medical data are handled. The seminal study by Han et al. (2020) is a testament to this transformation, highlighting the efficiency of connected devices and smart networks in handling large data sets, ranging from X-rays to magnetic resonance imaging and ultrasounds. This work not only underscores the importance of segmentation in computed tomography, particularly in pulmonary and cerebral areas, but also opens doors to explore the untapped potential of HoMT in other medical imaging modalities. Nevertheless, the research could benefit from a deeper examination of the system’s ability to maintain its accuracy in variable clinical scenarios, especially in adverse imaging conditions. A study of the best and worst cases could broaden the understanding of the model’s performance, and thus, the method would be evaluated not only quantitatively but also qualitatively.
Complementing this narrative, Da Costa Nascimento et al. (2023) have taken HoMT to new frontiers, introducing transfer learning techniques in the classification and detection of brain tumors through magnetic resonance imaging. This innovative research not only advances existing knowledge to tackle more complex diagnostic challenges but also highlights the efficiency of models in challenging situations of brain tumors. The proposed model achieved remarkable accuracy in the classification and segmentation of brain tumors, demonstrating the practical utility and clinical relevance of these advanced techniques. Nonetheless, there is a pressing requirement to extend these methodologies across a more comprehensive range of health issues. Equally crucial is the development of varied data sets for both training and validation purposes. Doing so will enhance the models’ ability to generalize and remain applicable in a wide array of clinical situations, ensuring their effectiveness and adaptability in the ever-evolving landscape of medical diagnostics.
Similarly, Badrinarayanan et al. (2017) offered valuable insights into the application of transfer learning and fully CNNs, especially in cerebral diagnostics and other medical conditions. SegNet, a deep convolutional encoder–decoder architecture tailored for efficient image segmentation, proved efficient both in terms of memory and computational time during inference. However, further improving the trainable parameters without compromising accuracy could transform SegNet into a more robust and effective tool for real-time applications.
Continuing in the journey of HoMT in medical image processing, the research by De Freitas Souza et al. (2023) stands out for its focus on cellular segmentation to identify strokes in tomographies. Using sophisticated deep learning and fine-tuning techniques, this study demonstrates the versatility and broad applicability of these technologies in the medical field. Continuous improvement and refinement of this approach promise not only to elevate diagnostic precision but also to positively impact clinical practice. However, the research could further explore the efficacy of the model in different subtypes of stroke, thereby ensuring a more holistic and comprehensive diagnostic approach.
Also in this context, de Souza Rebouças et al. (2021) introduces the FLog Parzen Level Set (FPLS), an innovative method for segmenting regions of interest (ROI) in medical images, aimed at IoT systems and edge computing. The FPLS, which uses the Parzen Window for seed point initialization and regional contour refinement, was evaluated on data sets of stroke, lung diseases, and the skin, achieving remarkable results such as an average segmentation time of 1.64 s and high accuracy across different metrics. Despite its promising performance and efficiency, the method shows potential for improvements in automation and robustness of seed point initialization to increase its applicability in various medical scenarios, enhancing its utility in IoT systems in medical practice.
In the study of detection and segmentation in cutaneous lesions integrating HoMT, Al-Masni et al. (2018) marked significant progress by introducing a method using full-resolution CNN, which was tested on challenging data sets such as PH2 and ISIC 2017. This method, which achieved an impressive average Dice index, stands out for its innovative approach. Nevertheless, the inclusion of additional image processing techniques could further elevate precision, particularly in cases with marked variations in texture and color, common in cutaneous lesions. The use of fine-tuning models applied to the network’s output can improve segmentation results with a quick response time, as demonstrated in the study by Nascimento et al. (2023), where fine-tuning models were developed based on computer vision to enhance segmentation performance of the method for segmenting brain tumors in magnetic resonance imaging images.
Following this line, Patiño et al. (2018) developed a segmentation method based on superpixels, focusing on colorimetric characteristics. Despite notable accuracy, the method faces challenges with lesions of heterogeneous average RGB color. It is worth noting that integration with deep learning techniques could significantly improve segmentation in more complex cases, paving the way for more precise and reliable diagnoses, with good initialization and accurate detection for these cases.
Further enhancing segmentation of cutaneous lesions, Baghersalimi et al. (2019) developed DermoNet, a fully CNN that stands out for its dense connections and jumps. This structure allows the network’s layers to reuse information, ensuring high precision in subsequent layers. DermoNet proved to be fast and suitable for practical applications, according to evaluations on data sets such as ISBI 2016, ISBI 2017, and PH2. In their results, the authors achieved an average Jaccard coefficient of 80% across all databases, indicating promising outcomes. It is worth noting that the use of fine-tuning methods applied to the network’s output brings significant performance and efficacy improvements, as seen in the study by Marques et al. (2022), which applied fine-tuning models developed by combining digital image processing methods with Mask R-CNN detection for the segmentation of hemorrhagic stroke, whose binary segmentation mask was enhanced by the fine-tuning models.
Yasmim et al. (2023) presented a new approach for the automatic detection and segmentation of melanomas in dermatoscopic images, combining deep learning networks with techniques such as Parzen windowing and clustering. The method achieved a notable accuracy of 96.39% in detection and 96.50% in melanoma segmentation, surpassing other methods in the state of the art. However, the study could be improved with a deeper analysis of its limitations, such as applicability to different skin types and melanoma variations, as well as the integration of the system into real clinical environments. Questions about the sensitivity, specificity, and generalization capacity of the model for broader and more diverse data sets are also important areas for future investigations.
In their research, Popescu et al. (2022) conducted a comprehensive literature review on the comparative perspective of melanoma detection using artificial intelligence, with a specific focus on works that utilize CNNs. The authors engaged in an extensive discussion on multiple neural network architectures based on decision fusion, and the tools addressed for melanoma detection appear as potential models to assist the specialist physician. Among the models discussed are AlexNet, ResNet, VHH, and U-Net. The authors’ research spanned from 2018 to 2021, covering publications based on their impact factor. In the end, several models were discussed, with their detection architecture explained and the methods cataloged, and there was an initial discussion about their results.
In the study by Pennisi et al. (2016), a fast and automated algorithm for skin lesion segmentation in dermoscopic images was presented, utilizing Delaunay triangulation to extract binary masks of the lesions without a training phase. While the method shows high accuracy for benign lesions, its effectiveness significantly decreases for melanoma images. This indicates a requirement for improvement, suggesting that integration with deep learning techniques could enhance melanoma segmentation, leading to more precise and reliable diagnostic tools.
In the work of Bi et al. (2019), an advanced method for segmenting skin lesions in dermoscopic images was proposed, which is essential for automated diagnostics. Contrary to the techniques that overfit non-melanomas, this method applies deep learning specifically for melanomas and non-melanomas, learning their distinct visual characteristics. It uses probability-based integration to combine the results of the learning models, proving to be more precise than previous methods on three databases. However, the approach that is focused on specific classes may increase complexity and computational cost, and exploring more generalized models could improve the effectiveness and applicability of the technique.
Aiming for integration with mobile devices, Vasconcelos et al. (2019) developed an automated system that evaluates the focus of dermoscopic images of skin lesions captured by smartphones, aiming to facilitate telemedicine. Using machine learning to guide the capture and by assessing quality and focus, the system detects skin lesions. Tested on two data sets and validated in an Android application, it achieved an accuracy of 86.2% in the focus assessment of the images. Despite the promising results, the accuracy indicates the requirement for improvements to better adapt to different lighting conditions and devices, which is crucial for telemedicine.
In their studies, Ünver and Ayan (2019) developed a pipeline for skin lesion segmentation by combining YOLOv3 and the GrabCut algorithm. The method was divided into four main stages: hair removal from the lesion, lesion location detection, segmentation of the lesion area from the background, and post-processing with morphological operators. The authors aimed to use the PH2 and ISBI 2017 databases for data set validation and comparison with the state of the art. The developed pipeline achieved an average sensitivity of 90% for the ISBI 2017 data set, indicating the model’s efficiency. It is worth noting that the use of newer versions of YOLO, as a comparison between versions, could enrich the discussion on the evolution of the YOLO framework as a detection technology.
Finally, the convergence of these innovations culminated in the development of the Health of Things Melanoma Detection System (HTMDS), a cutting-edge system for the detection and segmentation of melanomas in dermatoscopic images. Utilizing advanced deep learning networks and fine-tuning techniques like Parzen windowing, clustering, and region growing, HTMDS achieved impressive accuracies in melanoma detection and segmentation, demonstrating the extraordinary efficacy of Health of Things in melanoma diagnosis. This system represents not just a milestone in melanoma diagnosis but also a model for future research in medical image segmentation, showcasing the unlimited potential of HoMT in transforming the diagnosis and treatment of skin diseases.
3 Materials and methods
This segment addresses the resources used and the methodological approaches adopted for the execution and evaluation of the proposed study. The detailed exposition of these elements is crucial for the full understanding of the research methodology employed and ensuring the possibility of independent reproduction and validation of the achieved results.
3.1 Image database
The PH2 database, which includes 200 dermatoscopic images, originated from microscopic skin examinations that were magnified 20 times their original size. These images, from the Dermatology Service of Hospital Pedro Hispano in Portugal, have a resolution of 8 bits per pixel and dimensions of 768 × 560 pixels.
3.2 YOLO
The YOLO (You Only Look Once) system is widely recognized for its speed and accuracy in identifying objects in images and performing detections in a single pass through the neural network. The YOLOv8 series achieves continuous improvements over previous versions, with Ultralytics incorporating significant optimizations in network settings and training.
Figure 1 illustrates the operation of the internal architecture of YOLOv8. In A1, feature extraction occurs, where the various convolutional layers of the architecture generate deep attributes, which are essential for generating region proposals. Subsequently, in A2, the network generates region proposals using the deep attributes. Multiple proposal overlays are performed to achieve optimal detection of the region of interest; in this case, identifying melanoma. In the third step, in A3, all proposed regions of interest are combined. The ROI Poller concatenates the regions of interest (ROIs), overlaying them and resulting in the ideal detection bounding box over the area of interest. In A4, after detection by the bounding box, the network constructs the binary detection mask, classifying the internal pixels of the bounding box. Pixels identified as belonging to the melanoma region are used to create the binary detection mask. In the final step, in A5, we visualize the result of YOLOv8, which includes the binary mask and the bounding box. These elements play a crucial role in initializing the melanoma segmentation system.
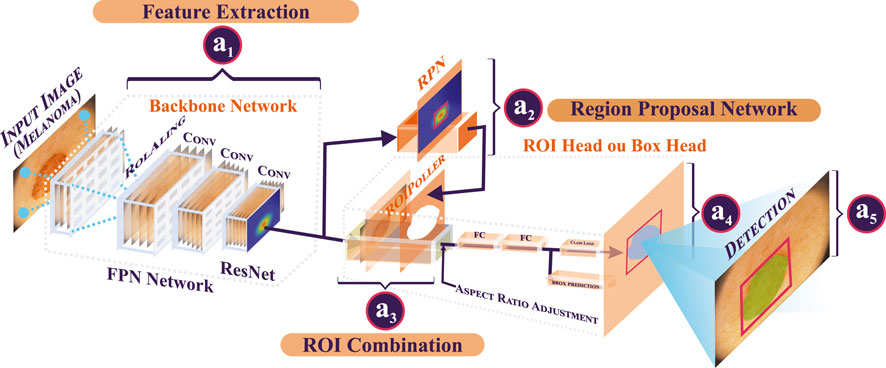
Figure 1. Illustration of the application of the network on the dermatoscopic input image. In this context, the network receives the image with the goal of performing detections by the bounding box and binary mask.
YOLOv8n, although being the fastest model with an inference time of 80.4 ms on CPUs, has a mAP accuracy of 37.3. Its agility can be extremely useful in scenarios where speed is crucial, but for applications where accuracy is more critical, such as in the segmentation of skin lesions, future iterations may include improvements in the network architecture to increase accuracy without significantly compromising performance.
The YOLOv8s model offers a balance between speed and accuracy, with a mAP of 44.9. With a response time of 128.4 ms on CPUs, this model serves as an intermediate point, suggesting that additional optimizations in the fine-tuning process can enhance precision, making it more suitable for detecting complex skin lesions.
YOLOv8m, which achieves a mAP of 50.2, is intended for more general application with a moderate inference time of 234.7 ms. Investigations into the integration of more specific skin lesion data sets during training could improve the model’s sensitivity to specific melanoma features.
The YOLOv8l, with a mAP of 52.9, is a robust choice for applications requiring high precision. However, the inference time of 375.2 ms may be a limiting factor in real-time situations. Adjustments to the architecture, such as reducing the complexity of the model without sacrificing accuracy, could be explored to improve speed.
Finally, YOLOv8x is the model with the highest precision, with a mAP of 53.9, but is also the slowest, with an inference time of 479.1 ms. This model is ideal for in-depth analyses where accuracy is imperative. To accelerate processing time, techniques such as quantization and network pruning may be considered.
These variants of YOLOv8 represent a significant advancement in the field of object detection, offering a range of options for different application requirements. Continuous optimization of these models, especially for specialized tasks such as the segmentation of melanoma lesions in dermatoscopic images, is an active and promising field of research.
In this way, it can be highlighted that the YOLOv8 framework presents different approaches for identifying regions of interest, each with specifications related to training and solving problems of detection in the trained area. Thus, each model may present different metric values in obtaining results for detection.
3.3 Segmentation and fine-tuning
Image segmentation is a crucial step in visual data analysis, especially in medical applications such as identifying skin lesions in dermatoscopic images. This section delves deeply into various classical image segmentation methods, followed by an in-depth discussion on how fine-tuning can be applied to improve the efficacy of segmentation, aiming to optimize the identification and analysis of specific features within medical images.
Segmentation from an image perspective is a method that aims to subdivide it into subregions, facilitating any processes to be applied to the image that rely on regions. From the perspective of digital image processing, segmentation methods are a set of techniques based on digital image processing capable of isolating one or several regions of interest in the image. From a medical standpoint, segmentation is an essential step in a computer vision–based medical diagnostic support system.
In segmentation, fine-tuning models constitute a set of techniques that are also based on computer vision, or even artificial intelligence, aimed at improving the edge regions of segmentation, thus achieving optimal segmentation as close as possible to the ground truth (GT).
In summary, the fine-tuning segmentation models are formed by combining these different methods of computer vision applied to medical images, with the initial lesion detection as a starting point. The expected outcome is an enhanced segmentation, emphasizing the desirable characteristics of the image’s edges. The fine-tuning models developed in this study were created by combining the Parzen window, region growing, and K-means clustering methods, resulting in the following methods: Parzen, Parzen_Clustering, and Parzen_Region_G.
The Parzen window function is a technique and probabilistic estimation based on the probability density function (Bengio et al., 2006). When assisted by a Gaussian structuring element, the Parzen window technique can be used for segmentation by adjusting the edges of the region of interest (de Souza Rebouças et al., 2021). As shown in Eq. 1
where p(z) is the probability of the pixel belonging to or not to the region, z represents the pixel, δ is the kernel function used to limit the pixel neighborhood, h is the boundary size of the region, and n is the total number of pixels in the region (Yeung and Chow, 2002). The main kernel function used is the Gaussian function, comprising the formula, as shown in Eq. 2.
where C is the d × d covariance matrix; d is the dimension, |C| is the determinant of C, and z and zi are the pixels.
The clustering technique using the K-means method homogenizes the grayscale levels of an image into K pre-established groups. In the proposed method, the K-means clustering works similarly, where K centroids are selected, and the data clusters are divided into three groups of pixels in the image. At the end of the centroid repositioning process, the pixel value obtained by the centroid is chosen to replace the entire group of pixels it represents. Thus, an image that could have numerous grayscale values, for example, will have only up to K grayscale values, and this process of updating the image pixels can be considered a clustering process. Clustering can be a useful tool in assisting segmentation by homogenizing regions of potential interest (Likas et al., 2003).
The distance used to calculate the new centroid position is the Euclidean distance, which is expressed by the following Eq. 3:
where D is the value of the Euclidean distance, x0 and y0 are the coordinates of the centroid, and x1 and y1 are the coordinates of the centroid of the sample being compared.
Region growing is a segmentation technique based on filling the region of interest using adherence rules applied to the grayscale levels of the image pixels (Biratu et al., 2021).
Region growth can be defined by the following Eq. 4:
where p(x, y) is the candidate pixel, Δ is the determined threshold value, which represents the accepted tolerance value above or below, and p(z) is the value of the candidate pixel.
Optimization in the context of image segmentation involves the fine adjustment of segmentation parameters and algorithms after initial processing. This subsection discusses how these adjustments can be implemented to improve the accuracy and efficacy of segmentation in medical applications, such as the analysis of dermatoscopic images. After the initial application of fine-tuning methods like Parzen window method or K-means, optimization involves revising and adjusting these methods’ parameters to align them more closely with the specific characteristics of the images under study. This may include changing the bandwidth of the kernel in the Parzen window or revising the number of clusters in K-means.
3.4 Edge computing
Edge computing is an innovative technological approach that decentralizes data processing, moving it closer to the source of origin, i.e., to the “edge” of the network (Shi et al., 2016). This methodology is particularly effective in scenarios where data transmission latency is a critical factor and also in situations where bandwidth is limited (Chen et al., 2018). By processing data locally, edge computing allows for a quicker and more efficient response, reducing the requirement for continuous transmission of large volumes of data to a centralized data center or to the cloud.
In the context of medical image analysis, such as with dermatoscopic images from the PH2 database, edge computing can offer significant advantages (Shi and Dustdar, 2016). For example, by performing the initial image processing at the collection site, that is, in the clinic or hospital itself, preliminary analysis can be expedited, improving diagnostic efficiency and reducing the waiting time for patients (Satyanarayanan, 2017). Additionally, edge computing contributes to data security, as it minimizes exposure of sensitive information by processing it locally rather than sending it through potentially insecure networks (Huh and Seo, 2019).
In the subsection discussing edge computing, Figure 2 provides a schematic representation of edge computing infrastructure integrated with cloud computing and data centers. This illustration highlights the prioritization of real-time data processing at the edge level, emphasizing quick responses and latency reduction. The diagram also depicts local data storage, buffering, and optimization for efficiency and broadband savings. Furthermore, machine-to-machine communication is shown to facilitate automation and information exchange between devices without human intervention. This decentralized setup supports data-driven decision-making close to the collection point, symbolized by a mobile device, enhancing the agility and performance of interconnected systems.
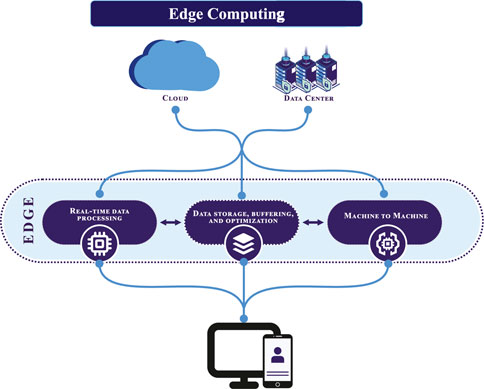
Figure 2. Scheme of edge computing infrastructure integrated with cloud computing and data centers. Focusing on real-time data processing at the edge for quick responses, the system localizes storage, buffering, and optimization for efficiency. With machine-to-machine communication, it supports decentralized data-driven decisions, close to the collection point symbolized by a mobile device, enhancing agility and performance of interconnected systems.
3.5 Cloud computing
Within the ecosystem integrating edge computing with cloud computing, the services of Amazon Web Services (AWS) play a fundamental role, offering a robust and efficient framework for data management and processing (Pallis, 2010). This combination allows for latency-sensitive data analysis, such as the dermatoscopic images from the PH2 database, to be quickly performed at the edge, while large-scale tasks are conducted in the cloud. This approach facilitates the immediate response required in medical applications, optimizing bandwidth utilization and minimizing overall latency.
With features like Amazon S3 for data storage, Amazon RDS for relational database management, and Amazon EC2 for scalable computing capabilities, AWS supports intensive processing and large-scale storage operations in the cloud (Iosup et al., 2011). This infrastructure enables efficient data management, ensuring security and accessibility, while benefiting from the agility and efficiency of local processing provided by edge computing.
Thus, integrating AWS services into a hybrid system of edge computing and cloud computing creates a more adaptable and secure environment, optimizing the handling of large and sensitive data. This strategy maximizes efficiency and security in data handling, which is essential in medical applications where precision and speed are crucial (Sikka and Ojha, 2021; Miao, 2022; Parigi et al., 2022).
3.6 Evaluation metrics
Evaluation metrics are obtained from the overlap of binary masks for segmentation and ground truth (GT), and this overlay between the binary masks assigns labels to the pixels of the segmentation performed by the model according to their relationship with the pixels of the ground truth (GT) binary mask as follows: true-positive (TP) for pixels correctly segmented as belonging to the region of interest; false-positive (FP) for pixels incorrectly segmented as belonging to the region of interest when they are actually not; true-negative (TN) for pixels correctly segmented as background region, i.e., not belonging to the region of interest; and false-negative (FN) for pixels incorrectly segmented as background region. Segmentation metrics are generally calculated based on these four types of pixels using mathematical formulas that seek to express the qualitative characteristics quantitatively, thus opening the discussion about the method’s performance. The segmentation metrics addressed in this study include sensitivity (SEN), negative predictive value (NPV), positive predictive value (PPV), specificity (SPE), Dice coefficient (Sørensen–Dice), and Jaccard index (JAC). The similarity metrics covered are accuracy (ACC) and Matthews correlation coefficient (MCC) (Taha and Hanbury, 2015).
Sensitivity (SEN) is a classification metric that assesses the rate of pixels correctly segmented as belonging to the region of interest compared to the total pixels actually belonging to that group (Taha and Hanbury, 2015), as represented in Eq. 5:
Negative predictive value (NPV) is the proportion of pixels correctly identified as belonging to the background region over the total number of pixels identified as such (Taha and Hanbury, 2015), as represented in Eq. 6:
Positive predictive value (PPV) is the proportion of pixels correctly identified as the region of interest over the total number of pixels identified as such (Taha and Hanbury, 2015), as represented in Eq. 7:
Accuracy (ACC) is a classification metric directly related to the number of pixels that are correctly segmented over the total number of pixels segmented in an image (Taha and Hanbury, 2015), represented in Eq. 8:
The Dice coefficient (DICE) is a metric that assesses the overlap between the segmented mask and the reference mask, represented in Eq. 9.(Taha and Hanbury, 2015):
Specificity (SPE) is the proportion of pixels correctly identified as belonging to the background region over the total number of actual pixels in the background region (Taha and Hanbury, 2015), represented in Eq. 10:
Positive predictive value (PPV) assesses the proportion of pixels correctly identified as the region of interest compared to the total number of pixels identified as such, represented in Eq. 11 (Taha and Hanbury, 2015):
Positive predictive value highlights the model’s accuracy in identifying the region of interest, indicating the percentage of pixels classified as positive that truly belong to the region of interest.
Negative predictive value (NPV) indicates the proportion of pixels correctly identified as belonging to the background region compared to the total number of pixels identified as such, represented in Eq. 12 (Taha and Hanbury, 2015):
Negative predictive value highlights the model’s ability to correctly exclude pixels that do not belong to the region of interest, indicating the percentage of pixels classified as negative that truly are from the background region.
Matthews correlation coefficient (MCC) measures the overall quality of segmentation, considering true positives, true negatives, false positives, and false negatives (Taha and Hanbury, 2015), represented in Eq. 13:
Jaccard index (JAC) measures the overlap between the segmented mask and the reference mask (Taha and Hanbury, 2015), represented in Eq. 14:
4 Methodology
In this section, the methodology of the proposed study is addressed, consisting of the following stages: Step 1 is the entry of new data into the system through the edge device; cloud processing for pre-diagnosis generation is Step 2, with the detection of melanoma in the image and segmentation of the lesioned region; the return of data to the edge device is Step 3, with the modeling of the pre-diagnosis through the interpretation of the generated metric data; in Step 4, the pre-diagnostic data are downloaded by the device to be subsequently presented; in Step 5, the presentation of the pre-diagnosis is carried out in the system, with information on the detection of the lesion and accuracy rates, as well as a possible confirmation of the existence of melanoma in the lesion of the image. In summary, the method developed in this study consists of a diagnostic aid tool based on the Internet of Things with edge computing in the cloud, which is capable of providing a pre-diagnosis of melanoma images through a system of sending and receiving diagnoses in real time.
4.1 Step 1: mobile application
The user (specialist doctor) collects the image taken during the examination using the dermatoscope device and sends the high-resolution images via remote connection through the mobile device, which in turn uploads them to the cloud using the API, or even submits pre-obtained folders from previous examinations. The system sends the images in the Base64 format to an API in the cloud; Base64 reduces the file size and minimizes the risks of transmission. The API executes a cloud pipeline, as represented in Step 1 of Figure 3.
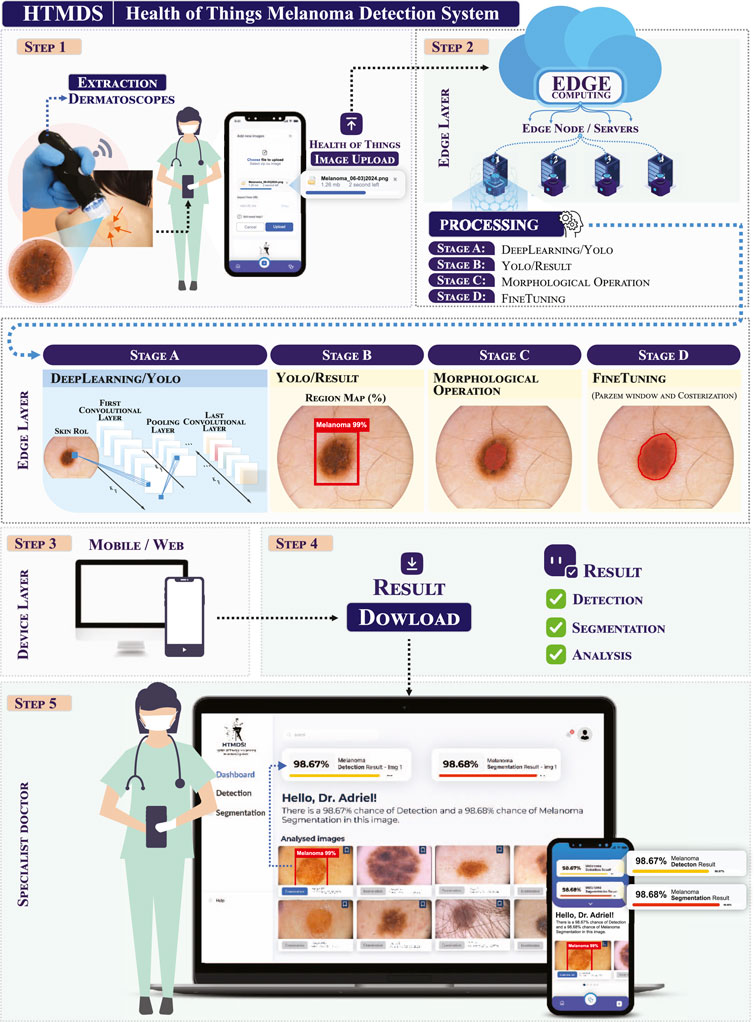
Figure 3. Study methodology, with the images captured by the dermatoscope being sent directly to the mobile device, which then uploads the data to the cloud in Step 1, and cloud data processing occurs in Step 2. Structuring service for receiving processed pre-diagnosis data through edge application in Step 3. Download of pre-diagnosis in Step 4, and personalized viewing of the pre-diagnosis in Step 5.
The designed flow for sending images from the dermatoscope to the phone and then from the phone to the cloud was projected as taking into account the high data flow that may occur, as well as greater information security regarding the clinical and diagnostic data generated, which can be stored and handled with the assistance of an information security professional. In summary, using the API hosted in the cloud brings more dynamism, security, and robustness to the system.
The application’s design was developed for both web and mobile environments. The interface was designed to facilitate user experience. The specialist doctor can separate the set of images to be sent to the cloud processing API, selecting the melanoma base after the appropriate training of the pipeline models.
4.2 Step 2: cloud pipeline
The cloud API, depicted in Step 2 of Figure 3, illustrates the steps of the artificial intelligence–based processing pipeline of the proposed method. The adopted framework, YOLOv8, is a high performer in image detection with a low amount of data. Its architecture has, in part, a structure based on R-CNN, which is capable of detecting melanoma pixels in dermatoscopic images.
Among the steps of Step 2, in Stage A, the detection of the melanoma region in the image occurs through different versions of YOLOv8, with the detection carried out by the deeper layers of YOLO, generating the bounding box and binary mask of the region of interest in the image; in Stage B, the detection results are expressed by the framework, with the respective accuracy index; in Stage C, there is a small morphological operation of erosion on the binary detection mask of YOLO to smooth the edges of the region. Finally, in Stage D, optimization methods based on digital image processing are applied to the eroded binary masks; among the optimization models are the Parzen window, clustering using the K-means method, and region growing. Among the versions of the YOLOv8 framework addressed by this study are v8l, v8m, v8n, v8s, and v8x. In this way, the proposed method constructs and metrically compares the different proposed detection models among themselves, in search of obtaining the best method for the subsequent application of optimization.
Figure 4 illustrates the workflow of the cloud API. The edge device sends the captured image through the network to the API. The system interface allows two modes of operation for the framework: the training, which uses the input images for the model training process, performing the extraction, training, and prediction of attributes, while having the GT as reference. After the training process, the weights are generated and stored in the API, so that the other mode of operation can be accessed. The test module receives the image and uses the pre-trained weights to perform the detection, in addition to applying fine-tuning on the binary mask and carrying out the segmentation. The communication between the API and device is done by exchanging files in the JSON format.
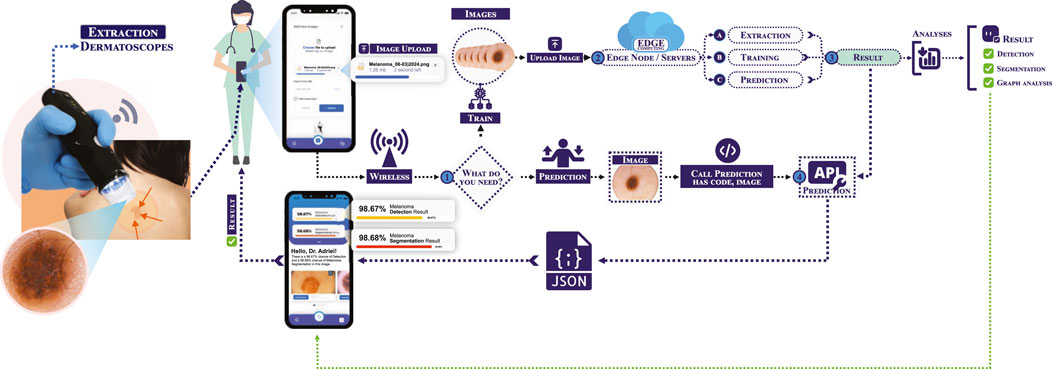
Figure 4. Flowchart of the Health of Things Melanoma Detection System (HTMDS). The process begins with the capture of images by the dermatoscope, which is the appropriate clinical device for image capture. These images are then sent directly to the mobile device via remote connection (1), sent via wireless transmission. In the edge processing stage (2), the image can be directed for training or prediction, depending on the user’s requirement. After processing, the data are sent to the edge servers, where feature extraction, model training, and melanoma prediction occur (3). The result is then transmitted to a prediction API (4), which provides a response that includes detection, segmentation, and graphical analysis of the lesion, assisting healthcare professionals in the assessment and clinical diagnosis.
4.3 Step 3: construction of pre-diagnosis data
In Step 3 of Figure 3, the melanoma detection and segmentation results are formatted for the pre-diagnosis of the application, which will later be received by the edge device.
The format of the pre-diagnosis data consists of the original examination image, the binary mask segmentation image, and textual information about the pre-diagnosis, such as the network’s certainty percentage in detection, and the confirmation of the presence of melanoma in the image, as well as the counting of the total lesion area.
4.4 Step 4: download of pre-diagnosis data
In Step 4, the data are made available for download by the cloud API. At the end of its medical pre-diagnosis pipeline, the JSON returns to the application on the device, being consumed to feed the system, in a way to accommodate the data in the dashboards and pre-diagnosis visualization panel.
4.5 Step 5: presentation of pre-diagnosis data
Finally, in Step 5, the generated pre-diagnosis data, such as patient data and medical metrics obtained through cloud processing, are presented to the professional via an interactive graphical interface, with the examination image accompanied by detection with a bounding box, segmentation, and a possible diagnosis confirming the lesion as melanoma.
The presentation of the data aims to provide personalized insights for the specialist doctor, based on their requirement for an accurate and effective diagnosis. Information on lesion progression tracking, total area counting, and even texture analysis are possible functionalities for the method.
Figure 5 illustrates the main screens of the application. The mobile and web devices interact with the cloud API through the illustrated application, which handles sending the images and receiving the diagnostic data, such as system detection and detection reliability, for the doctor to use, along with their expertise, to make the diagnosis.
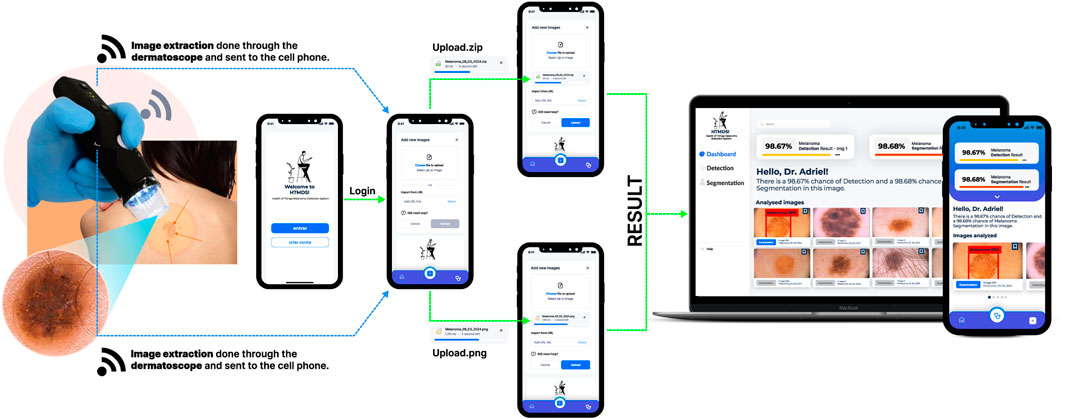
Figure 5. Summary of the main screens of the mobile and web application, with the dermatoscope device sending data to the phone wirelessly and then receiving the results from the API.
5 Results and discussion
This section is divided into three subsections. The first subsection corresponds to melanoma detection experiments (deep learning); the second subsection is on melanoma segmentation experiments (fine-tuning), followed by the subsection on comparison with the state of the art.
The use of specific metrics for the quantitative evaluation of segmentation in melanoma detection and segmentation models is crucial for the validity and reliability of the obtained results. In this study, the chosen metrics include accuracy, the Jaccard index, the Dice coefficient, sensitivity, and specificity, all widely recognized and established in scientific literature, as has been highlighted by Taha and Hanbury (2015).
The choice of these metrics is not random but is based on their reputation and frequent use in renowned works in the field of melanoma detection and segmentation. These metrics are considered the GT in many studies due to their ability to provide a comprehensive and detailed assessment of the models’ performance.
5.1 Experiment results—detection
In this subsection, the various results of experiments conducted for melanoma detection in dermoscopic images are presented. Accordingly, the experiments were performed using different computational models within the YOLOv8 framework: YOLOv8l, YOLOv8m, YOLOv8n, YOLOv8s, and YOLOv8x.
The training was conducted with various versions of YOLOv8, all of which yielded significant and highly satisfactory results for the detection of the region of interest (melanoma). Table 1 presents the different values obtained, represented by various metrics related to the models trained using the data set presented in Section 3.1.
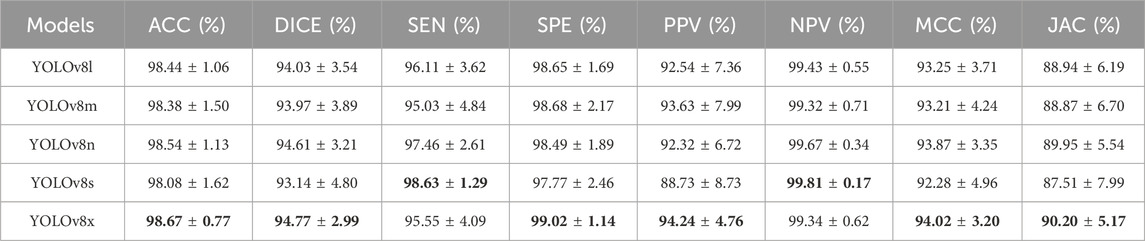
Table 1. Metric results for melanoma detection in dermoscopic images for the different versions of YOLOv8 addressed in this study.
In Table 1, it is possible to identify that YOLOv8x has the best results for melanoma region detection. The model achieved 98.67% ACC, with the lowest standard deviation among models trained with the same data set. It is noteworthy that YOLOv8x shows the lowest standard deviation in all obtained metrics, indicating good performance in the value related to the measure expressing the degree of dispersion in the data set. Thus, the uniformity of the detection results based on processed and generated data is emphasized, presenting a more accurate melanoma detection in relation to the homogeneity of the data.
The Dice coefficient metric shows a 94.77% similarity between the images located in the melanoma region and the region marked by the experts. The overlap between the detection results by the YOLOv8x model has a difference of over 1.5% in the worst case, which, in terms of medical image analysis, is quite a relevant value. Considering that each potential location in the region of interest can determine the progression or regression of the disease based on the comparison of medical images, this difference is significant. The YOLOv8s model achieved a better result in the SEN metric with 98.63%. This is attributed to the model’s ability to accurately identify the true-positive proportion of pixels belonging to the skin cancer region in the image.
It is important to emphasize that the edge computing process resulted in a gain in response time in the detection layer of the network. All models achieved less than 1% for detection, making them attractive for cloud processing applied to edge computing. This indeed provides applicability for the models, even in deep learning applications that require real-time response in cloud processing, further optimizing through current edge processing techniques.
Automatic detection also brought new possibilities, providing real precision in the location of the pathology without human intervention, as discussed in various state-of-the-art methods. In this context, YOLOv8x outperformed various models in the experiment, achieving above 99% for the SPE metric, a superior PPV metric of 94.24%, followed by MCC and JAC, surpassing the models presented in the YOLOv8 versions. Thus, it is concluded that YOLOv8x is the model that achieved the best performance for melanoma detection through edge computing processing, surpassing different works with local, non-automatic, and automatic processing.
Figure 6 presents diverse outcomes of the YOLOv8 models in detecting the skin cancer region processed by the proposed method, HTMDS, in the detection layer of the segmented region. The image visually displays different melanomas, along with the detection percentage related to ACC, obtained in each melanoma image.
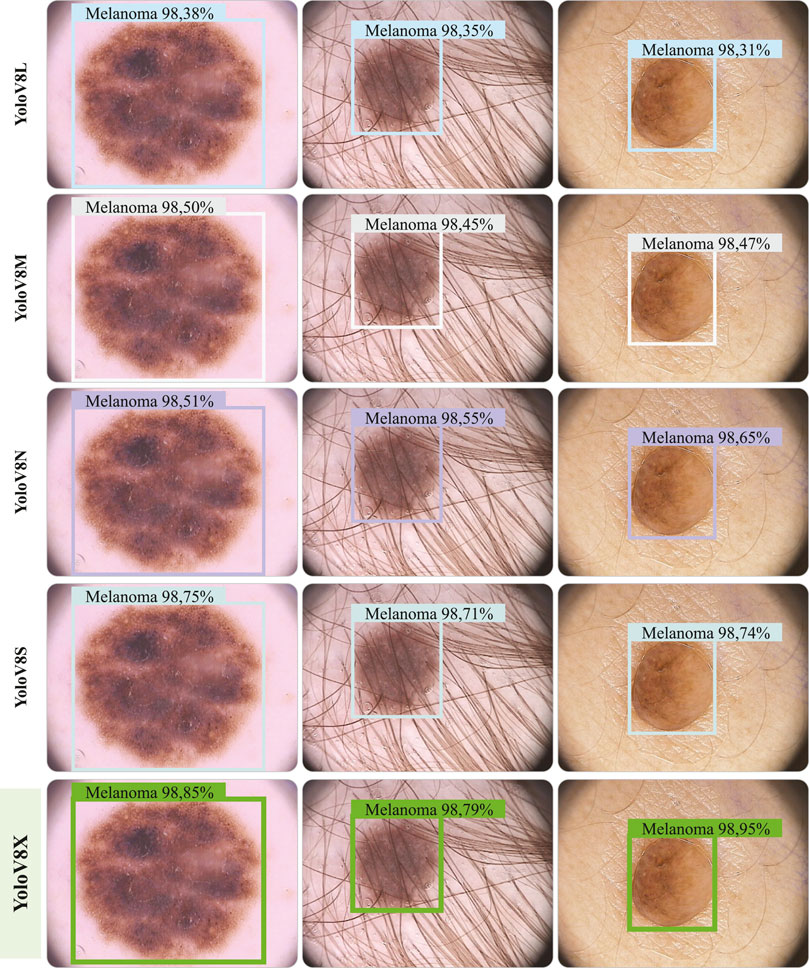
Figure 6. Visual result of the deep learning process for detecting various melanomas in dermatoscopic images processed through edge computing is presented. The figure highlights the YOLOv8x model, which shows the best results for detecting the region of interest.
Thus, it can be visually identified that the YOLOv8x model accurately outlines the region of interest through bounding boxes. This is a challenge that demands extreme precision as it defines the field where the cancer edge growth can be estimated and transformed into precise data for analysis and patient monitoring through IoT application. Consequently, it can be concluded that detection can assist in the segmentation layer through fine-tuning. Table 2 illustrates the average detection times for each YOLOv8 model.
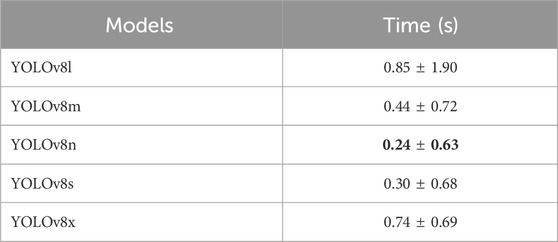
Table 2. Table results.
5.2 Results of the second experiment—segmentation
In this section, the segmentation methods developed in the proposed study will be addressed. This involves detection using various versions of YOLO (You Only Look Once), followed by segmentation performed with fine-tuning based on computer vision methods involving digital image processing. The evaluation of performance and segmentation efficacy for the models proposed in this study is achieved through both qualitative and quantitative comparisons using metrics such as ACC, DICE, SEN, SPE, PPV, NPV, MCC, and JAC.
Figure 7 presents the segmentation results for different dermoscopic images from the addressed data set.
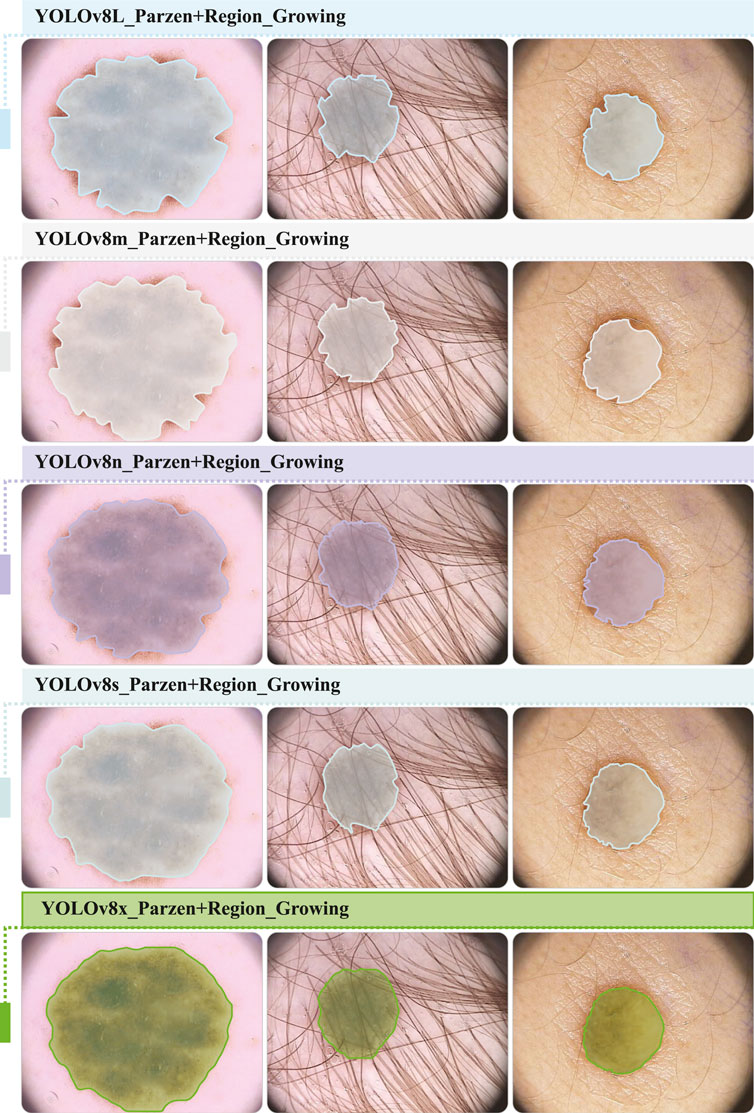
Figure 7. Result of segmentation of different cases for the proposed models. The figure visually highlights the result of segmentation using the fine-tuning method of the approach YOLOv8x + ParzenRegionG, accurately delineating the melanoma and segmenting the edge of the skin cancer.
Table 3 presents the metric results for ACC, DICE, SEN, and SPE for the segmentation models developed in this study. In total, 15 models for the automatic detection and segmentation of melanoma in dermoscopic images have been developed. Each model consists of a combination of a YOLO version for detection and an existing fine-tuned model. Table 4 illustrates the means and standard deviations for each model developed in this study regarding the metrics of PPV, NPV, MCC, and JAC. Among the models developed for the detection and segmentation of melanoma in dermoscopic images, the most effective combination of detection and segmentation was found to be YOLOv8x with fine-tuning based on the Parzen window with region growing. As evident from Table 3, the model achieved an average accuracy of 98.68%, indicating a substantial proportion of correctly segmented pixels relative to the total pixels in the image—a crucial characteristic for segmentation CAD models. The Dice coefficient of 94.66% signifies a high agreement between the segmentation performed by the model and the gold standard for the addressed data set. However, the standard deviation of 3.15% suggests the presence of some cases where the model’s efficacy had been reduced, though still being within the range of variation observed among the other models for this metric.
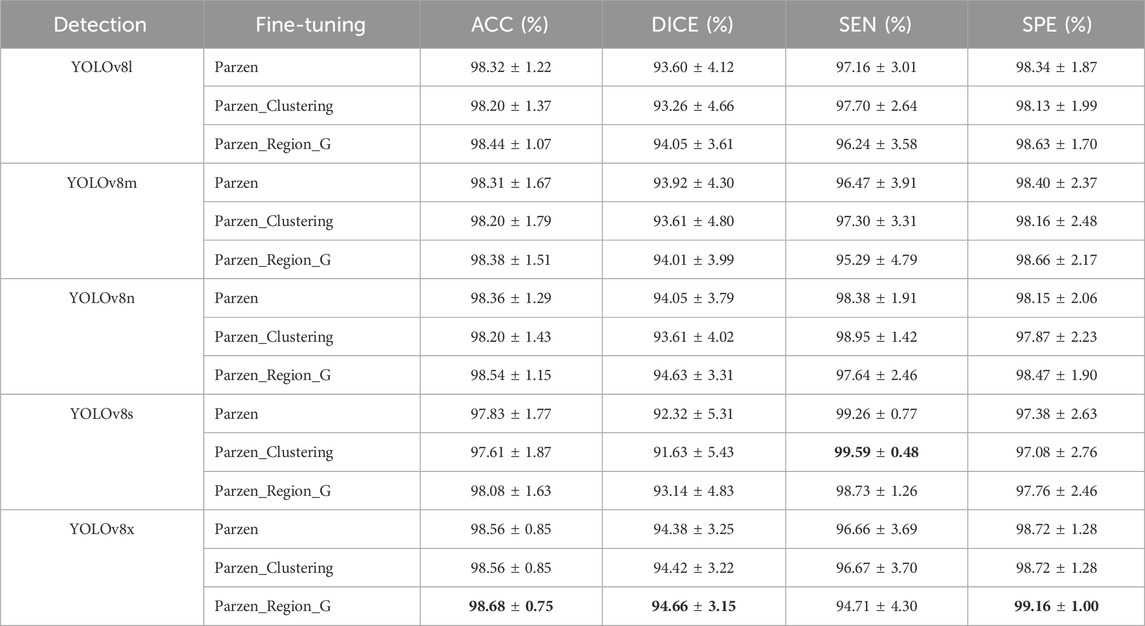
Table 3. Metric results for segmentation in the models developed in this study. The models are composed of the combination of a version of YOLOv8 with a type of fine-tuning. The table in question covers the metrics of ACC, DICE, SEN, and SPE.
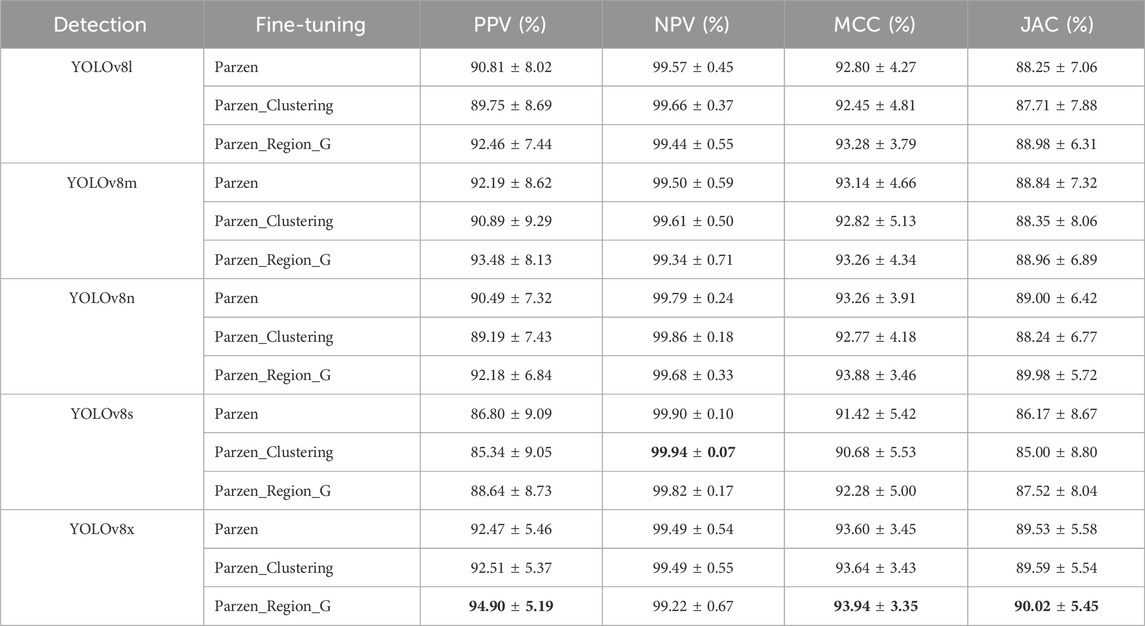
Table 4. Metric results for segmentation in the models developed in this study. The models are composed of the combination of a version of YOLOv8 with a type of fine-tuning. The table in question covers the metrics of PPV, NPV, MCC, and JAC.
The specificity of 99.16% indicates a commendable ability to identify true-negative pixels. Lastly, while the sensitivity of the best-proposed model did not have the highest average, with a value of 94.71%, which is 4.88% lower than the highest sensitivity recorded in the table, this proximity margin suggests a satisfactory capacity of the model in detecting true-positive pixels in the image.
Finally, Figure 8 illustrates the comparison among metrics for the segmentation models developed in this study. It is noteworthy to consider the smaller scale for the Dice metric across all models, indicating a relatively lower average compared to other metrics.
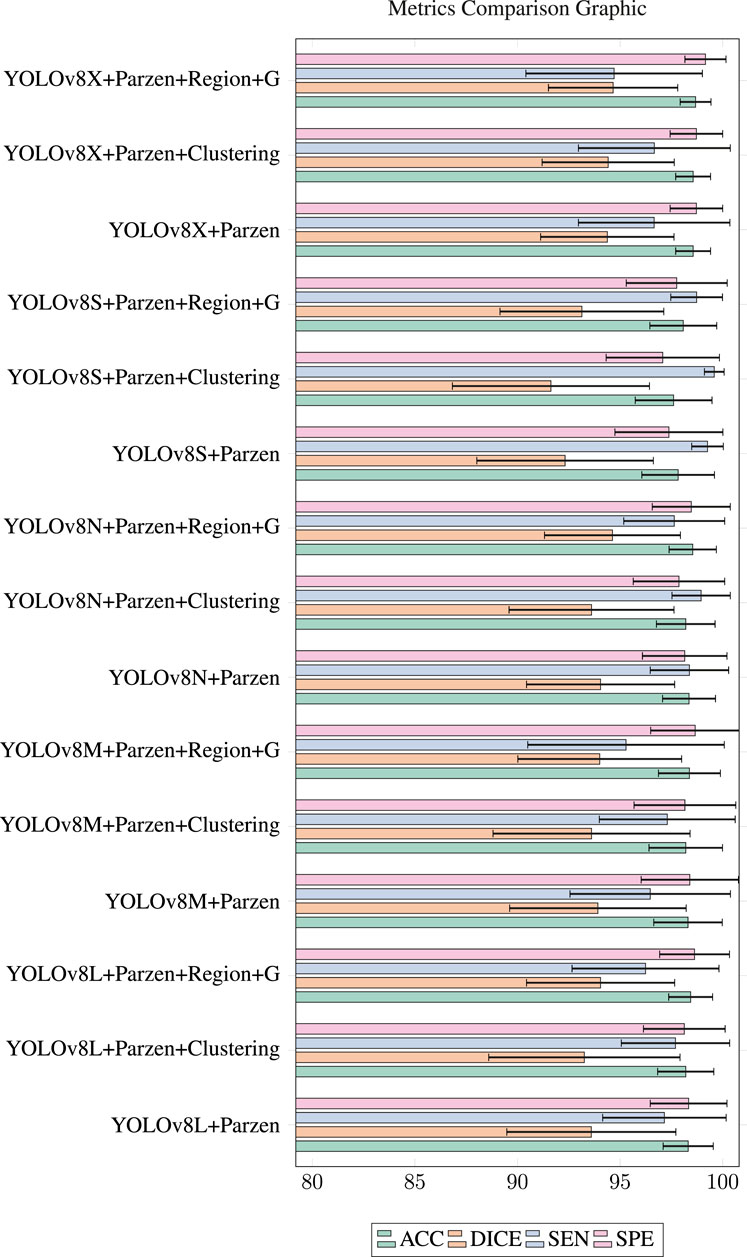
Figure 8. Graphical data from Table 3, which presents different results through the metrics ACC, DICE, SEN, and SPE. The figure illustrates these results through horizontal bars comparing the deep learning–based and fine-tuning models generated by the proposed study.
From Table 4, it is evident that the best-proposed model has the highest PPV in the table, illustrated by Figure 9 with an average of 94.90%, indicating a good proportion of correctly segmented pixels in the applied dermoscopic images. For the NPV metric, the top-performing method achieved an average of 99.22%, slightly lower by 0.72% compared to the highest NPV, showcasing excellent performance in terms of not segmenting background pixels, i.e., the unaffected skin of the patient.
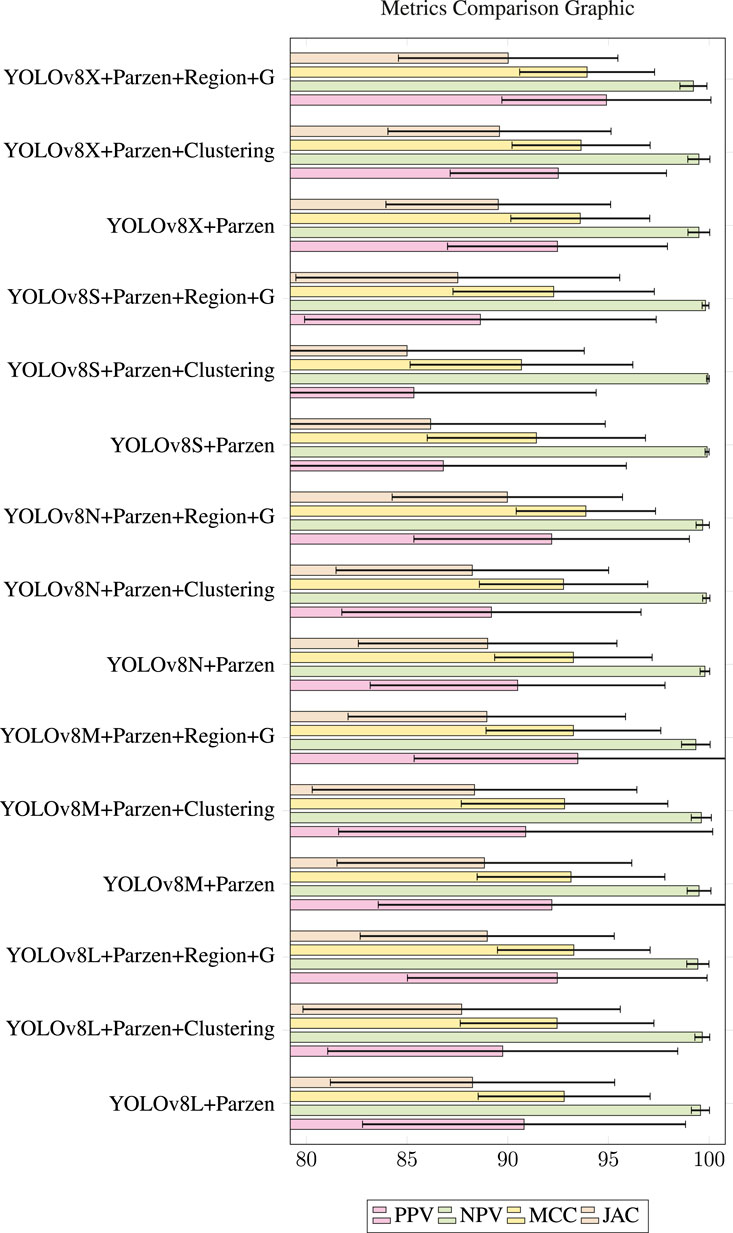
Figure 9. Graphical data from Table 4, which presents different results through the metrics PPV, NPV, MCC, and JAC. The figure illustrates these results through horizontal bars comparing the deep learning-based and fine-tuning models generated by the proposed study.
In terms of the MCC metric, the proposed method obtained the highest result, with 93.94%, which is a satisfactory value for this metric, as it indicates a comprehensive measure of segmentation performance, considering the proportion of true positives, false positives, true negatives, and false negatives. For the JAC metric, the best model also achieved the highest value at 90.02%. This metric measures the overlap between the set of pixels segmented by the model and the pixels truly belonging to the melanoma region in the image. The Jaccard coefficient is particularly important when it comes to assessing the similarity of the segmentation edges produced by the model and those identified by a medical expert.
5.3 Results of the third experiment—comparison with the state of the art
This subsection presents different results from renowned methods in the literature for the detection and segmentation of melanoma in dermatoscopic images. Table 5 displays various state-of-the-art methods for the database presented in Subsection 3.1. The method proposed in this study based on edge computing achieved results in all metrics used in various works compared in the literature. The method titled HTMDS—detection and segmentation of melanoma achieved over 4% improvement in accuracy when compared to methods with the worst cases: 98.68% versus 94.25%. Despite the comparison models being diverse, which include semi-automatic methods and manual detection, the proposed method (HTMDS) for melanoma detection and segmentation achieved superior results by more than 9% when compared to the recognized models, in contrast to the study by Pennisi et al. (2016), which obtained an accuracy of 89.66%.
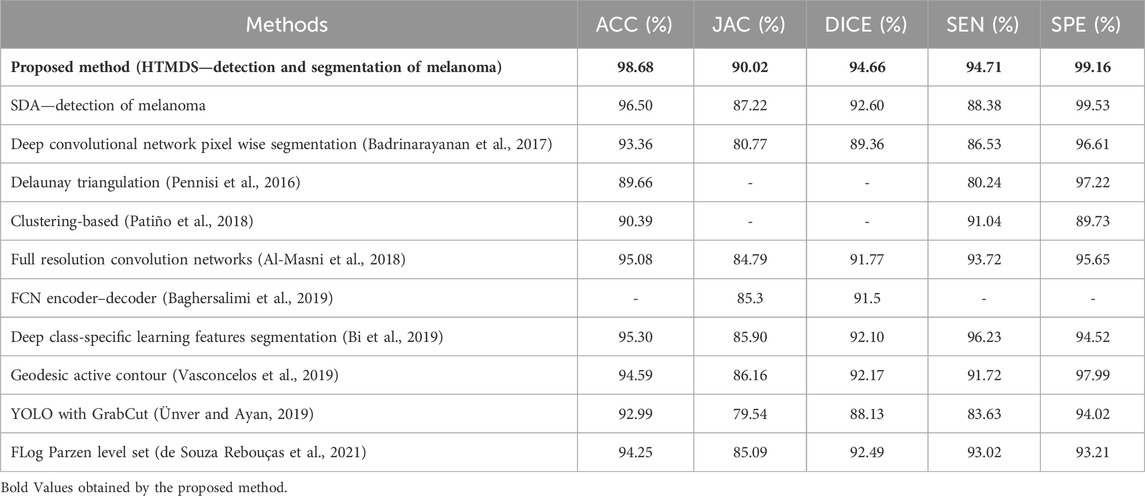
Table 5. Comparison of the best model proposed by this study with the state of the art.
The proposed model surpassed equivalent methods using deep learning, such as the methods of Badrinarayanan et al. (2017), which applied solutions to the same problem but without the use of edge computing. In other words, conventional methods used on local machines, as in the case of de Souza Rebouças et al. (2021), and some other works like that of Al-Masni et al. (2018) did not present similar metrics, thereby not allowing a more precise validation for melanoma segmentation.
Based on the experiments conducted and the comparison with the same database used by different experiments, it can be concluded that the proposed method surpassed in various metrics, such as ACC, JAC, and DICE, making the model robust for accurate detection and fully automatic segmentation of skin cancer. The graph in Figure 10 visually illustrates the different values obtained through the metrics commonly used by different state-of-the-art methods, in which the efficacy can be identified when compared through vertical bars. This provides an innovative proposal for data processing for the problem in the literature and a result that can be applied to models of intelligent systems integrated into proposals for cities and intelligent systems.
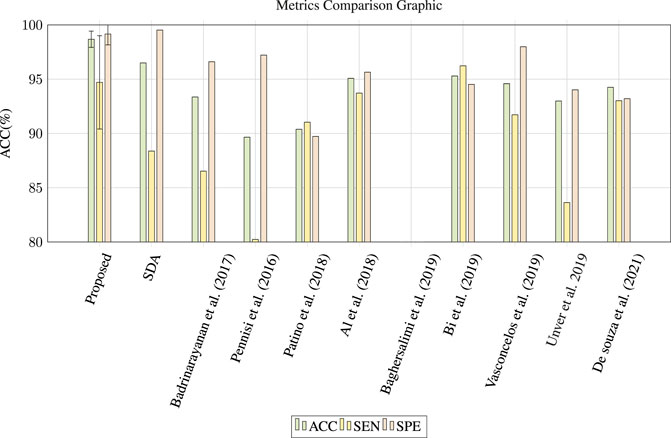
Figure 10. Chart obtained from the comparison table with the state of the art. The graph presents a comparison of different metrics methods found in the state of the art.
It is worth noting that having achieved the highest metrics for ACC, DICE, SPE, PPV, MCC, and JAC for the addressed data set, the combination of YOLOv8x with the fine-tuning of Parzen window with region growing proved to be the most performant method compared to others for melanoma segmentation in dermoscopic images.
The YOLOv8x is the most robust version of YOLOv8, featuring a more robust architecture, longer training time, and typically a higher number of training epochs. This model performs binary mask detection with high resolution, exhibiting edges closely resembling the gold standard and a high detection accuracy rate. Combining this high detection capability with a well-defined binary mask, the fine-tuning based on Parzen window with region growing, when appropriately parameterized for the application, proves effective in enhancing the edges of the binary mask.
The region growing, with an adherence rule based on grayscale intensity variation of approximately ±10, expands the mask subtly and judiciously. On the other hand, Parzen window is configured to achieve uniform adjustment of the edges with few iterations and low energy. Consequently, the fine-tuning aims for pixel-level improvement in the quality of segmentation edges, enhancing their resemblance to the gold standard.
Table 6 represents the Friedman statistical test conducted between the best model, YOLOv8x + Parzen + clustering, in comparison to other methods found in the state of the art. The condition exposed in expression 15 indicates the meaning of the symbols in the statistical test table, where “⊕” signifies that the means and deviations of that metric for that model are constructed under vectors of metrics that are statistically equivalent to those of the best proposed model. Meanwhile, “x” indicates the opposite, represented in Eq. 15.
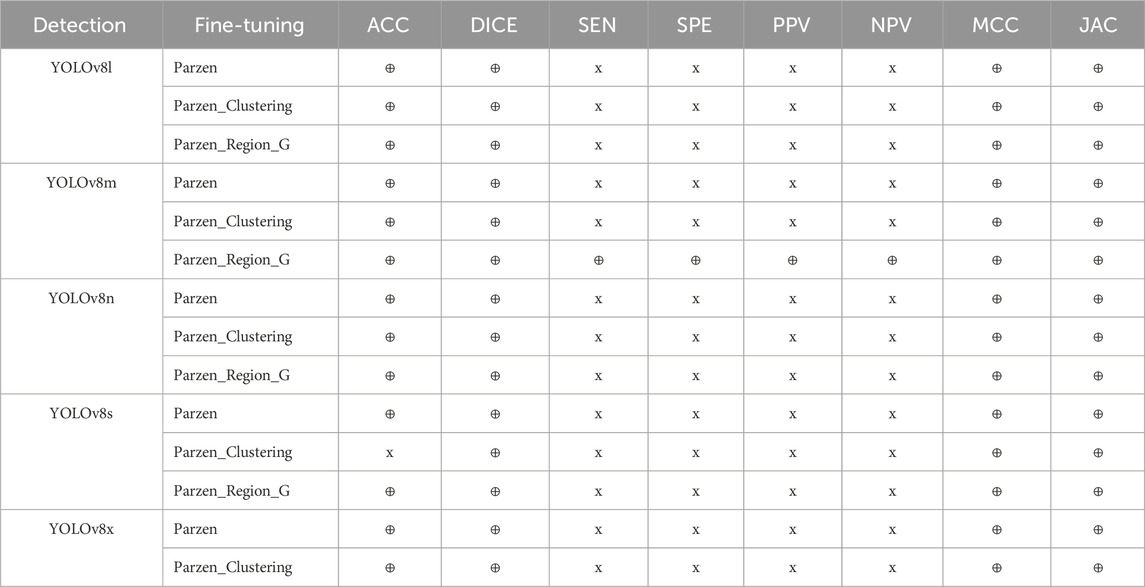
Table 6. Comparison of total processing time between the models developed in this study for segmentation.
The test indicates that practically all vectors of ACC, DICE, MCC, and JAC are statistically equivalent to the vectors of the best proposed model, which may represent a relative similarity in the metrics, with outliers explaining the variations. On the other hand, the metric vectors of SEN, SPE, PPV, and NPV, in general, are statistically different from the metric vectors of the best model; for these same metrics, this indicates that the best proposed model was generally distinct in most cases compared to the other models concerning these metrics.
Finally, for the time comparison observed in Table 7, the fastest segmentation model was YOLOv8n with fine-tuning based on Parzen window, with an average time of 5.59 s and being faster by 0.64 s than the best-performing model, YOLOv8x + Parzen + region growing, with 6.23 s. YOLOv8n is a nano version of YOLOv8, with a smaller architecture and a focus on speed, sacrificing raw processing power compared to its more robust counterparts. Meanwhile, Parzen window, without region growing, proved to be fast in edge adjustment. Figure 11 graphically illustrates the time comparison from the table.
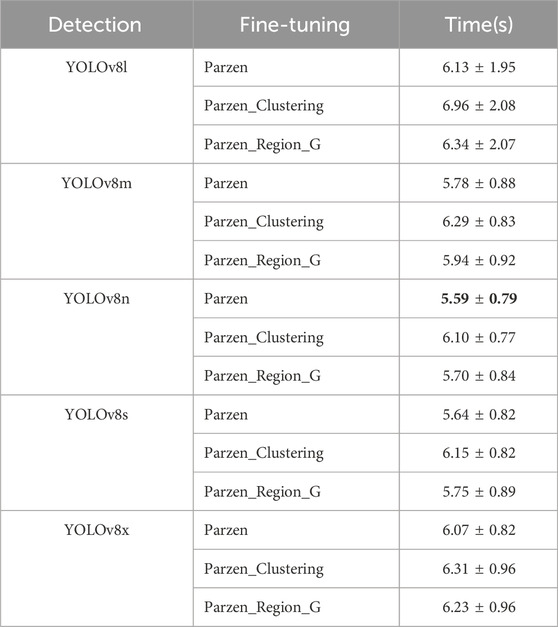
Table 7. Time comparison between the fine-tuning methods proposed by this study.
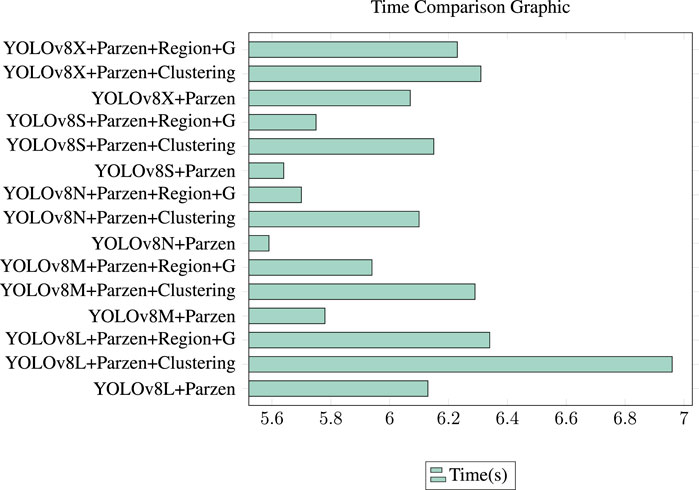
Figure 11. Chart comparing the segmentation time for different combinations of detection and fine-tuning.
Table 8 contains studies that used various data sets for melanoma segmentation, particularly the PH2 data set. In general, authors employ some CNN model capable of performing segmentation or at least detecting the region of interest. The proposed method, compared to other methods, achieves better results in terms of accuracy, with an average 1.18% higher accuracy than the second-best method (98.68–97.5). It is worth noting that the method with the second-highest accuracy uses a set of CNNs for classification and the perceptron coupled with histograms of oriented gradient colors for segmentation. The authors did not indicate the deviation of their model, which would potentially help understand its performance and the homogeneity of the metric obtained, as it could arise from a set of cases with very good and very poor segmentation.
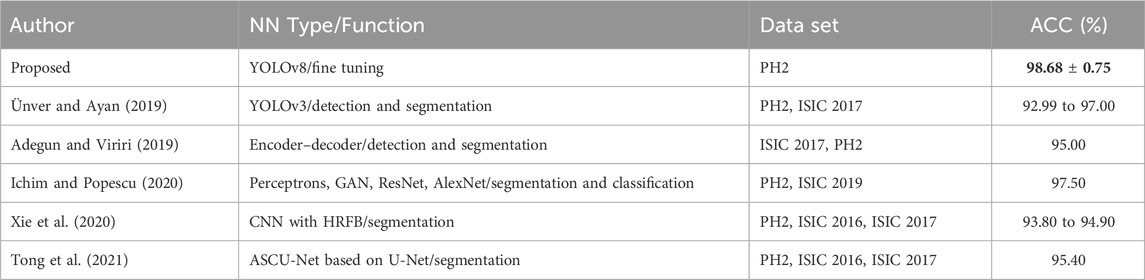
Table 8. Comparison with the studies found in Popescu et al. (2022) that used the PH2 data set for melanoma segmentation and the database used in the experiments of the proposed study.
6 Conclusion
The proposed study is based on a new Health of Things approach applied to edge computing. The proposal discusses a system named HTMDS for the detection and segmentation of melanoma in dermatoscopic images. The HTMDS could identify and segment the melanoma region accurately and effectively based on deep learning, using the YOLOv8 framework for the identification of the skin cancer region, and the use of fine-tuning combined with different techniques such as region growing, Parzen window, and clustering for precise segmentation as a refinement layer of the processed data.
The HTMDS presented an automatic detection and segmentation of melanoma using deep learning, obtaining great results compared to the state of the art. The proposed YOLOv8x method achieved excellent metric values, obtaining 98.67% accuracy in effectively detecting melanoma in dermatoscopic images. Followed by fine-tuning for precise segmentation of the region, the HTMDS achieved 98.68% accuracy with the best YOLOv8x Parzen_Region_G model, surpassing various works in the literature. The study showed improvement in the performance of automatic detection time and segmentation with 5.59 s in its best case based on fine-tuning models, showing satisfactory results related to methods in the literature, such as manual, semi-automatic, and automatic methods. It can be concluded that the HTMDS is effective for both detection and segmentation in dermatoscopic images of melanoma, demonstrating robustness. Thus, the system can be used to assist medical diagnosis in CAD systems, thereby reducing the response time through applications based on edge computing. The study aims to propose a new effective approach in communication technologies for segmentation in skin cancer images, in addition to proposing an innovative approach that brings satisfactory results compared to the performance of different state-of-the-art methods. In this way, the study’s contribution is mainly due to the proposal of an efficient computational model using deep learning and fine-tuning through the use of optimized computer vision and cloud computing models. The approach allows for an improvement in the speed and reliability of the medical data flow for smart cities, allowing for better clinical monitoring of the progression of pathologies and possibilities of aiding in intelligent medical diagnosis.
For future work, different problems can be addressed. The classification of types of melanomas is an area that requires further studying as well as a labeled database for classification; the use of different databases can bring new comparisons and results. The proposed work can be applied, retrained, and used with different medical image databases; the use of tools based on model generalization in images of skin cancer and bruises in the epidermis can be applications for different medical diagnostic aid solutions. In addition, it can also be trained on different medical images for different problems, such as the detection of brain tumors in magnetic resonance imaging and computed tomographies, among other medical images.
Data availability statement
The original contributions presented in the study are included in the article/Supplementary Material; further inquiries can be directed to the corresponding authors.
Author contributions
JC: Manuscript writing–original draft, review, and editing. AM: Manuscript writing–original draft, review, and editing. YA: Manuscript writing–original draft, review, and editing. GB: Manuscript writing–original draft, review, and editing. IR: Manuscript writing–original draft, review, and editing. CD: Manuscript writing–original draft, review, and editing. LF: Manuscript writing–original draft, review, and editing.
Funding
The authors declare that financial support was received for the research, authorship, and/or publication of this article. This study was financed in part by the Coordenação de Aperfeiçoamento de Pessoal de Nível Superior—Brasil (CAPES)—Finance Code 001.
Acknowledgments
Author LF acknowledges the sponsorship from the Brazilian National Council for Research and Development (CNPq).
Conflict of interest
The authors declare that the research was conducted in the absence of any commercial or financial relationships that could be construed as a potential conflict of interest.
Publisher’s note
All claims expressed in this article are solely those of the authors and do not necessarily represent those of their affiliated organizations, or those of the publisher, editors, and reviewers. Any product that may be evaluated in this article, or claim that may be made by its manufacturer, is not guaranteed or endorsed by the publisher.
References
Aceto, G., Persico, V., and Pescapé, A. (2020). Industry 4.0 and health: internet of things, big data, and cloud computing for healthcare 4.0. J. Industrial Inf. Integration 18, 100129. doi:10.1016/j.jii.2020.100129
Adegun, A. A., and Viriri, S. (2019). Deep learning-based system for automatic melanoma detection. IEEE Access 8, 7160–7172. doi:10.1109/access.2019.2962812
Al-Masni, M. A., Al-Antari, M. A., Choi, M.-T., Han, S.-M., and Kim, T.-S. (2018). Skin lesion segmentation in dermoscopy images via deep full resolution convolutional networks. Comput. methods programs Biomed. 162, 221–231. doi:10.1016/j.cmpb.2018.05.027
Arnold, M., Singh, D., Laversanne, M., Vignat, J., Vaccarella, S., Meheus, F., et al. (2022). Global burden of cutaneous melanoma in 2020 and projections to 2040. JAMA dermatol. 158, 495–503. doi:10.1001/jamadermatol.2022.0160
Badrinarayanan, V., Kendall, A., and Cipolla, R. (2017). Segnet: a deep convolutional encoder-decoder architecture for image segmentation. IEEE Trans. pattern analysis Mach. Intell. 39, 2481–2495. doi:10.1109/tpami.2016.2644615
Baghersalimi, S., Bozorgtabar, B., Schmid-Saugeon, P., Ekenel, H. K., and Thiran, J.-P. (2019). Dermonet: densely linked convolutional neural network for efficient skin lesion segmentation. EURASIP J. Image Video Process. 2019, 71–10. doi:10.1186/s13640-019-0467-y
Bengio, Y., Larochelle, H., and Vincent, P. (2006). “Non-local manifold parzen windows,” in Advances in neural information processing systems (United States: MIT Press), 115–122.
Bi, L., Kim, J., Ahn, E., Kumar, A., Feng, D., and Fulham, M. (2019). Step-wise integration of deep class-specific learning for dermoscopic image segmentation. Pattern Recognit. 85, 78–89. doi:10.1016/j.patcog.2018.08.001
Biratu, E. S. S., Schwenker, F., Debelee, T. G. G., Kebede, S. R. R., Negera, W. G. G., and Molla, H. T. T. (2021). Enhanced region growing for brain tumor mr image segmentation. J. Imaging 7, 22. doi:10.3390/jimaging7020022
Celebi, M. E., Codella, N., and Halpern, A. (2019). Dermoscopy image analysis: overview and future directions. IEEE J. Biomed. health Inf. 23, 474–478. doi:10.1109/jbhi.2019.2895803
Chen, B., Wan, J., Celesti, A., Li, D., Abbas, H., and Zhang, Q. (2018). Edge computing in iot-based manufacturing. IEEE Commun. Mag. 56, 103–109. doi:10.1109/MCOM.2018.1701231
Da Costa Nascimento, J. J., Marques, A. G., Dos Santos, M. A., De Oliveira, L., Chaves, J. M., De Freitas Souza, L. F., et al. (2023). “New health of things approach to classification and detection of brain tumors using transfer learning for segmentation in imr images,” in 2023 International Joint Conference on Neural Networks (IJCNN), Gold Coast, Australia, June 18-23, 2023, 1–8.
De Freitas Souza, L. F., Michaliszen Junior, J. R., Marques, A. G., Adelino Rodrigues, Y. O., Brilhante Severiano, G. F., Da Costa Nascimento, J. J., et al. (2023). “Divisible cell-segmentation: a new approach for stroke detection and segmentation in ct scans using deep learning and fine-tuning,” in 2023 International Joint Conference on Neural Networks (IJCNN), Gold Coast, Australia, June 18-23, 2023, 1–9.
de Souza Rebouças, E., de Medeiros, F. N. S., Marques, R. C. P., Chagas, J. V. S., Guimaraes, M. T., Santos, L. O., et al. (2021). Level set approach based on parzen window and floor of log for edge computing object segmentation in digital images. Appl. Soft Comput. 105, 107273. doi:10.1016/j.asoc.2021.107273
Gajera, H. K., Nayak, D. R., and Zaveri, M. A. (2023). A comprehensive analysis of dermoscopy images for melanoma detection via deep cnn features. Biomed. Signal Process. Control 79, 104186. doi:10.1016/j.bspc.2022.104186
Gordon, L., Olsen, C., Whiteman, D. C., Elliott, T. M., Janda, M., and Green, A. (2020). Prevention versus early detection for long-term control of melanoma and keratinocyte carcinomas: a cost-effectiveness modelling study. BMJ open 10, e034388. doi:10.1136/bmjopen-2019-034388
Han, T., Nunes, V. X., De Freitas Souza, L. F., Marques, A. G., Silva, I. C. L., Junior, M. A. A. F., et al. (2020). Internet of medical things—based on deep learning techniques for segmentation of lung and stroke regions in ct scans. IEEE Access 8, 71117–71135. doi:10.1109/ACCESS.2020.2987932
Huh, J.-H., and Seo, Y.-S. (2019). Understanding edge computing: engineering evolution with artificial intelligence. IEEE Access 7, 164229–164245. doi:10.1109/ACCESS.2019.2945338
Ichim, L., and Popescu, D. (2020). Melanoma detection using an objective system based on multiple connected neural networks. IEEE Access 8, 179189–179202. doi:10.1109/access.2020.3028248
Iosup, A., Ostermann, S., Yigitbasi, N., Prodan, R., Fahringer, T., and Epema, D. (2011). Performance analysis of cloud computing services for many-tasks scientific computing. IEEE Trans. Parallel Distributed Syst. 22, 931–945. doi:10.1109/TPDS.2011.66
Jones, O., Jurascheck, L., Van Melle, M., Hickman, S., Burrows, N., Hall, P., et al. (2019). Dermoscopy for melanoma detection and triage in primary care: a systematic review. BMJ open 9, e027529. doi:10.1136/bmjopen-2018-027529
Krensel, M., Schäfer, I., and Augustin, M. (2019). Cost-of-illness of melanoma in europe–a systematic review of the published literature. J. Eur. Acad. Dermatology Venereol. 33, 504–510. doi:10.1111/jdv.15315
Likas, A., Vlassis, N., and Verbeek, J. J. (2003). The global k-means clustering algorithm. Pattern Recognit. 36, 451–461. doi:10.1016/s0031-3203(02)00060-2
Long, G. V., Swetter, S. M., Menzies, A. M., Gershenwald, J. E., and Scolyer, R. A. (2023). Cutaneous melanoma. Lancet 402, 485–502. doi:10.1016/s0140-6736(23)00821-8
Marques, A. G., Souza, L. F. d. F., dos Santos, M. A., da Costa Nascimento, J. J., Sarmento, R. M., Lucena, I. B., et al. (2022). “Automatic segmentation of hemorrhagic stroke on brain ct images using convolutional neural networks through fine-tuning,” in 2022 International Joint Conference on Neural Networks (IJCNN) (IEEE), Padua, Italy, July 18-23, 2022, 01–08.
Miao, X. (2022). “Research on the application of cloud computing technology in computer data processing.” in 2021 3rd International Conference on Machine Learning, Big Data and Business Intelligence (MLBDBI), Taiyuan, China, 03-05 December 2021.
Nascimento, J. J. D. C., Marques, A. G., Dos Santos, M. A., De Oliveira, L., Chaves, J. M., Souza, L. F. D. F., et al. (2023). “New health of things approach to classification and detection of brain tumors using transfer learning for segmentation in imr images,” in 2023 International Joint Conference on Neural Networks (IJCNN) (IEEE), Gold Coast, Australia, June 18-23, 2023, 1–8.
Pallis, G. (2010). Cloud computing: the new frontier of internet computing. IEEE Internet Comput. 14, 70–73. doi:10.1109/MIC.2010.113
Parigi, A., Lim, M., Canchi, S., Sanchez, J., Walter, J., Harris, R. M., et al. (2022). A virtual training module for introducing the use of amazon web services. J. Open Source Educ. 5, 167. doi:10.21105/jose.00167
Patiño, D., Avendaño, J., and Branch, J. W. (2018). “Automatic skin lesion segmentation on dermoscopic images by the means of superpixel merging,” in International conference on medical image computing and computer-assisted intervention, Granada, Spain, September 16-20, 2018, 728–736.
Pennisi, A., Bloisi, D. D., Nardi, D., Giampetruzzi, A. R., Mondino, C., and Facchiano, A. (2016). Skin lesion image segmentation using delaunay triangulation for melanoma detection. Comput. Med. Imaging Graph. 52, 89–103. doi:10.1016/j.compmedimag.2016.05.002
Popescu, D., El-Khatib, M., El-Khatib, H., and Ichim, L. (2022). New trends in melanoma detection using neural networks: a systematic review. Sensors 22, 496. doi:10.3390/s22020496
Rossi, M., Pellegrini, C., Cardelli, L., Ciciarelli, V., Di Nardo, L., and Fargnoli, M. C. (2019). Familial melanoma: diagnostic and management implications. Dermatology Pract. Concept. 9, 10–16. doi:10.5826/dpc.0901a03
Sandru, A., Voinea, S., Panaitescu, E., and Blidaru, A. (2014). Survival rates of patients with metastatic malignant melanoma. J. Med. life 7, 572–576.
Shi, W., Cao, J., Zhang, Q., Li, Y., and Xu, L. (2016). Edge computing: vision and challenges. IEEE Internet Things J. 3, 637–646. doi:10.1109/JIOT.2016.2579198
Shi, W., and Dustdar, S. (2016). The promise of edge computing. Computer 49, 78–81. doi:10.1109/MC.2016.145
Sikka, R., and Ojha, M. (2021). An overview of cloud computing. Int. J. Innovative Res. Comput. Sci. Technol., 135–138. doi:10.55524/ijircst.2021.9.6.31
Taha, A. A., and Hanbury, A. (2015). Metrics for evaluating 3d medical image segmentation: analysis, selection, and tool. BMC Med. imaging 15, 29–28. doi:10.1186/s12880-015-0068-x
Tong, X., Wei, J., Sun, B., Su, S., Zuo, Z., and Wu, P. (2021). Ascu-net: attention gate, spatial and channel attention u-net for skin lesion segmentation. Diagnostics 11, 501. doi:10.3390/diagnostics11030501
Ünver, H. M., and Ayan, E. (2019). Skin lesion segmentation in dermoscopic images with combination of yolo and grabcut algorithm. Diagnostics 9, 72. doi:10.3390/diagnostics9030072
Vasconcelos, F. F. X., Medeiros, A. G., Peixoto, S. A., and Reboucas Filho, P. P. (2019). Automatic skin lesions segmentation based on a new morphological approach via geodesic active contour. Cognitive Syst. Res. 55, 44–59. doi:10.1016/j.cogsys.2018.12.008
Xie, F., Yang, J., Liu, J., Jiang, Z., Zheng, Y., and Wang, Y. (2020). Skin lesion segmentation using high-resolution convolutional neural network. Comput. methods programs Biomed. 186, 105241. doi:10.1016/j.cmpb.2019.105241
Yasmim, O. A., Rodrigues, O., da Costa Nascimento, J. J., and de Freitas Souza, L. F. (2023). Sda-detection melanoma: deep approach system for detection and segmentation in melanoma images using fine-tuning. Comput. Med. Imaging Graph.
Keywords: melanoma detection and segmentation, deep learning, medical image, fine-tuning, edge computing
Citation: Da Costa Nascimento JJ, Marques AG, Adelino Rodrigues YO, Brilhante Severiano GF, Rodrigues IdS, Dourado C Jr and De Freitas Souza LF (2024) Health of Things Melanoma Detection System—detection and segmentation of melanoma in dermoscopic images applied to edge computing using deep learning and fine-tuning models. Front. Comms. Net 5:1376191. doi: 10.3389/frcmn.2024.1376191
Received: 25 January 2024; Accepted: 12 April 2024;
Published: 10 June 2024.
Edited by:
Essaid Sabir, Université TÉLUQ, CanadaReviewed by:
Saad Abouzahir, Mohamed Bin Zayed University of Artificial Intelligence (MBZUAI), United Arab EmiratesVanithamani R., Avinashilingam Institute for Home Science and Higher Education for Women, India
Safaa Driouech, Orange, France
Copyright © 2024 Da Costa Nascimento, Marques, Adelino Rodrigues, Brilhante Severiano, Rodrigues, Dourado and De Freitas Souza. This is an open-access article distributed under the terms of the Creative Commons Attribution License (CC BY). The use, distribution or reproduction in other forums is permitted, provided the original author(s) and the copyright owner(s) are credited and that the original publication in this journal is cited, in accordance with accepted academic practice. No use, distribution or reproduction is permitted which does not comply with these terms.
*Correspondence: José Jerovane Da Costa Nascimento, jerovanework@gmail.com; Luís Fabrício De Freitas Souza, fabricio.freitas@ufca.edu.br