 Robert T. Goldman
 Sara K. McBride
 Wendy K. Stovall
 David E. Damby
- 1Department of Geology, University of Illinois at Urbana-Champaign, Urbana, IL, United States
- 2U.S. Geological Survey, Earthquake Science Center, Moffett Field, CA, United States
- 3U.S. Geological Survey, Volcano Science Center, Vancouver, WA, United States
- 4U.S. Geological Survey, Volcano Science Center, Moffett Field, CA, United States
Responsive and empathic communication by scientists is critical for building trust and engagement with communities, which, in turn, promotes receptiveness toward authoritative hazard information during times of crisis. The 2018 eruption of Hawai‘i's Kīlauea Volcano was the first volcanic crisis event in which communication via the U.S. Geological Survey (USGS) social media group, “USGS Volcanoes,” played a major role in providing eruption information to publics. Providing a concrete assessment of the social media effort during the eruption is necessary for optimizing future social media hazard crisis communication. We present qualitative and quantitative analyses of USGS Volcanoes' Facebook posts and over 22,000 follow-on comments spanning the 2018 eruption. Our analyses reveal that, for the 16 posts with the highest user engagement, USGS Volcanoes and informed non-USGS users directly answered 73% of questions and directly corrected or called out inaccuracies in over 54% of comments containing misinformation. User sentiments were 66% positive on average per comment thread regarding eruption information, and user feedback toward USGS Volcanoes, USGS scientists, or the Hawaiian Volcano Observatory was 86% positive on average. Quantitative sentiment analysis reveals a 61% correlation between users' overall expressed sentiments and frequency of the word “thank,” providing further evidence that social media engagement by USGS Volcanoes and informed users positively impacted collective user sentiment. Themes emerging from our qualitative thematic analysis illustrate how communication strategies employed by USGS Volcanoes successfully engaged and benefitted users, providing insights for communicating with publics on social media during crisis situations.
1 Introduction
The U.S. Geological Survey (USGS) Volcano Hazards Program (VHP) is responsible for providing U.S. eruption-hazard-related information to a variety of stakeholders, including residents, emergency managers, media organizations, aviation industry, public health agencies, and broader publics (Dietterich and Neal, 2022). During periods of calm (i.e., when volcanoes are not in a state of heightened unrest), the VHP provides general scientific information about volcanoes, including potential hazards (Stovall et al., 2016). During significant volcanic eruptions, the VHP provides this information far more frequently, often hourly, through local, regional, and national communication channels (Brown et al., 2015; Williams et al., 2020).
The eruption of Hawai‘i's Kīlauea Volcano from May through September 2018 was the largest of its kind in the last 200 years (Neal et al., 2019). Hazards were varied and impacted communities throughout the state. The Island of Hawai‘i was most affected by lava flows, sulfur dioxide gas and volcanic smog (vog), volcanic ash, earthquakes, and the collapse of Kīlauea's summit caldera (Neal et al., 2019). Throughout the eruption, VHP scientists and staff provided regular eruption updates through in-person community meetings, daily interagency press briefings, answering individual questions via email, updates to the official USGS Hawaiian Volcano Observatory (HVO) webpage (Tsang and Lindsay, 2019; Goldman et al., 2023; Stovall et al., 2023), and official email and SMS messages through the USGS Volcano Notification System, consistent with previous eruption responses in Hawai‘i (Brantley et al., 2019).
Unlike previous Hawai‘i eruption responses, social media also played a significant role in the USGS VHP's public communication in 2018. The USGS VHP social media group (hereafter called USGS Volcanoes) used Facebook and Twitter accounts to share eruption information with media, impacted community members, and curious or vested users worldwide (Stovall et al., 2023). Here we assess the strengths and shortcomings of this tool to optimize future social media crisis communication efforts by the USGS VHP; findings may have relevance for social media crisis response planning for other hazard monitoring organizations.
One way of assessing the effectiveness of the USGS Volcanoes' 2018 eruption communication effort is to quantify the frequency of responses provided by USGS Volcanoes to questions posted by others on their page. This approach directly evaluates one of USGS Volcanoes' key goals: “answer all questions” about the 2018 eruption (Stovall et al., 2023). Similarly, we can quantify how often USGS Volcanoes responded to posts containing false information (i.e., misinformation) or rumors, a problem that commonly occurs during hazard crises (Starbird et al., 2016; Hagley, 2021).
Another way of assessing USGS Volcanoes' social media communication efficacy during the 2018 eruption response is to understand USGS Volcanoes' role in promoting or reinforcing users' trust in the USGS and HVO (Goldman et al., 2023; Stovall et al., 2023). Social media, like in-person community meetings and the “askHVO” email account, provide a means of personal engagement between social media users and official messengers that, when done effectively, can build the public's trust (Woods et al., 2017; McBride and Ball, 2022; Stovall et al., 2023). Expressions of gratitude are common and reliable indicators of user trust in authoritative sources on social media (Graham et al., 2023). Taken further, analyzing the full range of sentiments expressed by social media users in response to USGS Volcanoes' post content or comments can provide a more complete picture of users' perception of USGS Volcanoes as a credible source and messenger of eruption information (Tumpey et al., 2019; Goldman et al., 2023), especially when compared with users' sentiments expressed toward non-USGS sources or messengers on social media (Goldman et al., 2023).
Given the above considerations, we analyze USGS Volcanoes' social media communications by addressing the following two sets of questions:
1) How frequent and effective were USGS Volcanoes and informed users' responses to other non-USGS users' eruption-related questions or comments containing misinformation or rumors?
2) How positively did users respond to USGS Volcanoes' posts and comments? How does this compare with overall audience sentiment toward non-USGS users?
To answer these questions, we focus our investigation on USGS Volcanoes' Facebook page, as this was the social media platform that Hawai‘i residents reported visiting most regularly for 2018 eruption information, according to interviews conducted by Goldman et al. (2023). Facebook is also the most widely used social media platform in both the United States (Pew Research Center, 2021) and worldwide (Cheng et al., 2022; Graham et al., 2023), making our findings broadly applicable to hazard communication using social media by scientists and government agencies around the world.
Additionally, we identify and explain patterns in misinformation occurring in users' comments on USGS Volcanoes' social media pages throughout the 2018 eruption. This complements our analysis of USGS Volcanoes' communication by comparing major misinformation topics, their distribution through time, USGS Volcanoes' strategies in response, and whether increased occurrences of misinformation within users' comments are correlated with increases in negative sentiments expressed by users.
2 Background
Over the past decade, social media platforms have become necessary for conveying hazard information to public audiences at local (Hagley, 2021), national (Stovall et al., 2023), and global (Eriksson, 2018) scales. Social media's overall popularity is explained by Uses and Gratifications Theory (UGT), which posits that people seek out certain media to satisfy their personal needs (Rubin, 2009; Griffin, 2012), such as seeing themselves reflected in those channels and the sources communicating through them (Severin and Tankard, 2000). UGT also helps explain social media's utility for hazard communication, since people commonly use social media to seek out information about an event, educate themselves about a topic, or easily share information with others (Whiting and Williams, 2013). These popular social media functions are also described by the theory of sensemaking, which asserts that people constantly seek out information to fill gaps in understanding or make sense of their circumstances (Dervin, 2003; Weick et al., 2005; Starbird et al., 2016).
Social media provide numerous hazard communication benefits, including rapid information feedback loops both to and from those at risk (Flew et al., 2014; Westerman et al., 2014), an ability to handle high volumes of communication traffic (Saroj and Pal, 2020), and maintaining communication if cell phone reception is lost due to local or regional power outages caused by natural hazards (Tang et al., 2021). Social media have been especially effective in communicating hazard information during travel restrictions implemented during the first 2 years of the COVID-19 pandemic (Graham et al., 2023).
More traditional broadcast media channels—including radio, television, telephone, and non-social-media webpages—tend to provide a unidirectional, top-down delivery of information from official sources to publics (Berlo, 1960). By contrast, social media platforms such as Facebook and Twitter allow for multidirectional communication threads between publics and official messengers of hazard information, and among publics themselves (Taylor et al., 2012; Simon et al., 2015; Goldman et al., 2023). This two-way communication can facilitate the development of trustworthy relationships between science agencies and the publics they seek to serve through informal and, where appropriate, potentially humorous exchanges (McBride and Ball, 2022).
Finally, the inherent informality and conversational culture of social media allows for open expression of emotion among users (Vongkusolkit and Huang, 2021), providing hazard communicators with a transparent and immediate understanding of users' attitudes that they can use to tailor responses during a crisis. Thus, scientists and emergency managers can leverage the unique benefits of social media to provide publics with accurate and timely hazard information that increases their situational awareness while providing comfort and resiliency through online community and connection (Taylor et al., 2012; Ruan et al., 2022; Graham et al., 2023).
However, the ability for anyone to produce and share information on social media also facilitates the creation and propagation of false information, particularly in response to crises that are rapidly changing or cannot be described with great certainty (Starbird et al., 2016; Hagley, 2021). In the absence of a clear, credible, or authoritative source of accurate information, social media users may rely on misinformation and rumors to satisfy their need to make sense of a highly uncertain and stressful situation (Oh et al., 2013). Rumors containing false information can increase users' anxiety, reduce their faith in official information sources, or inhibit their ability to properly assess the crisis situation and take appropriate actions for their safety (Weick, 1988; Hagley, 2021). Thus, successful hazard communication requires strategies that stop or reduce the occurrence of false information in favor of accurate and credibly sourced information (Stovall et al., 2023).
2.1 USGS volcano hazards communication on social media
Social media has been used for USGS hazard and volcano information communication since 2009, when the Alaska Volcano Observatory (AVO) and Alaska Division of Geological and Geophysical Surveys (ADGGS) created the first volcano alert social media account (@alaska_avo) on Twitter in response to public requests following volcanic unrest at Redoubt Volcano (Stovall et al., 2023). Public reception was so positive that AVO created Facebook and Instagram accounts in 2013 and 2015, respectively (Stovall et al., 2023). Following the 2014-15 Pāhoa lava flow crisis in Hawai‘i, the USGS VHP established a second major social media account, USGS Volcanoes, on Facebook and Twitter, to emulate the dedicated communication stream provided by @alaska_avo (Stovall et al., 2023).
Before 2018, the VHP provided public hazard communications related to Hawaiian volcanoes through Volcano Notification System alert email and SMS messages, HVO's website, the askHVO email account, HVO's “Volcano Watch” print and web articles, TV and radio broadcasts, and in-person community meetings (Goldman et al., 2023; Stovall et al., 2023). The 2018 eruption of Kīlauea Volcano was the first time USGS Volcanoes provided regular eruption updates on their Facebook and Twitter pages to complement the VHP's existing communication network. This effort resulted in a steep rise in user engagement on USGS Volcanoes' social media accounts (Figure 1), particularly among users based in Hawai‘i (Stovall et al., 2023). Thus, in addition to its traditional communication channels, USGS Volcanoes' social media became important platforms for conveying reliable and timely information about the 2018 Kīlauea eruption to Hawai‘i residents.
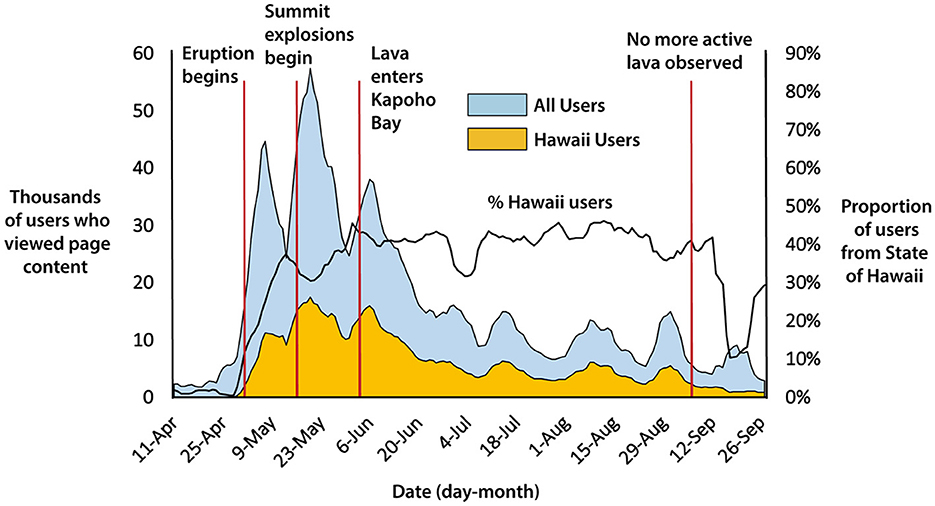
Figure 1. Plot of the 7-day running-average of USGS Volcanoes' reach, or the number of unique Facebook users who viewed at least one post from the USGS Volcanoes page, from April through September 2018. Adapted from Stovall et al. (2023).
2.2 Research term definitions
A post is a publicly visible body of text, often accompanied by a photograph, diagram, or video, published by the group USGS Volcanoes on their social media page (Kaplan and Haenlein, 2010), specifically, for this study, Facebook. Throughout the 2018 eruption, USGS Volcanoes published nearly 700 eruption-related posts (Stovall et al., 2023). A comment refers to any publicly visible body of text other than a post that is published by any user, including USGS Volcanoes, on the USGS Volcanoes social media page (Kaplan and Haenlein, 2010); note that these comments may include statements, questions, or both, as well as photos, videos, or links to other social media posts or external webpages. We define top-level comments as those posted directly in response to the original post rather than as a reply to another comment. A post comment thread is the publicly visible collection of all user comments posted (e.g., Gómez et al., 2008) in response to a USGS Volcanoes post. Users or publics are defined in our study as anyone interacting on social media who is not the source of information (i.e., USGS Volcanoes; Grunig, 2013). Informed users are users who provide factually correct information in response to other users' questions or misinformative posts (Kuklinski et al., 2000). We define factually correct, or accurate, information as that which is consistent with official information (Ruokolainen et al., 2023) in our research study; this means information that is posted by USGS Volcanoes or the USGS more broadly. We define reach as the number of unique individuals who viewed a USGS Volcanoes post or the USGS Volcanoes social media page on their mobile devices or computers (Verzosa Hurley and Kimme Hea, 2014).
We define misinformation as factually incorrect information that may or may not be intended to deceive other users (Rosnow, 2001; Bordia and Difonzo, 2004; Vraga and Bode, 2020). We define a rumor as a piece of misinformation that repeatedly appears within a single post or across multiple posts and conveys an unverified danger or threat (Bordia and Difonzo, 2004; Oh et al., 2013). We note that this definition of rumor is limited to false information, unlike the broader, factually agnostic definition employed in the social psychology literature (Andrews et al., 2016; Starbird et al., 2016), because the rumors we analyzed for our study were all factually incorrect. Our definition also excludes recurring misinformation that does not convey danger or a threat, since we do not consider these comments in detail for this study. However, some of these rumors did promote distrust of USGS Volcanoes or other authoritative information sources, as explained by Stovall et al. (2023). We define corrections as comments that refute misinformation with facts, while call-outs are comments condemning a misinformative post without correcting it with facts (Lee and Lee, 2023). Finally, we define trolling behavior as dialogue that intends to “cause disruption and/or to trigger or exacerbate conflict for the purposes of their own amusement” (Hardaker, 2010). The concept of sentiment is also critical to our study; we use sentiment analysis to understand self-expressed emotions in users' comments. Sentiment is defined as the valence of a person's opinion or emotion (Colombetti, 2005; Tausczik and Pennebaker, 2010).
3 Methods
We use a mixed qualitative and quantitative approach to better understand the complex issues of trust, misinformation, and relationships between scientists and the publics they seek to serve. Our main methodology is a qualitative thematic analysis, or exploration of words and structures within a body of text to construct meaning (Crabtree and Miller, 1999), of 16 Facebook post comment threads with the highest recorded user reach during the 2018 eruption. We complement this qualitative analysis with keyword tallies and quantitative sentiment analyses of the text-based comment dataset available through Facebook's application programming interface (API). Sentiment analysis refers to the method of organizing written text by the polarity of emotions or sentiments reflected within it (Hutto and Gilbert, 2014). Our use of both quantitative and qualitative methods is known as triangulation, a process for gaining insight across multiple datasets (Creswell, 2009) and validating the study's findings (Webb et al., 1966; Johnson et al., 2007).
Qualitative thematic analysis focuses on identifying prevailing themes in content (Braun and Clarke, 2012). Specifically, we use interpretative thematic analysis, which involves immersing ourselves in the data and using multiple rounds of coding to determine dominant themes (Peterson, 2017). Our research focuses on conversational patterns in high-engagement post comment threads and interpreting how these patterns, or themes (defined further in Section 3.2 Qualitative and quantitative analyses of 16 post comment threads) inform our research questions, compared with recent qualitative or mixed methods investigations of USGS Volcanoes' 2018 social media hazard communications (Goldman et al., 2023; Stovall et al., 2023). Further, we used keyword tallies and sentiment analyses to complement our qualitative thematic analysis by providing numerical metrics that can be compared across the duration of the 2018 eruption and with similar studies of science communication on Facebook (Hagley, 2021; Lien and Wu, 2021; Graham et al., 2023).
3.1 Data collection
In October 2018, we downloaded bulk data for the @USGSVolcanoes account from April 7–October 1, 2018, using the Facebook analytics interface. This included numerical data for the @USGSVolcanoes account page (page likes, follows, and user location–city, state, country only) and its posts (individual post likes and shares, unique user views (reach), and comment counts). We ranked each post's impact (popularity) by tallying reach, which increases as posts are liked and shared through the social network. We identified 16 posts that reached over 100,000 users, contained threads with over 100 comments, and were posted between May 4th and August 30th, 2018 (Table 1), spanning the beginning of Kīlauea eruption events through the end of significant activity at both the summit and lower East Rift Zone (Neal et al., 2019). We used the public-view Facebook interface to capture portable document format (pdf) files of the post comment threads (Figure 2) and imported them into NVivo (for Mac, Version 1.6.2; Bazeley and Jackson, 2013) to conduct both the interpretative thematic and quantitative analyses.
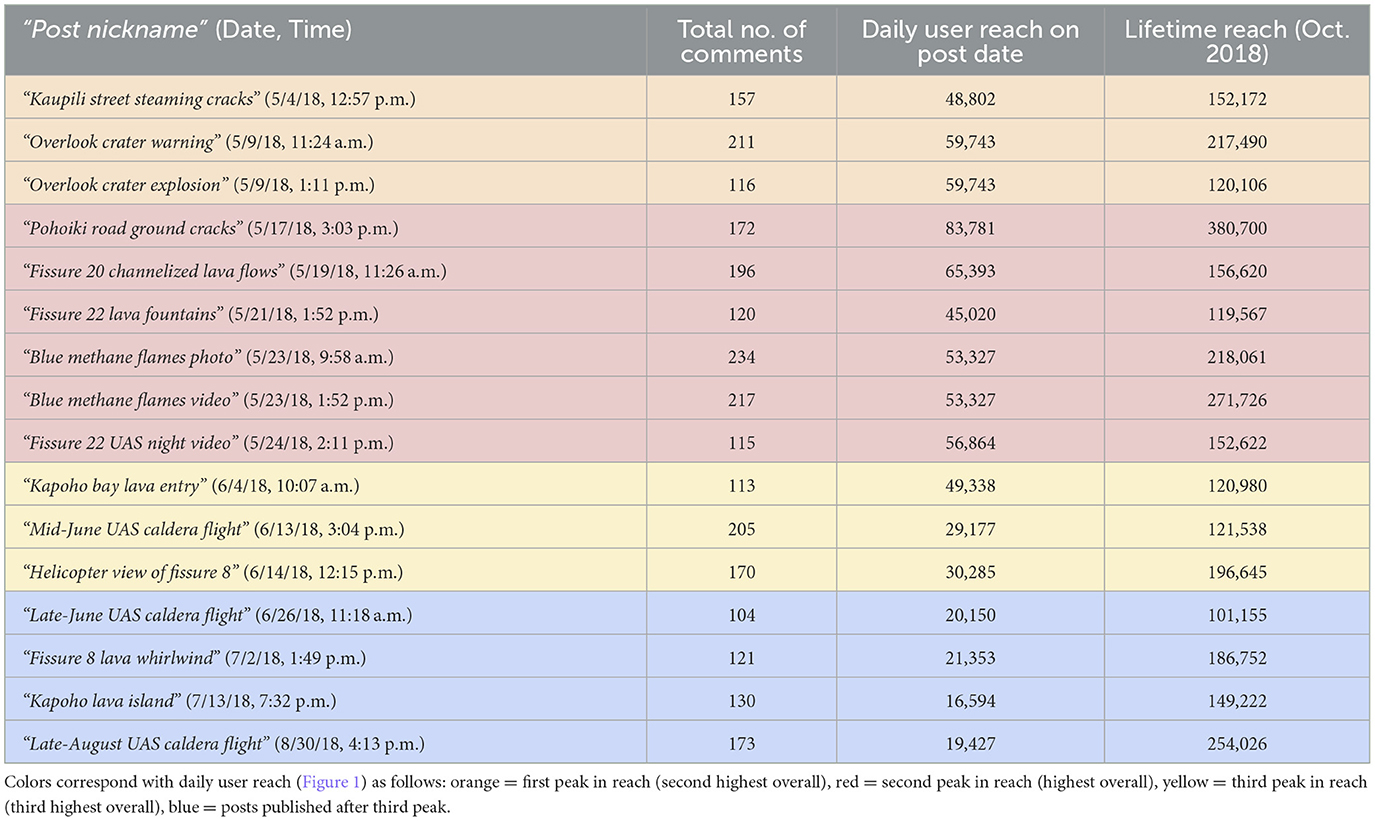
Table 1. List and metrics (through Oct. 2018) of qualitatively analyzed USGS Volcanoes Facebook posts.
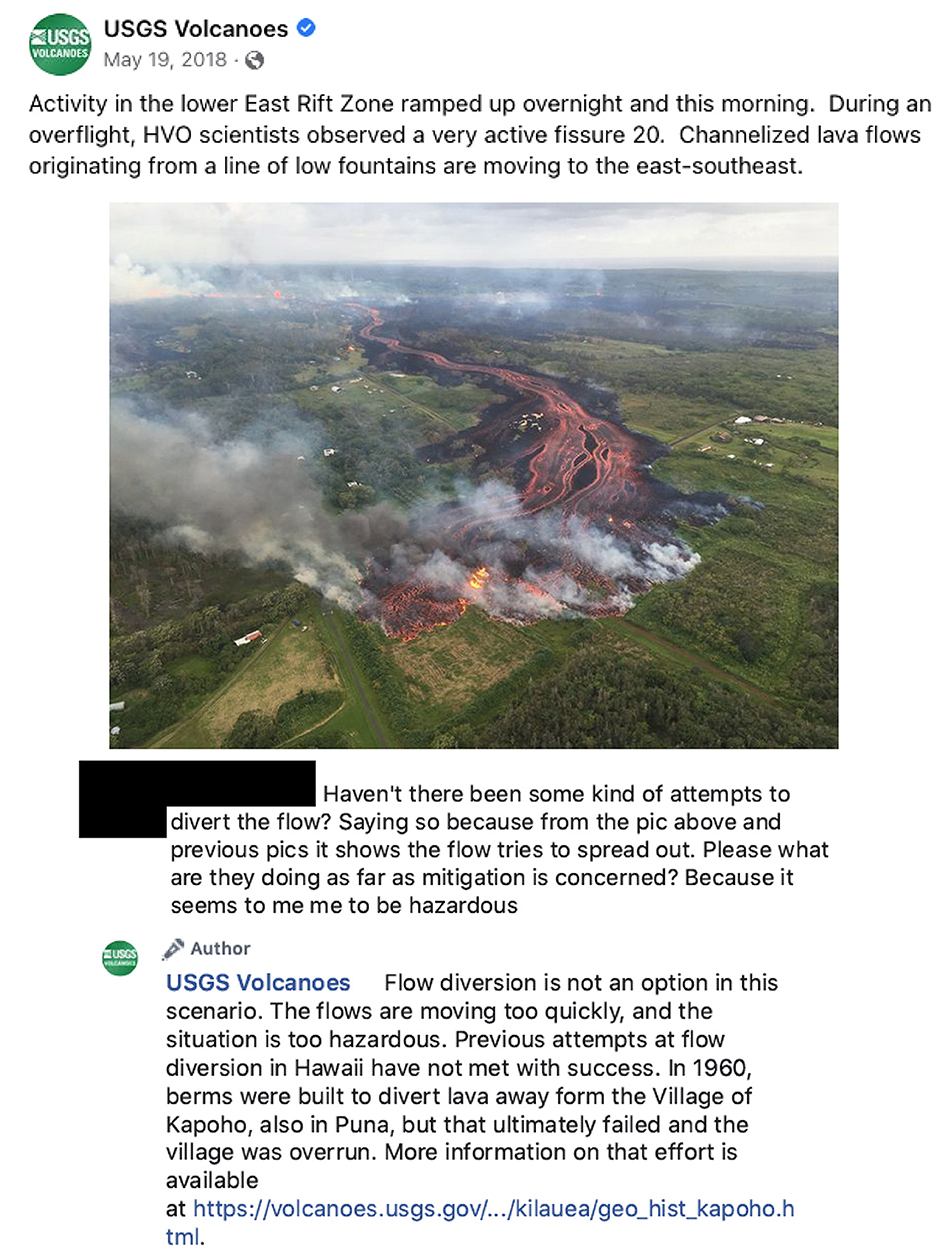
Figure 2. Example of a USGS Volcanoes Facebook post and underlying post comment thread regarding Kīlauea Volcano's 2018 eruption. User names and profile pictures have been omitted for privacy.
In June 2020, we extracted nearly 22,000 comments from Facebook's API that had been published on the USGS Volcanoes Facebook page between April 7 and October 1, 2018. This date range was chosen to include posts from roughly 1 month before the start of the eruption on May 3rd and 1 month after the last lava activity was observed on September 5th. We applied themes identified from our interpretative thematic analysis to quantitative analyses of rumors and user sentiment within the API comment dataset (henceforth “bulk comment dataset”) to triangulate the data, as described in Fielding (2012). Triangulation allows for corroboration of the data, as well as identification of weaknesses or gaps within the analysis (Thurston et al., 2008).
3.2 Qualitative and quantitative analyses of 16 post comment threads
For our qualitative thematic analysis, we assigned labels, or “codes” (Miles and Huberman, 1994), to roughly 2,500 comments within the post comment threads of the 16 Facebook posts listed in Table 1. We used NVivo, a software package that is widely used for qualitative thematic analysis, to manually read, annotate, and classify (i.e., code) these comments over five distinct rounds, a process that provided us with a deeper understanding of prevalent themes within the text (Daymon and Holloway, 2010; McBride et al., 2020). While the terms, “theme” and “code,” are often used interchangeably in qualitative studies (Miles and Huberman, 1994), we use “parent theme” for this study's top-level codes while using the term, “child code,” to describe any of the codes embedded within each parent theme. A primary child code is a first-generation child code, located directly beneath its parent theme (Miles and Huberman, 1994). Likewise, a second-generation, or “grandchild” code, is referred to as a secondary child code, and so on. We summarize each parent theme below, while providing our codebook, or the complete list and definitions of all codes identified in this study, in the Supplementary material.
We identified two parent themes: Eruption Sensemaking and Expressed Sentiments. The theme Eruption Sensemaking contains questions asked by users regarding eruption events, as well as questions or statements alluding to misinformation or rumors. The name of this theme reflects that the comments we coded document users attempting to make sense of the highly uncertain nature of the 2018 Kīlauea eruption (Weick et al., 2005; Starbird et al., 2016). The theme Expressed Sentiments contains comments in which users expressed positive, negative, and more nuanced emotions or sentiments (e.g., Liu, 2012) in response to eruption events or comments posted by other users.
Eruption Sensemaking is divided into two primary child codes: “Eruption Q & A,” which contains users' questions and responses (including answers from USGS Volcanoes), and “Misinformation & Response,” which includes comments with misinformation and users' responses to them (including from USGS Volcanoes), as well as the topics of each misinformative or rumoring comment. Comments that were either factually incorrect or inconsistent with information published by the USGS are coded as misinformation. We subdivide comments containing users' questions or misinformative statements into secondary child codes identifying whether these comments received direct responses, either from USGS Volcanoes or other users. We also further subdivide questions or misinformative comments that were not directly answered into “more relevant” and “less relevant” categories, with the latter including the most redundant, off-topic, or otherwise less appropriate comments for USGS Volcanoes or other users to respond to. These categories are further defined in the Results section. Topics coded under “Misinformation & Response” include: “Slump, Tsunami, or Catastrophic Eruption;” “PGV, Gases, Climate, or Weather;” and “Volcano or Tectonic Misinformation” (PGV refers to Puna Geothermal Venture, the geothermal energy power plant operating in the lower East Rift Zone). These three categories encompass major rumors or other forms of misinformation posted by users during the 2018 eruption, which are described in detail in Section 4.1 Eruption sensemaking: overview.
Primary child codes of Expressed Sentiments include: “Negative Sentiments Regarding,” “Positive or Light-Hearted Sentiments Regarding,” and “Mixed, Somber, or Sympathetic Sentiments Regarding.” Comments coded within “Mixed, Somber, or Sympathetic Sentiments Regarding” contain a combination of comments in which users expressed multiple conflicting emotions, accepted negative events or outcomes, expressed interest for the wellbeing of people on the Island of Hawai‘i, and defended the integrity or reputation of themselves or other people, entities, cultures, places, or customs. Each of these codes is subdivided based on the recipients of those sentiments: “Eruption or USGS Volcanoes Content” and “People, Entities, Places, or Customs.” The code “People, Entities, Places, or Customs” is further subdivided into “USGS Volcanoes, Scientists, or HVO” and “Non-USGS People, Entities, Places, or Customs.”
Following our qualitative analyses, we tallied the number of comments contained within several child codes to (1) quantify the responsiveness of USGS Volcanoes and its community of informed users to comments containing questions or misinformation and (2) quantify users' expressions of positive, negative, and mixed sentiments. Obtaining these frequency counts facilitated our determination of prevailing themes and sentiments within the post comment threads (Hennink and Kaiser, 2022). These tallies also provide a basis for comparison between our qualitative thematic analysis of the 16 post comment threads and quantitative analyses of the bulk comment dataset.
3.3 Quantitative analyses of bulk comment dataset
Our analyses of the bulk comment dataset included two components. First, we quantified and tracked the frequency of two categories of comments: those containing the most common rumor words, and comments containing the most common expressions of appreciation. We then conducted an automated sentiment analysis using the Valence Aware Dictionary for sEntiment Reasoning (VADER), as described in Hutto and Gilbert (2014). This open-source Python package uses a rule-based, human-tested sentiment model to identify and quantify both the polarity (i.e., positive or negative) and intensity (i.e., high or low) of sentiments expressed on social media (Hutto and Gilbert, 2014). We compared these results with the frequencies of our text searches to test for correlations between users' overall sentiments and (1) the occurrence of common rumors or (2) the prevalence of gratitude words in users' comments.
We chose VADER as our primary quantitative analysis package because its scores are tailored to social media communication, verified by multiple human evaluators, and found to perform more accurately than programs that are either more computationally intensive or closed source (Hutto and Gilbert, 2014). The sentiment analysis program VADER calculates four score types: positive, negative, neutral, and compound (Hutto and Gilbert, 2014). The compound score is the most comprehensive of the four, calculated from the three other scores while incorporating additional syntactic and semantic rules. Thus, we focused our sentiment analysis on the compound scores calculated for each comment in our bulk dataset. We binned these scores by comment publication date, focusing on the date range of May 1 through August 31, 2018, to avoid artifacts from the relatively low comment counts outside those dates, and calculated the average score for each binned day. The compound score ranges from −1.0 for text containing only negative sentiments to +1.0 for text containing only positive sentiments. A compound score of 0 indicates an overall neutral sentiment, though without differentiating between purely neutral sentiment and the existence of perfectly balanced negative and positive sentiments (Hutto and Gilbert, 2014).
We estimated the frequency of comments related to rumors and misinformation about the Hilina Slump, Yellowstone volcano, or an impending catastrophic eruption on Hawai‘i by quantifying the occurrence of the words “hilina,” “slump,” “south flank” (in reference to Kīlauea Volcano's southern slope, which lies above the Hilina Slump), “landslide,” “catastroph” (to include both “catastrophe” and “catastrophic”), or “Yellowstone.” The word “tsunami,” while frequently associated with rumors about the Hilina Slump or a catastrophic eruption on Hawai‘i, was excluded as a search term since it was often included in users' non-rumoring questions or comments about hazards posed by earthquakes during the 2018 eruption. Likewise, we estimated the frequency of conversations related to rumors related to geothermal energy production in the lower East Rift Zone by quantifying the appearance of the words “pgv,” “methane,” “sulfur,” “sulphur,” “geothermal,” “wells,” or “blue flame.” These keywords capture (1) the unfounded assertion that the 2018 eruption was caused by geothermal utility operations in the lower East Rift Zone (explored in detail in Kauahikaua and Trusdell, 2020) or (2) that the blue flames observed in the lower East Rift Zone in late May 2018 were caused by sulfur gas, derived specifically from the utility, rather than methane produced from lava flows heating vegetation.1 We note, however, that by quantifying frequencies of the above keywords, we include non-rumoring comments regarding these and all other topics included in our common 2018 eruption rumors. Thus, our keyword-based quantitative analyses of the bulk comment dataset only identify periods of time during the 2018 eruption when the appearance of the most common rumor topics was highest.
To estimate Facebook users' appreciation of eruption-related communications, we quantified the occurrence of comments with the words “thank” or “mahalo” (the Hawaiian word for “thank”), as well as comments containing both the words “USGS” and either “thank” or “mahalo,” to differentiate gratitude expressed toward USGS Volcanoes' and other users. Results of each text query were plotted as a function of date to provide a broad picture of patterns in Facebook users' comments.
4 Results
We organize the results of our qualitative thematic analysis by the two parent themes that arose from our analysis—Eruption Sensemaking and Expressed Sentiments. For each theme, we first quantify the frequency of child codes that most directly address one or more of our research questions and then provide example conversation threads that address these questions in greater detail. We then plot the frequency of rumor words quantified from the bulk comment dataset and test the correlation between these frequencies and the daily average compound sentiment score calculated with VADER. Finally, we plot the frequency of gratitude-based words from the bulk dataset and test the correlation between them and the daily average compound sentiment score.
4.1 Eruption sensemaking: overview
USGS Volcanoes and informed users provided direct, accurate answers to 73% of questions posed by other users. Of these answers, USGS Volcanoes provided 72% and non-USGS users provided 28% (Figure 3). Meanwhile, USGS Volcanoes and informed users directly corrected or called out 54% of all comments containing misinformation or rumors, with USGS Volcanoes providing 57% of these responses (Figure 3). When excluding comments coded as “less relevant,” the percentage of comments with misinformation or rumors that were directly corrected or called out increases to 74%, comparable to the percentage of questions directly answered. All 16 of the post comment threads we analyzed contain questions and responses (Figure 4), while 14 of these posts also contain comments related to misinformation (Figure 5). Among the comment threads we analyzed, USGS Volcanoes always provided corrections in their responses to misinformative comments, with or without calling it out (Figures 3, Supplementary Figure 1). Non-USGS users provided corrections in most cases but sometimes called out misinformation without correcting it (Figures 3, Supplementary Figure 1).
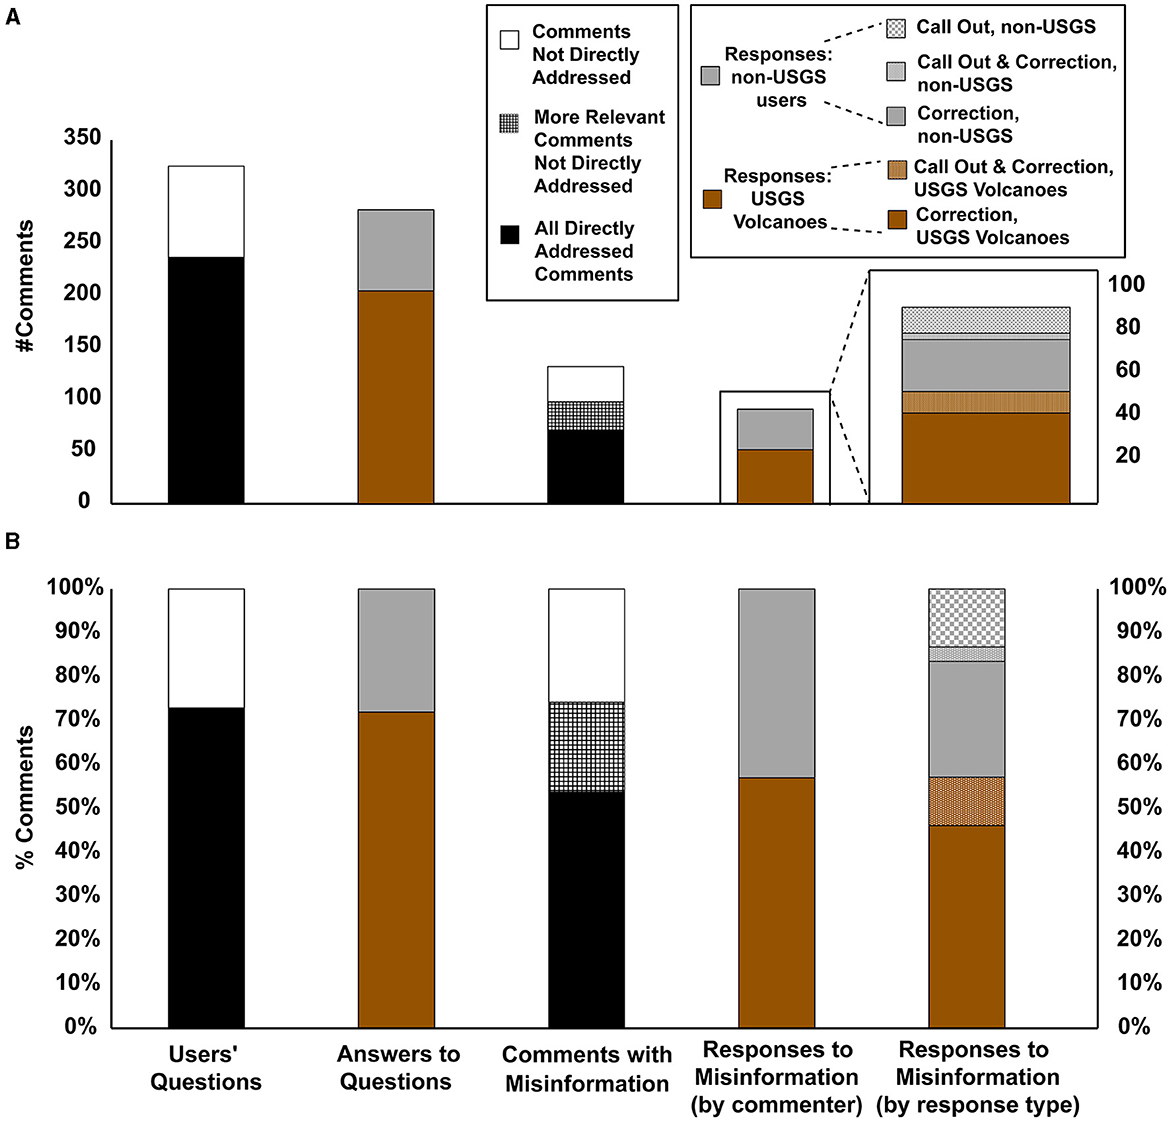
Figure 3. Quantitative overview of comments coded to theme “Eruption Sensemaking.” (A) Comparing the number of comments coded as Users' Questions, Answers to Questions, Comments with Misinformation, and Responses to Misinformation. Fifth column is a zoomed-in inset of the fourth column for the purpose of illustrating response methods as indicated in the legend. (B) Plotting bar graphs from (A) in terms of percentages.
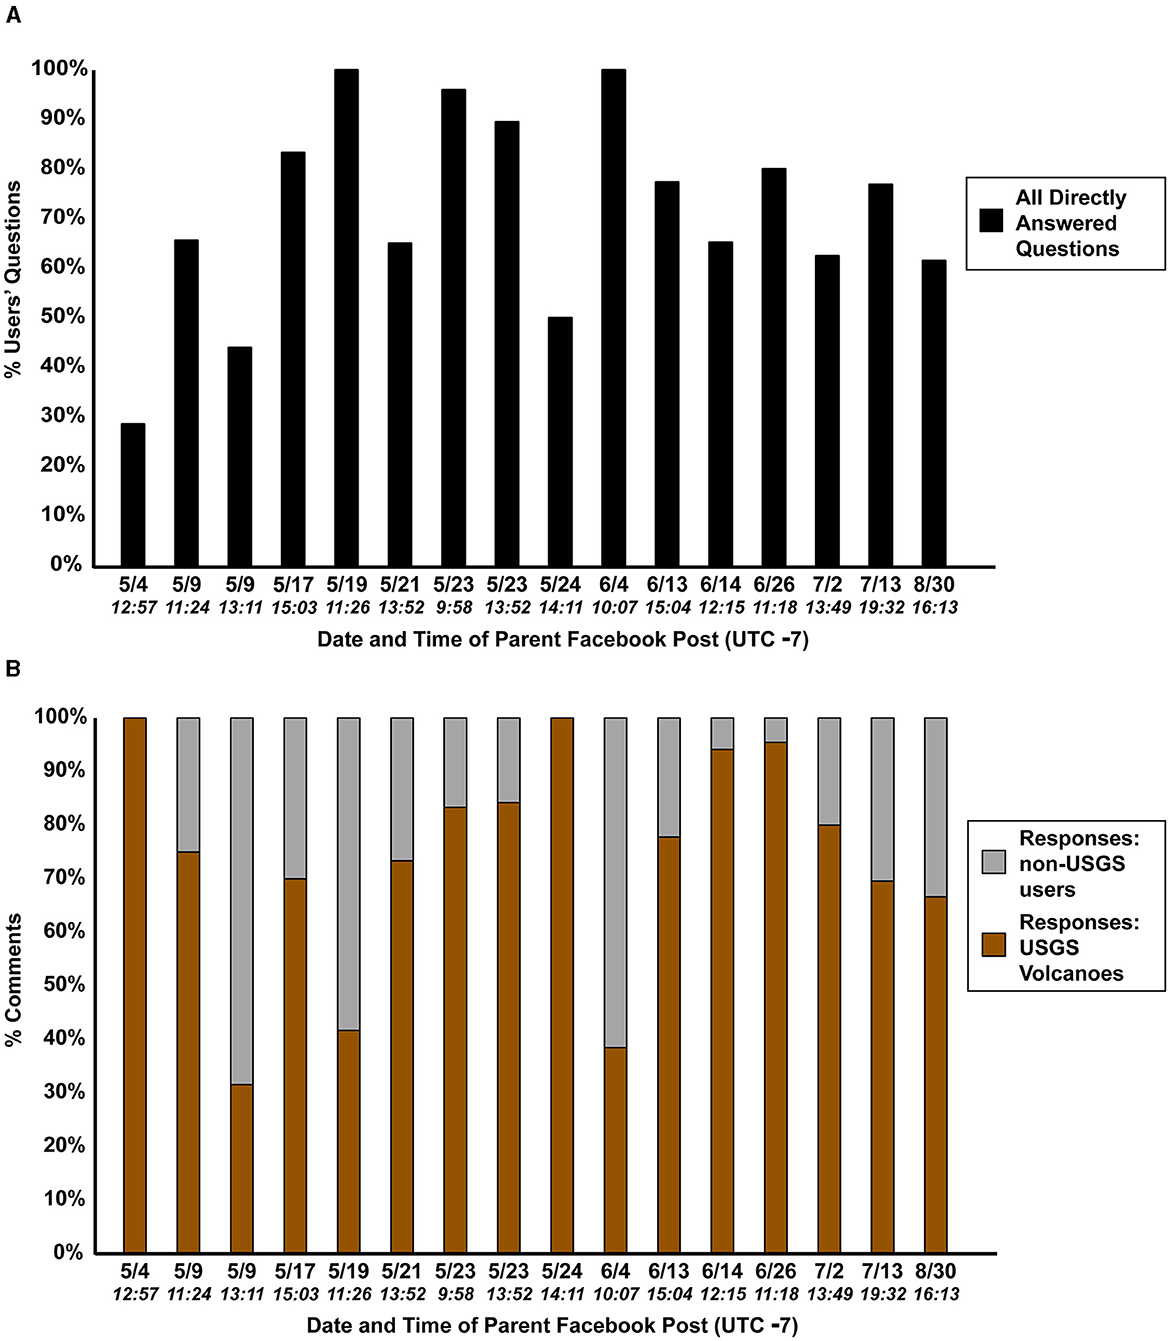
Figure 4. Plots of (A) Facebook users' directly answered questions and (B) direct responses to users' questions, organized by post comment thread and shaded by responding user (non-USGS or USGS Volcanoes). Each thread is indicated by the date and time the original post was published.
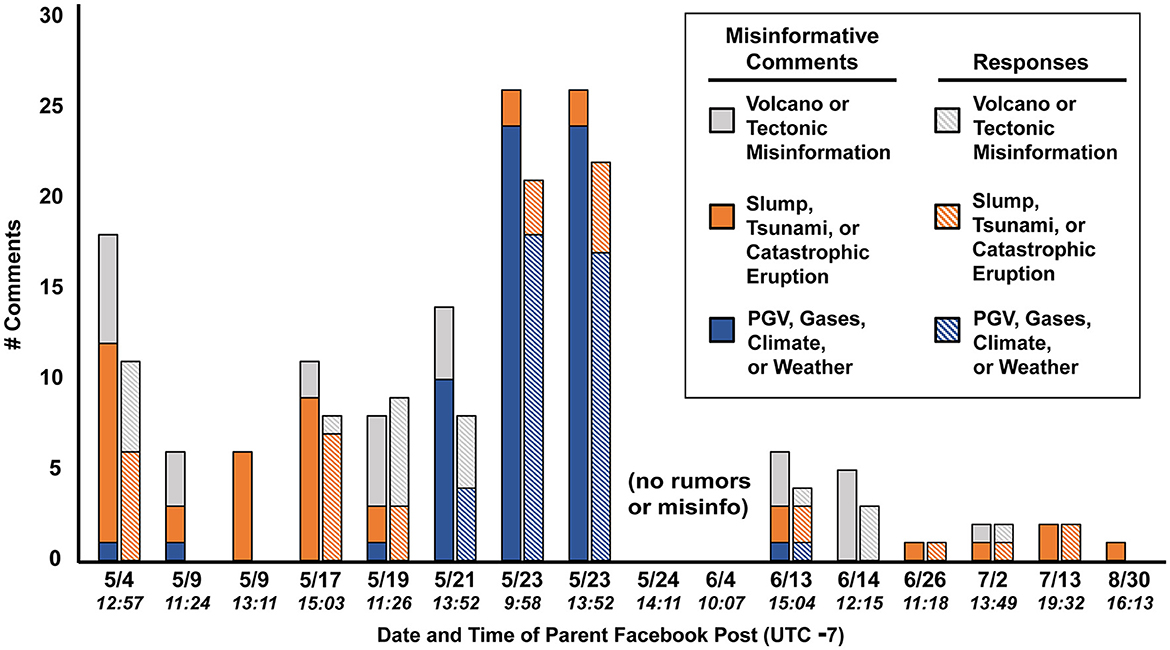
Figure 5. Plot comparing the frequencies of each category of misinformation across the 16 qualitatively analyzed post comment threads, labeled by the date and time each post was published. Each post contains a pair of bar charts: the left-hand chart (solid fill) quantifies comments containing an original question or statement related to misinformation, while the right-hand chart (faded/checkered fill) quantifies comments directly calling out or correcting misinformative comments, organized by misinformation topic. Posts labeled “no rumors or misinfo” had no comments containing misinformation or rumors.
There were several rumors or topics of misinformation that repeatedly appeared in USGS Volcanoes' post comment threads during Kīlauea's 2018 eruption and correspond with several of the secondary child codes classified under “Misinformation & Response.” One such rumor was that the Hilina Slump, the surface expression of an underground fault beneath the southern edge of the Island of Hawai‘i (Lin and Okubo, 2020), was about to experience a catastrophic, tsunami-generating landslide due to the eruption of Kīlauea Volcano. This rumor appears to have originated from a blog article published in early May that stated such a collapse was possible for Kīlauea Volcano, though the article's concluding sentence clarifies that such an event was unlikely to happen in the near future.2 A second common rumor was that Kīlauea's eruption was linked to volcanic activity in Yellowstone National Park, whose caldera system is a frequent source of exaggerated concern regarding its potential to experience a super-eruption.3 A third common rumor was that a catastrophic eruption was imminent from Kīlauea Volcano and would impact the entire Island of Hawai‘i. These rumors are grouped into the secondary child code “Slump, Tsunami, or Catastrophic Eruption.” A fourth recurring rumor was that the 2018 eruption was triggered by geothermal energy production in the lower East Rift Zone. There is no evidence to support any human influence on eruptions of Kīlauea Volcano (Kauahikaua and Trusdell, 2020), and the assertion that utility operations were the cause of the eruption may reflect longstanding debates about geothermal energy production in Hawai‘i, which stem from a combination of cultural objections and health concerns.4 This rumor was often accompanied by a separate rumor that blue flames observed in the lower East Rift Zone (see Table 1) were caused by sulfur dioxide emitted from Kīlauea Volcano or that the gas responsible for the blue flames was produced by the utility rather than methane produced from the heating of vegetation by lava flows. Several users made comments that gases emitted from Kīlauea's 2018 eruption–including the methane gas responsible for the blue flames–would contribute to global climate change or affect the island's long-term weather patterns. Given that all the rumors described in this paragraph have at least a loose association with the appearance of blue methane flames, we assign comments containing one or more of these rumors to the secondary child code “PGV, Gases, Climate, or Weather.”
Finally, users posted comments containing misconceptions about other volcanic or tectonic processes that we include in our qualitative analysis (described below) solely for the purpose of distinguishing these factually incorrect comments from the aforementioned rumors, without analyzing their contents in depth. We assign all such comments to the secondary child code “Volcano or Tectonic Misinformation.”
4.1.1 Eruption sensemaking: questions & answers (coded as “Eruption Q & A”)
The proportion of directly answered questions varied across individual posts, with less than half of users' questions receiving direct answers in two out of three of the earliest posts we analyzed (Figure 4A). From mid-May through the end of August 2018, however, more than half of users' questions were directly answered. This may be attributable to the USGS Volcanoes social media team adding a staff member and developing specific staffing schedules, which allowed them to monitor posts more consistently for comments (Stovall et al., 2023). The proportion of questions directly answered remained consistently high after the May 9 posts (Figure 4A), even for those in which USGS Volcanoes provided relatively few direct answers to users' questions (Figure 4B). This demonstrates the role that informed users played in complementing USGS Volcanoes' effort to provide publics with accurate eruption information.
The complementary role observed between USGS Volcanoes and informed users is well-demonstrated in the following conversation thread from the post “Overlook crater warning” (Table 1), published on May 9:
“Dumb question, but why isn't, or how is, the water interacting with the heat *before* [sic] the water table drops? Where/how is the steam pressure being relieved in the far-left image?” (new top-level comment by User A, posted within “Overlook crater warning”).
After two other users posted direct and educated, but not entirely correct, replies, USGS Volcanoes posted the following answer, referring to the diagram included in their original post:
“In the first image, the area immediately around the conduit is basically boiled dry by the heat coming off the magma (like a pot that's been left on the stove for too long). When magma withdraws from the conduit, the rocks around it cool down and water can move into area [sic] around the top of the conduit” (USGS Volcanoes, in response to User A).
Although User A did not post a reply to USGS Volcanoes' answer, three other users expressed their appreciation, one to USGS Volcanoes for their answer, another to both USGS Volcanoes and the two users who had provided educated responses, and a third to the person who posted the original question for asking it in the first place. Another user, who self-identified as a geologist, began their comment by stating that they too had “wondered the same thing,” and thus the original comment was “not a dumb question at all,” before adding, “thank you to our USGS team for answering, and for doing the best job keeping us informed.” This conversation thread concluded with two additional users asking their own follow-up questions about water evaporation, both of which USGS Volcanoes directly answered, and one of these users posted “thank you” in response.
We employed context cues to determine that the original user was self-deprecating despite asking a good question. We also note that two users pitched in to provide the best answers they could, demonstrating how the social media thread promoted community participation and collaboration for sensemaking. USGS Volcanoes then provided a detailed explanation that made use of both the diagram in their post and an everyday analogy for users' ease of understanding (de Groot, 2009; Jee et al., 2010). Other users expressed their appreciation of the post that USGS Volcanoes made, illustrating its usefulness to the broader audience of the post comment thread. One geologist outside of the USGS Volcanoes group even affirmed the legitimacy of the original question and gave praise to USGS Volcanoes. Moreover, USGS Volcanoes continued to answer users' questions posted within the same reply thread, illustrating their attentiveness.
Our qualitative thematic analysis also investigated potential explanations for the absence of direct answers to some users' questions (88 total). We coded all questions lacking direct responses into several non-mutually exclusive categories (Supplementary material: Codebook). The most common category of questions not directly answered was those already answered elsewhere in the same or a previous post (20 comments). Because the 16 post comment threads we analyzed were the most popular and had high comment counts, the USGS Volcanoes staff prioritized answering new or potentially controversial questions (Stovall et al., 2023). When dealing with high volumes of comments, several other categories of questions fell to a lower priority for USGS Volcanoes to address, including questions containing a request, recommendation, or offer to help USGS Volcanoes (14 comments), lengthy or unusually specific questions (9 comments), vague or tangential questions (9 comments), or a follow-up to a directly answered question (7 comments).
In contrast to the above, we consider one category of unanswered questions to have been important enough for USGS Volcanoes to have answered directly: those that were like questions USGS Volcanoes did answer directly (13 comments). With high comment volume, USGS Volcanoes staff occasionally missed some questions rather than intentionally passed them over. This is true for unanswered questions containing misinformation (19 comments), unless such questions involved controversial topics that USGS Volcanoes could not directly address because they were outside the USGS area of expertise (e.g., utility operations or risk associated with homes built in lava-flow hazard zones; Stovall et al., 2023).
We identify two key findings from comments coded to “Eruption Q & A.” First, both USGS Volcanoes and informed users were responsive to most questions raised by other users, answering at least half of these questions in 14 of the 16 post comment threads we analyzed (Figure 4A). Second, USGS Volcanoes often used analogies to explain eruption phenomena that used illustrations and relatable examples to facilitate users' comprehension of new concepts (de Groot, 2009; Jee et al., 2010).
4.1.2 Eruption sensemaking: misinformation & response (quantitative results)
Although nearly half of all the misinformation-related comments we analyzed were related to “PGV, Gases, Climate, or Weather,” this category only forms the majority of misinformation-related comments in three of the 14 comment post threads containing them (Figure 5). By contrast, while comments concerning the certainty of a Hilina Slump collapse, tsunamis, or a catastrophic eruption (related to Yellowstone volcano or Hawai‘i) were the least common category of rumors, they comprise a majority of misinformation-related comments in six of the 14 posts (Figure 5). These results indicate that rumor frequency depended on the content of specific posts or post comment threads.
In looking across the 16 most popular posts, 71 misinformation-related questions or statements received direct responses (either corrections or call-outs), and 61 were not directly addressed. The three most common categories for the 61 misinformation-related comments that were not directly addressed include:
• Questions or statements concerning a contentious topic, such as the existence of residential areas on an active volcano or concerns regarding the power utility facility (23 total questions and comments).
• Questions or statements contained within a long thread of replies (17 total).
• Questions or statements answered or corrected elsewhere in the same or previous post (16 total).
The relatively high frequency of not-directly-addressed comments concerning contentious topics reflects USGS Volcanoes' commitment to remaining in their “communication lane” of expertise (Stovall et al., 2023). Additionally, by not engaging, USGS Volcanoes likely prevented conversations that might escalate users' feelings of frustration or distrust. Misinformation-related comments contained within a long reply thread may have been accidentally missed by USGS Volcanoes or informed non-USGS users. In contrast, questions or comments whose misinformation was addressed elsewhere in the same or previous post were deemed redundant (and therefore low priority) by USGS Volcanoes or other informed users and therefore left unanswered.
Other types of misinformation-related comments without direct responses include:
• Top-level questions (13 total),
• Top-level statements (11 total),
• Trolling, rumor-milling, or conspiracy-promoting comments or questions (11 total),
• Inside a short reply thread (10 total),
• Tagging a non-USGS user (10 total),
• Tagging USGS Volcanoes (excluding questions/comments coded as trolling; 5 total).
We consider top-level comments, as well as comments contained within a short reply thread or comments tagging USGS Volcanoes directly, to have been more easily visible to USGS Volcanoes staff than questions contained within long reply threads or comments that did not tag USGS Volcanoes. Thus, it seems less likely that USGS Volcanoes accidentally missed these comments. We provide several possible alternative reasons why these comments were missed:
• They were posted hours-to-days after the original post, which may have been too difficult for USGS Volcanoes or other informed users to locate the missed comments in the wake of more recent or pressing questions.
• They were answered in one or more USGS Volcanoes posts, including FAQs, that were not qualitatively analyzed in this study.
• They were posted when USGS Volcanoes staff were unavailable or had to address higher-priority communications (Stovall et al., 2023).
All but one of the misinformation-related comments that tagged non-USGS users confidently asserted the misinformed statement and did not ask those users to verify or refute it. Thus, it may not have been apparent to the tagged non-USGS users that they were being provided with misinformative commentary, and USGS Volcanoes may have missed these comments since they were part of a conversation explicitly directed at another user. By contrast, we consider that trolling, rumor-milling (as defined by Starbird et al., 2016), or conspiracy-promoting comments or questions were intentionally ignored by USGS Volcanoes and informed users to avoid counterproductive arguments.
Given the above considerations, we code the following categories of misinformation-related comments without direct responses as being “less relevant” for USGS Volcanoes or other users to respond to, which correspond with the unfilled white segments of the third column of bar charts in Figures 3A, B:
• Questions or statements concerning a contentious topic (1st most common category).
• Questions or statements answered or corrected elsewhere in the same or previous post (3rd most common).
• Trolling, rumor-milling or conspiracy-promoting comments or questions (5th most common).
• Tagging a non-USGS user (7th most common).
Accordingly, the remaining misinformation-related comment categories were coded as “more relevant,” and correspond with the hatch-filled bars in Figures 3, Supplementary Figure 1A:
• Questions or statements contained within a long thread of replies (2nd most common).
• Top-level questions (4th most common).
• Top-level statements (5th most common, tied with “Trolling, rumor-milling,…” etc.).
• Inside a short reply thread (7th most common, tied with “Tagging a non-USGS user”).
• Tagging USGS Volcanoes (8th and least common).
The proportion of misinformation-related comments that were directly corrected or called out varied across individual posts without a clear temporal pattern (Supplementary Figure 1). However, all comments that we coded as “more relevant” for USGS Volcanoes and other users to respond to only occurred in the first half of the 16 post comment threads we analyzed, as indicated by the presence of hatch-filled bars in threads dated through May 23rd but not afterward (Supplementary Figure 1A).
4.1.3 Eruption sensemaking: misinformation & response (qualitative examples)
Below we provide an example of a conversation thread in which a commonly occurring rumor or topic of misinformation was directly addressed or refuted. This conversation is about the Hilina Slump, a common rumor topic particularly early in the eruption (Figure 5) in which the user (User C) asks questions related to a rumor but without a clear intent to deceive:
“Has the hilina slump been affected by the recent activity? I've heard scattered reports of a major movement along the slip” (new top-level comment by User C, “Pohoiki Road Ground Cracks”).
“There was motion along the slump during the May 4 M6.9 earthquake, but that is expected. Otherwise, the slump's behavior is normal. There is some misinformation out there about an imminent catastrophic landslide, but this is not accurate. We posted some information in the “HVO News” section of the HVO website, just under the map, that explains what is happening with the Hilina slump” (response by USGS Volcanoes, who also included a URL to HVO's website).
“USGS Volcanoes thank you!! Is there a risk percentage of the slump collapse? A lot of people are worried and it would help to have some solid numbers” (User C, responding to and directly tagging USGS Volcanoes).
These comments were followed by a question from a second user (“User D”) asking similar questions, but in a lengthy post that we interpret as the result of User D experiencing a high degree of anxiety. USGS Volcanoes responded to both Users C and D by providing well-established geologic evidence against a catastrophic landslide occurring. User D then posted two more comments of similar length and expressed similarly heightened anxiety to the first, with USGS Volcanoes providing direct responses each time. In their final response, USGS Volcanoes tagged User D and replied:
“We can certainly understand your concern, given the rumors that are swirling on line. Hopefully we addressed many of your points in the News item on HVO's home page (see the link in our initial reply). It is important to remember that this is not the first time a magmatic intrusion has been active this far down the East Rift Zone. It's relatively common, happening every few decades, but as this is the first time since 1960 it may seem like a unique event” (USGS Volcanoes).
In the same comment as above, USGS Volcanoes also explained that there is no evidence in instrumental monitoring data, including GNSS or volcano deformation data, “that any sort of failure” of the integrity of Kīlauea's southeastern slope “is imminent,” adding that “there is no evidence in the geologic record that such a collapse has ever happened in the past (and Kīlauea has been erupting above water for about 100,000 years!).”
This was followed by replies from both Users D and C:
“USGS Volcanoes Mahalo for taking the time to answer my questions” (User D).
“USGS Volcanoes thank you!!” (User C).
In this conversation thread, USGS Volcanoes directly addressed each user's concern through detailed and factual responses and also demonstrated empathy for User D's concerns. We interpret the final replies of both Users C and D, which convey sincerely articulated (User D) or enthusiastic (User C) appreciation, as evidence of the efficacy of USGS Volcanoes' factual, responsive, and empathic communication strategy.
The above conversation contrasts with instances whereby a user appears to intend to misinform or introduce a rumor. One prominent instance of this is a user (User B) introducing a rumor connecting Kīlauea's eruption to Yellowstone National Park's geyser activity. Following a direct response by USGS Volcanoes in an effort debunk this rumor, User B engages in rumor-milling behavior (as defined by Starbird et al., 2016), making use of ellipses, word capitalization, and framing a rumor-related suggestion as a question. This resulted in several contentious exchanges between User B and other users calling out User B and their misinformative posts. User B exhibited behavior in these exchanges that insulted and provoked the other users. USGS Volcanoes did not provide additional replies to either User B or anyone else commenting in this thread. USGS Volcanoes provided a direct, succinct, factual reply that addresses the fallacy in User B's comment, while choosing not to engage them any further once the user demonstrated their intent to continue disseminating disinformation, which we define as factually incorrect information intended to deceive (following Starbird et al., 2016). However, several other users chose to call out User B's disinformation. This response demonstrates a strategy adopted by USGS Volcanoes to allow their page's “community of informed followers” to self-police the content of the page's comment threads (Stovall et al., 2023). This parallels a similar phenomenon during social media conversations concerning Australia's 2010-11 Queensland and Victorian floods in which both moderators and users of flood-related Facebook pages promptly corrected false rumors (Bird et al., 2012; Alexander, 2014).
Additionally, not all rumor-related conversations end with a satisfactory resolution. This is exemplified in the post “Fissure 22 Lava Fountains,” whereby a user (User E) asks about the status of the geothermal energy power plant, summarizing the legitimate questions that several Hawai‘i residents, including User E, had about the risks associated with lava inundation at this utility (Stovall et al., 2023). Despite USGS Volcanoes attempting to direct User E to the appropriate messenger—Hawai‘i County Civil Defense—this user pressed USGS Volcanoes for an answer they could not accurately or honestly provide without stepping out of their communication lane (Stovall et al., 2023). The exchange ended with a comment by User E that we interpret as expressing exasperation, particularly evidenced by their selective use of all capital letters. This is reminiscent of the frustration expressed by a lower East Rift Zone resident interviewed by Goldman et al. (2023) that HVO “didn't know what was going to happen” regarding the specific timing, location, and severity of eruption hazards early in the crisis. Thus, we postulate that User E's comments were motivated, at least in part, by uncertainty (Starbird et al., 2016) regarding the future evolution of lower East Rift Zone eruption hazards and the potential for any issues of concern regarding the utility. To note, there were extensive efforts to understand and reduce risk at the utility's site during the eruption, including a supplemental emergency proclamation issued by Gov. David Ige in early May.
To summarize, comments coded to “Misinformation and Response” illustrate several key findings. First, USGS Volcanoes corrected misinformation by providing concrete facts and addressing users respectfully and empathically. This approach is useful for building publics' trust in and willingness to listen to messengers of scientific information (McBride, 2018; Goldman et al., 2023). However, USGS Volcanoes was selective in which misinformative comments they directly addressed because some topics were outside their expertise. The fact that “questions or statements concerning a contentious topic” were the most frequent category of comments not directly addressed [Section Eruption sensemaking: misinformation & response (quantitative results)] provides further evidence supporting USGS Volcanoes' use of discretion when responding to misinformation. Additionally, informed users (cf. Stovall et al., 2023) provided their own corrections to users who posted misinformative or rumoring content (Figures 3, Supplementary Figure 1) and also complemented USGS Volcanoes' tactful, emotionally restrained responses by emphatically calling out and condemning the users posting misinformation. These instances demonstrate the beneficial synergy between responses by USGS Volcanoes and the community of informed users.
The occurrence of misinformation and rumor topics differed among the analyzed post comment threads, with comments related to “PGV, Gases, Climate, or Weather” being heavily concentrated in three mid- to late-May post comment threads, while comments containing all other misinformation topics were more evenly distributed among the analyzed post comment threads (Figure 5). This concentration of utility-related misinformation and rumors in mid- to late-May corresponded with lava encroachment on the utility facility's location and preparations for possible lava inundation (Stovall et al., 2023). Although the other major rumor topics identified (Hilina Slump, Yellowstone volcano, or a catastrophic eruption) did not correspond with a single eruptive phase of the 2018 eruption, at least two (Hilina Slump and Yellowstone volcano) can be traced to online publications from early May: an academic blog post describing the possibility of a landslide along the Hilina Slump (see Section Eruption sensemaking: overview) and an online article describing recent eruptions of a Yellowstone National Park geyser (referenced by User B in the first rumor dialogue examined in this section).
4.2 Expressed sentiments: overview
In this section, we first present quantitative results of comments coded to the theme Expressed Sentiments to understand the most common sentiments expressed by non-USGS users and how those sentiments reflect the overall success of USGS Volcanoes' Facebook communications in promoting or reinforcing trust among their users. We then describe the types of commentary represented by each expressed sentiment.
4.2.1 Expressed sentiments: quantitative results
For the 985 comments coded as containing sentiments expressed in response to the “Eruption or USGS Volcanoes Content” in the 16 qualitatively analyzed post comment threads, 99% were posted by non-USGS users and 1% by USGS Volcanoes (Figure 6A). For the 718 comments containing sentiments in responses to “People, Entities, Places, or Customs,” non-USGS users posted 95%, and 5% were posted by USGS Volcanoes (Figure 6B). Across both topic categories (i.e., the two primary child codes of Expressed Sentiments, as defined in the Methods and shown in Supplementary material: Codebook), non-USGS users' comments had a higher proportion of negative sentiments than comments by USGS Volcanoes, though most comments by both sets of users were positive (Figure 6). Non-USGS users' comments in the topic category “People, Entities, Places, or Customs” also contained a higher proportion of “mixed, somber, or sympathetic” (i.e., “mixed”) sentiments than comments by USGS Volcanoes (Figure 6).
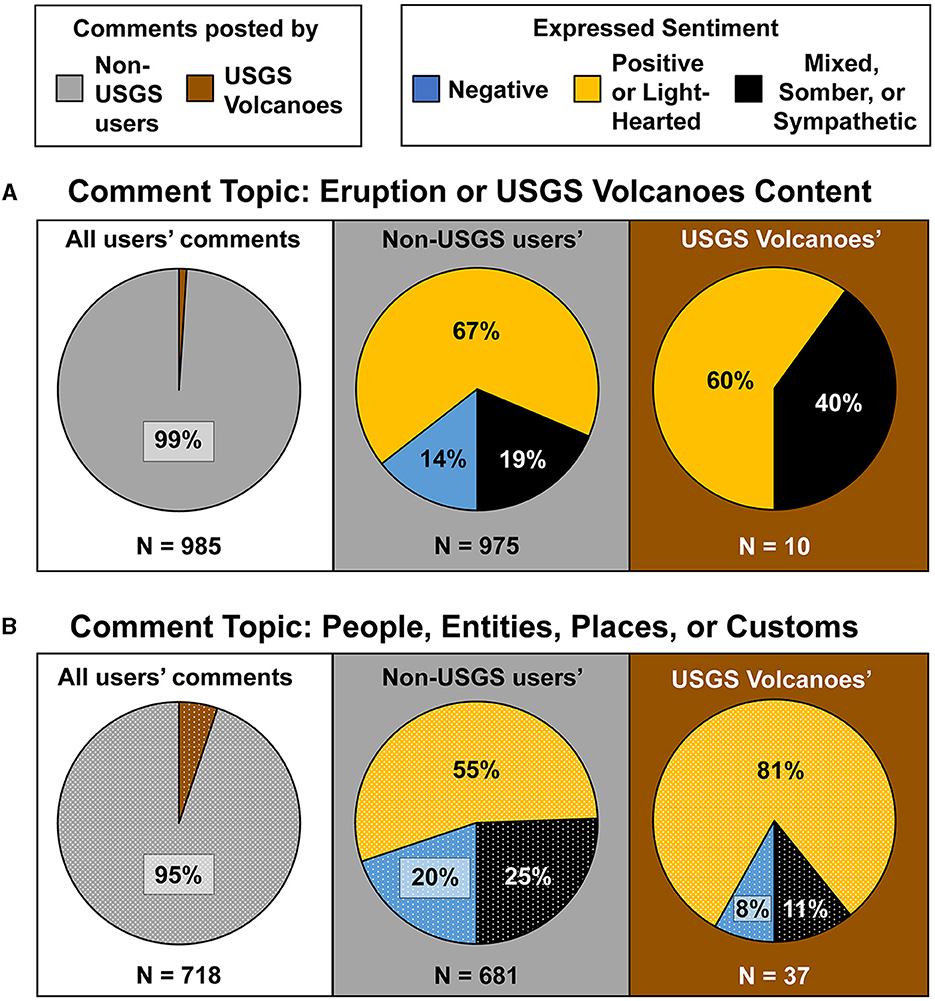
Figure 6. Plots comparing the frequencies of users' expressed sentiments regarding (A) Eruption or USGS Volcanoes Content, (B) People, Entities, Places, or Customs. First column compares proportion of non-USGS and USGS Volcanoes' comments, second column compares proportion of sentiments expressed only by non-USGS users, and third column compares proportion of sentiments expressed only by USGS Volcanoes. Background fill of second and third columns corresponds with the fill colors of pie charts in the first column.
While most of the 16 post comment threads we analyzed contained a majority of positive expressed sentiments, several threads contained a majority of negative and mixed sentiments (Supplementary Figure 2). Regarding the “Eruption or USGS Volcanoes Content,” three post comment threads contained < 50% comments with positive sentiments, while for “People, Entities, Places, or Customs,” seven post comment threads contained < 50% positive comments. The highest proportions of negative and mixed sentiments (i.e., lowest percentage of positive sentiments) occurred as a result of one or more of the following causes: (1) users arguing over a topic of misinformation (applies to posts published on 5/4, 5/19, and both from 5/23), (2) users expressing blame or displeasure toward each other or external entities (applies to posts published on 5/17, 5/19, and both from 5/23), or (3) users expressing fear, shock, or sadness in response to the eruption event described in the original USGS Volcanoes post (applies to posts published on 5/19, both from 5/23, and 6/4).
When isolating non-USGS users' comments into those regarding “USGS Volcanoes, Scientists or HVO” vs. “Non-USGS users, People, or Entities,” we find that all 16 of the highest-user-reach post comment threads contained at least 60% positive sentiments toward “USGS Volcanoes, Scientists or HVO” (i.e., USGS-oriented; Supplementary Figure 3A). Comment threads for the May 9th post “Overlook crater explosion” and the May 23rd post “Blue methane flames video” received the highest total percentage of negative and mixed sentiments that were USGS-oriented. By contrast, only four post comment threads contained more than 50% positive sentiments toward “Non-USGS users, People, or Entities” (i.e., non-USGS-oriented; Supplementary Figure 3B). These four posts include the May 9th “Overlook crater warning,” May 24th “Fissure 22 UAS night video,” July 13th “Kapoho lava island,” and August 30th “Late-August UAS caldera flight.”
4.2.2 Expressed sentiments: qualitative results
We found that users expressed several common negative sentiments throughout the course of the eruption in response to the “Eruption or USGS Volcanoes content”: anxiety or fear that eruption hazards would escalate and endanger residents, frustration at the inconvenience caused by eruption hazards, shock or sadness at the destruction caused by the eruption, and sorrow on behalf of adversely impacted residents. Users expressed the following negative sentiments toward “USGS Volcanoes, Scientists, or HVO”: frustration by what users perceived to be incorrect or missing information provided by USGS Volcanoes, or feelings of distrust toward USGS, USGS Volcanoes, HVO, or scientists more broadly. Finally, users expressed the following negative sentiments toward “Non-USGS People, Entities, Places, or Customs”: blaming eruption survivors, local and state officials, or the power utility for endangering themselves, residents, or property; disparaging remarks toward Hawaiian landscapes or Native Hawaiian beliefs, language, or customs; criticizing other users for posting misinformation, spreading rumors, or asking “stupid” questions; exhibiting trolling behavior in response to other users' criticisms; making self-deprecating remarks; or criticizing other users for expressing negative comments toward USGS, USGS Volcanoes, scientists, or HVO.
In response to the “Eruption or USGS Volcanoes Content,” non-USGS users (and occasionally, USGS Volcanoes) expressed the following positive sentiments: admiration of eruption phenomena, science, nature, or USGS Volcanoes' coverage of the eruption; intrigue or curiosity about eruption phenomena or USGS Volcanoes' activities; excitement without indications of anxiety, fear, or other negative emotions; or humor that was light-hearted or upbeat, as opposed to sardonic or cynical (with the latter being coded under “Negative Sentiments”). Non-USGS users expressed the following positive sentiments toward “USGS Volcanoes, Scientists, or HVO”: gratitude for USGS Volcanoes answering their questions, alleviating their concerns about the eruption, or responding in a calm or empathic manner; complimenting USGS Volcanoes for their expertise or the content of their Facebook page; statements of increased knowledge from USGS Volcanoes' information; or affirmations of answers provided by USGS Volcanoes. Finally, non-USGS users and USGS Volcanoes expressed the following positive sentiments toward “Non-USGS People, Entities, Places, or Customs”: reassurance that residents or visitors were safe, or that specific eruption hazards did not pose immediate threats to peoples' safety; empathy toward concerned or anxious users; compliments of non-USGS users for correctly answering or sincerely responding to eruption-related questions; supportive statements toward users whose questions were disparaged; or compliments of users' cleverness or humor.
Overall, comments coded to Expressed Sentiments demonstrate that a combination of USGS Volcanoes' original post content and their interactions with users elicited a high frequency of positive emotions from users, providing strong evidence that this Facebook page was a beneficial channel for communicating 2018 Kīlauea eruption information to social media audiences. Conversely, comments containing negative or mixed sentiments were correlated far more often with major eruption events, the loss of property or a cherished landscape, or arguments between non-USGS users than by USGS Volcanoes' interactions with users.
4.3 Triangulation with bulk comment dataset
For each theme, we first present a plot comparing the daily frequency of several keywords throughout the eruption, followed by a plot of those same frequencies normalized to the total daily comment count and overlain by the sentiment analysis curve we calculated with VADER (Hutto and Gilbert, 2014). For the theme Eruption Sensemaking, we focus on the code “Misinformation and Rumors,” and for the theme Expressed Sentiments, we focus on the code “Positive Sentiments Regarding… People, Entities, Places or Customs.”
Within the code “Misinformation and Rumors,” we focused our bulk quantitative analysis on the rumor words listed in the Methods Section. Rumor words about the Hilina Slump, Yellowstone volcano, or an impending catastrophic eruption persisted at moderate to high frequencies from May through the end of July, while rumor words related to geothermal utility operations were heavily concentrated in mid-May (Figure 7A). The contrasting timescales in frequency for these two major categories of rumor topics are consistent with the relative frequencies of these rumor topics identified in the comment threads of the 16 highest-user-reach posts (Figure 5). The quantitative results presented in Figure 7A complement our in-depth analysis of the 16 post comment threads by illustrating increased occurrences of rumor words about the Hilina Slump, Yellowstone volcano, or a catastrophic eruption throughout mid-June and mid- to late-July that are not captured in the three post comment threads published within those time periods (specifically, 6/13, 6/14, and 7/13).
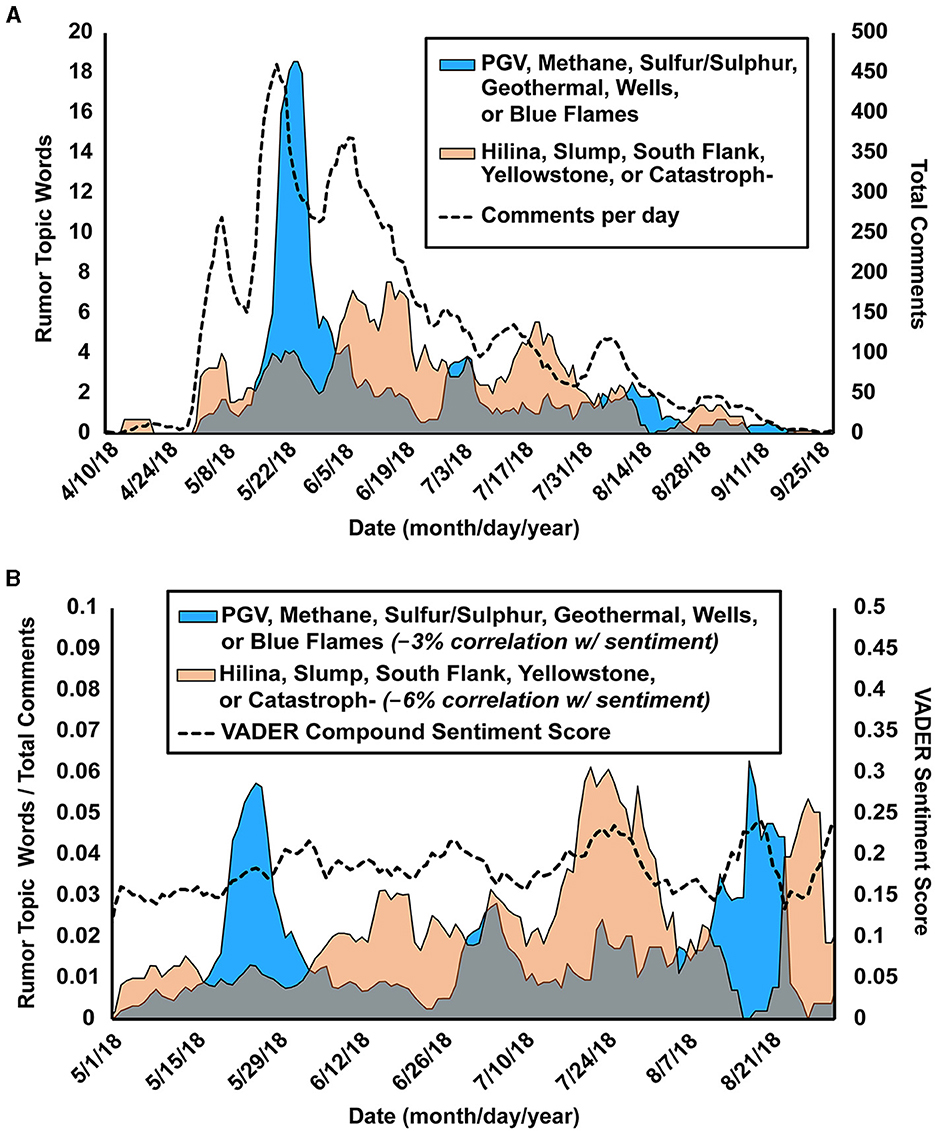
Figure 7. (A) Plot of rumor topic word frequencies from the bulk Facebook dataset (shaded line plots). Dashed black line indicates total user comments per day. (B) Plot of normalized rumor topic word frequencies from bulk Facebook dataset (shaded line plots), compared with compound VADER sentiment score (Hutto and Gilbert, 2014), presented as a dashed black line. Legend contains correlation scores of each shaded histogram with the VADER compound sentiment score, expressed as a percentage (0% = no correlation, 100% = perfect correlation, −100% = perfect anticorrelation).
The concentrated frequency of rumor words categorized as “PGV, Methane, Sulfur/Sulfur, Geothermal, Wells, or Blue Flames” (Figure 7A) in mid- to late-May aligns with the occurrence of specific eruption-related events. These events are captured, in part, in our qualitative results for secondary child code “PGV, Gases, Climate, or Weather” (Figure 5) for the high-reaching post comment threads that spanned the period of increased frequency: in the “Blue methane flames photo” and “Blue methane flames video” posts (both from May 23), discourse centered on whether burning of methane or sulfur gases was responsible for generating the blue flames presented in the posts by USGS Volcanoes; and, in the “Fissure 22 lava fountains” post (May 21), the preponderance of comments focused on clarifying hazards associated with potential lava inundation of the geothermal utility's facility. Our bulk quantitative analysis treats all mentions of the utility as rumoring, even though legitimate concerns regarding its vulnerability to inundation by lava flows existed and were addressed in the post comment threads. To note, both of these topics elicited strong negative emotions as expressed on social media. Thus, our triangulation provides a reminder of the importance of accounting for the needs and concerns of eruption-impacted communities when scientists or emergency responders communicate about an ongoing natural hazard crisis.
Within the code “Positive Sentiments Regarding… People, Entities, Places or Customs,” we focused our text search on the gratitude words listed in the Methods, given their frequent appearance in comments coded to this subtheme. Occurrence of the words “thank” and both words “thank AND usgs” closely match the pattern of the total comments curve, while occurrences of the words “mahalo” and both words “mahalo AND usgs” partially correspond with the total comments curve (Figure 8A). This result strongly suggests that the rate at which USGS Volcanoes and informed users answered other users' questions, or provided information that users appreciated, kept pace with overall user engagement. In other words, Figure 8 provides evidence that USGS Volcanoes and informed users were responsive to other users' questions about the 2018 eruption. This finding also complements our qualitative results for the code Eruption Sensemaking: “Eruption Q & A” by providing an indirect measure of USGS Volcanoes' and informed users' responsiveness to other users' questions.
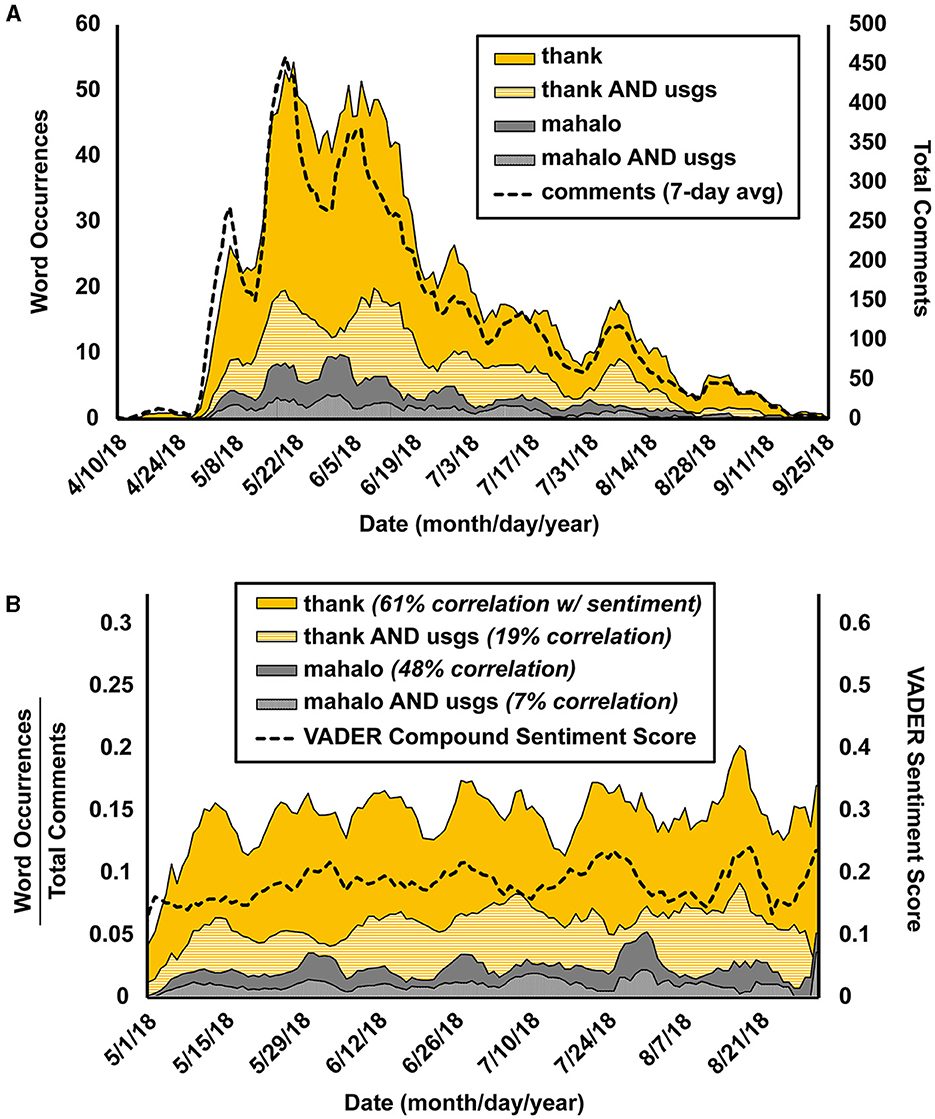
Figure 8. (A) Plot of gratitude word frequencies from the bulk Facebook dataset (shaded line plots). Dashed black line indicates total user comments per day. (B) Plot of normalized gratitude word frequencies from bulk Facebook dataset (shaded line plots), compared with compound VADER sentiment score (Hutto and Gilbert, 2014), presented as a dashed black line. Legend contains correlation scores of each shaded histogram with the VADER compound sentiment score, expressed as a percentage (0% = no correlation, 100% = perfect correlation, −100% = perfect anticorrelation).
In contrast to the bulk text search results for common rumor words (Figure 7A), the frequency of gratitude words, particularly “thank,‘” closely follows the overall frequency of users' comments. This suggests that the rate of user expressions of gratitude did not vary significantly throughout the duration of the 2018 eruption, similar to how USGS-oriented positive sentiment did not vary significantly among the 16 closely analyzed post comment threads (Supplementary Figure 3A).
We used the VADER sentiment analysis program to test for correlations between sentiments expressed in users' comments and the frequency of common rumor words. We also used VADER to test for correlations between users' overall expressed sentiments and the frequency of gratitude words. After calculating the average VADER compound score for each day of comments from May through August 2018, we took the 7-day running average of these scores and compared the shape of the resulting curve with normalized plots of rumor keyword frequency (Figure 7B) and gratitude keyword frequency (Figure 8B). We compared the VADER compound score with normalized, rather than absolute, bulk quantitative text search results because of the closer resemblance between our normalized results and the fairly stable VADER compound score curve. The 7-day running average of VADER's compound score for our bulk dataset ranges from 0.13 to 0.24, with an average score of 0.18 (see Supplementary material).
We quantified the resemblance of the 7-day running average of the VADER compound score to our keyword frequency curves by calculating correlation coefficients between them. The strongest correlation, 0.61, exists between the “thank” curve and VADER compound score, followed by a weaker correlation of 0.48 between the “mahalo” curve and compound score. Very low correlation values, indicating a lack of any correlation, are observed between the VADER compound score and normalized plots for all other gratitude keyword terms (Figure 8B) and all rumor keyword terms (Figure 7B). The correlation (61%) observed between users' overall expressed sentiments, as calculated by VADER, and the number of comments containing the word “thank” provides evidence that the ability of USGS Volcanoes and informed users to respond directly, accurately, and promptly to users' questions contributed directly to users' expressions of gratitude.
5 Discussion
5.1 Benefits of USGS volcanoes' dialogues with social media users
Prior to the 2018 eruption, USGS Volcanoes' primary function was to share information about U.S. volcanic unrest and educate “volcano enthusiasts” and other users intrigued or excited by volcano knowledge, images, and videos (Stovall et al., 2023). This is consistent with UGT in that users were initially drawn to the page because it validated their sense of self—in this case, through their personal interests. Once the 2018 eruption began, two significant changes occurred: user reach increased more than 10-fold and the proportion of users who came from Hawai‘i increased nearly 10-fold, from < 5% of total users to 30–40% for most of the eruption (Figure 1; and see Stovall et al., 2023). These changes are also explained by UGT, in that social media users, particularly Hawai‘i residents, sought out the USGS Volcanoes page in the hopes of finding accurate and prompt eruption information.
A concern commonly expressed by emergency managers and science communication planners is that providing official information on social media platforms would be counterproductive due to the prevalence of misinformation and rumors on those same channels (Hughes and Palen, 2012; Williams et al., 2020). However, increasing the visibility of official messengers on social media has been shown to decrease the prevalence of misinformation (Andrews et al., 2016) by filling what otherwise would be an “information void” (Bartel et al., 2019). Our study demonstrates that USGS Volcanoes' ability to attract attention and build trust among social media users minimized the “information void,” at least among the population of over 10 thousand users whom USGS Volcanoes' posts reached.
USGS Volcanoes' dialogues with users on social media were necessary for establishing themselves as a trusted, credible messenger of Kīlauea eruption information to a broader online audience than previous eruptions in Hawai‘i (Tumpey et al., 2019; Goldman et al., 2023). Our qualitative thematic analysis demonstrates that the educational, interactive, and sometimes humorous nature of the USGS Volcanoes social media page (McBride and Ball, 2022) positively contributed to at least some users' emotions, leading these users to tag their social media “friends” as a way of sharing their enthusiasm (Johnston et al., 2013). This tagging behavior, in turn, provided a wider audience for USGS Volcanoes' content and communications.
USGS Volcanoes' active engagement with their Facebook users contrasts with the USGS's Twitter communication response to the 2016 Bombay Beach earthquake swarm (McBride et al., 2020). Although misinformation was not found to be a significant problem by McBride et al. (2020) during this earthquake swarm, there were no two-way conversations between non-scientist Twitter users and USGS scientists monitoring and forecasting earthquake aftershocks. This prevented publics on Twitter from receiving an accurate picture of the most likely magnitude of aftershock earthquakes. Instead, these users received news media outlets' framing of earthquake forecasts that overemphasized the highest probability of large aftershocks occurring (McBride et al., 2020). The absence of USGS scientist engagement on social media also prevented users from better understanding those scientists' official language around earthquake forecasts, as well as building relationships with those scientists (Grunig, 1992).
Goldman et al. (2023) argued that, without preexisting relationships with publics, government officials are less likely to be viewed as trusted, credible messengers, increasing the likelihood that publics will turn to other sources and messengers of eruption information with whom they share a deeper mutual understanding (as outlined by Broom, 1977). Our study of USGS Volcanoes' 2018 Kīlauea eruption dialogues with users on Facebook illustrates how government officials can be viewed as trusted, credible messengers on social media by demonstrating the ability of USGS scientists to convey accurate eruption information online to these users while building a relationship of trust with them.
A comment posted by a user (“User K”) in response to the May 9th “Overlook Crater Warning” post illustrates the positivity that most users expressed toward USGS Volcanoes: “Thank you so much for posting this. Please post more videos! We value you, and know that it takes more than 5 min to share all of this in a way that informs, prepares and calms the public. maha[l]o nui loa!” This comment not only identifies USGS Volcanoes as a valuable messenger, but also explains why User K viewed them as one—USGS Volcanoes provided useful information in a timely yet comprehensive manner while conveying it in a calming way. These qualities are important not only for convincing publics to accept the information provided by an official messenger (Goldman et al., 2023), but also for encouraging those publics to continue seeking out information from that same messenger, as exemplified in User K's comment asking USGS Volcanoes to post additional content. The positive sentiment expressed by User K toward USGS Volcanoes is representative of the significant majority of positive sentiments that were USGS-oriented within the 16 highest-user-reach post comment threads (Supplementary Figure 3A).
5.2 Improving future social media hazard communication responses
Our study reveals that qualitatively analyzing social media discourse is valuable for evaluating the efficacy of a government agency's crisis communication response. Such assessments capture the emotional complexity in social media users' comments, the community values reflected among some people directly impacted by the crisis, and how both of those factors relate to the formation of certain types of misinformation. Our study also demonstrates the importance of performing complementary quantitative analyses of this discourse, providing a broader understanding of the frequency and temporal distribution of recurring rumors or sentiments expressed in users' comments.
Recent studies in hazard communication suggest that managers can adopt a qualitative process similar to the one used in our study to group users' questions or concerns into major themes, allowing those managers to prioritize their communication along those themes (Wukich, 2015; Dong et al., 2018; Ruan et al., 2022). This has previously been done by Williams et al. (2020) to identify successes and areas of improvement across all aspects of the USGS response to Kīlauea's 2018 eruption, from hazard mapping and data collection to its public communication efforts.
Furthermore, subthemes identified from our coding process may serve as a framework for science agencies or emergency managers planning to communicate with users on social media platforms during a natural hazard crisis. For example, official science messengers may benefit from preparing a list of rumor typologies and listing effective responses to those rumors whenever they appear. Some of these responses may require interagency coordination to ensure consistent messaging and proper attribution of expert resources.
Finally, the results of our study can serve as a basis for comparison with more recent USGS Volcanoes' social media dialogues during various phases of Kīlauea's more recent summit lava lake eruptions (Stovall et al., 2023). The first of these occurred from mid-December 2020 through May 2021 following the presence of a short-lived summit water lake (Nadeau et al., 2024). Studying how USGS Volcanoes' dialogues with users have evolved from 2018 to the present would provide an updated understanding of successes and potential lessons to apply to other social media hazard communication efforts in the United States and worldwide.
6 Researcher reflections and research limitations
The main limitation of this study's qualitative analysis is the relatively small body of text analyzed: 16 out of 694 posts relating to Kīlauea Volcano from April 23rd, when the first Facebook posts about the overflowing Halema‘uma‘u lava lake were published, through September 5th, the last day that active lava was observed at the surface of Kīlauea.5 The analyzed posts are not evenly spaced throughout the duration of the eruption, though our choice to focus on the 16 farthest reaching posts has the advantage of analyzing conversations that likely had the greatest impact on public users' understanding of the eruption. Working with a smaller sample of text enabled a detailed qualitative analysis to be performed, focusing on deep rather than broad understanding of the content. Additionally, we are only able to analyze the perceptions of people who interact with posts and not those who may have read but did not interact. This limitation prevents us from documenting and analyzing the full range of possible perceptions of users viewing USGS Volcanoes' social media posts. One further complexity is our inability, due to limitations of data collection, to determine locality of users to fully understand their relationship to the events in 2018. This information would have been useful to contextualize the users' experiences and concerns more fully.
Another limitation of our qualitative approach is that the comment threads that we imported as pdf files for analysis were ordered by “relevance” rather than chronology, limiting our ability to trace the full progression of users' questions and USGS Volcanoes' or informed users' responses over time. The percentage of direct responses that we report USGS Volcanoes provided to users' questions or misinformation-related comments is an underrepresentation of USGS Volcanoes' overall responsiveness, since our qualitative thematic analysis does not include USGS Volcanoes' use of FAQs to address common questions and rumors. We also do not provide a comparison of users' questions, sentiments, or comments containing misinformation or rumors between USGS Volcanoes' page and other social media outlets that Hawai‘i residents reported following regularly during the 2018 eruption (Goldman et al., 2023). We also do not have the data for users' reactions in the post comment threads that we qualitatively analyzed, which would have provided additional context for how positively users reacted to comments from USGS Volcanoes and from informed non-USGS users. Moreover, a majority (60–70%) of viewers of the USGS Volcanoes' social media page came from outside the State of Hawaii (Stovall et al., 2023). We do not have full geographic data for individual users or their comments, meaning that, of the 30–40% of users located in the State of Hawaii, we could not quantify the percentage of users located on the Island of Hawai‘i, particularly regions impacted by Kīlauea's eruption.
There were also several limitations in our bulk quantitative methods. The bulk comment dataset exported from Facebook's API includes several sets of duplicate comments that we were unable to automatically isolate and remove based on the similar, and sometimes identical, wording with other comments that were not duplicates. Further, we found that the Facebook API dataset only contained roughly 80% of the comments that were manually visible on the social media posts, which we determined by comparing the total number of comments in the API dataset with the number of comments we manually counted on the USGS Volcanoes' social media page from the same period of time as of November 2020. Our method of performing simple text searches on the Facebook API dataset only captured one sentiment, gratitude, since other sentiments could not be reliably reduced to single words. Similarly, rumor-related text searches did not capture occurrences of misinformation that do not contain the keywords listed in the Methods and presented in the Results, nor did they distinguish rumors from non-rumor-related comments. Finally, the main limitation of performing a VADER quantitative sentiment analysis on the Facebook API dataset is that emojis in users' comments were converted into unrecognizable symbolic characters upon being exported to a comma separated vector (csv) format. Since VADER can read and interpret the sentiments expressed by specific emojis (Hutto and Gilbert, 2014), the loss of these data into unreadable characters equates to an artificial neutralization of the sentiment score for those emojis.
7 Conclusion
This study presents a mixed-methods investigation of dialogues between the social media group USGS Volcanoes and non-USGS-affiliated users on Facebook during the 2018 eruption of Hawai‘i's Kīlauea Volcano. Through our qualitative thematic analysis, we identified two key themes in the dialogues. The first—Eruption Sensemaking—describes the roles and strategies that USGS Volcanoes and informed non-USGS users assumed in answering other users' questions, or correcting or calling out comments containing misinformation or false rumors. The second theme—Expressed Sentiments—contains three categories of emotions expressed in users' comments: positive, negative, and a grouping of “mixed, somber, and sympathetic.” Our quantitative analyses included tallying the codes identified from our qualitative analysis, performing text searches on a larger dataset of 22,000 comments exported from Facebook's API, and using the VADER sentiment analysis program to quantify the degree to which users' overall sentiments were positive or negative throughout the eruption.
We identified four main findings, two for each qualitative theme. The findings that correspond with Eruption Sensemaking include, (1) USGS Volcanoes and informed users directly answered more than 70% of users' questions and corrected over half of comments containing misinformation or rumors and (2) these same messengers responded to other users' comments in ways that exemplified best practices identified in the hazard communication literature. Our findings corresponding with Expressed Sentiments include (3) that users' emotions were overwhelmingly positive, with 70% of positive feedback being directed at USGS Volcanoes, its scientists, or HVO, and (4) the occurrence of the word “thank” roughly correlates with users' overall sentiment throughout the eruption, indicating the critical role that USGS Volcanoes' and informed users' interactions with other users had on users' overall sentiment.
We determined that USGS Volcanoes' social media communication was a critical part of the USGS VHP's 2018 Kīlauea eruption response by analyzing publicly visible social media dialogues between USGS Volcanoes and non-USGS users. We also illustrate how USGS Volcanoes' frequent, two-way discussions with social media users in 2018 provided important benefits by broadening the scope of public user engagement compared to previous USGS hazard communication efforts. The methods and results of this study provide a useful framework for hazard monitoring agencies and officials in the U.S. and elsewhere to build on in planning the most effective communication with publics during future hazard crises. Additionally, our methodology lays the groundwork for tracking the evolution of social media communication from official science agency accounts, such as USGS Volcanoes, over the course of multiple natural hazard events.
Data availability statement
The original contributions presented in the study are included in the article/Supplementary material, further inquiries can be directed to the corresponding author.
Author contributions
RG performed all qualitative and quantitative analyses and led writing of the manuscript. SM supported qualitative analyses, co-wrote the manuscript, provided perspectives on prevailing social science concepts, guidance on how to perform a mixed methods study, including developing this study's codebook, and guidance on writing for an interdisciplinary audience. WS assumed the role of primary advisor for RTG's NSF GRIP fellowship at the USGS Cascades Volcano Observatory, provided access to USGS Volcanoes Facebook data, and curated the API bulk-comment dataset. WS and DD co-wrote the manuscript and provided perspectives on state-of-the-art volcanology literature, the 2018 eruption as well as the USGS social media response. All authors helped conceptualize the study and read and approved the final manuscript.
Funding
This research was supported by NSF GRFP Grant No. DGE-1746047 and the University of Illinois' Graduate College Fellowship.
Acknowledgments
We thank Mike Randall for greatly assisting us with the process of exporting comments posted to the USGS Volcanoes Facebook page during the 2018 eruption from Facebook's API to a csv format. We thank Diamond Holloman, Steven Brantley, Chris Magirl, Tina Neal, Ken Hon, and Michael Clynne of the USGS for providing internal reviews that greatly improved our work. We also thank our two external reviewers for their insightful feedback that enhanced the quality of our final publication. Finally, we thank our associate editor, Anna Scolobig, for overseeing the publication of this manuscript and providing final reviews that improved this article. Any use of trade, firm, or product names is for descriptive purposes only and does not imply endorsement by the U.S. Government.
Conflict of interest
The authors declare that the research was conducted in the absence of any commercial or financial relationships that could be construed as a potential conflict of interest.
Publisher's note
All claims expressed in this article are solely those of the authors and do not necessarily represent those of their affiliated organizations, or those of the publisher, the editors and the reviewers. Any product that may be evaluated in this article, or claim that may be made by its manufacturer, is not guaranteed or endorsed by the publisher.
Supplementary material
The Supplementary Material for this article can be found online at: https://www.frontiersin.org/articles/10.3389/fcomm.2024.986974/full#supplementary-material
Footnotes
1. ^https://www.usgs.gov/media/images/k-lauea-volcano-methane-gas-flames
2. ^https://seismo.berkeley.edu/blog/2018/05/07/a-slow-emergency-and-a-sudden-slump.html
3. ^https://www.christytill.com/yellowstone.html
4. ^https://www.washingtonpost.com/news/powerpost/paloma/the-energy-202/2018/06/18/the-energy-202-Kīlauea-s-eruption-reignites-debate-over-hawaii-s-geothermal-plant/5b2652f21b326b3967989b27/
5. ^https://www.usgs.gov/volcanoes/Kīlauea/2018-lower-east-rift-zone-eruption-and-summit-collapse
References
Alexander, D. E. (2014). Social media in disaster risk reduction and crisis management. Sci. Eng. Ethics 20, 717–733. doi: 10.1007/s11948-013-9502-z
Andrews, C. A., Fichet, E. S., Ding, Y., Spiro, E. S., and Starbird, K. (2016). “Keeping up with the tweet-dashians: the impact of ‘official- accounts on online rumoring,” in Proceedings of the 19th ACM Conference on Computer-Supported Cooperative Work & Social Computing - CSCW'16 (New York, NY: ACM Press), 451–464. doi: 10.1145/2818048.2819986
Bartel, B. A., Bohon, W., Stovall, W. K., and Poland, M. P. (2019). Communicating Geohazards: Delivering Information Responsibly in Crisis and Calm in U33B-06. Available online at: https://ui.adsabs.harvard.edu/abs/2019AGUFM.U33B..06B
Bazeley, P., and Jackson, K. (2013). Qualitative Data Analysis With NVivo, 2nd Edn. Los Angeles; London; New Delhi: SAGE Publications, Inc.
Bird, D., Ling, M., and Haynes, K. (2012). Flooding Facebook - the use of social media during the Queensland and Victorian floods. Aust. J. Emerg. Manage. 27:7.
Bordia, P., and Difonzo, N. (2004). Problem solving in social interactions on the internet: rumor as social cognition. Soc. Psychol. Q. 67, 33–49. doi: 10.1177/019027250406700105
Brantley, S. R., Kauahikaua, J. P., Babb, J. L., Orr, T. R., Patrick, M. R., Poland, M. P., et al. (2019). “Communication strategy of the U.S. Geological Survey Hawaiian Volcano Observatory during the lava-flow crisis of 2014–2015, Kīlauea Volcano, Hawaii,” in Field Volcanology: A Tribute to the Distinguished Career of Don Swanson, eds M. P. Poland, M. O. Garcia, V. E. Camp, and A. Grunder. (Boulder, CO: Geological Society of America), 351–373. doi: 10.1130/2018.2538(16)
Braun, V., and Clarke, V. (2012). “Thematic analysis,” in APA Handbook of Research Methods in Psychology, Vol. 2. Research Designs: Quantitative, Qualitative, Neuropsychological, and Biological, eds H. Cooper, P. M. Camic, D. L. Long, A. T. Panter, D. Rindskopf, and K. J. Sher (Washington, DC: American Psychological Association), 57–71. doi: 10.1037/13620-004
Broom, G. M. (1977). Coorientational measurement of public issues. Public Relat. Rev. 3, 110–119. doi: 10.1016/S0363-8111(77)80010-6
Brown, S. K., Loughlin, S. C., Sparks, R. S. J., Vye-Brown, C., Barclay, J., Calder, E., et al. (2015). “Global volcanic hazard and risk,” in Global Volcanic Hazards and Risk, eds S. C. Loughlin, S. Sparks, S. K. Brown, S. F. Jenkins, and C. Vye-Brown (Cambridge: Cambridge University Press), 81–172. doi: 10.1017/CBO9781316276273.004
Cheng, Y., Wang, Y., and Kong, Y. (2022). The state of social-mediated crisis communication research through the lens of global scholars: an updated assessment. Public Relat. Rev. 48:102172. doi: 10.1016/j.pubrev.2022.102172
Colombetti, G. (2005). Appraising valence. J. Conscious. Stud. 12, 103–126. doi: 10.1007/s11098-005-2138-3
Crabtree, B. F., and Miller, W. L. (1999). Doing Qualitative Research. Thousand Oaks, CA: SAGE Publications, Inc.
Creswell, J. W. (2009). Research Design: Qualitative, Quantitative, and Mixed Methods Approaches, 3rd Edn. Thousand Oaks, CA: Sage Publications, Inc.
Daymon, C., and Holloway, I. (2010). Qualitative Research Methods in Public Relations and Marketing Communications, 2nd Edn. London: Routledge. doi: 10.4324/9780203846544
de Groot, R. M. (2009). Analogies designed to enhance understanding of earthquake science: their identification, characterization, and use in instructional settings (ProQuest Dissertations and Theses). Available online at: https://www.proquest.com/dissertations-theses/analogies-designed-enhance-understanding/docview/304996946/se-2?accountid=14553
Dervin, B. (2003). “Chaos, order, and sense-making: a proposed theory for information design,” in Sense-Making Methodology Reader: Selected Writings of Brenda Dervin, eds B. Dervin, L. Foreman-Wernet, and E. Lauterbach (Cresskill, NJ: Hampton Press), 325–340.
Dietterich, H. R., and Neal, C. A. (2022). A look ahead to the next decade at US volcano observatories. Bull. Volcanol. 84:63. doi: 10.1007/s00445-022-01567-3
Dong, R., Li, L., Zhang, Q., and Cai, G. (2018). Information diffusion on social media during natural disasters. IEEE Trans. Comput. Soc. Syst. 5, 265–276. doi: 10.1109/TCSS.2017.2786545
Eriksson, M. (2018). Lessons for crisis communication on social media: a systematic review of what research tells the practice. Int. J. Strat. Commun. 12, 526–551. doi: 10.1080/1553118X.2018.1510405
Fielding, N. G. (2012). Triangulation and mixed methods designs: data integration with new research technologies. J. Mix. Methods Res. 6, 124–136. doi: 10.1177/1558689812437101
Flew, T., Bruns, A., Burgess, J., Crawford, K., and Shaw, F. (2014). “Social media and its impact on crisis communication: case studies of Twitter use in emergency management in Australia and New Zealand” in 2013 ICA Shanghai Regional Conference: Communication and Social Transformation (Shanghai).
Goldman, R., Stovall, W., Damby, D., and McBride, S. (2023). Hawai‘i residents' perceptions of Kīlauea's 2018 eruption information. Volcanica 6, 19–43. doi: 10.30909/vol.06.01.1943
Gómez, V., Kaltenbrunner, A., and López, V. (2008). “Statistical analysis of the social network and discussion threads in slashdot,” in Proceedings of the 17th International Conference on World Wide Web (Beijing), 645–654. doi: 10.1145/1367497.1367585
Graham, O., Thomas, T., Hicks, A., Edwards, S., Juman, A., Ramroop, A., et al. (2023). Facts, Faith and Facebook: science communication during the 2020–2021 La Soufrière, St. Vincent volcanic eruption. SP 539, SP539-2022–289. doi: 10.1144/SP539-2022-289
Grunig, J. E, . (ed.). (1992). Excellence in Public Relations and Communication Management, 1st Edn. Hillsdale, NJ: Routledge.
Grunig, J. E. (2013). Excellence in Public Relations and Communication Management. Chicago, IL: Routledge. doi: 10.4324/9780203812303
Hagley, Z. (2021). The disaster of ‘alternative facts': misinformation and disaster management in grenada. Caribb. Stud. 49, 29–59. doi: 10.1353/crb.2021.0011
Hardaker, C. (2010). Trolling in asynchronous computer-mediated communication: from user discussions to academic definitions. J. Polit. Res. Lang. Behav. Cult. 6, 215–242. doi: 10.1515/jplr.2010.011
Hennink, M., and Kaiser, B. N. (2022). Sample sizes for saturation in qualitative research: a systematic review of empirical tests. Soc. Sci. Med. 292:114523. doi: 10.1016/j.socscimed.2021.114523
Hughes, A. L., and Palen, L. (2012). The evolving role of the public information officer: an examination of social media in emergency management. J. Homeland Secur. Emerg. Manage. 9. doi: 10.1515/1547-7355.1976
Hutto, C., and Gilbert, E. (2014). VADER: a parsimonious rule-based model for sentiment analysis of social media text. ICWSM 8, 216–225. doi: 10.1609/icwsm.v8i1.14550
Jee, B. D., Uttal, D. H., Gentner, D., Manduca, C., Shipley, T. F., Tikoff, B., et al. (2010). Commentary: analogical thinking in geoscience education. J. Geosci. Educ. 58, 2–13. doi: 10.5408/1.3544291
Johnson, R. B., Onwuegbuzie, A. J., and Turner, L. A. (2007). Toward a definition of mixed methods research. J. Mix. Methods Res. 1, 112–133. doi: 10.1177/1558689806298224
Johnston, K., Tanner, M., Lalla, N., and Kawalski, D. (2013). Social capital: the benefit of Facebook ‘friends.' Behav. Inform. Technol. 32, 24–36. doi: 10.1080/0144929X.2010.550063
Kaplan, A. M., and Haenlein, M. (2010). Users of the world, unite! The challenges and opportunities of Social Media. Bus. Horiz. 53, 59–68. doi: 10.1016/j.bushor.2009.09.003
Kauahikaua, J. P., and Trusdell, F. A. (2020). Have Humans Influenced Volcanic Activity on the Lower East Rift Zone of Kīlauea Volcano? A Publication Review. U.S. Geological Survey Open-File Report 2020–1017. doi: 10.3133/ofr20201017
Kuklinski, J. H., Quirk, P. J., Jerit, J., Schwieder, D., and Rich, R. F. (2000). Misinformation and the currency of democratic citizenship. J. Polit. 62, 790–816. doi: 10.1111/0022-3816.00033
Lee, J., and Lee, J. J. (2023). The homophobic call-outs of COVID-19: spurring and spreading angry attention from girregi journalism online to YouTube in South Korea. Int. J. Communi.
Lien, C. Y., and Wu, Y. H. (2021). Affective communication: a mixed method investigation into COVID-19 outbreak communication using the Taiwanese government Facebook page. Global Health Promot. 28, 56–66. doi: 10.1177/17579759211003539
Lin, G., and Okubo, P. G. (2020). Seismic evidence for a shallow detachment beneath Kīlauea's south flank during the 2018 activity. Geophys. Res. Lett. 47:e2020GL088003. doi: 10.1029/2020GL088003
Liu, B. (2012). Sentiment analysis and opinion mining. Synth. Lect. Hum. Lang. Technol. 5, 1–167. doi: 10.1007/978-3-031-02145-9
McBride, S. K. (2018). Would you like people to listen to you? Be more likable! Seismol. Res. Lett. 89, 1163–1164. doi: 10.1785/0220180086
McBride, S. K., and Ball, J. (2022). #TheSmoreYouKnow and #emergencycute: a conceptual model on the use of humor by science agencies during crisis to create connection, empathy, and compassion. Int. J. Disast. Risk Reduct. 77:102995. doi: 10.1016/j.ijdrr.2022.102995
McBride, S. K., Llenos, A. L., Page, M. T., and van der Elst, N. (2020). #EarthquakeAdvisory: exploring discourse between government officials, news media, and social media during the 2016 Bombay Beach Swarm. Seismol. Res. Lett. 91, 438–451. doi: 10.1785/0220190082
Miles, M. B., and Huberman, A. M. (1994). Qualitative Data Analysis: An Expanded Sourcebook. Thousand Oaks, CA: SAGE Publications.
Nadeau, P. A., Hurwitz, S., Peek, S., Lerner, A. H., Younger, E. F., Patrick, M. R., et al. (2024). Chemistry, Growth, and Fate of the Unique, Short-Lived (2019-2020) Water Lake at the Summit of Kīlauea Volcano, Hawaii. Geochemistry, Geophysics, Geosystems.
Neal, C. A., Brantley, S. R., Antolik, L., Babb, J. L., Burgess, M., Calles, K., et al. (2019). The 2018 rift eruption and summit collapse of Kīlauea Volcano. Science 363, 367–374. doi: 10.1126/science.aav7046
Oh, O., Agrawal, M., and Rao, R. (2013). Community intelligence and social media services: a rumor theoretic analysis of tweets during social crises. MIS Q. 37, 407–426. doi: 10.25300/MISQ/2013/37.2.05
Peterson, B. L. (2017). Thematic analysis/interpretive thematic analysis. Int. Encyclop. Commun. Res. Methods 1–9. doi: 10.1002/9781118901731.iecrm0249
Pew Research Center (2021). A Majority of Americans Say They Use YouTube and Facebook, While Use of Instagram, Snapchat and TikTok Is Especially Common Among Adults Under 30. Washington, DC. Available online at: https://www.pewresearch.org/internet/2021/04/07/social-media-use-in-2021/
Rosnow, R. L. (2001). “Rumor and gossip in interpersonal interaction and beyond: a social exchange perspective,” in Behaving Badly: Aversive Behaviors in Interpersonal Relationships, ed R. M. Kowalski (Washington, DC: American Psychological Association), 203–232. doi: 10.1037/10365-008
Ruan, T., Kong, Q., McBride, S. K., Sethjiwala, A., and Lv, Q. (2022). Cross-platform analysis of public responses to the 2019 Ridgecrest earthquake sequence on Twitter and Reddit. Sci. Rep. 12:1634. doi: 10.1038/s41598-022-05359-9
Rubin, A. M. (2009). “Uses and gratifications: an evolving perspective of media effects,” in The Sage Handbook of Media Processes and Effects, eds R. L. Nabi and M. B. Oliver (Los Angeles, CA: SAGE), 147–159.
Ruokolainen, H., Widén, G., and Eskola, E. L. (2023). How and why does official information become misinformation? A typology of official misinformation. Lib. Inform. Sci. Res. 45:101237. doi: 10.1016/j.lisr.2023.101237
Saroj, A., and Pal, S. (2020). Use of social media in crisis management: a survey. Int. J. Disast. Risk Reduct. 48:101584. doi: 10.1016/j.ijdrr.2020.101584
Severin, W. J., and Tankard, J. W. (2000). Communication Theories: Origins, Methods, and Uses in the Mass Media. New York, NY: Addison Wesley Longman, Inc.
Simon, T., Goldberg, A., and Adini, B. (2015). Socializing in emergencies—A review of the use of social media in emergency situations. Int. J. Inf. Manage. 35, 609–619. doi: 10.1016/j.ijinfomgt.2015.07.001
Starbird, K., Spiro, E., Edwards, I., Zhou, K., Maddock, J., and Narasimhan, S. (2016). “Could this be true? I think so! Expressed uncertainty in online rumoring,” in Conference on Human Factors in Computing Systems – Proceedings, 360–371. doi: 10.1145/2858036.2858551
Stovall, W. K., Ball, J. L., Westby, E. G., Poland, M. P., Wilkins, A., and Mulliken, K. M. (2023). Officially social: developing a social media crisis communication strategy for USGS Volcanoes during the 2018 Kīlauea eruption. Front. Commun. 8:976041. doi: 10.3389/fcomm.2023.976041
Stovall, W. K., Wilkins, A. M., Mandeville, C. W., and Driedger, C. L. (2016). U.S. Geological Survey Volcano Hazards Program—Assess, Forecast, Prepare, Engage. Reston, VA. doi: 10.3133/fs20163040
Tang, J., Yang, S., and Wang, W. (2021). Social media-based disaster research: development, trends, and obstacles. Int. J. Disast. Risk Reduct. 55:102095. doi: 10.1016/j.ijdrr.2021.102095
Tausczik, Y. R., and Pennebaker, J. W. (2010). The psychological meaning of words: LIWC and computerized text analysis methods. J. Lang. Soc. Psychol. 29, 24–54. doi: 10.1177/0261927X09351676
Taylor, M., Wells, G., Howell, G., and Raphael, B. (2012). The role of social media as psychological first aid as a support to community resilience building. A Facebook study from “Cyclone Yasi Update.” Austr. J. Emerg. Manage. 27, 20–26. doi: 10.13140/RG.2.2.34512.40962
Thurston, W. E., Cove, L., and Meadows, L. M. (2008). Methodological congruence in complex and collaborative mixed method studies. Int. J. Multiple Res. Approach. 2, 2–14. doi: 10.5172/mra.455.2.1.2
Tsang, S. W. R., and Lindsay, J. M. (2019). Response to and Short-Term Recovery From a Lava Flow Inundation: Lessons From the 2018 Lower East Rift Zone Eruption at Kīlauea Volcano, Hawaii, USA. Lower Hutt: GNS Science. Available online at: https://shop.gns.cri.nz/sr_2019-75-pdf (accessed February 17, 2021).
Tumpey, A. J., Daigle, D., and Nowak, G. (2019). “Communicating during an outbreak or public health investigation,” in The CDC Field Epidemiology Manual, eds S. A. Rasmussen and R. A. Goodman (New York, NY: Oxford University Press). doi: 10.1093/oso/9780190933692.003.0012
Verzosa Hurley, E., and Kimme Hea, A. C. (2014). The rhetoric of reach: preparing students for technical communication in the age of social media. Techn. Commun. Q. 23, 55–68. doi: 10.1080/10572252.2014.850854
Vongkusolkit, J., and Huang, Q. (2021). Situational awareness extraction: a comprehensive review of social media data classification during natural hazards. Ann. GIS 27, 5–28. doi: 10.1080/19475683.2020.1817146
Vraga, E. K., and Bode, L. (2020). Defining misinformation and understanding its bounded nature: using expertise and evidence for describing misinformation. Polit. Commun. 37, 136–144. doi: 10.1080/10584609.2020.1716500
Webb, E. J., Campbell, D. T., Schwartz, R. D., and Sechrest, L. (1966). Unobtrusive Measures: Nonreactive Research in the Social Sciences. Oxford: Rand McNally.
Weick, K. E. (1988). Enacted sensemaking in crisis situations. J. Manage. Stud. 25, 305–317. doi: 10.1111/j.1467-6486.1988.tb00039.x
Weick, K. E., Sutcliffe, K. M., and Obstfeld, D. (2005). Organizing and the process of sensemaking. Organ. Sci. 16, 409–421. doi: 10.1287/orsc.1050.0133
Westerman, D., Spence, P. R., and Van Der Heide, B. (2014). Social media as information source: recency of updates and credibility of information. J. Comput. Mediat. Comm. 19, 171–183. doi: 10.1111/jcc4.12041
Whiting, A., and Williams, D. (2013). Why people use social media: a uses and gratifications approach. Qual. Mrkt. Res. 16, 362–369. doi: 10.1108/QMR-06-2013-0041
Williams, D. M., Avery, V. F., Coombs, M. L., Cox, D. A., Horwitz, L. R., McBride, S. K., et al. (2020). U.S. Geological Survey 2018 Kīlauea Volcano Eruption Response in Hawai'i—After-Action Review. Reston, VA. doi: 10.3133/ofr20201041
Woods, R. J., McBride, S. K., Wotherspoon, L. M., Beavan, S., Potter, S. H., Johnston, D. M., et al. (2017). Science to emergency management response: Kaikoura Earthquakes 2016. BNZSEE 50, 329–337. doi: 10.5459/bnzsee.50.2.329-337
Keywords: Kīlauea, social media, qualitative thematic analysis, mixed methods, NVivo, hazard communication, sentiment analysis, misinformation
Citation: Goldman RT, McBride SK, Stovall WK and Damby DE (2024) USGS and social media user dialogue and sentiment during the 2018 eruption of Kīlauea Volcano, Hawai‘i. Front. Commun. 9:986974. doi: 10.3389/fcomm.2024.986974
Received: 05 July 2022; Accepted: 29 January 2024;
Published: 22 February 2024.
Edited by:
Anna Scolobig, University of Geneva, SwitzerlandReviewed by:
Britta Ricker, Utrecht University, NetherlandsMarion Lara Tan, Massey University, New Zealand
Copyright © 2024 Goldman, McBride, Stovall and Damby. This is an open-access article distributed under the terms of the Creative Commons Attribution License (CC BY). The use, distribution or reproduction in other forums is permitted, provided the original author(s) and the copyright owner(s) are credited and that the original publication in this journal is cited, in accordance with accepted academic practice. No use, distribution or reproduction is permitted which does not comply with these terms.
*Correspondence: Wendy K. Stovall, d3N0b3ZhbGxAdXNncy5nb3Y=