 Miguel Jorge
 Bruno Pinto2
 Diana Boaventura
- 1Departamento de Biologia Animal, Faculdade de Ciências, Universidade de Lisboa, Campo Grande, Portugal
- 2MARE – Marine and Environmental Sciences Center /ARNET – Aquatic Research Network, Faculdade de Ciências, Universidade de Lisboa, Lisbon, Portugal
- 3Centro de Investigação e Estudos, Escola Superior de Educação João de Deus, Lisbon, Portugal
“User generated” content is a new popular type of content that shows potential in communicating information to younger age groups in new, creative ways. This study aimed to assess the impact of a “user generated” video in communicating about marine environmental threats, specifically to one hundred and fifty-one young adults enrolled in two different schools: a private higher education school, and a public university, both in the Lisbon metropolitan area (Portugal). The video’s impacts in the cognitive and emotional fields were assessed by comparing them to the impacts of an outreach text similar in content and duration of exposure. A pre-test/post-test methodology was used to evaluate short-term impacts, and a follow-up test was applied to gauge medium-term impacts. Additionally, short focus group sessions further explored topics such as media consumption preferences and trends. The results suggest that “user generated” video has a similar impact to an outreach text in the cognitive field, and a bigger impact in the emotional field when it comes to promoting positive emotions and feelings. Therefore, when used to its full potential, this type of media can be a suitable way to communicate about science and environmental topics, particularly marine environmental threats, and a valuable tool to raise public awareness.
1 Introduction
Communicating about scientific and environmental topics is an increasing necessity, particularly in the face of global challenges like climate change and sustainability. This dissemination of science plays a key role in increasing the general public’s awareness and combating disinformation, thus contributing with insights on how to better adapt attitudes and behaviors in ways that promote sustainable practices and political action (Silva and Pinto, 2023; Wilkinson et al., 2023).
The ocean can be an example of these topics. It covers about 71% of the Earth’s surface (Ocean Literacy Portal, 2022; Santoro et al., 2017) and encompasses a vast diversity of coastal and marine ecosystems. Marine ecosystems are among the most impacted by climate change and its consequences, like ocean acidification and deoxygenation (Harrould-Kolieb and Herr, 2012; Hoegh-Guldberg et al., 2007; Keeling et al., 2010) and the rise of the average sea level (Griggs and Reguero, 2021; Mimura, 2013), and by other anthropogenic actions, such as overfishing (De Mitcheson et al., 2020; Pauly et al., 2005; Stevenik and Sundby, 2007) and oceanic pollution (Beyer et al., 2016; Vikas and Dwarakish, 2015; Wabnitz and Nichols, 2010).
These threats are of great importance given the socio-economic value and the benefits the ocean provides (Henson et al., 2017). They encompass provisioning ecosystem services such as sustenance and water, cultural services involving spiritual and recreational activities, regulating services including flood and disease control, and support services like primary production and nutrient cycling (Millenium Ecosystem Assessment, 2005).
For this reason, improving the public’s ocean literacy – as in “the understanding of the ocean’s influence on us and our influence on the ocean” (Santoro et al., 2022) - and communicating about the current state of the marine environment is imperative to successfully promote its sustainable use and conservation. Additionally, these aspects can be key contributions to “conserve and sustainably use the oceans, seas, and marine resources” and achieve Sustainable Development Goals (SDG) from the 2030 United Nations’ Agenda for Sustainable Development, in specific SDG14: “Life below Water” (Santoro et al., 2017).
Marine topics have been receiving significant levels of attention from society (Davis et al., 2018), and with the development of media and technology, new ways of communicating have been emerging, such as online videos. Within these, there has been a notable expansion in the realm of videos dedicated to scientific and environmental topics (Erviti and Stengler, 2016; Welbourne and Grant, 2016), and a shift in media consumption toward this media type has been notable (León and Bourk, 2018).
Online scientific videos have proliferated due to being an accessible way to communicate with broader audiences (Sugimoto and Thelwall, 2013) and because it allows these to constantly access any information they want, including details about species, habitats or ecosystems that might be geographically distant or otherwise inaccessible to them. It can also allow a viewer to better understand scientific concepts by observing phenomena that would normally not be visible, like biology and ecology (Pecay, 2017; Wright, 2010). These are some of the advantages visual content, such as scientific videos, have over other types of media.
Scientific video content has also been found to be on par with other types of media in communicating information. Research in fields such as health sciences have concluded that video can lead to significant knowledge increases (Cowdery et al., 2019; Juhong et al., 2022). Additionally, a study on the effects of two different media formats in marine conservation communication efforts found that both a narrated YouTube video and a written text with photos led to significant increases in knowledge, awareness, and motivation, and both media types were found to be suited to reach general audiences (Kolandai-Matchett et al., 2020). Other studies have found that video-based content led to similar increases in knowledge gain when compared to text-based options or other types of visual content such as 360° or virtual reality videos (e.g., Armstrong et al., 2011; Bujić et al., 2021).
This proliferation of scientific videos has occurred mainly due to two types of content: “professionally generated” content and “user generated” content (Erviti and Stengler, 2016). The former, generally built via a collaborative effort between field specialists or entities and video hosting platforms, can be described as having higher quality and being more prone to include advertisements (Gilardi and Lam, 2022; Kim, 2012). It traditionally resembles television content (Gilardi and Lam, 2022), but can take various forms and has been shown to evolve to build on the success of other emerging types of content (Welbourne and Grant, 2016).
On the other hand, “user generated” content is created when members of the public who are not professionals in the field produce visual content (Organisation for Economic Cooperation and Development, 2007), generally using video production media accessible online (Davis and León, 2018). It is characterized by a shorter duration and a moderate quality (Davis and León, 2018), and by being able to invoke a genuine reaction through their characteristic authenticity and mix of information and entertainment (Finkler and León, 2019). They are also known to capture the viewer’s attention through the implementation of elements such as music, narratives, and testimonials (Juslin and Västfjäll, 2008; León and Bourk, 2018).
The narratives included in these types of videos can be designed in an “unscripted, even quirky manner” (Davis and León, 2018, p.7), and are considered easy to process and persuasive (Dahlstrom, 2014). Therefore, they can be used as a tool to captivate an audience’s attention and improve their engagement, comprehension, and information retention of the topics at hand (Huang and Grant, 2020; Dahlstrom, 2014). The existence of a narrative and aspects of storytelling have also previously been associated with the popularity of science user-generated videos (Huang and Grant, 2020).
This type of content provides many opportunities to communicate the topics that surround us in new, innovative ways (Roe, 2014) targeting specific audiences, such as younger age groups. These are shown to be more likely to respond positively to the narration style characteristic of “user generated” videos (Davis et al., 2020), and to other common elements such as testimonials and interview sections (Shiver-Rice et al., 2022). Additionally, in classroom contexts, Finkler et al. (2021) and Martin et al. (2019) have found that when students produce their own scientific content, their interest and engagement levels with the course material increase during the filmmaking process. Despite the challenge for some to deal with technology, it is an effective way to engage students, even leading to work recognition and success online (Rifkin et al., 2010) or in other areas, such as science festivals (Finkler et al., 2021).
“User generated” content has gained popularity partly through the YouTube platform, where it is easily accessible to a wide audience, including these younger age groups (Kohler and Dietrich, 2021) who seem to have a strong presence on the platform. According to surveys conducted by Pew Research Center involving 1,316 US teenagers, aged 13 to 17 years, 95% of them said that they have used YouTube, 77% said they use the platform daily, and 19% mentioned being on YouTube almost constantly (Vogels and Gelles-Watnick, 2023). The platform has become a popular source of scientific information (Erviti and Stengler, 2016; Godwin et al., 2017; Kohler and Dietrich, 2021). Consequently, this introduces some challenges, such as the competition created by the large amount of content being shared (Davis and León, 2018; De Lara et al., 2017) and overexposure to information that can lead to a sense of desensitization on the part of the public (Janpol and Dilts, 2016).
The current study focuses on the communication about marine topics to raise the public’s knowledge, awareness and interest in these ecosystems. To this end, “user generated” videos might be a complementary means to reach target audiences and may also help to find new and better ways to communicate this information (Brennan, 2021; Kohler and Dietrich, 2021). In this regard, previous authors recommended the study of the characteristics of “user generated” content to better understand how it captivates its audience and what effects it has in the cognitive and emotional fields (e.g., Huang and Grant, 2020; Shiver-Rice et al., 2022). Furthermore, the media consumption preferences of the public should be considered to adapt this type of content to the aforementioned challenges (Amarasekara and Grant, 2018; Shiver-Rice et al., 2022).
To contribute to this field, the aim of this study was to evaluate the impact of a “user generated” video on communicating about these science and environmental topics, specifically to young adults. Considering the objectives of this work, two research questions were proposed:
Question 1 – What are the effects of a “user generated” science video and outreach text in the cognitive and emotional fields of young adults?
Question 2 – What is the effect of time after exposure to the media types on the cognitive and emotional fields of young adults?
2 Methodology
2.1 Participants
This study was applied to one hundred and fifty-one participants who, for a matter of convenience, were students enrolled in one of two schools: 2nd and 3rd-year students from a private higher education school, and 1st and 2nd-year students from a public university, both in the Lisbon metropolitan area.
Before the study began, participants were given a copy of an informative flyer regarding the study and were able to ask any questions related to it. Afterward, an informed consent form was also given and signed by participants who agreed with the use of data generated during the study for research purposes.
2.2 Study design
A mixed quantitative and qualitative methodology was applied based on critical and interpretive social science techniques (Cohen et al., 2007; Creswell, 2012), with the use of questionnaires and focus group interviews.
To answer the proposed research questions, a pre-test and post-test were applied before and after exposure to the contents in order to assess the short-term impact on the baseline emotions participants’ felt about the ocean and knowledge they had about the topics. Participants also filled out the same questionnaire three months after the first sampling session, to obtain follow-up data which was considered to be representative of the medium-term impact.
Therefore, data collection took place from January to May 2023 and was gathered in two moments: a first session, where participants in a classroom were randomly assigned one of the two media types – text or video - and were exposed to them individually on a computer; and a second session that occurred three months later, in which participants filled out the same questionnaire to obtain follow-up data. Directly after that second sessions, five to eight participants were invited to participate in each of the four focus group sessions that took place shortly after. A schematic of the study’s experimental design can be seen in Figure 1.
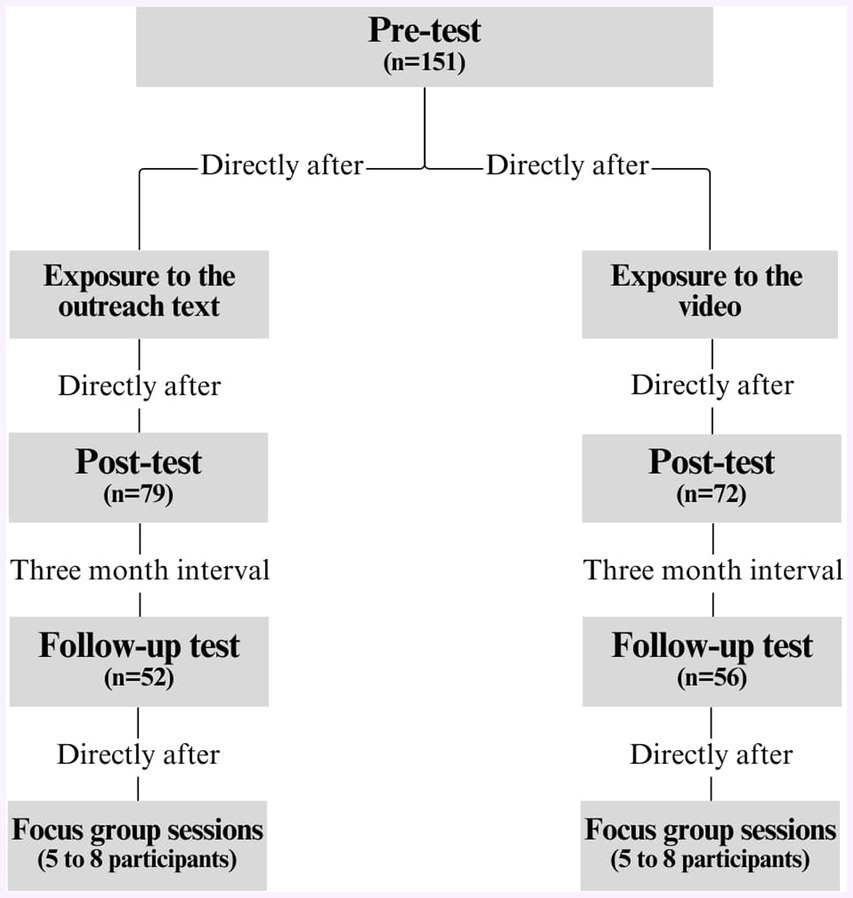
Figure 1. Experimental design.
In all questionnaires applied throughout the study, data was anonymized, as participants were asked to answer a series of questions that led to the creation of a personal code, used to associate answers throughout all surveys to each participant.
The questionnaires were composed of 12 questions and divided into three segments (see Supplementary material). The first group of questions included four multiple-choice questions about knowledge and threats to the ocean. The content provided in both the text and the video had all the necessary information to correctly answer all the items in this segment.
The second segment probed participants on emotions related to the ocean in order to assess the media types’ impact on the emotional field, with questions like: “What emotion or emotions do you feel when you think about the ocean?” and “What other feelings does the ocean arouse in you?”
The third and last segment assessed the impact of the media types on participants’ interest. It was composed of three questions with five-point Likert-scales, which asked participants their level of agreement with specific sentences, like “The ocean influences my quality of life,” by selecting a response from “Completely disagree” to “Completely agree.”
All questionnaires were made available via Google Forms (Google, 2023), and the results were collected by the platform and analyzed in a Microsoft Excel (Microsoft, 2023) spreadsheet. In cases where participants were having difficulties accessing the surveys online, printed copies were made available and subsequent results were inserted into the same spreadsheet.
The four focus group interviews were done with five to eight randomly chosen participants and were held immediately after the second session, for a period of approximately fifteen minutes.
Two focus group sessions were held in each location: one for participants exposed to the outreach text, and one for participants exposed to the video. These four sessions were used to assess the participants’ consumption habits of the type of media they were exposed to during the first phase of the study. Some questions were also asked to get a better understanding of the tendencies in their overall media consumption. The interviews were recorded with the permission of participants, who were referred to only as “Participant 1″, “Participant 2″, and so on, during the transcription process to guarantee anonymized data.
The video shown in the study was an adapted and translated version of a video developed by three students from the 2021/2022 class of the Marine Ecology masters from the Faculty of Sciences of the University of Lisbon, for the “Goods and Services of the Ocean” course. It had a duration of 11 min and 21 s, focused on threats to the marine environment and featured a selection of interviews with volunteers from several countries. This included children and adults of different ages, which offered unique perspectives on their relationship with the ocean. It was entirely edited on freeware software using copyright-free images and music available on the internet, and it can be accessed on YouTube (https://youtu.be/2elkDSd-8ig) and the Dailymotion platform (https://dai.ly/k6yG1NPioMZrNzzzwn8).
On the other hand, the text of outreach (available at Jorge et al., 2024) was based on the video and written by the three authors of this article as a control for this experiment. All three authors are non-professional journalists or writers. This text reports on a fictitious meeting at the University of Lisbon to celebrate World Ocean Day and the 2022 United Nations Ocean Conference, held in Lisbon. Therefore, to enable a comparison between two “user generated” media content, the text features the same topics and information as the video and was designed to be read in about 8 min.
2.3 Data analysis
The answers for all questions were organized in Microsoft Excel (Microsoft, 2023), and data sets were created for each question. Data that was not correctly paired between the pre and post-test, and the former and the follow-up test, were removed from the sample.
Multiple-choice questions were analyzed according to the number of correct answers each participant achieved.
Content analysis for question 7 separated responses between those that contained positive feelings (e.g., “calm,” “curiosity,” etc.), and those that contained negative feelings (e.g., “worry,” “anxiety,” etc.). As for the focus groups, interviews were recorded with audio hardware and fully transcribed in a Microsoft Word file (Microsoft, 2023). Content analysis of the answers was done by creating categories for the different types of answers, such as for their media consumption preferences, tendencies, and other information considered relevant (see Supplementary material for more details).
For the data from both question 7 and the focus groups, content analysis was performed by the first author and reviewed by the second and third authors, using both inductive and deductive procedures in order to best adapt the categories proposed to the data obtained in the study.
Statistical analysis was performed in SPSS software, version 27 (IBM Corporation, 2020). Across all statistical tests performed, a significance level of 0.05 was considered.
The totality of the data for all questions was submitted to a Shapiro–Wilk test (Shapiro and Wilk, 1965) to test the normality of its distributions. The results for these tests showed p-values smaller than 0,001 for the entirety of the data for both media types across the three questionnaires. Therefore, since normality within the data was not met, non-parametric statistical methods were used.
Taking this into account, Wilcoxon signed-rank tests (Wilcoxon, 1945) were performed on the data for both media types for all questions to test if there were statistically significant differences between the questionnaires’ results. Additionally, McNemar’s tests (McNemar, 1947) were also applied on the data sets that featured binary data, in cases where the responses were categorized in terms of presence or absence – such as questions 5 to 9. This aimed to strengthen the analysis, as it has been suggested by studies such as Adedokun and Burgess (2012) to be an appropriate way to “examine the pre-test and post-test differences in dichotomous items.” Finally, a Mann–Whitney U test (Mann and Whitney, 1947) was performed for the data from the questions related to the impact on participants’ cognitive field to directly analyze if the difference in media type was responsible for the changes in the number of correct answers between the pre, post, and follow-up tests.
3 Results
3.1 Cognitive field
The average number of correct answers in the section of the questionnaires pertaining to the impacts on knowledge retention indicates that exposure to both media types led to increases in knowledge, with the post-test showing a higher average of correct answers than the follow-up test (Table 1).
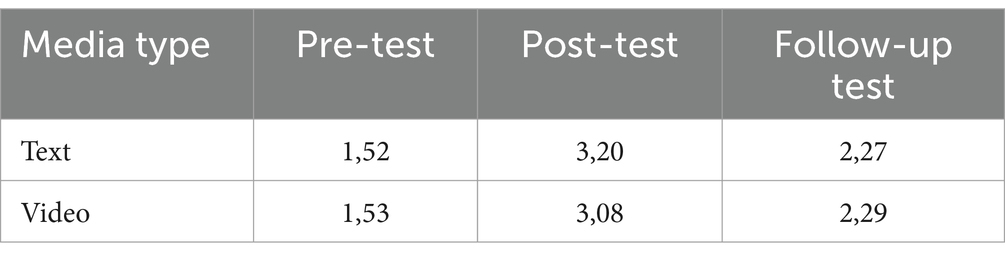
Table 1. Average number of correct answers in the “cognitive field” section of the questionnaires.
As expected in the pre-test, the average number of correct answers in both media is very similar (Table 1 and Figure 2A).
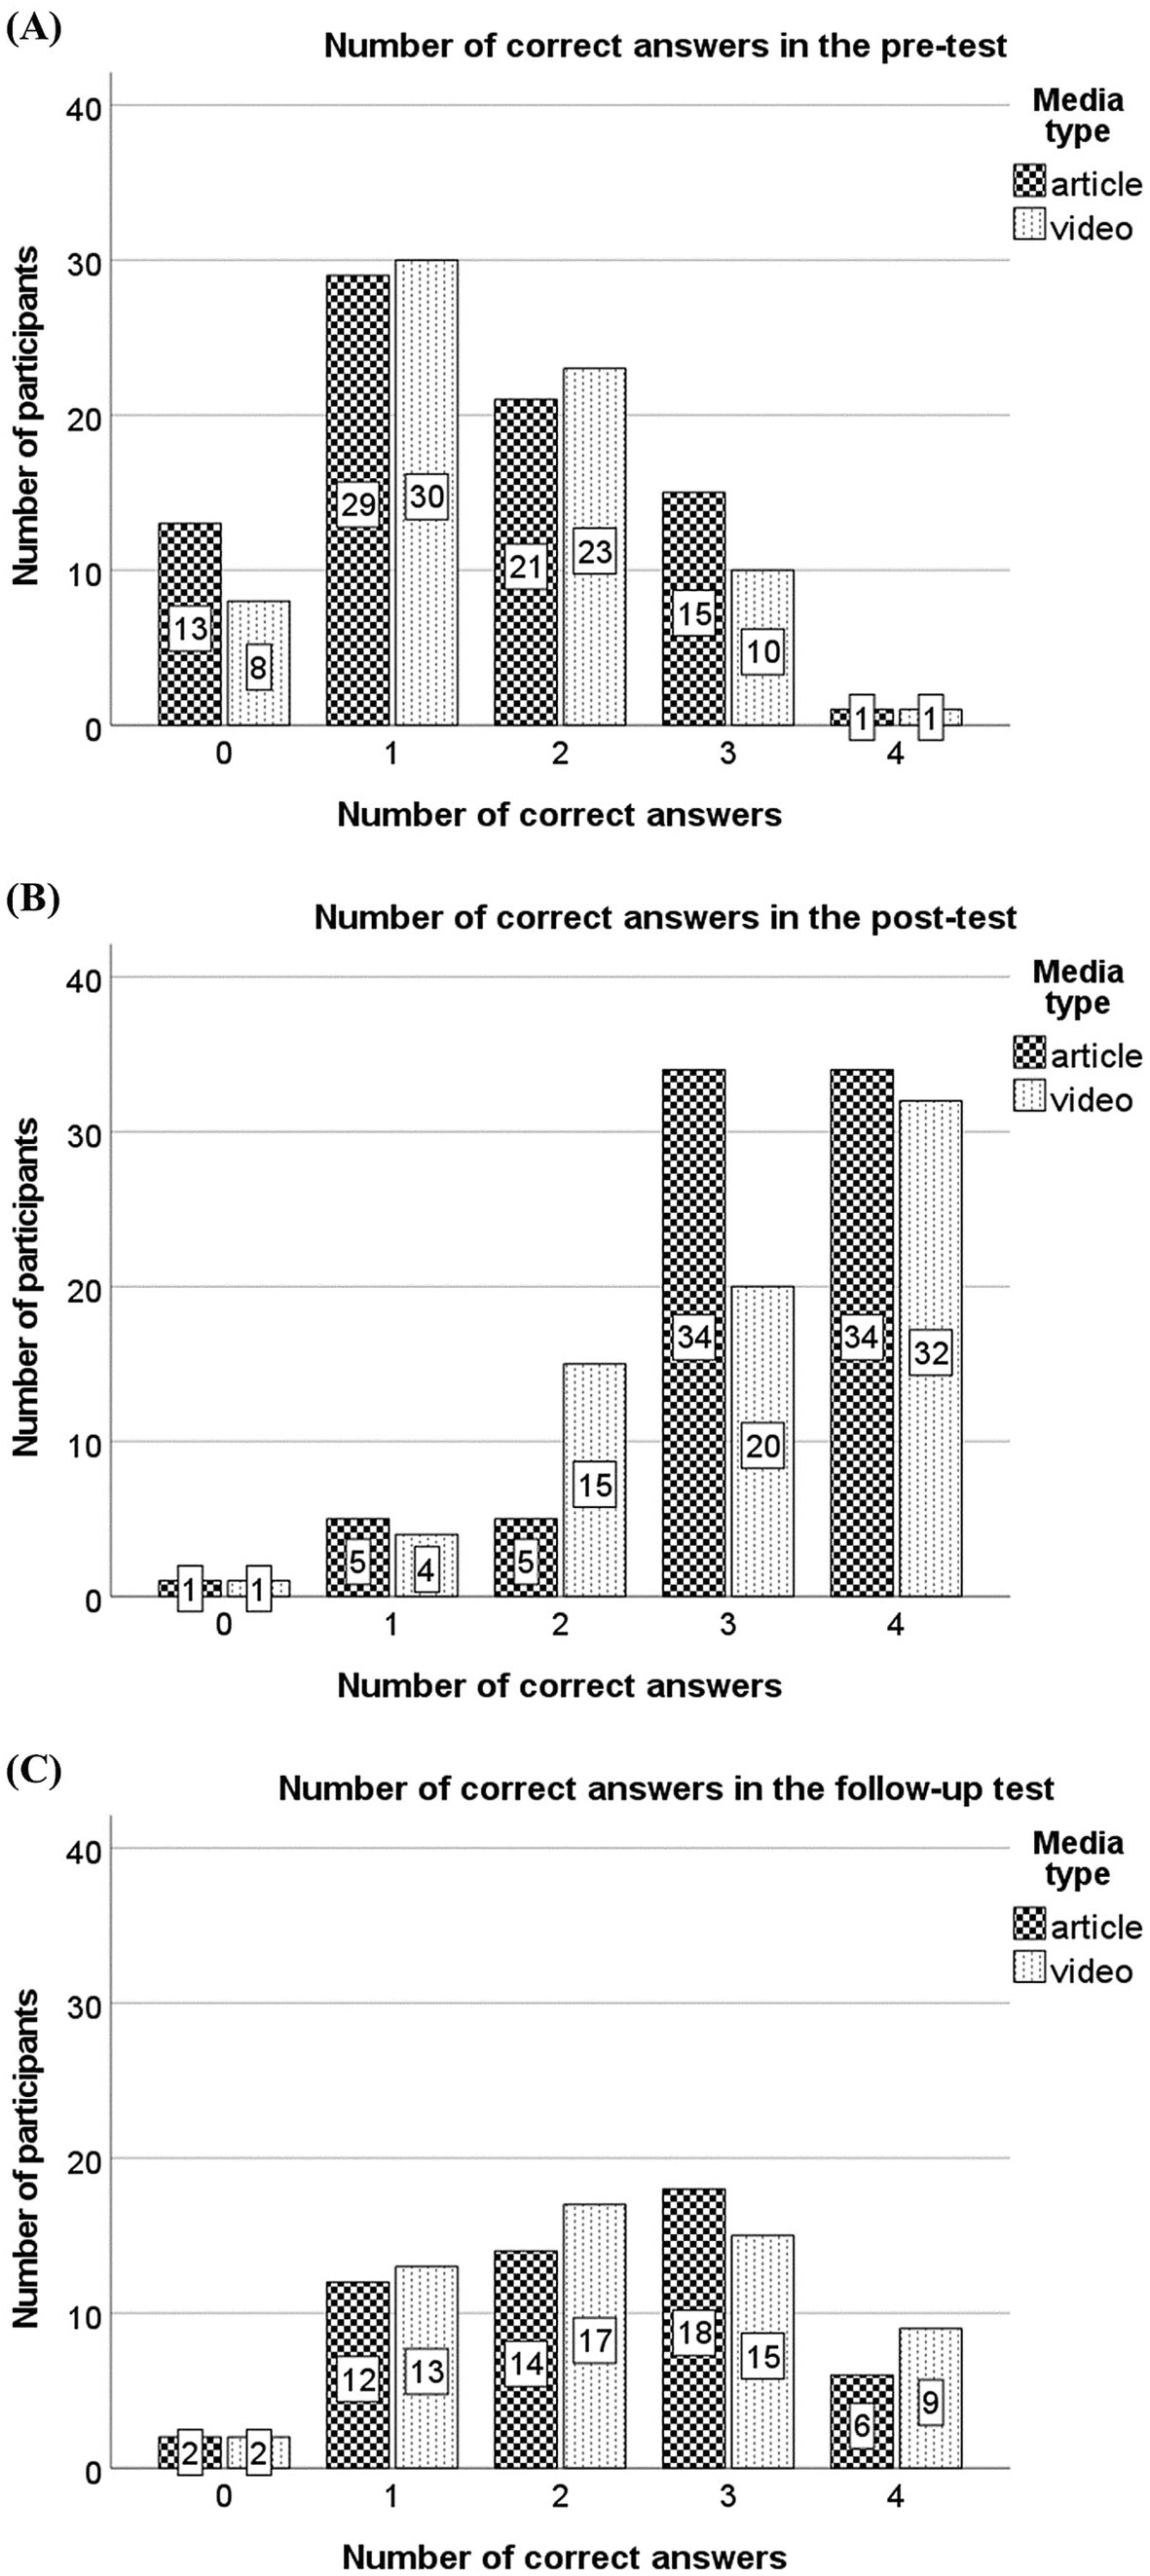
Figure 2. Number of correct answers in the “cognitive field” section of the questionnaires in the pre-test (A), post-test (B), and follow-up test (C).
In the post-test, the average number of correct answers increased, with 3.20 for the text group and 3.08 for the video group (Table 1). Most participants answered three or all the questions correctly, and only one participant from each group did not select a correct answer for any of the questions (Figure 2B).
Also, for the follow-up test results, the average number of correct answers (Table 1) was higher than the pre-test but lower than the post-test, with averages of 2.27 for the text data and 2.29 for the video data. Indeed, most participants answered either one, two, or three of the questions correctly, and only two participants from each group of media content did not select a correct answer in their questionnaires (Figure 2C).
The results obtained from the Wilcoxon signed-ranks test applied to this section of the data showcased statistically significant p-values for the differences in the number of correct answers in text group, in the short-term (Z = -6.987 and p < 0.001) and in the medium-term (Z = -3.734 and p < 0.001) and also in the video group, in the short-term (Z = -6.515 and p < 0,001) and in the medium-term (Z = -3.935 and p < 0.001).
The results of the Mann–Whitney U test did not showcase statistically significant differences between both media types in the short-term (U = 2,686 and p = 0,528) or the medium-term (U = 1,453 and p = 0,985). As such, there is no evidence that the difference in media type was the cause of any significant differences when it came to the magnitude of the improvement shown. Nevertheless, both seem to have led to a significant improvement in the participant’s performance on the multiple-choice questions of this portion of the questionnaire.
3.2 Emotional field
For question 5 (“What emotion or emotions do you feel when you think of the ocean?”), “Joy,” “Sadness,” “Fear” and “Surprise” were the emotions most selected by participants, with “Joy” being the most selected across all questionnaires (Table 2).
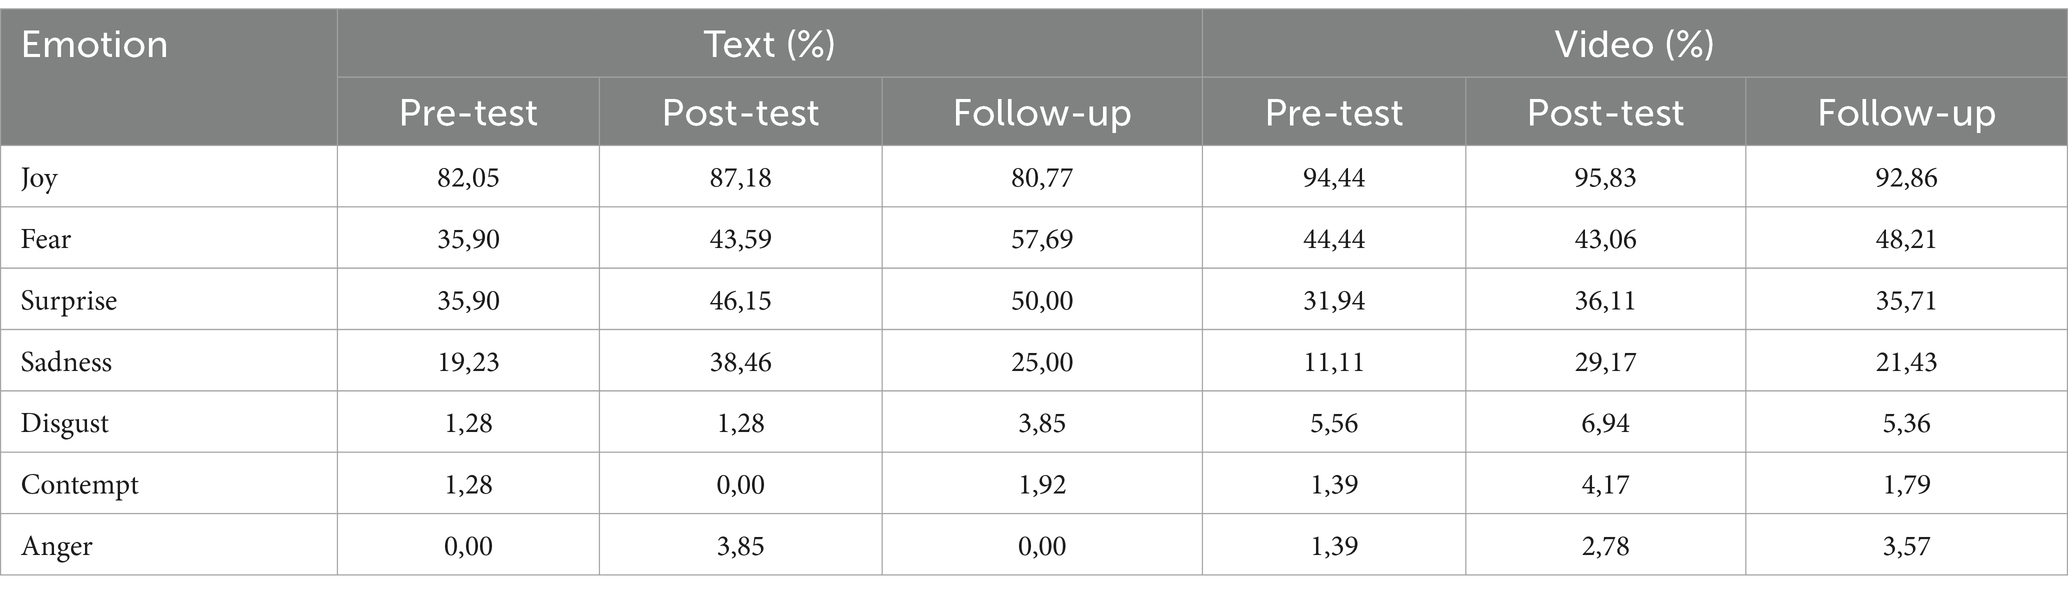
Table 2. Percentage of answers to question 5 in which each emotion type was registered across all questionnaires.
Between the two media types, the responses of participants exposed to the video exhibited higher percentages of occurrence of the emotion “Joy” in the short-term and medium-term. Meanwhile, “Sadness” and “Surprise” were more prevalent in the short and medium-term in the group exposed to the text.
When it came to “Fear” it was registered in a similar percentage of answers in both groups during the post-test. However, it became more prevalent in answers from participants who read the text in the follow-up test.
Regarding the data from the group exposed to the text, the results of the Wilcoxon signed-ranks test and McNemar’s test indicated that only the scores for “Sadness” between the pre-test and the post-test (Z = -3,273 and p = 0,001 for the Wilcoxon signed-ranks test, and p = 0,001 for the McNemar’s test), for “Fear” between the pre-test and the follow-up test (Z = -2,309 and p = 0,021 for the Wilcoxon signed-ranks test and 0,039 for the McNemar’s test) and for “Surprise” between the pre-test and the post-test (Z = -2,309 and p = 0,021 for the Wilcoxon signed-ranks test and p = 0,039 for the McNemar’s test) were significantly different.
The results of the group exposed to the video suggest that the only statistically significant difference between questionnaires was for the emotion “Sadness” between the pre and the post-test (Z = -3,606 and p < 0.001 for the Wilcoxon signed-ranks test, and p < 0.001 for the McNemar’s test).
All the mentioned significant differences correspond to increases in the percentage of answers that contained said emotion (Table 2). Therefore, it can be argued that the text’s impact led to an increase in the selection of the emotions “Sadness” and “Surprise” in the short-term and “Fear” in the medium-term, whilst the video’s impact only led to an increase in “Sadness” answers in the short-term.
For question 6 [“Score the following emotions from 1 to 7 in relation to how much you associate them to the ocean” (with 1 being “I do not associate it” and 7 being “I associate it a lot”)], “Joy,” “Sadness,” “Fear” and “Surprise” were once again the emotions that showed a higher average score, with “Joy” also being the emotion with the highest across all three questionnaires.
Additionally, for every other emotion, the averages from the text group were higher than those of the video group, including for the emotions that already showed higher percentages of occurrence in the text group in the previous question. The only exception to this is the averages for “Fear,” where the group exposed to the video displays a higher average, which becomes smaller than that of the text group after exposure to the media types.
Based on the results for the Wilcoxon signed-ranks test, it is possible to determine that significant differences are, in the case of the text, an increase in the average of scores for “Sadness” in the short-term (Z = -2.065 and p = 0.039), whilst the video’s impact led to an increase in “Joy” scores in the short-term (Z = -3.128 and p = 0.002), but also a decrease in “Fear” (Z = -2.765 and p = 0.006) and “Disgust” (Z = -2.111 and p = 0.035) scores also in the short-term.
Regarding the answers to question 7 (“What other feelings does the ocean arouse in you?”), participants who mentioned positive feelings were the most common throughout the study. When it comes to feelings categorized as negative, these were recorded less frequently (Table 3).
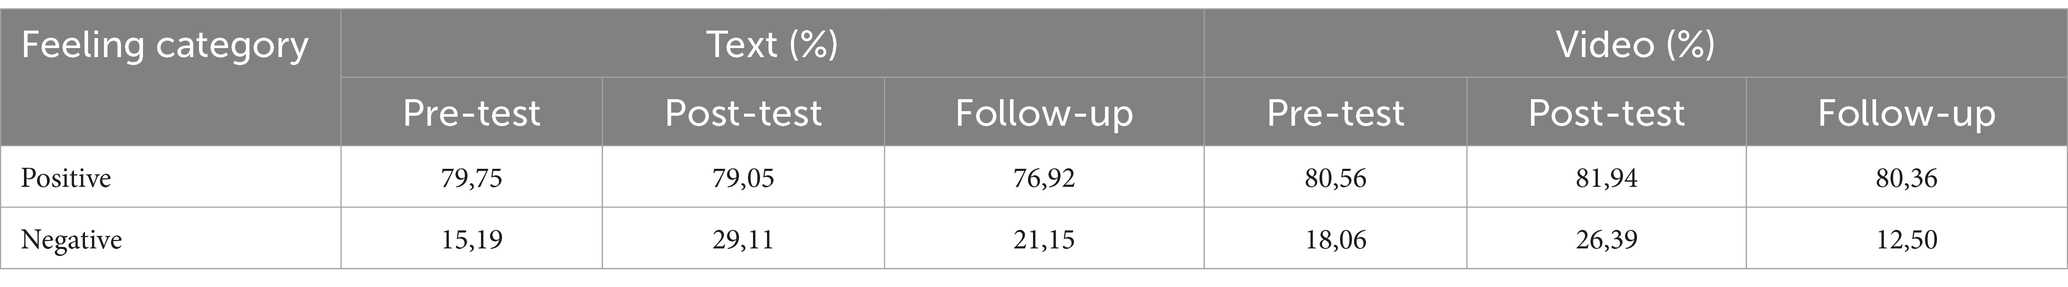
Table 3. Percentage of answers that included feelings categorized as positive and feelings categorized as negative for question 7.
Some of the feelings most mentioned by the participants, featured in Table 4, were “curiosity,” “calm,” “tranquility,” and “peace,” which were all categorized as positive. Of the negative feelings mentioned, the most prevalent were “anxiety,” “worry” and “melancholy.”
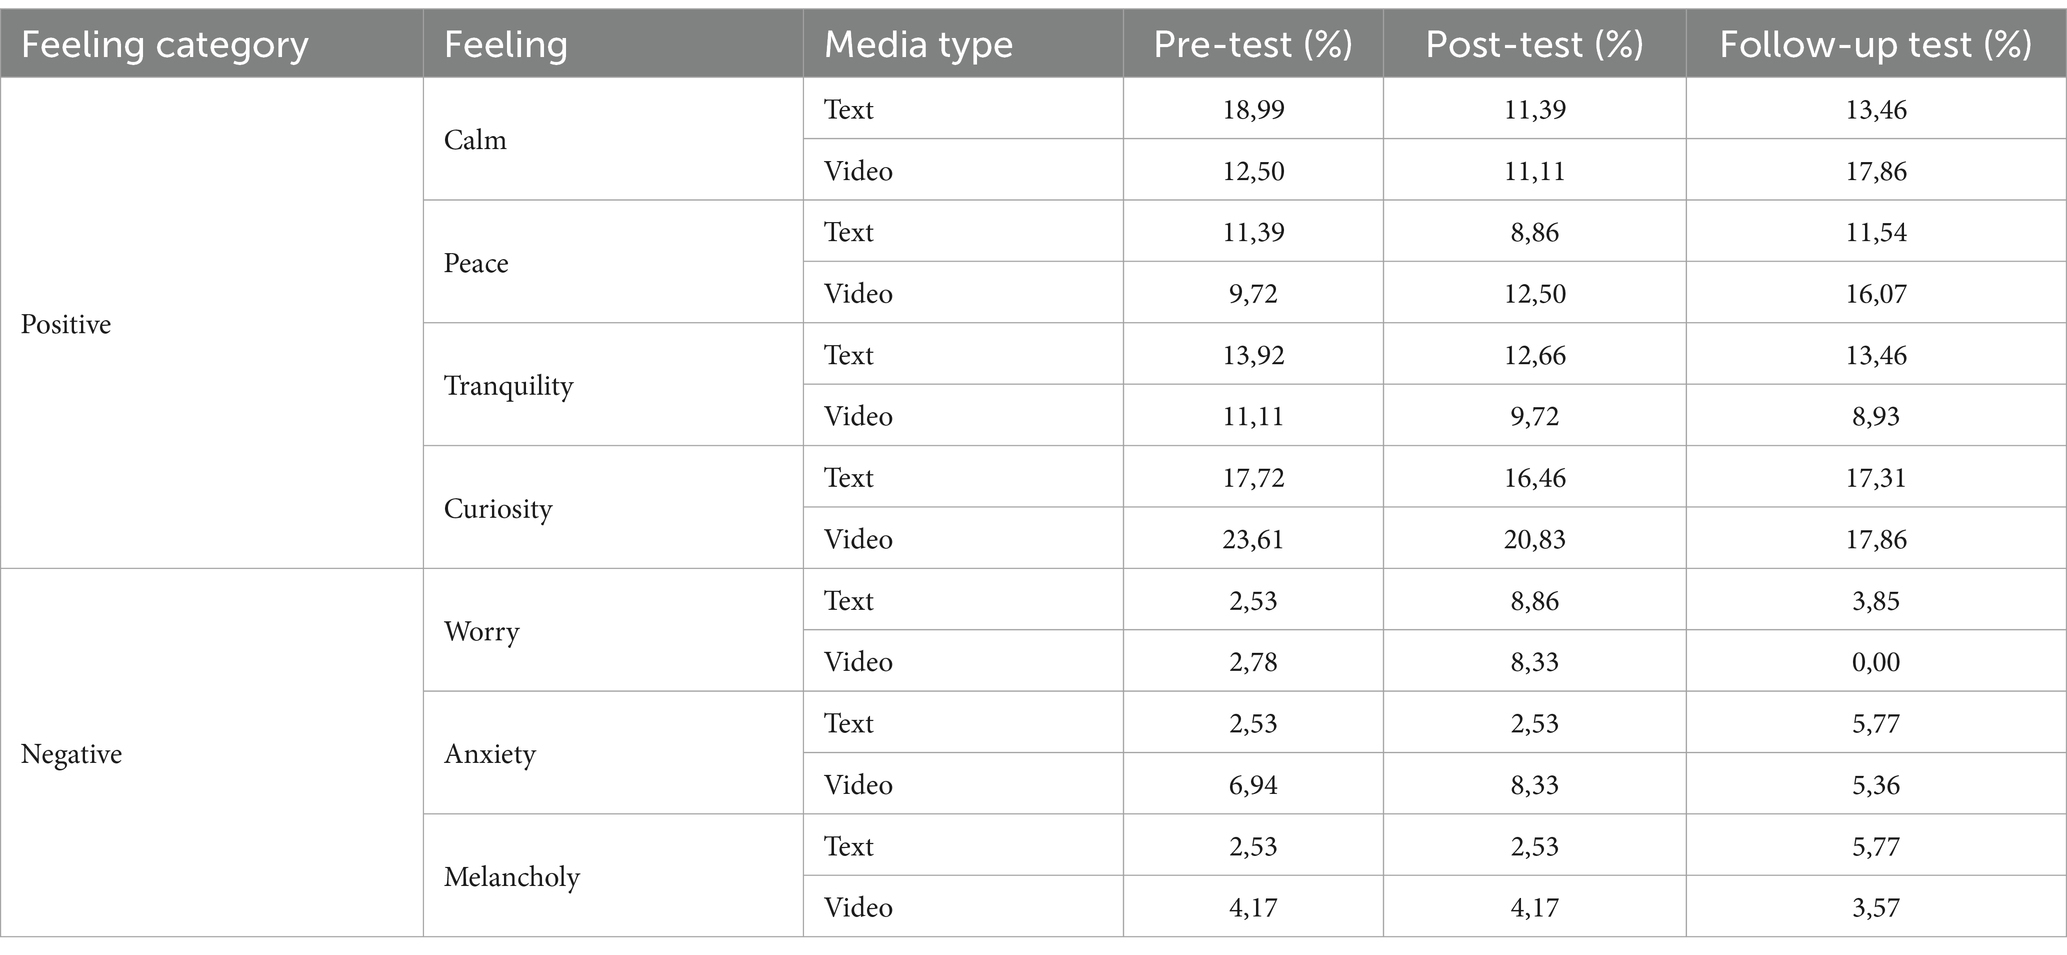
Table 4. Percentage of answers that included the featured feelings in the answers to question 7, by media type.
The results for both the Wilcoxon signed-ranks test and the McNemar’s test suggest that the only statistically significant difference was for the number of answers given by participants exposed to the text that included negative feelings between the pre-test and the post-test (Z = -2.668 and p = 0.008 for the Wilcoxon signed-ranks test; p = 0.013 for the McNemar’s test).
This statistically significant difference in the data from the text corresponds to an increase from 15.19% of answers containing a negative feeling in the pre-test to 29.11% in the post-test (Table 3). Therefore, although there were fluctuations in the percentages presented, the only media type to cause a statistically significant difference was the text, and only for an increase in negative feelings between the pre-test and the post-test.
3.3 Participants’ interest
By looking at the average of the scores for the sentence from question 10 (“The ocean influences my quality of life”) it is possible to see that the scores given were slightly higher in the group of participants who were exposed to the video, except in the follow-up test, where the average for the scores in the group exposed to the text was higher (Table 5). These differences were statistically significant in both the short-term (Z = -3.286 and p < 0.001) and the medium-term (Z = -3.300 and p < 0.001) in the text group, and the video group showed statistically significant differences only in the short-term (Z = -2.307 and p = 0.021).

Table 5. Averages of scores given by participants, with Likert Scale (1 - “Completely disagree” to 5 - “Completely agree”), in questions 10, 11, and 12.
As for the average of the scores given by participants across the questionnaires to the affirmation in question 11 (“I consider myself to be informed regarding the impact of climate change on the ocean”), the average scores from the group exposed to the text were higher than the scores given by participants who were exposed to the video in all three questionnaires (Table 5). Additionally, the text group returned statistically significant differences in the short-term (Z = -3.397 and p < 0.001) and the medium-term (Z = -2.635 and p = 0.008), and the video group revealed statistically significant differences only in the short-term (Z = -2,477 and p = 0,013).
Finally, for question 12 (“I am interested in taking more action in order to improve the current state of the ocean”), the average scores from the text group were also higher than those of the video group in all three questionnaires (Table 5), and both the text group (Z = -2.673 and p = 0.008) and the video group (Z = -2.524 and p = 0.012) returned statistically significant differences only in the short-term.
It is possible to see that exposure to both media types led to increases in the average of scores given by participants to the affirmations in questions 10 and 11, both in the short and medium-term. However, for question 12, even though exposure led to increases in the short-term, slight decreases were registered in the medium-term (Table 5).
All the significant differences corresponded to increases in the average of scores given by participants (Table 5). Therefore, both types of media impacted participants’ interest and led to participants picking higher-ranked answers, such as “Agree” and “Completely agree,” in the short-term, and on two occasions exposure to the text also led to a significant increase in the medium-term.
3.4 Focus groups
In general, the media consumption trends of the participants of the focus group sessions seem to have a high variation from person to person, depending on their unique needs. While some participants preferred watching videos and said they usually retain information better through this type of media, others preferred reading articles or other text content and mentioned being able to get more information this way.
Several participants mentioned that they prefer short content since longer materials do not hold their attention, especially in visual media. One of the participants said:
I feel that (…) with social media nowadays we don’t have a lot of attention span anymore (…) sometimes with very big videos, I don’t have the patience to watch them (Participant 20).
Another participant added:
If it is a very long video that doesn’t have a visual impact, and that does not catch the viewers’ attention, I’ll lose [interest] (Participant 22).
Besides the planned questions, some participants mentioned other aspects of both media types that they considered important. In the case of outreach texts, some mentioned that the title and images are crucial. As for videos, participants mentioned that a high-quality video and audio and the way the presenter speaks are crucial to maintaining interest. One of the said participants stated their opinion as follows:
It has a lot to do with the intonation that [the presenter] has in the voice, the emphasis, and the inflections of the voice. If it is a monotone person, even if they have experience in the area, (…) we’re not listening to anything (Participant 7).
It is also noteworthy to mention that some participants expressed a preference for professionally generated videos or other types of content from official sources, such as nature documentaries or scientific articles, to the one they were exposed to during the study.
4 Discussion
4.1 Cognitive and emotional fields
Both tested media were effective in increasing the knowledge of participants about the ocean, with no significant differences in the averages of correct answers between them. As such, it can be concluded that they were both effective and similar in the increase of the knowledge of participants about the ocean. Moreover, both media types had a stronger impact on participants’ cognitive field in the short-term than in the medium-term. Despite the scarcity of research on the medium-term effects of these specific types of media on the cognitive field, it could be suggested that participants forgot some of the information gained through exposure during the 3 months between the first and second sessions.
These findings are aligned with other studies that have analyzed the impact of online videos in comparison to other media types. For example, Armstrong et al. (2011) registered in their study on the effects of exposure to a video and a pamphlet that both types of media led to a similar increase in knowledge. As another example, Bujić et al. (2021) also found that the effects of an article, a 360° video, and a virtual reality video, led to knowledge increases in the three types of media, with no statistically significant differences between them. Additionally, Kolandai-Matchett et al. (2020) also reported that a narrated YouTube video and a written text with photos led to significant increases in knowledge.
Furthermore, there are studies in other areas, such as health sciences, which have analyzed solely the impact of a video and add evidence to the claim that video can be a very powerful tool to improve knowledge, with statistically significant knowledge increases (Cowdery et al., 2019; Juhong et al., 2022). Meanwhile, other studies concluded that audiovisual contents can provide a better learning experience than other text-based alternatives (e.g., Chen and Wang, 2011; Van der Meij and Van der Meij, 2014). Nevertheless, in the current study and other mentioned literature, the increase of knowledge was similar to reading a text.
The obtained results also suggest that the “user generated” video had a greater impact on emotions and feelings of positive valence when compared to the outreach text and might have also had an impact in mitigating those of negative valence.
Regarding the increase in “Joy” and decrease in “Fear” and “Disgust” from participants exposed to the video, these may have been caused by several of the characteristic elements of a “user generated” video. This may have invoked a genuine reaction in participants that allowed them to connect with the material (Finkler and León, 2019). These elements include captivating clips and interviews (Shiver-Rice et al., 2022), and the upbeat and inspirational music included, which can induce emotions in viewers (Juslin and Västfjäll, 2008). This might have contributed to the obtained results, as well as to a higher overall occurrence of positive feelings in all questions in the group exposed to the video.
On the other hand, the reported increases for the emotions “Sadness” in both media types and “Surprise” in the text group might be because participants gained a better understanding of the current state of the ocean, the threats it faces, and how their daily actions might impact the ocean.
The dominance of positive feelings in the group exposed to the video is congruent with Chen and Wang (2011), who found that between three different media (static text and images, video-based content, and animated multimedia content) the video-based content led to the biggest surge in positive emotions.
There are also other comparative studies that have noted that exposure to news articles led to a bigger increase in negative emotions when compared with other types of media, such as virtual reality videos (Bujić et al., 2021). These findings also match the results obtained in this study, where the group exposed to the outreach text showed a higher percentage of answers containing negative feelings after exposure to the content.
4.2 Participants’ interest and preferences
Exposure to both media types led to significant increases in the interest in marine issues in the short-term. Additionally, exposure to the text led to significant increases in the medium-term.
The fact that participants showed high levels of interest in these topics is concurrent with data obtained from surveys conducted by the European Commission that targeted 38 countries (European Commission, 2021), where 82% of participants showed to be interested in science and technology. Additionally, data from the same surveys indicated that a large majority of respondents believed that young people’s interest in scientific topics is crucial for societal prosperity (European Commission, 2021). Therefore, the results obtained here may indicate that both types of content are appropriate to increase young adults’ interest for these topics, which could be very beneficial for future societal developments.
Also, several of the participants that partook in the focus group sessions mentioned that a video must have certain characteristics to be interesting enough. Examples of these are good audio and video quality and other elements like a captivating narrative or audio cues. This partially matches with the results of Shiver-Rice et al. (2022), which found that these aspects were important in short videos for young adult engagement, along with a direct address and the inclusion of interviews.
Participants reported vastly different tendencies in media consumption observed, both in terms of the origin of content they prefer and the duration of the content they usually watch. The disparity in the participants’ responses may be a sign that their retention of information is influenced by external and intrinsic factors. This suggests that there is no single global solution to convey information to all participants and that the use of several media to communicate the same message is recommended.
4.3 Limitations of this study
First of all, to better understand the true potential of “user generated” video and its impact in the cognitive and emotional fields, a wide variety of age and socio-economic groups should be studied. Our research has the limitation of only including university students, which represent a part of this large spectrum. A more varied sample would enable a better comparison between a “user generated” video and different media. Furthermore, the impact of “user generated” video should be compared to other types of videos, such as “professionally generated” videos, or other types of media, such as scientific articles or podcasts, in order to better understand it’s true potential.
Overall, due to the longitudinal design of this study, it was not possible to account for all participants in the second session. Additionally, in the 3 months between the first and second sessions, participants may have been exposed to other types of content related to the topics, which could have led to external factors influencing their answers to the follow-up test. However, this type of bias is inevitable in studies with this methodological design.
Finally, the focus groups’ small size and short duration may lead to any conclusions derived from their contents not being representative of the group in question. Additionally, the sessions could have been used to complement other results such as the cause of participants feeling specific emotions during exposure, but since this was not possible due to the lack of time, the cause of these feelings is left ambiguous.
5 Conclusion
The results obtained suggest that a “user generated” video is a viable option to communicate about marine environmental threats, in particular to young adults. The outreach text and the “user generated” video had similar effects on the cognitive field in both the short and medium-term, showing significant knowledge increases with no statistically significant differences between them. As for the emotional field, exposure to the “user generated” video led to bigger increases in the occurrence of the emotion “Joy” and decreases in emotions such as “Fear” and “Disgust,” and whilst exposure to both media types led to the mentioning of positive feelings across the study, only the text group showcased a significant increase in negative feelings in the short-term. Therefore, it could be said that the video had a bigger impact than the text in promoting positive emotions and feelings.
Moreover, exposure to both media types led to increases in participants’ interest in the topics approached in the short-term. However, the reading of the text led to statistically significant differences in the medium-term that exposure to the video did not, such as in participants’ understanding of the deep influence the ocean has on their lives and the degree to which they consider themselves to be informed regarding the impact of climate change on the ocean.
Considering that the evolution of media calls for new, compelling ways of relaying information that engage audiences and capture their attention, these results add evidence to the claim that “user generated” videos have the characteristics to be a suitable way of improving knowledge about science and environmental themes such as marine issues, all whilst promoting positive feelings for the viewer. This could be particularly beneficial to reach certain target audiences. Since younger age groups, such as teenagers and young adults, seem to be the most prone to be exposed to it, “user generated” content seems suitable to communicate scientific information to this audience, as long as it is paired with an ability to adapt to consumption habits and preferences. Therefore, when used to its full potential, this type of media can be a valuable instrument for the ever-evolving world of science communication as well as to raise awareness for marine sustainability.
Data availability statement
The raw data supporting the conclusions of this article will be made available by the authors, without undue reservation.
Ethics statement
The studies involving humans were approved by Ethics Committee of the Faculty of Sciences of the University of Lisbon. The studies were conducted in accordance with the local legislation and institutional requirements. The participants provided their written informed consent to participate in this study. Written informed consent was obtained from the individual(s) for the publication of any potentially identifiable images or data included in this article.
Author contributions
MJ: Conceptualization, Data curation, Formal analysis, Investigation, Methodology, Project administration, Resources, Software, Validation, Visualization, Writing – original draft, Writing – review & editing. BP: Conceptualization, Funding acquisition, Methodology, Project administration, Resources, Supervision, Visualization, Writing – review & editing. DB: Conceptualization, Methodology, Project administration, Resources, Supervision, Visualization, Writing – review & editing.
Funding
The author(s) declare that financial support was received for the research, authorship, and/or publication of this article. This publication was financed by the Fundação para a Ciência e a Tecnologia (FCT) through the project UIDP/04292/2020 (doi: 10.54499/UIDP/04292/2020), UIDB/04292/2020 (doi: 10.54499/UIDB/04292/2020), awarded to MARE and through project LA/P/0069/2020 (doi: 10.54499/LA/P/0069/2020) granted to the Associate Laboratory ARNET. The second author was financed by the Scientific Employment Stimulus program (CEECIND/03059/2017).
Acknowledgments
We thank the participants of this study for partaking in it. We would also like to thank Vanda Brotas, José Lino Costa, Romana Santos and Filomena Maria Moreira da Silva and their respective institutions, the Faculty of Sciences of the University of Lisbon and Escola Superior de Educação João de Deus, for their availability in helping to reach possible participants. The contents of this manuscript have previously appeared online, as part of a thesis project listed in the reference list as Jorge (2024).
Conflict of interest
The authors declare that the research was conducted in the absence of any commercial or financial relationships that could be construed as a potential conflict of interest.
Publisher’s note
All claims expressed in this article are solely those of the authors and do not necessarily represent those of their affiliated organizations, or those of the publisher, the editors and the reviewers. Any product that may be evaluated in this article, or claim that may be made by its manufacturer, is not guaranteed or endorsed by the publisher.
Supplementary material
The Supplementary material for this article can be found online at: https://www.frontiersin.org/articles/10.3389/fcomm.2024.1461940/full#supplementary-material
References
Adedokun, O. A., and Burgess, W. D. (2012). Analysis of paired dichotomous data: a gentle introduction to the McNemar test in SPSS. J. MultiDiscip. Eval. 8, 125–131. doi: 10.56645/jmde.v8i17.336
Amarasekara, I., and Grant, W. J. (2018). Exploring the YouTube science communication gender gap: a sentiment analysis. Public Underst. Sci. 28, 68–84. doi: 10.1177/0963662518786654
Armstrong, A. W., Idriss, N. Z., and Kim, R. H. (2011). Effects of video-based, online education on behavioral and knowledge outcomes in sunscreen use: a randomized controlled trial. Patient Educ. Couns. 83, 273–277. doi: 10.1016/j.pec.2010.04.033
Beyer, J., Trannum, H. C., Bakke, T., Hodson, P. V., and Collier, T. K. (2016). Environmental effects of the Deepwater horizon oil spill: a review. Mar. Pollut. Bull. 110, 28–51. doi: 10.1016/j.marpolbul.2016.06.027
Brennan, E. B. (2021). Why should scientists be on YouTube? It’s all about bamboo, oil and ice cream. Front. Commun. 6:586297. doi: 10.3389/fcomm.2021.586297
Bujić, M., Salminen, M., and Hamari, J. (2021). Effects of immersive media on emotion and memory: an experiment comparing article, 360-video, and virtual reality. Int. J. Human Comp. Stud. 179:103118. doi: 10.1016/j.ijhcs.2023.103118
Chen, C., and Wang, H. (2011). Using emotion recognition technology to assess the effects of different multimedia materials on learning emotion and performance. Libr. Inf. Sci. Res. 33, 244–255. doi: 10.1016/j.lisr.2010.09.010
Cowdery, J. E., Powell, J. H., Fleming, Y. A., and Brown, D. L. (2019). Effectiveness of a short video-based educational intervention on factors related to clinical trial participation in adolescents and young adults: a pre-test/post-test design. Trials 20:7. doi: 10.1186/s13063-018-3097-2
Creswell, J. W. (2012). Educational research: Planning, conducting and evaluating quantitative and qualitative research. London: Pearson.
Dahlstrom, M. F. (2014). Using narratives and storytelling to communicate science with nonexpert audiences. Proc. Natl. Acad. Sci. 111, 13614–13620. doi: 10.1073/pnas.1320645111
Davis, L., Fähnrich, B., Nepote, A. C., Riedlinger, M., and Trench, B. (2018). Environmental communication and science communication – conversations, connections and collaborations. Environ. Commun. 12, 431–437. doi: 10.1080/17524032.2018.1436082
Davis, L. S., and León, B. (2018). “New and old narratives: changing narratives of science documentary in the digital environment” in Communicating science and technology through online video: Researching a new media phenomenon. eds. B. León and M. Bourk (London: Routledge), 55–63.
Davis, L. S., León, B., Bourk, M., and Finkler, W. (2020). Transformation of the media landscape: infotainment versus expository narrations for communicating science in online videos. Public Underst. Sci. 29, 688–701. doi: 10.1177/0963662520945136
De Lara, A., García-Avilés, J. A., and Revuelta, G. (2017). Online video on climate change: a comparison between television and web formats. J. Sci. Commun. 16:A04. doi: 10.22323/2.16010204
De Mitcheson, Y. J. S., Linardich, C., Barreiros, J. P., Ralph, G. M., Aguilar-Perera, A., Afonso, P., et al. (2020). Valuable but vulnerable: over-fishing and under-management continue to threaten groupers so what now? Mar. Policy 116:103909. doi: 10.1016/j.marpol.2020.103909
Erviti, M. C., and Stengler, E. (2016). Online science videos: an exploratory study with major professional content providers in the United Kingdom. J. Sci. Commun. 15:A06. doi: 10.22323/2.15060206
European Commission (2021). Europeans strongly support science and technology according to new Eurobarometer survey. Brussels, September: Report.
Finkler, W., and León, B. (2019). The power of storytelling and video: a visual rhetoric for science communication. J. Sci. Commun. 18:A02. doi: 10.22323/2.18050202
Finkler, W., Medvecky, F., and Davis, L. S. (2021). Environmental immersion and mobile filmmaking for science education: a New Zealand pilot study. Interdiscip. J. Environ. Sci. Educ. 17:e2228. doi: 10.29333/ijese/9155
Gilardi, F., and Lam, C. (2022). New perspective on UGC, PGC and OGC: motivating factors of Chinese co-creators’ engagement with international television series. Creat. Indust. J., 1–16. doi: 10.1080/17510694.2022.2150816
Godwin, H. T., Murtaza, K., and Peter, Y. (2017). The educational potential of YouTube. Acad. Psychiatry 41, 823–827. doi: 10.1007/s40596-017-0809-y
Griggs, G., and Reguero, B. G. (2021). Coastal adaptation to climate change and sea-level rise. Water 13:2151. doi: 10.3390/w13162151
Harrould-Kolieb, E. R., and Herr, D. (2012). Ocean acidification and climate change: synergies and challenges of addressing both under the UNFCCC. Clim. Pol. 12, 378–389. doi: 10.1080/14693062.2012.620788
Henson, S. A., Beaulieu, C., Ilyina, T., Jogn, J. G., Long, M., Séférian, R., et al. (2017). Rapid emergence of climate change in environmental drivers of marine ecosystems. Nat. Commun. 8:1. doi: 10.1038/ncomms14682
Hoegh-Guldberg, O., Mumby, P. J., Hooten, A. J., Steneck, R. S., Greenfield, P., Gomez, E., et al. (2007). Coral reefs under rapid climate change and ocean acidification. Science 318, 1737–1742. doi: 10.1126/science.1152509
Huang, T., and Grant, W. J. (2020). A good story well told: storytelling components that impact science video popularity on YouTube. Front. Commun. 5:581349. doi: 10.3389/fcomm.2020.581349
Janpol, H. L., and Dilts, R. (2016). Does viewing documentary films affect environmental perceptions and behaviors? Appl. Environ. Educ. Commun. 15, 90–98. doi: 10.1080/1533015X.2016.1142197
Jorge, M. (2024). Assessment of the impact of a ‘user-generated’ video in the communication of marine environmental threats to higher education students. [master’s thesis]. Lisboa, PT: University of Lisbon.
Jorge, M., Pinto, B., and Boaventura, D. (2024). World oceans day - text of outreach. Figshare. doi: 10.6084/m9.figshare.26152696
Juhong, J., Mordmuang, A., Jewboonchu, J., and Udomwech, L. (2022). Effectiveness of an online educational video intervention to improve the knowledge and behavior of contact lens care during the COVID-19 pandemic: a pre-test/post-test design. Heliyon. 8:E11009. doi: 10.1016/j.heliyon.2022.e11009
Juslin, P. N., and Västfjäll, D. (2008). Emotional responses to music: the need to consider underlying mechanisms. Behav. Brain Sci. 31, 559–575. doi: 10.1017/S0140525X08005293
Keeling, R. F., Koertzinger, A., and Gruber, N. (2010). Ocean deoxygenation in a warming world. Annu. Rev. Mar. Sci. 2, 199–229. doi: 10.1146/annurev.marine.010908.163855
Kim, J. (2012). The institutionalization of YouTube: from user-generated content to professionally generated content. Media Cult. Soc. 34, 53–67. doi: 10.1177/0163443711427199
Kohler, S., and Dietrich, T. C. (2021). Potentials and limitations of educational videos on YouTube for science communication. Front. Commun. 6:581302. doi: 10.3389/fcomm.2021.581302
Kolandai-Matchett, K., Armoudian, M., and Thrust, S. (2020). Communicating complex marine science: does media format matter? Aquat. Conserv. Mar. Freshwat. Ecosyst. 31, 1772–1790. doi: 10.1002/aqc.3560
León, B., and Bourk, M. (2018). Communicating science and technology through online video: Researching a new media phenomenon. London: Routledge.
Mann, H. B., and Whitney, D. R. (1947). On a test of whether one of two random variables is stochastically larger than the other. Ann. Math. Stat. 18, 50–60. doi: 10.1214/aoms/1177730491
Martin, K. M., Davis, L. S., and Sandretto, S. (2019). Students as storytellers: mobile-filmmaking to improve student engagement in school science. J. Sci. Commun. 18:A04. doi: 10.22323/2.18050204
McNemar, Q. (1947). Note on the sampling error of the difference between correlated proportions or percentages. Psychometrika 12, 153–157. doi: 10.1007/BF02295996
Millenium Ecosystem Assessment (2005). Ecosystems and human well-being: A framework for assessment. Washington: Island Press.
Mimura, N. (2013). Sea-level rise caused by climate change and its implications for society. Proc. Jpn. Acad. 89, 281–301. doi: 10.2183/pjab.89.281
Ocean Literacy Portal. (2022). The list of the oceans with data and statistics and surface area, volume, and average depth. Available at: https://oceanliteracy.unesco.org/ocean/ (Accessed July 19, 2023).
Organisation for Economic Cooperation and Development. (2007). Participative web: user-created content: Web 2.0, Wikis and Social Networking. Paris: OECD Publishing, p.9.
Pauly, D., Watson, R., and Alder, J. (2005). Global trends in world fisheries: impacts on marine ecosystems and food security. Phil. Transact. Royal Soc. B Biol. Sci. 360, 5–12. doi: 10.1098/rstb.2004.1574
Pecay, R. D. (2017). YouTube integration in science classes: understanding its roots, ways, and selection criteria. Qual. Rep. 22, 1015–1030. doi: 10.46743/2160-3715/2017.2684
Rifkin, W., Leach, J., Longnecker, N., Davis, L., and Orthia, L. (2010). Students publishing in new media: eight hypotheses - a house of cards? Int. J. Innov. Sci. Math. Educ. 18, 43–54.
Roe, A. H. (2014). “The evolution of animated documentary” in New documentary ecologies. eds. K. Nash, C. High, and C. Summerhayes (London: Palgrave Macmillan), 174–191.
Santoro, F., Magalhães, A. V. T., Middleton, F., and Buchanan-Dunlop, J. (2022). A new blue curriculum – A toolkit for policy-makers. Paris: UNESCO.
Santoro, F., Santin, S., Scowcroft, G., Fauville, G., and Tuddenham, P. (2017). Ocean literacy for all: A toolkit. Paris: UNESCO.
Shapiro, S. S., and Wilk, M. B. (1965). An analysis of variance test for normality (complete samples). Biometrika 52, 591–611. doi: 10.1093/biomet/52.3-4.591
Shiver-Rice, M., Fernandes, J., Johns, L. N., Riopelle, C., and Vaughan, H. (2022). Young adults’ reactions and engagement with short-form videos on sea level rise. Environ. Commun. 16, 63–78. doi: 10.1080/17524032.2021.1963800
Silva, E. C., and Pinto, S. (2023). Disciplinary cultures and participation in international research networks: how science communication practices and motivation relate to contextual factors. Int. J. Sci. Educ., Part B 13, 245–260. doi: 10.1080/21548455.2022.2162831
Stevenik, E. K., and Sundby, S. (2007). Impacts of climate change on commercial fish stocks in Norwegian waters. Mar. Policy 31, 19–31. doi: 10.1016/j.marpol.2006.05.001
Sugimoto, C. R., and Thelwall, M. (2013). Scholars on soap boxes: science communication and dissemination in TED videos. Int. J. Environ. Res. Public Health 64, 663–674. doi: 10.1002/asi.22764
Van der Meij, H., and Van der Meij, J. (2014). A comparison of paper-based and video tutorials for software learning. Comput. Educ. 78, 150–159. doi: 10.1016/j.compedu.2014.06.003
Vikas, M., and Dwarakish, G. S. (2015). Coastal pollution: a review. Aquatic Procedia 4, 381–388. doi: 10.1016/j.aqpro.2015.02.051
Vogels, E. A., and Gelles-Watnick, R. (2023). Teens and social media: key findings from pew research Center surveys. Available at: https://pewrsr.ch/3LorQUG (Accessed July 16, 2023).
Wabnitz, C., and Nichols, W. J. (2010). Plastic pollution: an ocean emergency. Mar. Turt. Newsl. 129, 1–4.
Welbourne, D. J., and Grant, W. J. (2016). Science communication on YouTube: factors that affect channel and video popularity. Public Underst. Sci. 25, 706–718. doi: 10.1177/0963662515572068
Wilcoxon, F. (1945). Individual comparisons by ranking methods. Biom. Bull. 1, 80–83. doi: 10.2307/3001968
Wilkinson, C., Milani, E., Ridgway, A., and Weitkamp, E. (2023). Motivations and deterrents in contemporary science communication: a questionnaire survey of actors in seven European countries. Int. J. Sci. Educ., Part B 13, 131–148. doi: 10.1080/21548455.2022.2139165
Keywords: climate change, online video, outreach text, cognitive field, emotional field
Citation: Jorge M, Pinto B and Boaventura D (2024) Assessment of the impact of a “user generated” video in the communication of marine environmental threats. Front. Commun. 9:1461940. doi: 10.3389/fcomm.2024.1461940
Edited by:
Anders Hansen, University of Leicester, United KingdomReviewed by:
Adriana Zait, Alexandru Ioan Cuza University, RomaniaAna Claudia Nepote, National Autonomous University of Mexico, Mexico
Copyright © 2024 Jorge, Pinto and Boaventura. This is an open-access article distributed under the terms of the Creative Commons Attribution License (CC BY). The use, distribution or reproduction in other forums is permitted, provided the original author(s) and the copyright owner(s) are credited and that the original publication in this journal is cited, in accordance with accepted academic practice. No use, distribution or reproduction is permitted which does not comply with these terms.
*Correspondence: Miguel Jorge, bWdvZXNqb3JnZUBnbWFpbC5jb20=