- 1Joint Centre for Disaster Research, School of Psychology, Massey University, Wellington, New Zealand
- 2Geologic Hazards Science Centre, U.S. Geological Survey, Denver, CO, United States
- 3College of Health and Human Sciences, Formerly Charles Darwin University, Darwin, NT, Australia
Introduction: This study explored earthquake preparedness over time—before, during, and 10 years after the Canterbury Earthquake Sequence (CES) in New Zealand (NZ; known as Aotearoa in te ao Māori).
Method: Surveys of Canterbury residents were conducted in 2009, 2013, and 2021, using variables derived from Community Engagement Theory (CET). The surveys measured earthquake perceptions and beliefs, participation and engagement, and preparedness actions. Results were compared across the three samples.
Results: Findings indicate that perceptions and beliefs (e.g., risk perception, outcome expectancy beliefs), and types of preparedness actions taken (e.g., collection of survival items, structural preparedness, community and/or agency relationships), differed over time, depending on people's experiences before, during, and after the CES. For example, during and after the CES, people were more likely to believe that preparing provided a benefit to daily life, but less likely to think it could reduce property damage, perhaps due to people's experiences of disruption and damage during the earthquakes.
Discussion: An understanding of such dynamics can assist with the provision and timing of risk and preparedness information. This study highlights the importance of providing applicable and actionable preparedness information, that is relevant to people's experiences, throughout an earthquake sequence. Such information might evolve and change in focus over time depending on risks and needs. Focus could also be given to information that builds peoples beliefs and capacities to undertake preparedness in evolving situations. Understanding preparedness in the context of different experiences and timeframes is useful in helping update models such as the CET, where the dynamics of time might be better incorporated.
1 Introduction
A key challenge in managing our earthquake risk is understanding how people's level of preparedness changes through time and how influences (such as event experience, passage of time) change levels of, and attitudes toward, preparedness. However, a gap exists in our understanding of such aspects, due to a lack of longitudinal data. We aim to address this here in our paper, with respect to a study undertaken focussed on the Canterbury Earthquake Sequence (CES) and preparedness in New Zealand (NZ; known as Aotearoa in te ao Māori).
New Zealand is located at the intersection of two plate boundaries—the Pacific and Australian Plate—making it subject to regular earthquake activity. Since 2010, several of large earthquakes have impacted on urban and provincial areas (Figure 1). On 4 September 2010 the magnitude (Mw) 7.1 Darfield earthquake occurred in the Canterbury Region causing injuries and damage to the surrounding area, including the nearby location of Christchurch City. This was followed by a protracted aftershock sequence under the urban area of Christchurch that included the 22 February 2011 Mw 6.2 Christchurch earthquake (Quigley et al., 2016). The 22 February earthquake caused even more damage to the city, with severe liquefaction, the collapse of several buildings and 185 deaths (Kaiser et al., 2012; Potter et al., 2015). Aftershocks following the Christchurch earthquake (Bannister and Gledhill, 2012) added to damage and disruption over the following years, with the most active part of the CES being from 2010 to 2011.
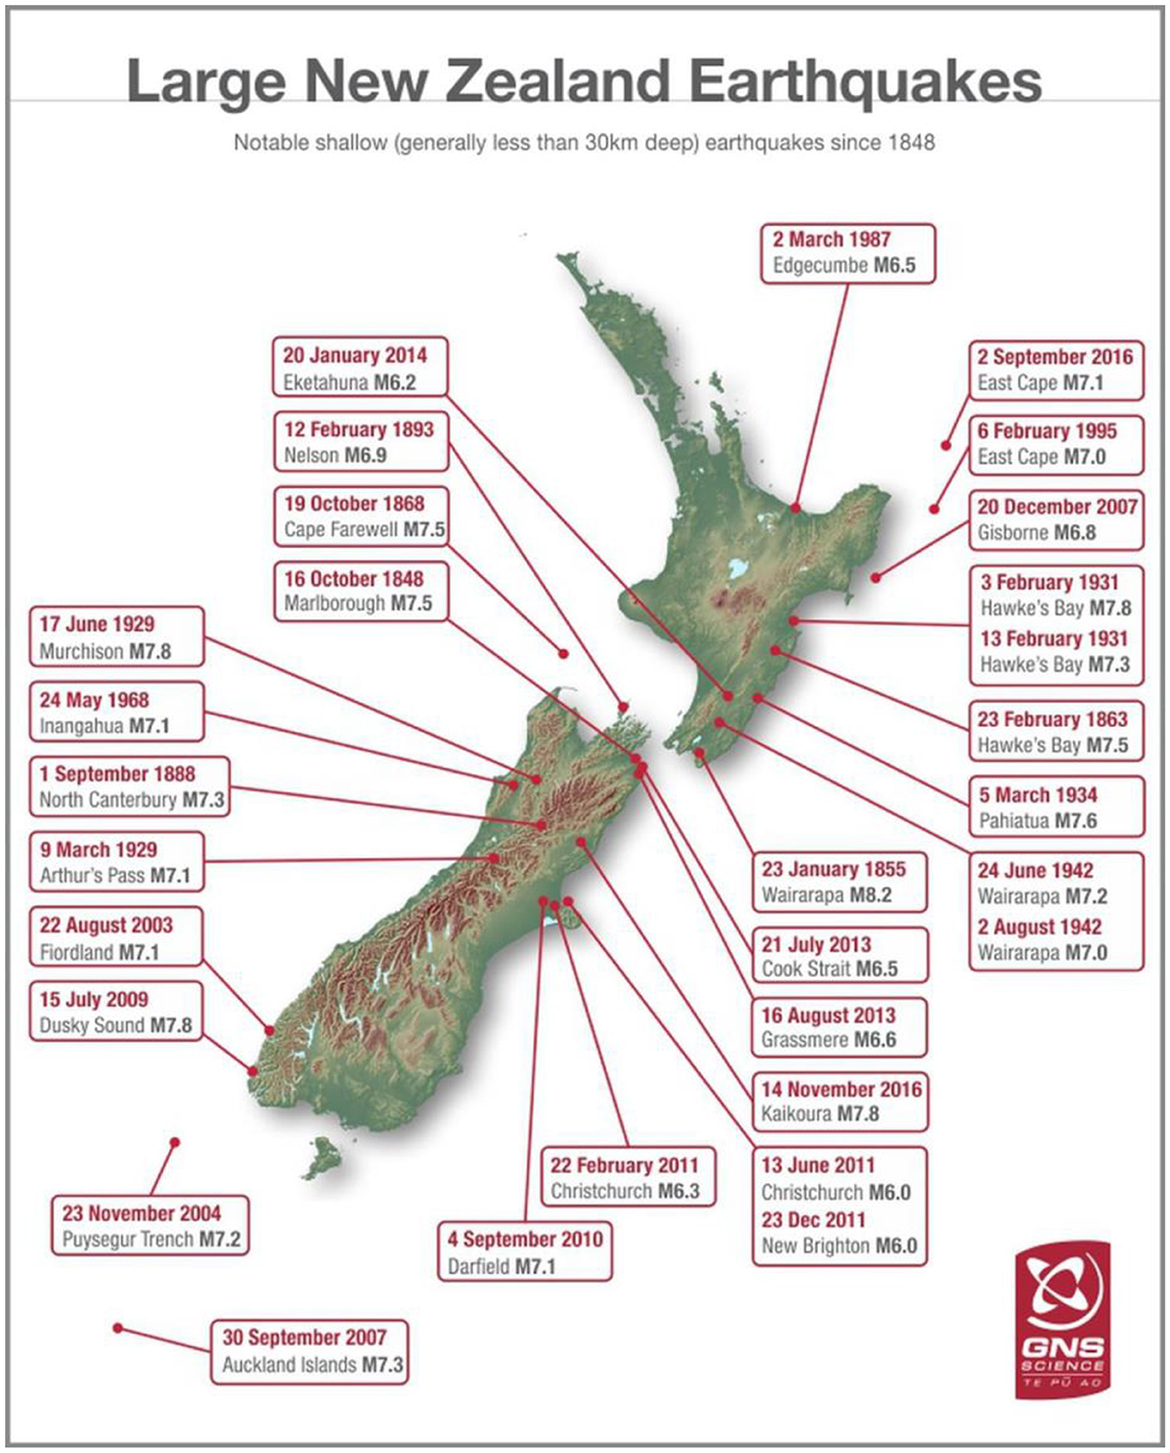
Figure 1. Large New Zealand earthquakes, with the location of the 2010 Darfield, 2011 Christchurch and 2016 Kaikōura earthquakes shown (Reproduced with permission from GNS Science, 2016).
In 2016, a further large earthquake—the Mw 7.8 Kaikōura earthquake occurred, impacting the upper South Island and Lower North Island (Kaiser et al., 2017). While felt by Christchurch residents, damage and disruption was predominantly focussed farther north of Christchurch City in other parts of Canterbury such as Kaikōura, and into the Wellington Region (Stevenson et al., 2017). Consequently, the earthquakes experienced in NZ since 2010 have been substantial, with those located in the Canterbury Region experiencing on-going shaking and associated impacts.
Our understanding of how to reduce earthquake impacts in a pre-event context ranges from using appropriate land-use planning techniques, through effective engineering practice, to preparedness measures (Becker et al., 2022). While land-use planning, and engineering are important components in reducing earthquake risk, in many places our already built-up environment requires that we focus on earthquake preparedness activities (also known as “readiness” in the NZ context). This was the case in the Canterbury Region of NZ, where before the CES, existing building development was prone to earthquake risk, and preparedness information was provided by the Canterbury Civil Defence Emergency Management Group and local territorial authority emergency managers to encourage people to undertake preparedness activities (McBride, 2017). Throughout the most active part of sequence and in the years following, earthquake preparedness has continued to be advocated, with information modified as necessary, depending on people's experiences of ongoing earthquakes (refer to Section 1.2).
1.1 What constitutes and influences preparedness?
Before exploring Canterbury's earthquake preparedness in more depth, we first define the concept of earthquake preparedness and discuss what influences it. Earthquake preparedness can be broken down into a range of activities including survival, structural, and community preparedness (Spittal et al., 2006; Lindell et al., 2009; Vinnell et al., 2021; Paton et al., 2024). Such preparedness can be undertaken at different levels, including individual, household, community, or organizational levels, but for the purposes of our research we focus on households. Survival preparedness includes collecting items required for post-event survival like water, food, medication, and essential equipment. Structural preparedness constitutes taking mitigation actions such as securing house foundations, chimneys, or loose items so they do not move in an earthquake and cause injuries or fatalities. Emergency planning might also take place at the household level. Community preparedness might include gathering together community-based preparedness items, planning or training for an emergency, or developing relationships necessary for an effective response in an earthquake. Paton et al. (2015, 2017) have identified two types of key relationships that they consider part of preparedness, which include relationships between community members (community-community relationships) and the relationships a community might have with an agency (community-agency relationships). Another type of emerging preparedness that might have impact on households is that of psychological preparedness, or the ability to cope with and adapt to impacts and post-disaster situations—something identified in the Canterbury context following the 2010–2011 earthquakes (Paton et al., 2014) and highlighted by other international studies (Morrissey and Reser, 2003; McLennan et al., 2020).
Different researchers tend to collate categories of preparedness slightly differently depending on the intent of the study. For example, Spittal et al. (2006) split their Earthquake Readiness Scale into “Mitigation Items,” which are focussed more on survival (like storing water) vs. “Damage Limitation Items,” which are more structurally related. Conversely Paton et al. (2015, 2017) group emergency planning/training with survival preparedness, rather than community preparedness, due to the nature of the questions being more focussed on individual actions. For this paper we refer specifically to survival, structural, emergency planning and training, community-community relationships; community-agency relationships; it is on these concepts we focused our research. We also assessed psychological preparedness in our research, but that is not included in the current study.
Preparedness, or intentions to prepare (where preparedness itself is low), is influenced by a variety of factors. Some factors directly influence preparedness actions; however, others are influential primarily within the overall process of deciding whether to prepare or not. Additionally, depending on the type of preparedness (e.g., survival vs. community preparedness), influencing factors might vary (e.g., McClure et al., 2015). Community Engagement Theory (CET; Paton, 2019; Paton et al., 2024) seeks to identify and explain many of the influences of preparedness from individual through to societal influences. This model has been tested across many countries and cultures, including NZ, giving it universal applicability. Figure 2 highlights some of the direct and indirect links that influencing factors have with preparedness. For example, individual level factors such as risk perception (i.e., how people understand, think, and feel about risks, Fischhoff et al., 2011) or negative outcome expectancy might directly link to people's decisions about undertaking preparedness, or indirectly influence the preparedness process by contributing to views about preparing. While on the other hand, community level factors such as community participation might be more likely to influence feelings of empowerment and trust, which then influence decisions about preparedness.
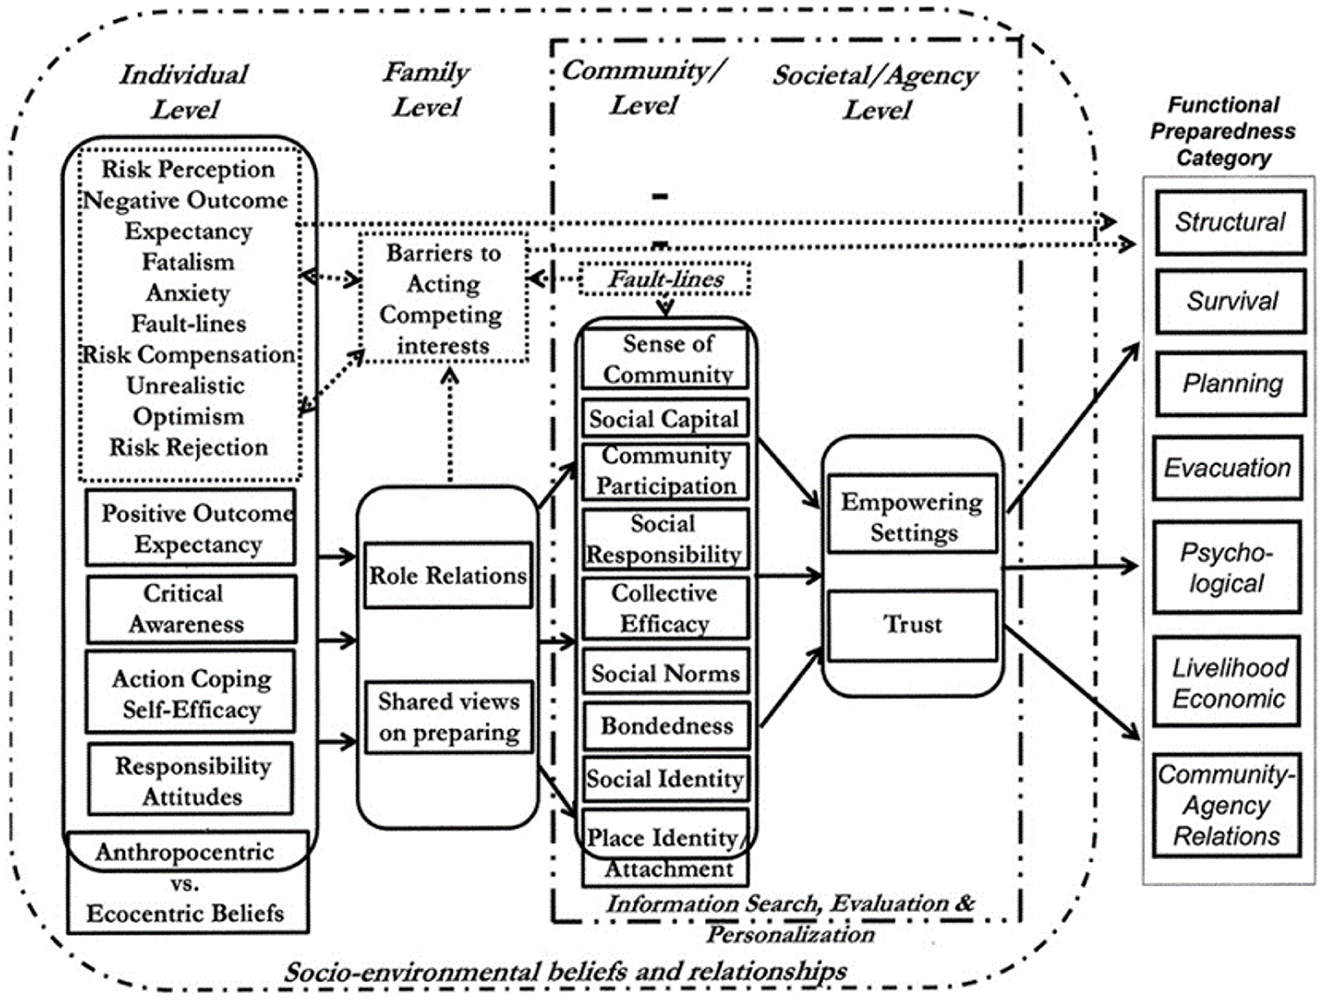
Figure 2. The Community Engagement Theory model, highlighting the various influences on preparedness (Reproduced with permission from Paton, 2019).
Figure 2 highlights the complexity of the preparedness process. A full articulation of the components can be found in Paton (2019, 2022) and Paton et al. (2024). However, in the Canterbury context, several studies have explored many of the key influences in the model. These studies include a survey of household residents in 2009 (Becker, 2010), post-earthquake interviews with a different cohort of residents (Paton et al., 2014), and a 2013 survey sent to the same residents as in 2009 following the Darfield and Christchurch earthquakes (Paton et al., 2015, 2017). These studies specifically sought to understand the influence of the following components on individual and household preparedness: risk perception, beliefs (e.g., fatalism, optimism), outcome expectancy, critical awareness, self-efficacy, coping style, sense of place, community participation, collective efficacy, leadership, responsibility, empowerment, and trust (Becker, 2010; Paton et al., 2015, 2017).
In terms of a highlighting some of the results from this work, the 2009 survey found a role for positive outcome expectancy in influencing both community participation and collective efficacy, which in turn influences empowerment and trust, driving both intentions and actual preparedness (Paton et al., 2024). In other words, if people can see the benefits of preparing they are more likely to work together on issues related to hazards and preparedness, trust the advice of authorities who are promoting preparedness, and be empowered to prepare (Paton et al., 2024). This has implications for the information we give people about earthquakes, such as highlighting the benefits of preparing and illustrating how preparedness can be achieved by working with others.
However, in the Christchurch earthquake recovery context, interviews with residents showed that beliefs related to positive outcome expectancy were not prominent (Paton et al., 2014), suggesting that their experience of the earthquake may have altered their beliefs about the benefits of preparing. The 2013 survey reinforced these likely changes in that it found positive outcome expectancy influenced community-agency preparedness, but not survival and community-community preparedness Additionally, following the earthquakes, the interviews highlighted the importance of knowledge and skills, and psychological preparedness, in people's ability to work together and to solve local issues—something that had not been evident in earlier survey work, but emerged as a result of challenging conditions after the earthquakes (Paton et al., 2014). Consequently, the exact way the preparedness process plays out differs depending on the type of preparedness (e.g., survival, community-community, community-agency, or psychological) and the context in which it takes place (pre- or post-earthquake) (Paton et al., 2014, 2015, 2017). Such insights have contributed to our broader understanding of the preparedness process, and the dynamic information and support we might offer people over time.
1.2 Preparedness in the Canterbury region
To understand the preparedness context for Canterbury, it is important to consider what types of preparedness information have been provided over time, and by whom, in combination with preparedness levels. While we do not make a direct link with information and preparedness in this study, the context does help in considering and interpreting results.
A wide variety of preparedness information has been produced and disseminated nationally via the Ministry of Civil Defence & Emergency Management (MCDEM), now known as the National Emergency Management Agency (NEMA), including the “Get Ready” programme (National Emergency Management Agency, 2024). Other nationally focussed agencies such as the Natural Hazards Commission Toka Tū Ake (previously Toka Tū Ake EQC) or Red Cross also provide specific types of household preparedness information (Toka Tū Ake EQC, 2022; Red Cross, 2024). Additionally, preparedness information is available regionally via Civil Defence Emergency Management (CDEM) Groups, such as the Canterbury CDEM Group (Emergency Management Canterbury, 2024). Finally, at a district level, some territorial authorities also provide preparedness information as part of their emergency management function.
McBride (2017) summarizes much of the earthquake and preparedness information that existed in the Canterbury Region prior to the 2010 Darfield Earthquake. In addition to national level material on hazards, risk, and preparedness provided by MCDEM, several brochures and outreach activities that included videos and roadshows were produced by the Canterbury CDEM Group—including the Q-Files booklets in partnership with territorial authorities (McBride, 2017). However, these tended to focus on the nature of earthquake hazards and risk, with less focus on preparedness and mitigation. McBride (2017) suggested that the text was jargon-laden, with little focus on messages related to outcome expectancy, potentially resulting in fatalism and a lack of motivation to prepare. Additionally, while some effort was given to developing activities that brought people together to discuss and solve earthquake issues, these were limited in number and scope. It is not unexpected then, that while many householders surveyed in 2009 intended to increase their preparedness for earthquakes (66.2%), only 30.6% of people believed they were prepared/very prepared (Becker, 2010). A 2008 Statistics New Zealand Tatauranga Aotearoa (StatsNZ) survey paints an even grimmer picture of preparedness in Canterbury Region before the earthquakes, where only 13.5% of respondents suggested they were prepared for a natural disaster with food and water (StatsNZ, 2022). Other hazards, including pandemic preparedness, were considered higher priority by regional and national authorities in the 2 years prior to the beginning of the Canterbury Earthquake Sequence (McBride, 2017).
Following the initiation of the Canterbury Earthquake Sequence, with its ongoing aftershocks, provision of information about preparedness became more challenging. While it was important for people still to be prepared for ongoing earthquakes, people were dealing with much more immediate issues like response, damage, welfare, and psychosocial issues (Wein et al., 2016; Becker et al., 2019). Agencies felt that promoting preparedness was difficult given what people were dealing with and did not push this information as much as they had previously. There was even a deliberate decision at the national level not to actively promote the ShakeOut earthquake drill campaign in 2012 in the Canterbury Region, so as to give residents a break from constant earthquake information (McBride et al., 2019). In the immediate years following the earthquakes, information provided to the public was often given in response to questions and direct needs, e.g., through the use of earthquake information fact sheets, as well as via channels such as the local CDEM website or social media. Preparedness rose directly after the earthquakes (McClure et al., 2013; Habibi and Feld, 2020), with comparative StatsNZ data indicating preparedness levels (i.e., storing food and water) were close to or above 30% in 2010, 2012, and 2014 (StatsNZ, 2022), 15%−20% up from 2008 levels. Over time, the type of information provided in Canterbury has evolved to a balance of preparedness information and hazard and risk information, alongside use of stories and experiences of the CES to help underscore the importance of preparing (e.g., Emergency Management Canterbury, 2024). The 2021 StatsNZ (2022) survey data reflect a slight fall in preparedness to 24.5%, which is still elevated above pre-earthquake levels.
1.3 This study
One of the key gaps in our knowledge is how and why preparedness changes over time, particularly in the wake of a large earthquake sequence, and how to support preparedness efforts through the provision of dynamic information. Most studies provide a snapshot of preparedness in time, usually in the context of earthquake quiescence. Only a few have looked at preparedness before and after earthquakes (e.g. Mulilis et al., 1990); however, the timeframes for such studies are quite short, ranging from months to several years. In the Canterbury context, Habibi and Feld (2020) used StatsNZ data to investigate rates of preparedness over a 30-month timeframe pre- and post- Christchurch earthquake but did not go beyond 2013. Consequently, we were unable to identify any studies of preparedness over decades, with earthquake activity in the middle. Our research attempts to do this, to better understand whether types and levels of preparedness have changed over time in the wake of a major earthquake, and to identify whether influences on preparedness have also changed. A better understanding of the types, levels, and influences of preparedness at different phases of an earthquake “cycle” can help emergency managers create more effective education programmes and information resources that are tailored for preparedness across different circumstances and timeframes.
To better understand preparedness over time, we draw upon the two residents' surveys mentioned previously—the survey conducted in 2009 (Becker, 2010) undertaken prior to the Darfield earthquake and commencement of the CES, and a survey conducted in 2013 following the Darfield and Christchurch earthquakes during the height of the CES aftershocks (Paton et al., 2015, 2017). These prior surveys contained a mix of questions designed to understand types, levels, and influences on household preparedness. From these surveys a new survey was developed that was disseminated in 2021 by Massey University to Canterbury residents. Results from all three surveys are compared to understand the nature and evolution of preparedness over time.
2 Method
2.1 Materials
The 2021 survey was kept as similar as possible to that used in 2013 to allow for more confident comparisons [full copies of all surveys from 2009, 2013, and 2021 are in Vinnell (2024) and available online here: https://doi.org/10.17605/OSF.IO/4T9U6]. However, the collective efficacy and community empowerment scales were shortened in order to create room in the survey for additional questions, such as demographics. Reliability analyses on 2013 data were conducted with these scales, and items were chosen for removal based on improvements to Cronbach's alpha and inter-item total correlations.
As there were some minor changes between the three surveys, this paper only reports on the items that could be descriptively compared across at least two time points. Items that could not be compared are therefore not described here (e.g., psychological preparedness). Full details of questions and factors are presented in the relevant part of the Results section (3). Briefly, the questions that could be compared across two time points were:
• Sources of emergency preparation information.
• General preparedness intentions and actions.
• Critical awareness (frequency of thinking and talking about earthquake issues and problems).
• General beliefs about earthquakes.
• Perceptions of earthquake threat.
• Outcome expectancy.
• Community participation.
• Collective efficacy and empowerment.
• Trust.
• Preparedness: survival, structural and emergency planning/training.
• Preparedness: community-community relationships.
• Preparedness: community-agency relationships.
Participants were also asked about their experiences of general earthquake impacts as well as specific earthquake events. Demographic data were collected (e.g., age, gender, and ethnicity) so that the current data can be considered in relation to its level of generalizability to the broader population.
Mean scores and frequencies across all three surveys (where possible) are presented and discussed descriptively. Differences between the samples at each time point are not tested statistically. As there is always a possibility of finding a statistically significant effect by pure chance, carrying out so many comparisons would greatly inflate the error rate and the likelihood of finding effects that do not actually exist (Sato, 1996). To account for the lack of statistical testing, where possible we discuss differences in terms of apparent patterns or trends rather than focusing on specific items except where the differences are considerable enough to have confidence that they would likely be statistically significant. However, as we did not have formal hypotheses for this study, we did not test these in order to avoid “fishing” (searching data atheoretically for significant effects). Further, the quasi-longitudinal nature of this study (i.e., we drew from the same population with the same sampling method but did not strictly retain the same sample nor could we link data between surveys) means that it is more useful to look for overall trends.
2.2 Participants
We sent survey invitations to as many of the same addresses used in 2013 as possible. A total of 3,000 randomly generated addresses were utilized in 2013; however, due to damage following the earthquakes, some residences no longer existed. Addresses were therefore first cross-checked with Residential Red Zone areas in Christchurch and Kaiapoi, and any central city locations where houses may not exist anymore. Any addresses that no longer existed, or where there was doubt, were removed. This left 2,857 addresses. We added another randomly generated sample of 143 addresses to make the sample up to 3,000. Of the 3,000 invitations sent out, 48 were “returned to sender”, leaving 2,952 reaching their intended destination. Unlike the previous survey that sent a printed questionnaire, we used postcards to recruit participants, with the postcards including a blurb about the project and a link to a Qualtrics survey page. Two hundred and sixty-one participants answered at least one question; of these, 24 answered only the age screening question and so were excluded from the dataset. This left a useable sample of 237 participants.
We were not able to link individual participants' responses between the surveys or confirm that participants had responded to both the 2013 and 2021 surveys (e.g., different people may have answered the survey, or people may have moved houses). Therefore, this research is quasi-longitudinal. That is, we used the same sampling method from the same population to compare descriptively, rather than inferentially, over time. It is possible then, that some of the specific differences may be influenced by, or an artifact of, differences in the samples. However, given the sample sizes and sampling method, overall trends can be assessed as robust.
Length of time lived in the Canterbury region varied from half a year to 79 years, with a mean of 27.75 years. Only 12 participants (5.06%) had not experienced any earthquakes. Over half of the participants had experienced the 2010 Darfield earthquake (54.4%), the 2011 Christchurch earthquake (58.7%), and/or ongoing aftershocks (62.0%). Many also experienced the 2016 Kaikōura earthquake (46.4%). When asked if they or someone close to them had suffered damage to their home or possessions in a past earthquake, the most common response (32.77%) was “A lot of damage” (7 on the 7-point scale), and the mean score was 4.76. Few participants reported that they or someone close to them had ever been harmed in a past earthquake; the most common response was “Never” (1 on the 7-point scale; 49.15%), and the mean score was 2.60.
Most participants were women (68.02%; 30.81% were men, and 1.16% were non-binary). Ages ranged from 18 to 81, with a mean of 52.50 years old. The vast majority of participants identified as being a New Zealander (78.53%) or European (7.34%); only 3.39% identified as Māori. Most (79.55%) owned their house or residence.
2.2.1 Comparison to other surveys
Full demographic information was not collected in the 2013 survey; however, some descriptive comparisons can be made. Slightly more people in the 2009 survey (88.13%) and the 2013 survey (88.03%) owned their residence. The gender distribution was more even in the 2009 survey (49.1% male), but the modal age was higher (60–64 years). Identification with particular ethnicities cannot be compared easily due to changes in wording, but as with the 2021 survey, a majority of 2009 participants identified as New Zealand European (88.6%), and Māori were underrepresented (3.1%). While these participants are not properly representative of the New Zealand population which may limit the generalizability of the findings to particular groups, evidence in NZ (Becker et al., 2015) and globally (Solberg et al., 2010) demonstrates mixed or no differences in earthquake preparedness based on demographic factors.
3 Results
3.1 Sources of emergency preparation information
Two thirds (67.7%; N = 235) of participants in the survey had sought information about how to prepare for emergencies. Notably, more people suggested that they got information from their local emergency management group than from the National Emergency Management Agency (Figure 3). Social media, traditional media (including TV and radio as well as print media), and Emergency Mobile Alerts (EMAs) were commonly cited sources, though the latter has less relevance in an earthquake preparedness context.
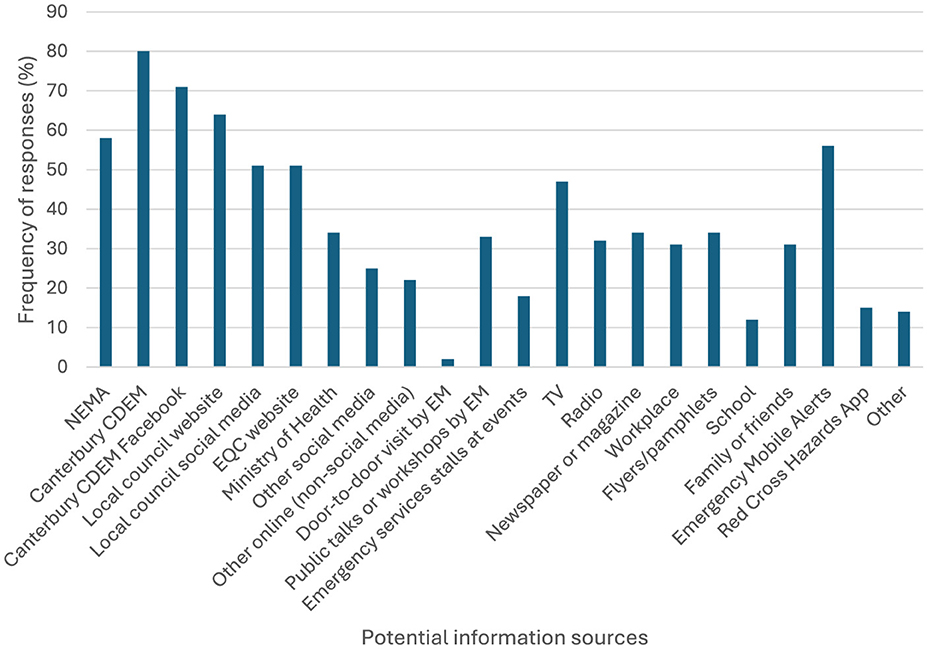
Figure 3. Reported information sources for preparing for emergencies such as earthquakes for 2021. NEMA, National Emergency Management Agency; CDEM, Civil Defence & Emergency Management; EQC, Earthquake Commission (now called Natural Hazards Commission Toka Tū Ake); EM, Emergency Management.
3.2 General preparedness intentions and actions
As highlighted previously, in 2009 before the Canterbury earthquakes, two-thirds of respondents said that they intended to definitely or possibly check (67.1%) or increase (66.2%) their level of preparedness for earthquakes; however, only 30.6% of people believed they were prepared/very prepared (Becker, 2010). Approximately two-thirds of participants (65.78%) in the 2021 survey said they either got prepared or updated their preparedness during most active part of the Canterbury Earthquake Sequence from 2010 to 2011 (N = 187). Fewer, but still a majority (57.22%), of 2021 survey participants had undertaken some earthquake preparation in the 3–5 years following 2010–2011 (i.e., 2012 to 2016; N = 180). A similar, but slightly larger, percentage (59.34%) of participants had increased their preparedness in the 6+ years since 2010–2011 (i.e., 2017–2021). This stabilization in preparedness actions could possibly be due to the 14 November 2016 Kaikōura earthquake that was widely felt throughout the region, causing extensive damage and disruption, hundreds of injuries, and two fatalities (Stevenson et al., 2017). Over time then, people's intended, or actual preparedness has fluctuated slightly, depending on how events have unfolded, with slight increases aligning with earthquake activity.
3.3 Critical awareness
Similar to preparedness fluctuations, rates of thinking about earthquake issues (Figure 4) and talking about earthquake issues (Figure 5) were much higher in the 2013 survey after the major events in the CES and while aftershocks and impacts such as insurance claims and rebuilding were still prevalent. Rates of thinking and talking about earthquake issues decreased between 2013 and 2021 (N = 221 and 219 for thinking and talking, respectively), but even 10 years after the main earthquakes such rates remained above the pre-earthquake levels. One question here, revisited in more detail in the discussion section, is that these critical awareness measures do not assess the content of people's thoughts and conversations. Critical awareness is often a measure in preparedness models; however, in 2013, it is likely that many thoughts and discussions among Cantabrians were at least partially on other earthquake-related topics than preparedness.
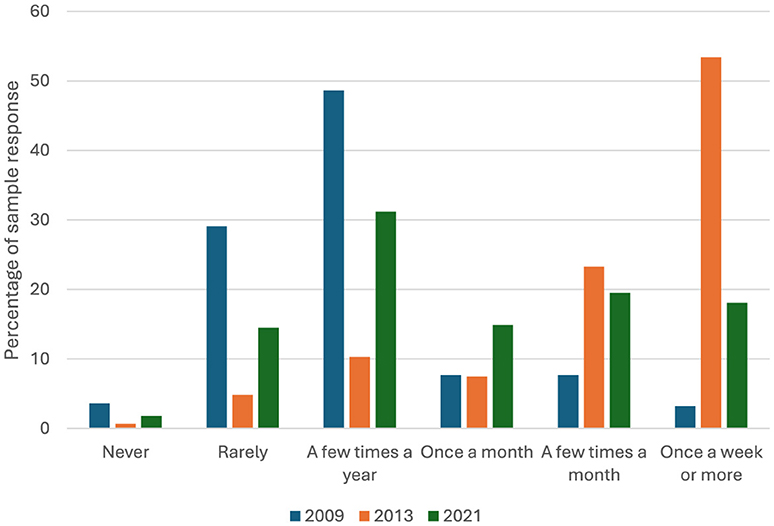
Figure 4. Frequency of thinking about earthquake issues and problems in the community compared for the surveys conducted in 2009, 2013, and 2021.
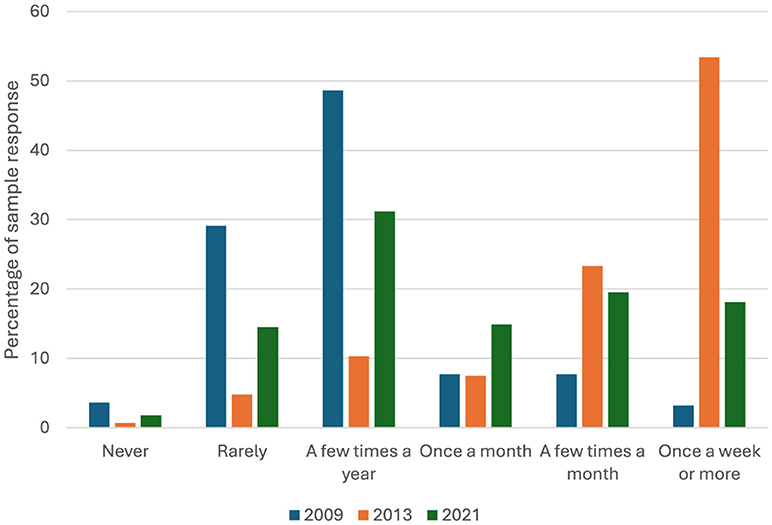
Figure 5. Frequency of talking about earthquake issues and problems with others in the community compared for the surveys conducted in 2009, 2013, and 2021.
3.4 Beliefs
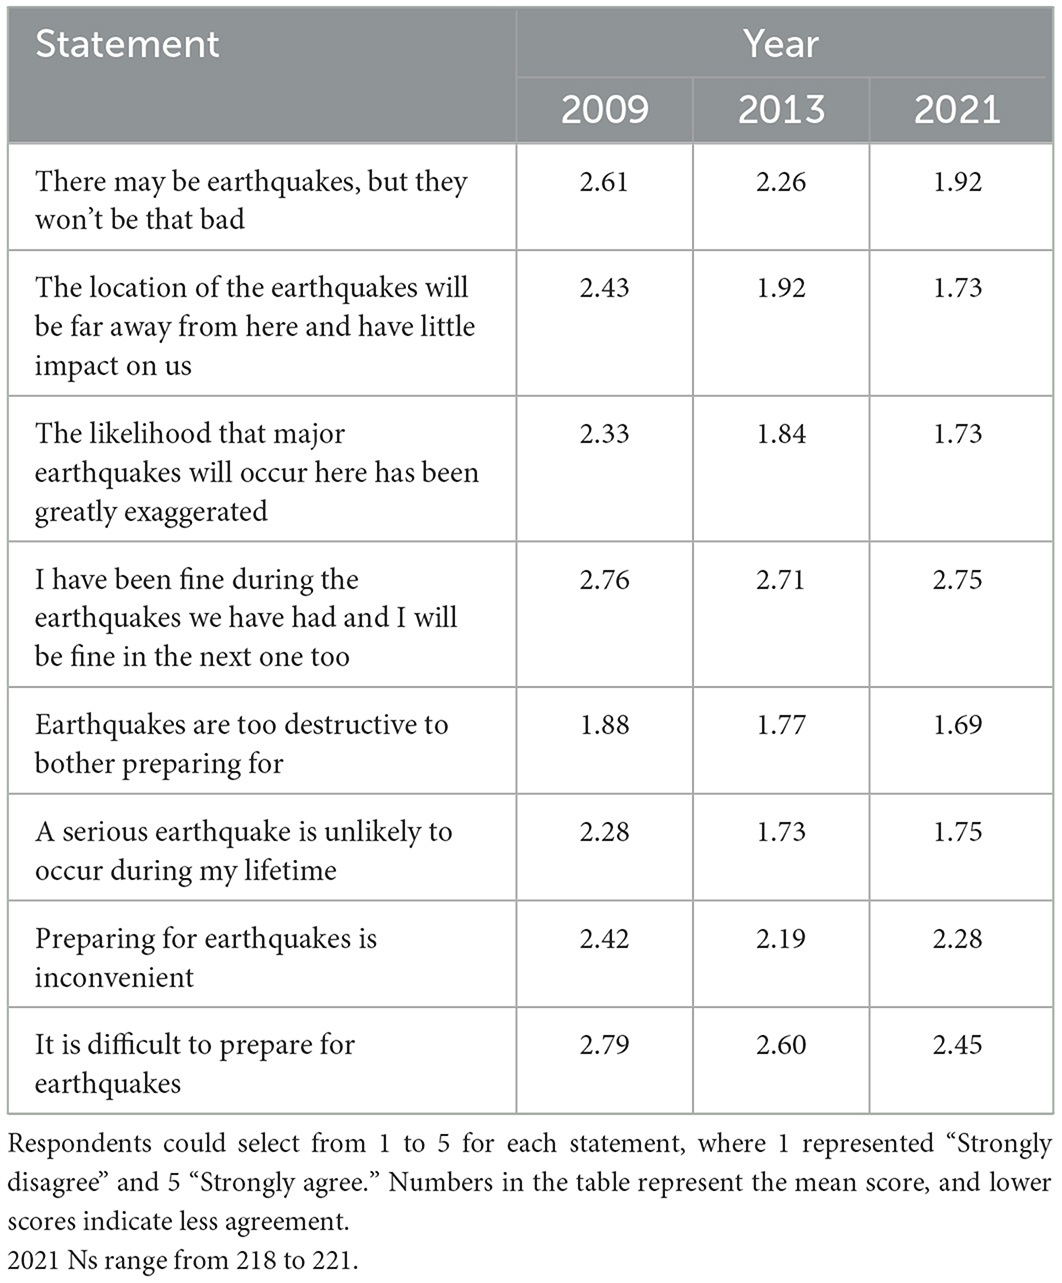
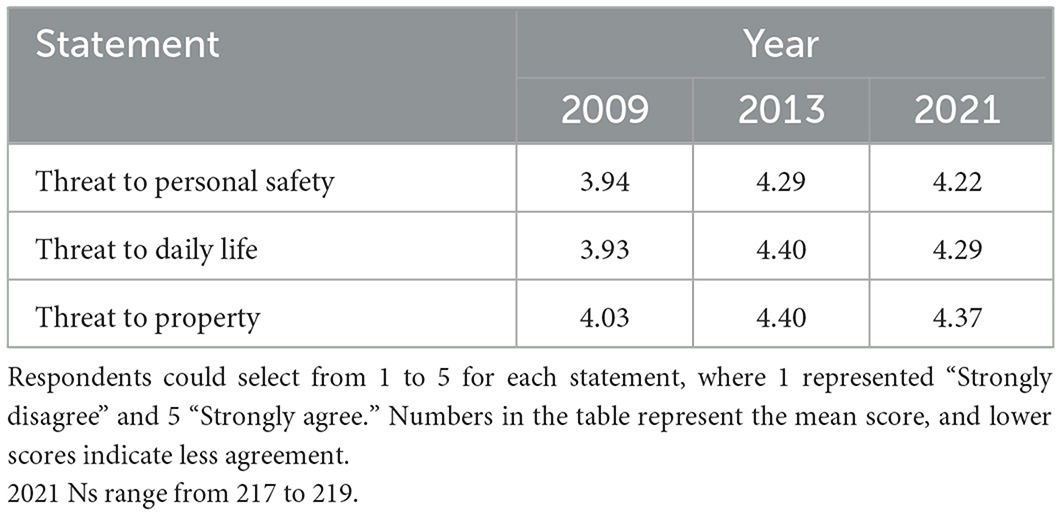
As with the 2009 and 2013 surveys, participants generally disagreed with beliefs that are expected to hinder preparedness (Table 1) and agreed that earthquakes could pose a threat to their safety, daily life, and property (Table 2). Lower agreement with the beliefs in Table 1 is treated as being “more useful” given that these beliefs can reduce people's likelihood to prepare. Conversely, higher scores in Table 2 represent perceptions of the earthquake threat as higher; although risk perception is a complex variable and likely does not have a linear relationship with preparedness (e.g., Solberg et al., 2010), greater risk perception is typically considered to be useful in prompting preparedness.
Of note, unlike critical awareness, differences between 2009 and 2013 mostly either persisted or widened, indicating that earthquake experience influences a long-term, persistent impact on both detrimental beliefs and risk perception. In both cases, the changes over time should theoretically be in the direction of encouraging more preparedness. If people consider the threat of an earthquake as higher, and they more strongly disagree with beliefs such as “the likelihood of a major earthquake has been exaggerated,” they should be more likely to prepare. The statistical relationship between these beliefs/risk perceptions and preparedness for the 2021 survey can be explored in subsequent work.
3.5 Outcome expectancy
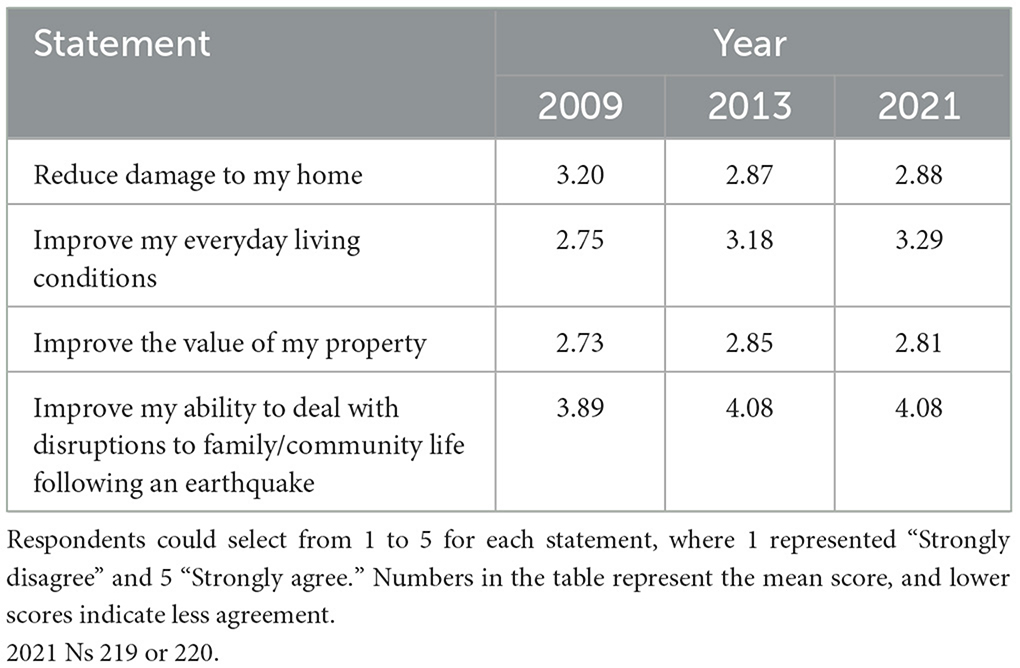
Regarding the perceived benefits of preparing for earthquakes, results were mixed. As shown in Table 3, the Canterbury earthquakes appear to have made people consider preparing as less likely to reduce the amount of damage to their homes. This change between the 2009 and 2013 survey is possibly due to the widespread damage to residential properties in the area caused by the September 2010 and February 2011 earthquakes in particular. However, it is notable that the mean has stayed almost the same 10 years after the latter event. The impact on perceptions of preparation benefitting everyday life similarly appears to have persisted; interestingly, though, this change is positive. That is, people were more likely to think that preparing for earthquakes would help them in their day-to-day life even 10 years after the main events in the CES. Changes to perceptions of preparation as potentially improving property value have improved, but not nearly to the same extent. Finally, and also particularly of note, is the modest increase in agreement that preparing would help to deal with earthquake-related disruptions. This could be due to beliefs already being relatively high before the earthquakes (3.9 on a 5-point scale), so there is less room for increase.
3.6 Community participation
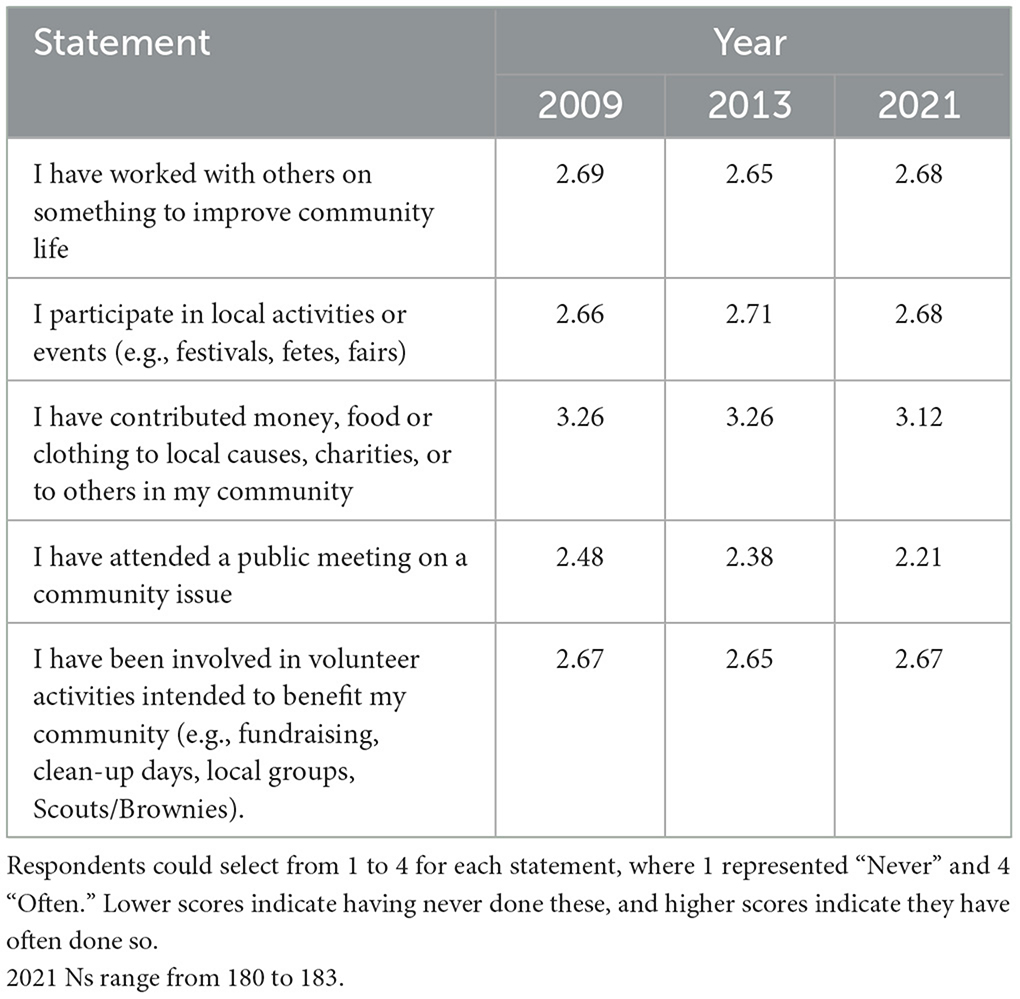
Community participation appeared reasonably stable over all timeframes (Table 4), with levels of engagement in activities being fairly similar across 2009–2021. Probably of most note is with respect to attending meetings on community issues. Participants indicated that their attendance has slightly decreased over time, which is unexpected given there have been many more opportunities to attend and engage with such meetings in the post-earthquake period.
3.7 Collective efficacy and empowerment
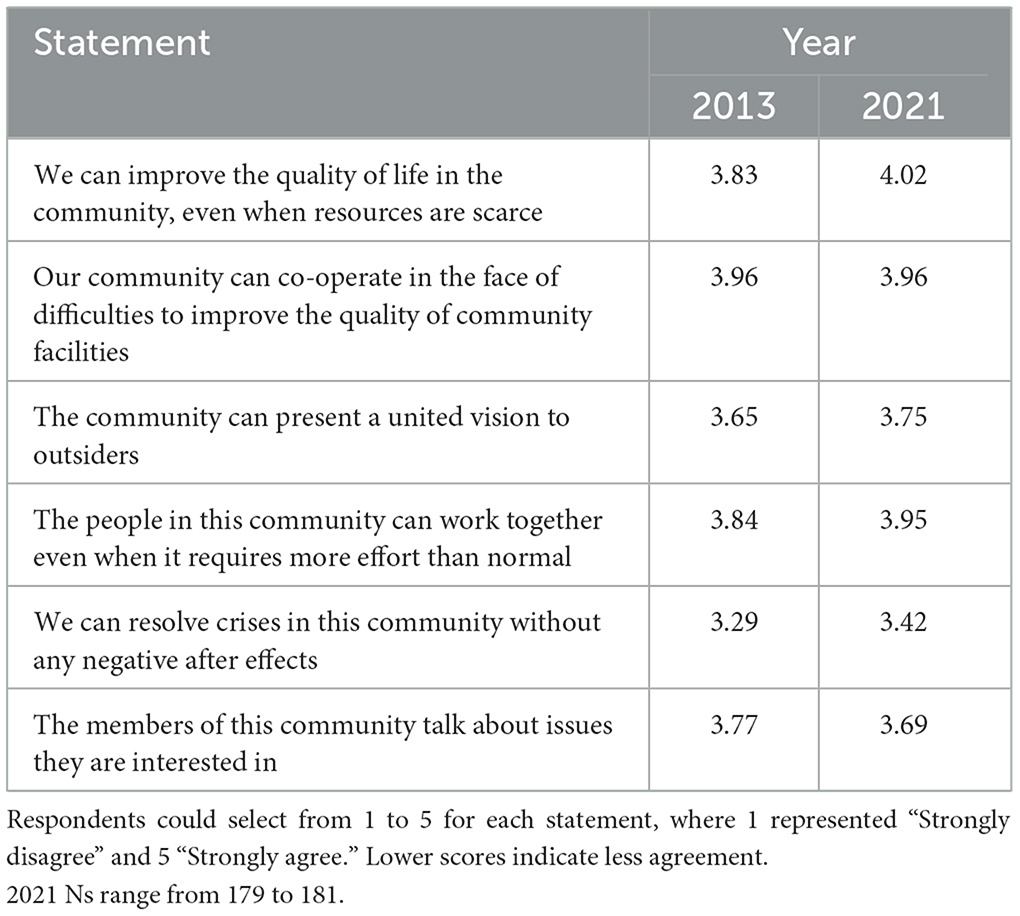
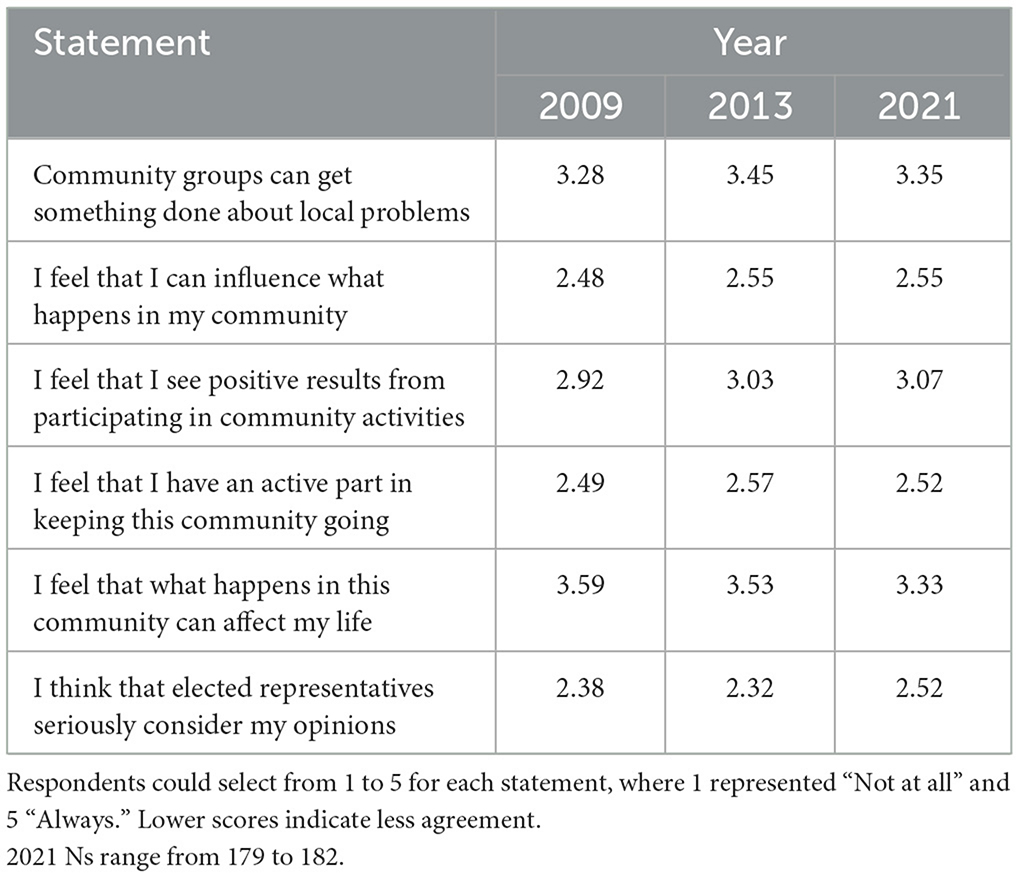
Four out of six of the collective efficacy items showed an increase in mean scores between 2013 and 2021 (indicating more collective efficacy); one item stayed the same, and the other decreased items (Table 5). However, these differences are very small. These findings therefore indicate that collective efficacy may have increased in the later years following the earthquakes, perhaps as communities worked together on their recovery, but that overall there was little movement in this factor. This pattern is particularly relevant given the key role of collective efficacy in many theories of hazard preparedness (e.g., Community Engagement Theory). However, collective efficacy was not measured in 2009 which makes suggesting reasons for these findings more difficult. However, the closely related factor of community empowerment was measured in all three surveys. Similar to collective efficacy, community empowerment (Table 6) showed little to no change from 2009 to 2013 to 2021. Some items trended slightly downward (indicating that the feeling or thought in the item was experienced less frequently, suggesting lower community empowerment), while others trended upward. However, as with collective efficacy, there was very little change in this factor. Reasons for this lack of change, and implications for understanding preparedness and designing interventions, are discussed later.
3.8 Trust
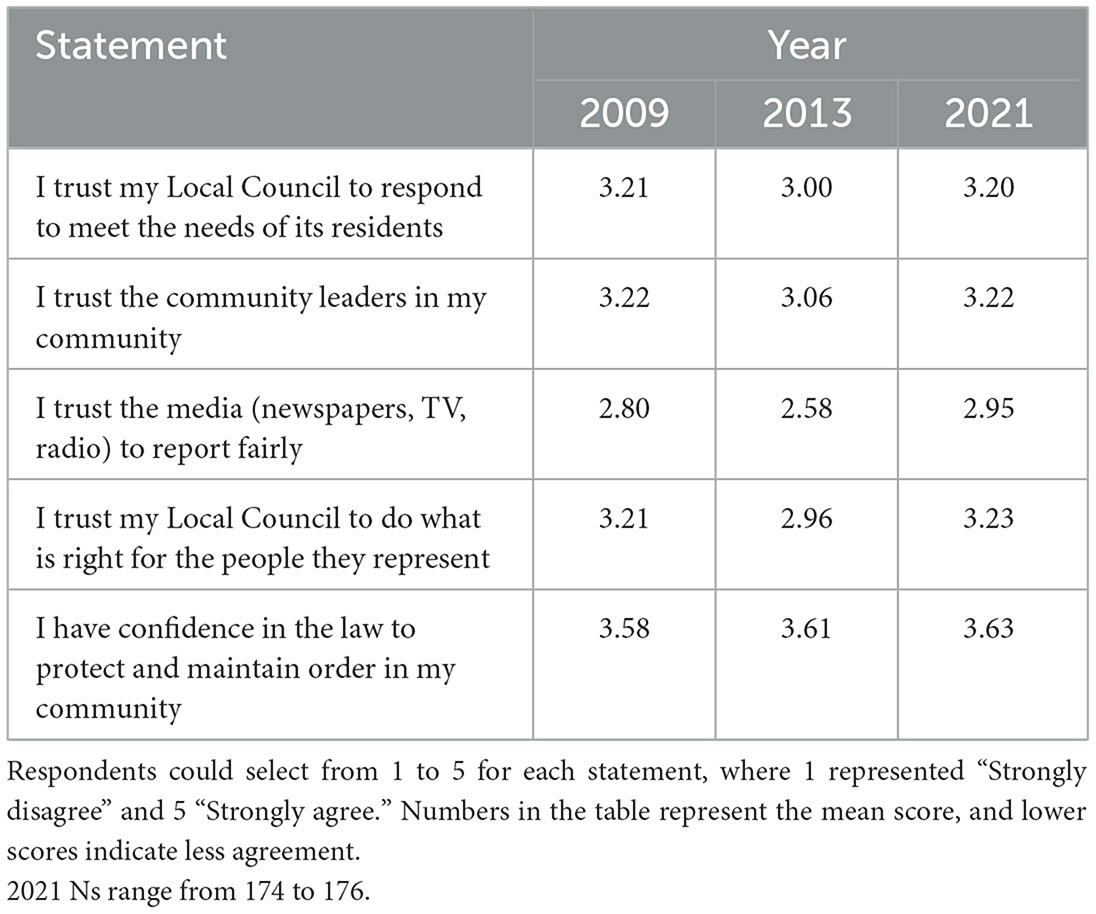
Although the differences were modest, all but one of the statements of trust in various groups were scored lower in 2013 compared to 2009 and 2021 (Table 7). This pattern indicates that community trust in three of the four tested domains (local council, community leaders, and the media) decreased during the earthquake sequence. It is possible that aspects of the earthquake response in the first 2 years were perceived to be mishandled, lowering community trust in various groups. If this is the case, the negative impacts on trust in key groups have recovered to pre-earthquake levels. Of note, trust in the law remained high and stable across time. This could be due to: (1) police efforts in the response and recovery to the earthquakes falling in line with community expectations (and therefore not lowering trust); (2) police involvement mostly being focused in the immediate response and so any impacts of their actions on trust (positive or negative) having faded; and/or (3) that police were not generally perceived to be involved in earthquake-related efforts.
3.9 Preparedness: survival, structural and emergency planning/training
Some changes to preparedness items were made between the 2013 and 2021 survey. Some items were dropped in the 2021 survey because they were deemed not as relevant in the current context (e.g., knowledge about the Canterbury Home Repair Scheme). One item was changed to reflect changes in preparedness advice. In particular, the item “I know where a possible Civil Defence Center for my area is and how to find out during an emergency if it will be opened,” in the 2021 survey replaced the item “I know where the evacuation center for my area is,” from the 2013 survey to better reflect the current plan for emergency centers. Differences in this item warrant being interpreted with greater caution.
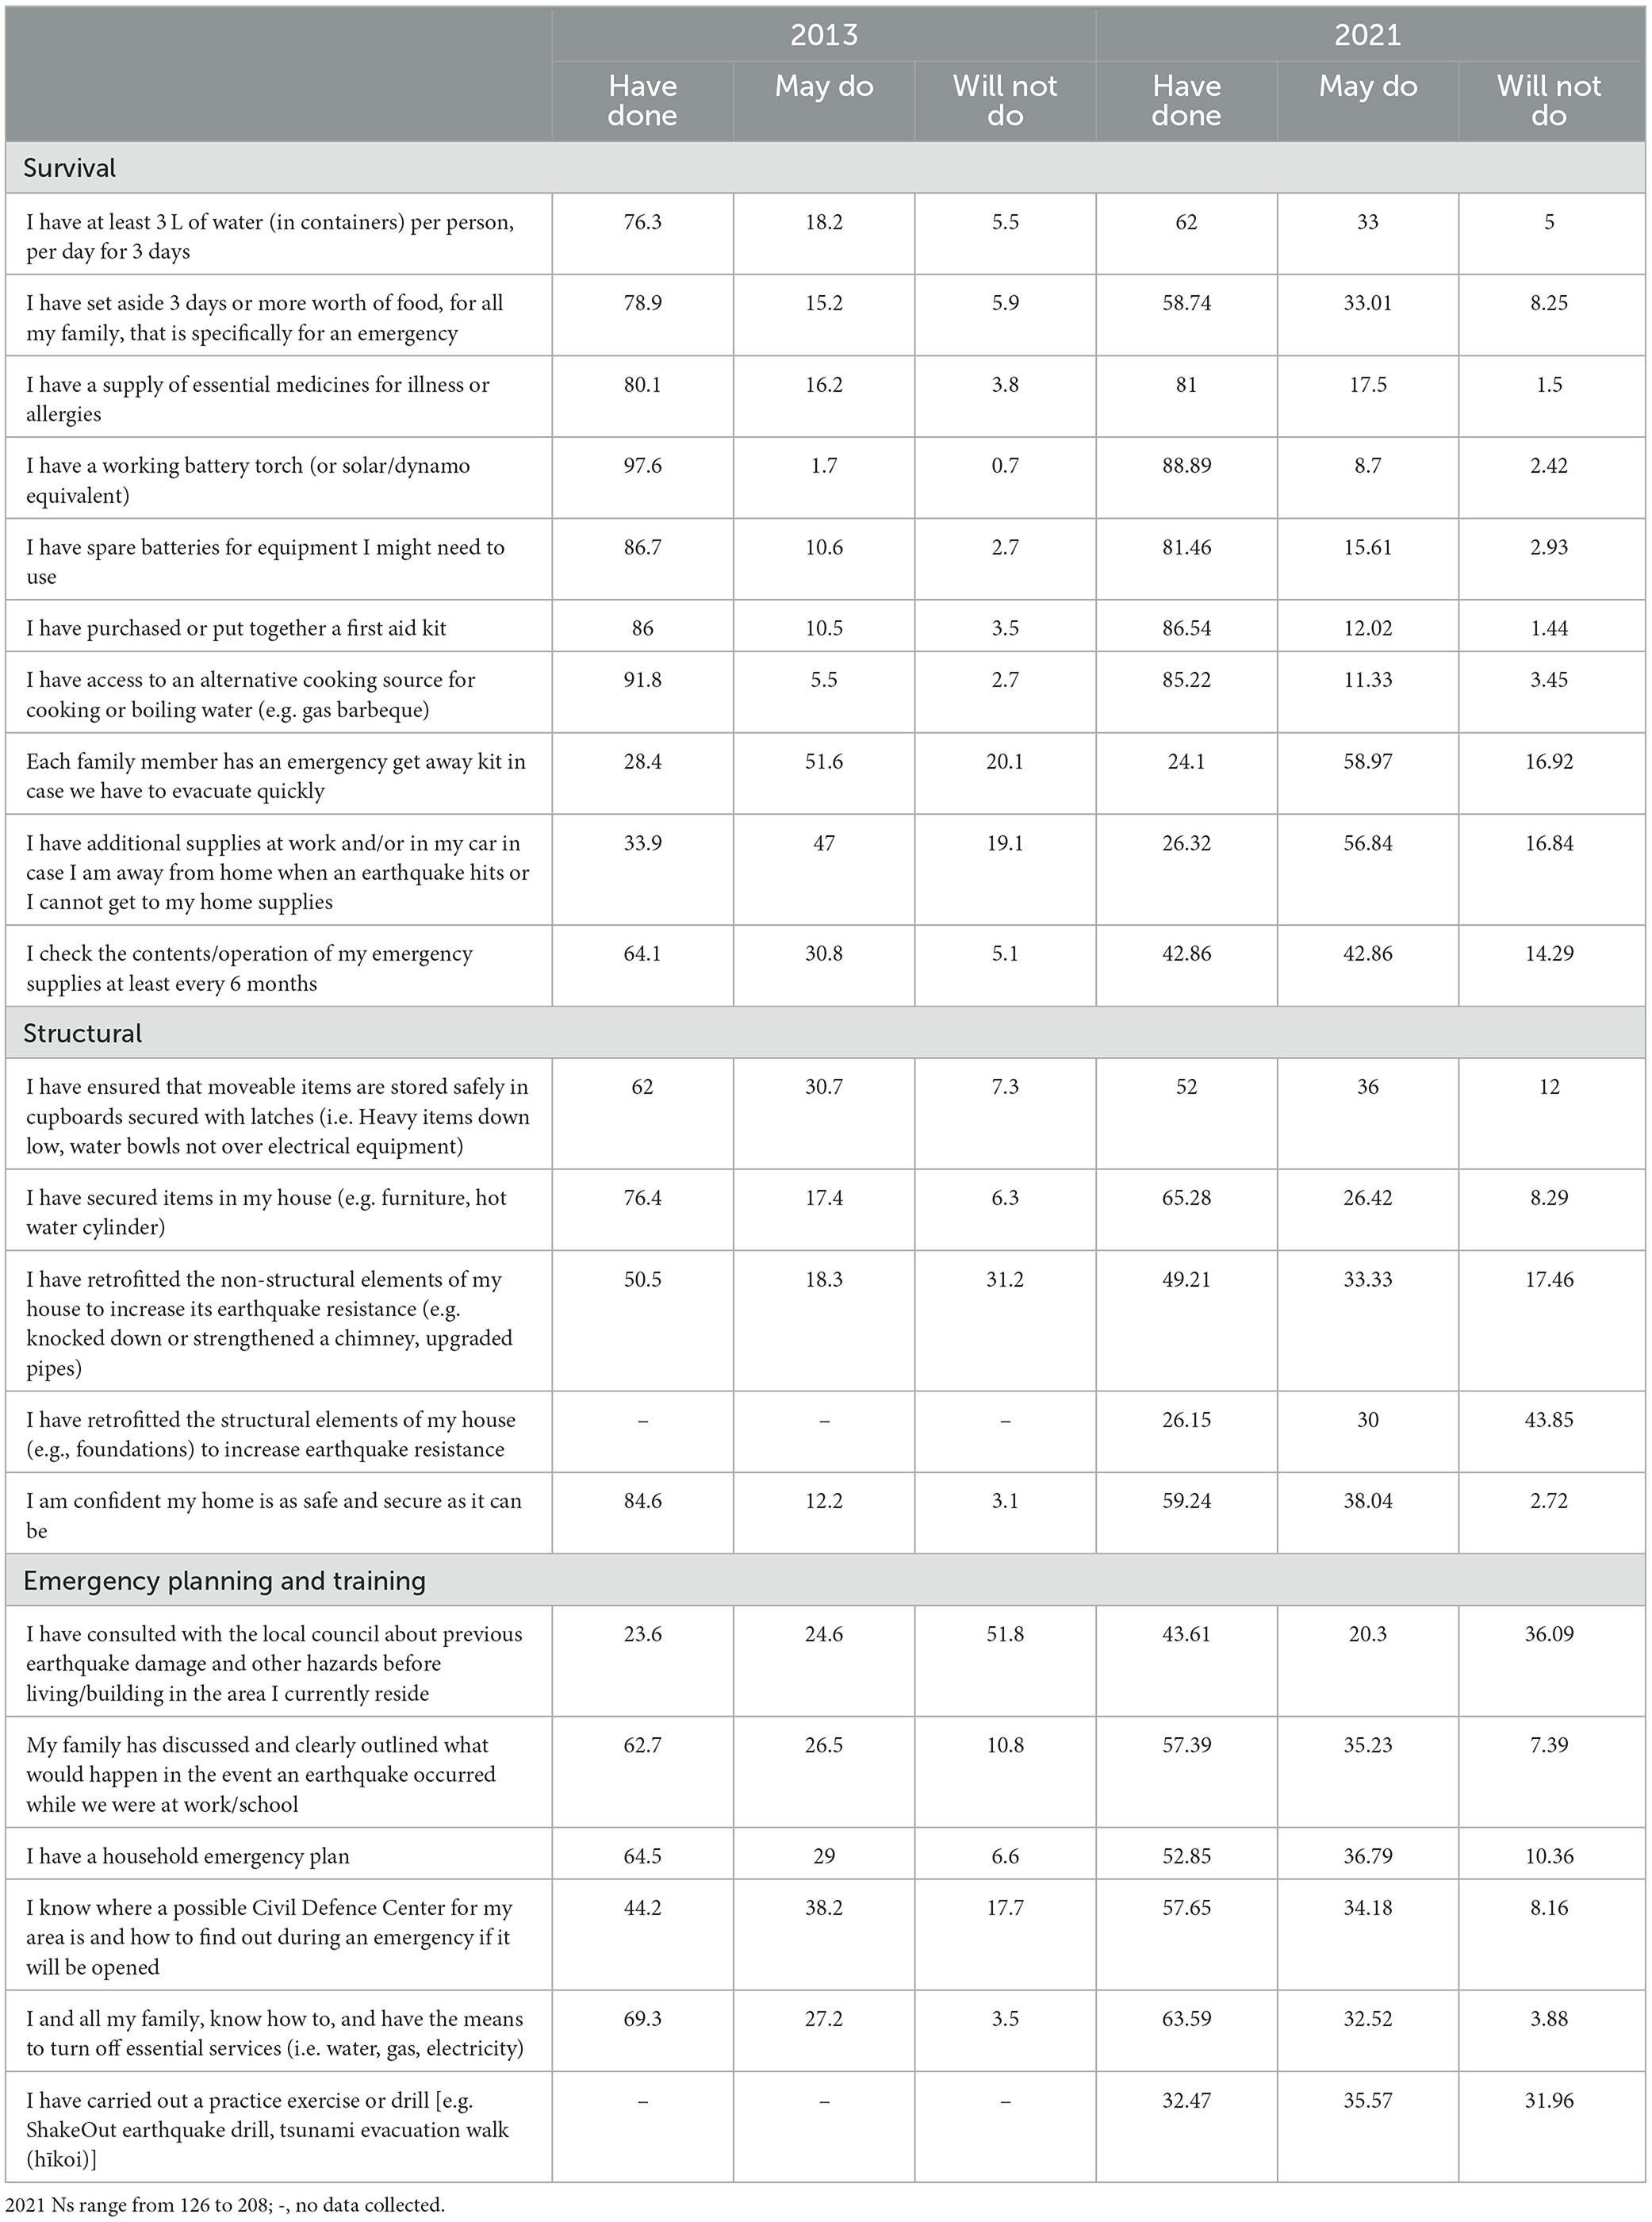
As seen in Table 8, there are some noticeable patterns and differences. As expected, across both surveys, survival actions are typically more common than mitigation actions, which are in turn more common than community actions. The most commonly taken actions across both surveys are primarily actions that are useful when power is lost regardless of reason, such as having an alternative cooking source and a battery torch. Generally, fewer participants in the 2021 survey reported that they had undertaken each preparation action than in 2013. A considerable number in 2021 indicated that they may take the action, raising the long-standing question of how to convert intentions into action without the influence of a recent earthquake.
Some differences are of particular note. The percentage of participants who have retrofitted non-structural elements of their home did not change between the two surveys, but the proportion of people who said they may do this action was considerably higher in 2021 (33.3%) than in 2013 (18.3%). This difference may align with a decrease between 2013 and 2021 in the percentage of participants who were confident that their home was safe and secure (84.6% down to 59.2%) and an increase in the proportion who sought information about previous earthquake damage and other hazards before living or building in the area in which they currently reside (23.6% up to 43.6%).
As the list of preparedness items changed between the 2009 and 2013 surveys not all items can be compared across timeframes. However, several items were the same or very similar and are therefore reported here. Across all but two of these items that could be compared, preparation levels were lower in 2009 than both 2013 and 2021. This pattern indicates that preparation increased after the earthquakes, and has since decreased but largely remains above pre-earthquake levels.
The percentage who had a first aid kit (82.9%) and a battery torch (83.4%) was lower in 2009 than in 2013 and 2021; the percentage who had stored water (40.7%), made an emergency plan (27.2%), had spare batteries (58.9%), and checked the contents of their emergency supplies at least every 6 months (18.2%) were much lower in 2009 than in 2013 and 2021. These items in particular may show some of the lessons from the earthquake experiences. The percentage who had a supply of essential medicines (78.0%) was about the same as the 2013 and 2021 surveys, suggesting that people in Canterbury may not have struggled with accessing essential medicine during the earthquakes. Fewer people had an alternative cooking method in 2009 (85.3%) than in 2013, but rates were similar to the 2021 survey. This change, from 85 to 92% to 85% indicates a shorter-term influence of earthquake experience than is suggested by the other items for which there is data across all three surveys.
3.10 Preparedness: community- community relationships
The percentage of participants who passed on information about hazards and earthquake preparation and who worked with community groups to increase awareness and preparation was considerably higher in 2021 than 2013 (Table 9). It is possible that participants in 2013 did not undertake these actions because they assumed others in their community already had sufficient information and were preparing; this latter point reflects reality in that participants were more likely to say they were passing on information and encouraging others to prepare in 2021 when actual preparation rates were lower.
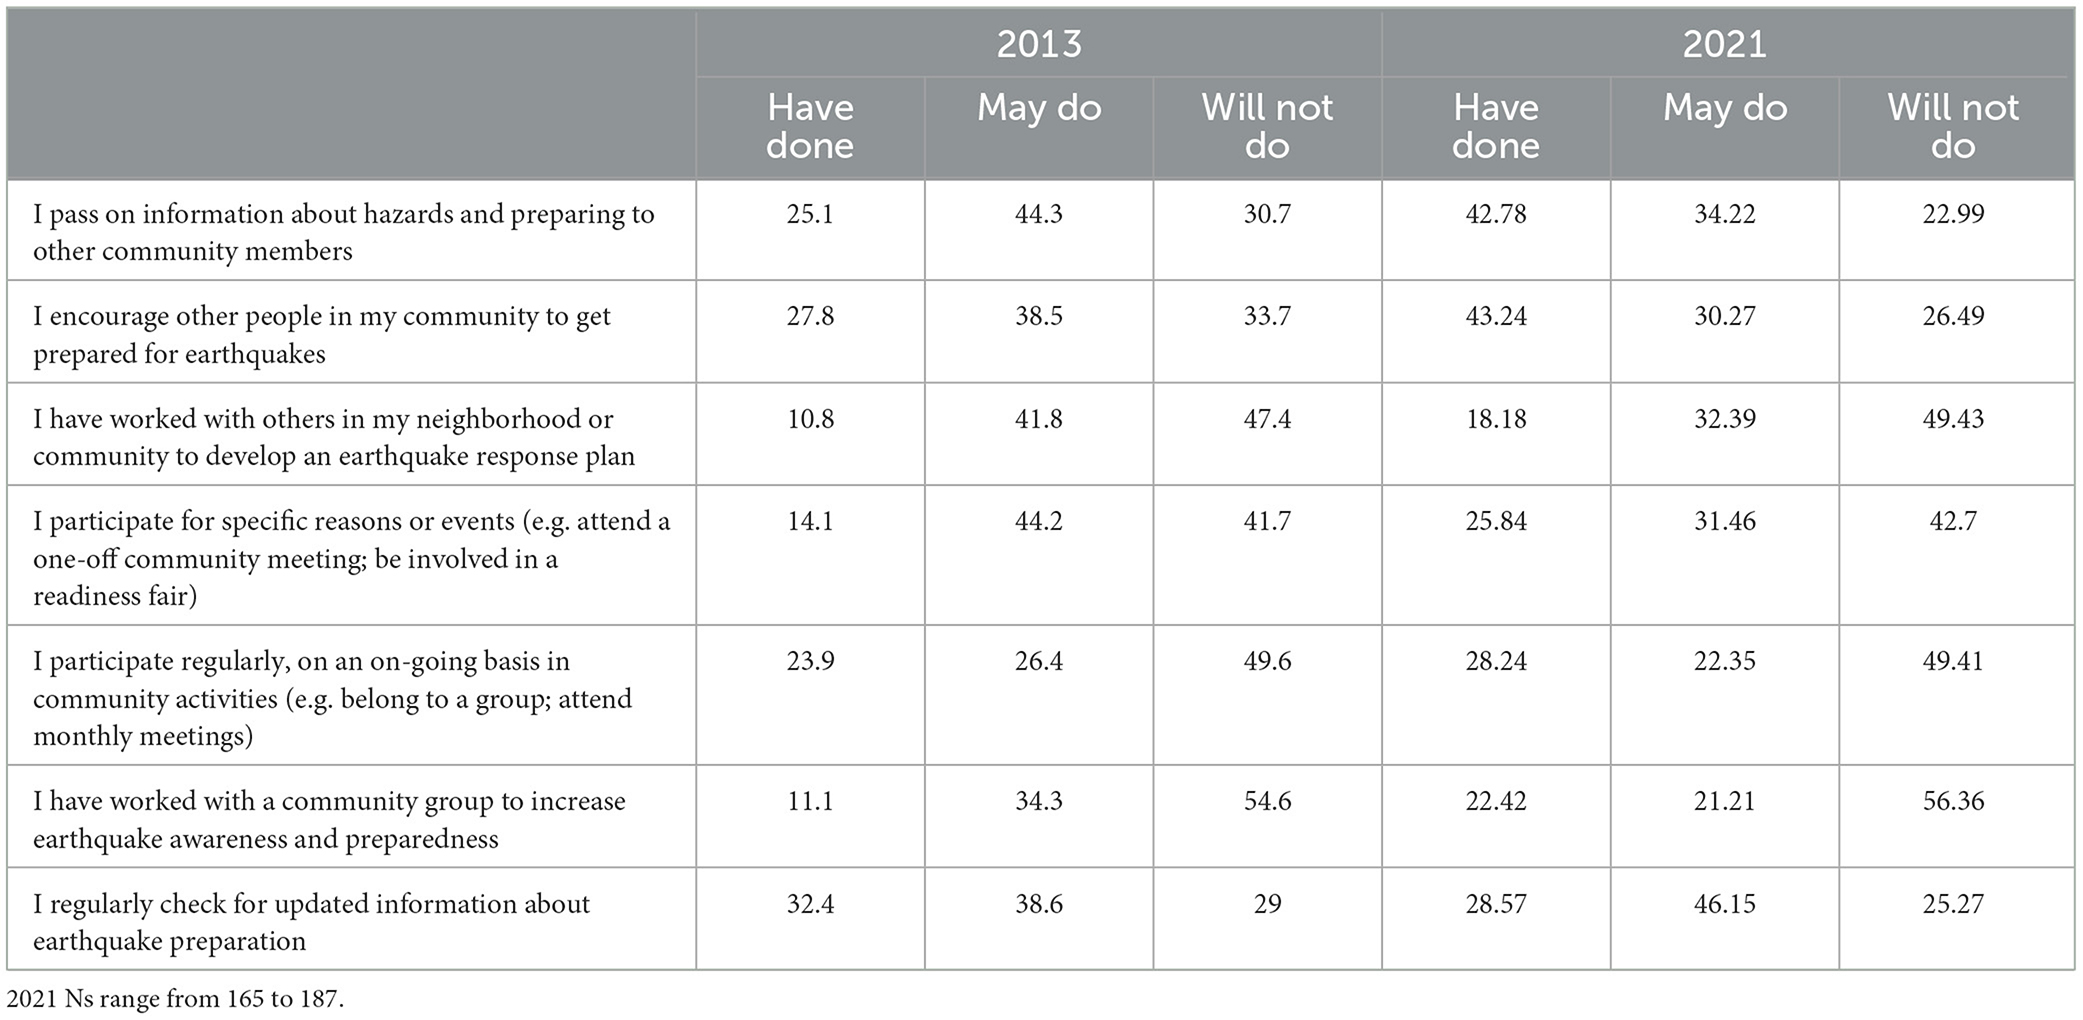
Table 9. Frequency (%) of community preparedness actions in 2013 and 2021 (community-community relationships).
3.11 Preparedness: community-agency relationships
With community-agency relationships identified in 2013 as a functional category of readiness (Paton et al., 2015, 2017) survey participants were asked to indicate whether certain actions that “can be undertaken by the community and agencies to limit the potential damage and disruption in an earthquake occurs” had been done, should be done, or did not need to be done. This question was not asked in 2009, but comparing responses between 2013 and 2021 can indicate whether expectations of particular agencies have changed from the early to late recovery phase. Participants in the 2021 survey were given a “Don't know” option; the percentages presented in Table 10 are the proportion of participants who gave that response from the total number of participants who gave a definitive response (i.e., did not answer “Don't know”). Notably, the percentage of participants who said they did not know if particular actions should, had, or did not need to be done ranged from 35.6 to 56.0%, indicating that overall many residents of Canterbury are not aware of what agencies are or should be doing.
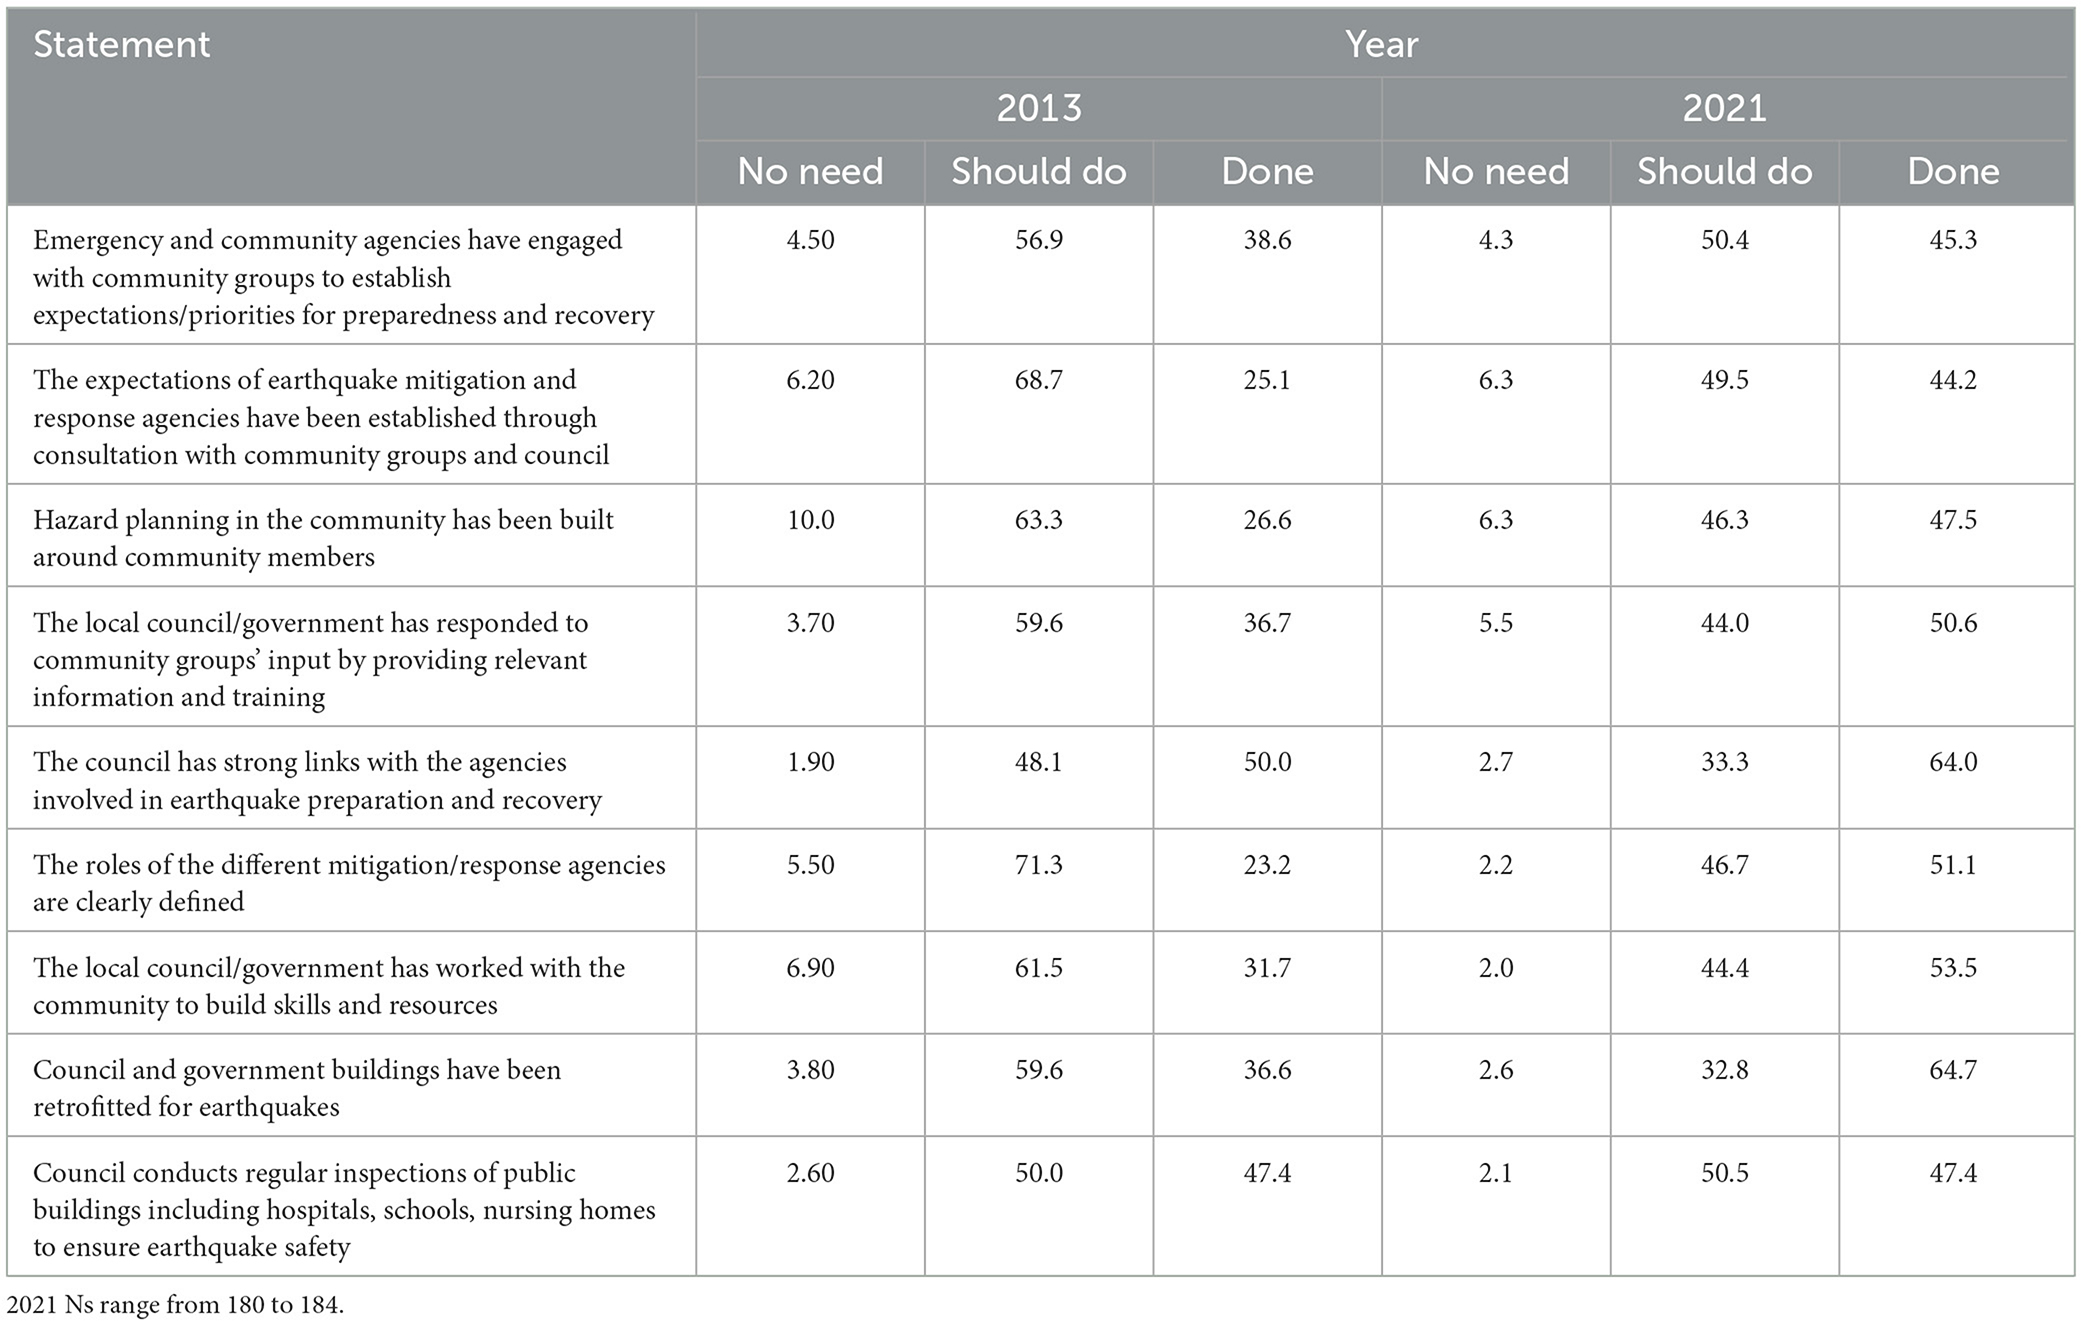
Table 10. Expectations and perceptions of agency actions relating to earthquakes and emergencies (community-agency relationships) (%).
With only one exception, more participants thought agencies had undertaken particular actions in 2021 compared to 2013. This pattern likely reflects the work that has continued in the Canterbury region since the initial response and early recovery phases. The percentage of people who thought that council was carrying out regular inspections of public buildings was identical between the two surveys.
Although more people saw actions being taken in 2021, the proportion of participants who thought that all actions should be done, but were not, was substantial, ranging from one-third to one-half. In the 2021 survey in particular, more participants thought that agencies should be doing the following actions than think that the actions have been done: (1) engage with community groups to establish expectations and priorities for preparedness and recovery; (2) establish expectations of earthquake mitigation and response agencies through consultation with community groups and council; and (3) conduct regular inspections of public buildings to ensure earthquake safety.
4 Discussion
Our study demonstrates that preparedness is dynamic and changes over time due to direct and indirect influences upon peoples' attitudes, beliefs, and capacity to prepare. Through the evolution of preparedness in our data, we note that levels of preparedness increase after people experience an event. This is not an uncommon phenomenon with both research and NZ emergency management evaluation data showing trends of increased preparedness after earthquakes from the CES, and Kaikōura (McClure et al., 2013; Doyle et al., 2018; Vinnell et al., 2019; Habibi and Feld, 2020; Kantar Public/Colmar Brunton, 2021; StatsNZ, 2022). It has been observed that increases in preparedness can occur because disaster events raise people's concerns, contribute to building new knowledge, influence beliefs about risk or the importance of preparing, help people understand the consequences of future events, prompt critical awareness, and motivate community interaction (Becker et al., 2017).
Such events are often referred to as “windows of opportunity” (McClure et al., 2016; Doyle et al., 2018), whereby preparedness can be promoted, particularly in locations farther afield from the damaged area. Research indicates that these opportunities might last for up to 2 years (Habibi and Feld, 2020), even beyond the area of impact, and public education can take advantage of these timeframes (Dooley et al., 1992). However, the context might also dictate what types of information are promoted during these periods. In the Canterbury context, people were not always receptive to large amounts, or certain types (e.g., earthquake drill information) of preparedness information immediately after the two largest earthquakes, as their focus was dealing with the immediate impacts of the 2010–2011 earthquakes (McBride et al., 2019). There was evidence to suggest that in the midst of dealing with the earthquakes, they struggled also to process such information, and had to be reminded several times, which is something common to people dealing with disasters (Worley et al., 2024). Therefore, careful thought warrants being given to the information that is presented during periods of earthquake activity, with a focus on more direct, applicable, actionable advice, relevant to the context. It also speaks to the necessity of having had effective public education before an event, as it is during this time that people can learn about preparedness actions, which they can undertake beforehand, or apply subsequently in the wake of an event.
Our data also showed that certain types of preparedness evolved in Canterbury, with increases in people preparing with particular survival items or activities—like storing water, making an emergency plan, keeping spare batteries, and checking the contents of emergency supplies at least every 6 months. It is likely that people's experiences of the earthquakes and impacts influenced their beliefs and choices over what types of preparedness to take, as they potentially saw the benefits of such items play out (e.g., disruptions to the city water supply (Cubrinovski et al., 2014) meant that it became more obvious that storing water was beneficial). It is likely that these preparedness actions were prompted by a complex interaction between heightened risk perception and concern about threats to safety and daily life (based on experiences) (Dooley et al., 1992; Lindell and Prater, 2000; Paton et al., 2000; Siegel et al., 2003; Doyle et al., 2018), combined with lower perceived barriers to preparing, and an increased positive outcome expectancy that preparedness can help with daily life (Becker et al., 2013). Of note the 2013 Canterbury survey did not find a strong direct relationship for positive outcome expectancy (Paton et al., 2015) with either survival preparedness or community-community relationships; however the 2009 survey (Becker, 2010) found that it indirectly linked via community participation and collective efficacy. We hypothesize that a similar indirect relationship likely exists in the post-earthquake context, and this could be tested with the data we have collected.
Conversely, some experiences may have also hindered certain types of preparedness. Over time, the surveys showed that people were less likely to think that preparedness could reduce damage to their home (reduced positive outcome expectancy), which was somewhat reflected in the limited level of structural (e.g., securing foundations) and non-structural (e.g., securing bookshelves) preparedness actions undertaken by participants. However, without a qualitative study involving the same participants, it is difficult to ascertain the reasons why people were less likely to make these structural or non-structural changes—their houses may have already sustained damage and any issues fixed, leading them to think no further action was required, or they may have thought that this type of action is too difficult to undertake. Given that around a third suggest that they “may” still undertake some kind of structural or non-structural changes, it appears that this is not off the table for many. Information and support (e.g., face-to-face interactions) may be required to help prompt these specific mitigation actions, so that householders can move from intentions to preparedness.
The data across time periods also highlight that critical awareness-thinking and talking about earthquakes-also increased after the earthquakes and was still elevated in 2021 when compared with 2009. However, we did not collect data on what people were discussing or where they were having their conversations. It is likely that initial conversations around 2013 were more focussed on earthquake experiences such as shaking and impact and how one responded to these (Walsh et al., 2013; Becker et al., 2019; CEISMIC, 2023), rather than preparedness. Such conversations present the opportunity to harness interest in earthquakes and direct people's attention toward preparing, however, it is unclear in which context this is most achievable. It is possible that some conversations about preparedness can be useful immediately after a large earthquake, especially if they are relevant to what has recently happened. Work by McClure et al. (2011) also suggests that immediately after a significant event, risk perceptions increase, even in locations at a distance from the earthquakes, and thus for centers farther afield of the impact there lies an opportunity to direct such conversations toward preparedness. As time passes, opportunities might also arise to direct conversations toward preparedness in locations closer to the earthquake. However, data analyzed from the University of Canterbury CEISMIC QuakeBox Project stories archive (CEISMIC, 2023) indicate that interviewees from 2020 rarely volunteered information about preparedness, but still spoke more predominantly about their recalled experiences of the CES (possibly due to the focus of the research, however). Therefore, facilitation might be required (e.g., by emergency managers or other agency staff) to allow people to discuss their experiences, but also direct their thinking toward how they might better prepare. One avenue for this is through a two-way conversation via participation and engagement between public officials and residents, as suggested in Doyle and Becker (2022).
The value of such community participation is recognized in the Paton (2019, 2022) CET model, as it develops collective efficacy and empowerment to deal with earthquake issues and engenders trusted relationships with agencies, leading to action. As highlighted by our study, these aspects have been measured in Canterbury over time. However, we found little change in community participation, collective efficacy, and empowerment over time, despite an obvious increase in conversations and a well-documented collective response to the earthquake (Carlton and Vallance, 2013). It is possible that participation post-Darfield, then, occurred through existing groups or existing mechanisms, and people drew upon these relationships in solving their issues post-earthquake. Evidence exists to support this premise, as over 450 groups activated after the earthquakes during the response, with 167 identified as existing prior to the CES (Carlton and Vallance, 2013), indicating that people made use of the groups with which they were already involved. Consequently, from an information standpoint, such groups remain an excellent point of contact for information provision and support, both before and after a large earthquake. Additionally, Vallance (2015) argues that the nature of participation post-earthquake was constrained to “token” efforts and may have limited true community engagement. Emergency managers could continue to work with existing groups to relay preparedness information and develop collective solutions to earthquake issues in ways that are meaningful. This also highlights the importance of social networks and the need to develop them before an earthquake (Aldrich, 2017), as existing networks were drawn upon during and after the earthquakes.
One type of community preparedness that emerged more strongly in 2021 was that of community members passing on information, as opposed to 2013 where this was not as prominent. It is possible that people felt less need to share information in 2013 because less time had passed since the initial earthquakes, so information may have been more readily available from other sources. However, this finding also indicates that over time the dynamics of information sharing has changed. As time has passed people are becoming more interested in sharing information, while closer to the initiation of the earthquake sequence other aspects of response may have taken priority. This may mean that agencies are now able to engage in different types of activities. Whereas preparedness information was not widely circulated in 2013, it is now becoming more acceptable as a public education activity. There is also a greater proportion who think that agencies should be engaging more with the public, suggesting that people are open to receiving this information through an engagement process. An overall decrease in trust in agencies over the course of the sequence sequence (likely due to poor earthquake-related interactions with agencies) could be addressed through more thorough engagement, although levels of trust had recovered by 2021.
Likewise, considerations about whose responsibility it is to prepare are also being thought about more by the public in 2021, meaning that community-agency relationships may be open for negotiation and improvement. Some suggest that they understand the actions agencies have taken to prepare, while others are unaware of agencies preparedness actions and responsibilities. Increased thought about the role of agencies provides an opportunity for such agencies to step in and have a conversation about preparedness responsibilities via two-way-engagement. However, on the other hand, given the raised consideration about agencies and their role over time, it is possible that there may also be an unintended degree of transfer of responsibility occurring whereby people transfer preparedness back on to agencies, in lieu of doing it themselves. This is a commonly observed phenomena in the literature and can negatively impact individual preparedness behavior (Paton et al., 2005; Becker et al., 2013; Nikkanen et al., 2023). It may be important over 10 years into a sequence to address this transfer of responsibility, by opening a conversation, defining the roles of agencies, and continuing to reiterate the personal responsibility people also have for preparing.
Paton's (2019, 2022) CET model provided a basis for exploring earthquake preparedness issues over time. By running surveys at timepoints in 2009, 2013, and 2021, we were able to see find small changes over time. Notably, there were nuances in aspects of risk perception and outcome expectancy, that are likely explained by people's experiences of disruption and damage after the earthquakes, and have implications for preparedness information. Our findings potentially support the importance that risk perception plays in the model, and the role of outcome expectancy, particularly as mediating variables. However, as the data presented in this paper are merely descriptive, more work is required to verify this relationship. Additionally, similar to risk perception and outcome expectancy, aspects such as critical awareness (thinking, and talking about earthquakes), a willingness to pass on more information to other community members (community-community relationships), and consideration about the roles of agencies (community-agency relationships) have increased over time, highlighting the importance of considering how such models can better incorporate the dynamics of time. Potentially providing a different emphasis on certain model factors over different timeframes may help better guide public education and information efforts before, during, and after earthquake sequences.
Data availability statement
The datasets presented in this study can be found in online repositories. The names of the repository/repositories and accession number(s) can be found at: https://doi.org/10.17605/OSF.IO/4T9U6.
Ethics statement
The requirement of ethical approval was waived by Massey University Human Ethics Committee for the studies involving humans because the research was reviewed and deemed to be low risk - therefore a Low Risk Notification was provided. The studies were conducted in accordance with the local legislation and institutional requirements. Written informed consent for participation was not required from the participants or the participants' legal guardians/next of kin because by filling out the survey, respondents were informed that this implied their agreement to participate.
Author contributions
JB: Conceptualization, Formal analysis, Funding acquisition, Investigation, Methodology, Supervision, Writing – original draft, Writing – review & editing. LV: Formal analysis, Investigation, Methodology, Writing – original draft. ED: Formal analysis, Methodology, Writing – original draft, Writing – review & editing. SM: Writing – original draft, Writing – review & editing. DP: Conceptualization, Investigation, Methodology, Writing – original draft. DJ: Conceptualization, Funding acquisition, Methodology, Writing – review & editing.
Funding
The author(s) declare financial support was received for the research, authorship, and/or publication of this article. Funding for this study was provided by: Massey University Research Fund; Kia Manawaroa – Ngā kina o Te Ao Tūroa Resilience to Nature's Challenges; and Te Hiranga Rū QuakeCore, an Aotearoa New Zealand Tertiary Education Commission-funded Center (QuakeCoRE publication no. 980).
Conflict of interest
The authors declare that the research was conducted in the absence of any commercial or financial relationships that could be construed as a potential conflict of interest.
Publisher's note
All claims expressed in this article are solely those of the authors and do not necessarily represent those of their affiliated organizations, or those of the publisher, the editors and the reviewers. Any product that may be evaluated in this article, or claim that may be made by its manufacturer, is not guaranteed or endorsed by the publisher.
Author disclaimer
Any use of trade, firm, or product names is for descriptive purposes only and does not imply endorsement by the U.S. Government.
References
Aldrich, D. P. (2017). “The importance of social capital in building community resilience,” in Rethinking Resilience, adaptation and Transformation in a Time of Change, eds. W. Yan, and W. Galloway (Cham: Springer), 357–364. doi: 10.1007/978-3-319-50171-0_23
Bannister, S., and Gledhill, K. (2012). Evolution of the 2010–2012 Canterbury earthquake sequence. N. Z. J. Geol. Geophys. 55, 295–304. doi: 10.1080/00288306.2012.680475
Becker, J. S. (2010). “Understanding disaster preparedness and resilience in Canterbury: results of interviews, focus groups and a questionnaire survey,” in GNS Science Report 2010/50, (Lower Hutt), 97.
Becker, J. S., McBride, S. K., Vinnell, L. J., Saunders, W. S., Leonard, G. S., Sullivan, T. J., et al. (2022). “Earthquakes and tsunami,” in Routledge Handbook of Environmental Hazards and Society, eds. T. K. McGee, and E. C. Penning-Rowsell (London: Routledge), 13–32. doi: 10.4324/9780367854584-4
Becker, J. S., Paton, D., and Johnston, D. M. (2015). “Communication of risk: a community resilience perspective,” in GNS Science Report 2015/66 (Lower Hutt), 30.
Becker, J. S., Paton, D., Johnston, D. M., and Ronan, K. R. (2013). Salient beliefs about earthquake hazards and household preparedness. Risk Anal. 33, 1710–1727. doi: 10.1111/risa.12014
Becker, J. S., Paton, D., Johnston, D. M., Ronan, K. R., and McClure, J. (2017). The role of prior experience in informing and motivating earthquake preparedness. Int. J. Disaster Risk Reduct. 22, 179–193. doi: 10.1016/j.ijdrr.2017.03.006
Becker, J. S., Potter, S. H., McBride, S. K., Wein, A., Doyle, E. E. H., Paton, D., et al. (2019). When the earth doesn't stop shaking: how experiences over time influenced information needs, communication, and interpretation of aftershock information during the Canterbury Earthquake Sequence, New Zealand. Int. J. Disaster Risk Reduct. 34, 397–411. doi: 10.1016/j.ijdrr.2018.12.009
Carlton, S., and Vallance, S. (2013). An inventory of community-led and non-governmental organisations and initiatives in post-earthquake Canterbury. Lincoln.
CEISMIC (2023). The UC QuakeBox Project: Creation of a community-focused research archive. Available online at: https://www.ceismic.org.nz/search/39648636/ (accessed March 27, 2024).
Cubrinovski, M., Hughes, M., and O'Rourke, T. D. (2014). Impacts of liquefaction on the potable water system of Christchurch in the 2010–2011 Canterbury (NZ) earthquakes. J. Water Supply Res. Technol. 63, 95–105. doi: 10.2166/aqua.2013.004
Dooley, D., Catalano, R., Mishra, S., and Serxner, S. (1992). Earthquake preparedness: predictors in a community survey 1. J. Appl. Soc. Psychol. 22, 451–470. doi: 10.1111/j.1559-1816.1992.tb00984.x
Doyle, E. E., and Becker, J. S. (2022). “Understanding the risk communication puzzle for natural hazards and disasters,” in Oxford Research Encyclopedia of Natural Hazard Science (Oxford: Oxford University Press). doi: 10.1093/acrefore/9780199389407.013.208
Doyle, E. E., McClure, J., Potter, S. H., Becker, J. S., Johnston, D. M., Lindell, M. K., et al. (2018). Motivations to prepare after the 2013 Cook Strait Earthquake, NZ. Int. J. Disaster Risk Reduct. 31, 637–649. doi: 10.1016/j.ijdrr.2018.07.008
Emergency Management Canterbury (2024). Canterbury Ready. Available online at: https://www.cdemcanterbury.govt.nz/ (accessed March 31, 2024).
Fischhoff, B., Kadvany, J., and Kadvany, J. D. (2011). Risk: A Very Short Introduction. Oxford: Oxford University Press. doi: 10.1093/actrade/9780199576203.001.0001
GNS Science (2016). Large New Zealand Earthquakes. Available online at: www.gns.cri.nz (accessed October 9, 2024).
Habibi, H., and Feld, J. (2020). The effects of earthquake exposure on preparedness in the short and long term: a difference-in-differences estimation. Nat. Hazards 104, 1443–1463. doi: 10.1007/s11069-020-04227-x
Kaiser, A., Balfour, N., Fry, B., Holden, C., Litchfield, N., Gerstenberger, M., et al. (2017). The 2016 Kaikoura, New Zealand, earthquake: preliminary seismological report. Seismol. Res. Lett. 88, 727–739. doi: 10.1785/0220170018
Kaiser, A., Holden, C., Beavan, J., Beetham, D., Benites, R., Celentano, A., et al. (2012). The Mw 6.2 Christchurch earthquake of February 2011: preliminary report. N. Z. J. Geol. Geophys. 55, 67–90. doi: 10.1080/00288306.2011.641182
Kantar Public/Colmar Brunton (2021). Disaster Preparedness Survey 2021. Available online at: https://www.civildefence.govt.nz/assets/Uploads/documents/public-education/disaster-preparedness-survey/report-disaster-preparedness-survey-en-jul21.pdf (accessed March 27, 2024).
Lindell, M. K., Arlikatti, S., and Prater, C. S. (2009). Why people do what they do to protect against earthquake risk: perceptions of hazard adjustment attributes. Risk Anal. 29, 1072–1088. doi: 10.1111/j.1539-6924.2009.01243.x
Lindell, M. K., and Prater, C. S. (2000). Household adoption of seismic hazard adjustments: a comparison of residents in two states. Int. J. Mass Emerg. Disasters 18, 317–338. doi: 10.1177/028072700001800203
McBride, S. K. (2017). The Canterbury tales: an insider's lessons and reflections from the Canterbury Earthquake Sequence to inform better public communication models: a thesis presented in fulfilment of the requirements for the degree of Doctor of Philosophy, Massey University, Wellington, New Zealand [Doctoral dissertation]. Auckland: Massey University.
McBride, S. K., Becker, J. S., and Johnston, D. M. (2019). Exploring the barriers for people taking protective actions during the 2012 and 2015 New Zealand ShakeOut drills. Int. J. Disaster Risk Reduct. 37:101150. doi: 10.1016/j.ijdrr.2019.101150
McClure, J., Henrich, L., Johnston, D., and Doyle, E. E. (2016). Are two earthquakes better than one? How earthquakes in two different regions affect risk judgments and preparation in three locations. Int. J. Disaster Risk Reduct. 16, 192–199. doi: 10.1016/j.ijdrr.2016.03.003
McClure, J., Johnston, D., and Henrich, L. (2013). “Changes in preparedness and earthquake risk perception: lessons from the 2010 and 2011 Canterbury earthquakes,” in Report for the University of Wellington (New Zealand) (Wellington).
McClure, J., Spittal, M. J., Fischer, R., and Charleson, A. (2015). Why do people take fewer damage mitigation actions than survival actions? Other factors outweigh cost. Nat. Hazards Rev. 16:04014018. doi: 10.1061/(ASCE)NH.1527-6996.0000152
McClure, J., Wills, C., Johnston, D., and Recker, C. (2011). How the 2010 Canterbury (Darfield) earthquake affected earthquake risk perception: comparing citizens inside and outside the earthquake region. Australas. J. Disaster Trauma Stud. 2011, 3–10.
McLennan, J., Marques, M., and Every, D. (2020). Conceptualising and measuring psychological preparedness for disaster: the psychological preparedness for Disaster Threat Scale. Nat. Hazards 101, 297–307. doi: 10.1007/s11069-020-03866-4
Morrissey, S. A., and Reser, J. P. (2003). Evaluating the effectiveness of psychological preparedness advice in community cyclone preparedness materials. Aust. J. Emerg. Manag. 18, 46–61.
Mulilis, J. P., Duval, T. S., and Lippa, R. (1990). The effects of a large destructive local earthquake on earthquake preparedness as assessed by an earthquake preparedness scale. Nat Hazards 3, 357–371. doi: 10.1007/BF00124393
National Emergency Management Agency (2024). Get Ready. Available online at: https://getready.govt.nz/ (accessed June 21, 2024).
Nikkanen, M., Malinen, S., and Laurikainen, H. (2023). What drives feelings of responsibility for disaster preparedness? A case of power failures in Finland and New Zealand. Risk Hazards Crisis public Policy 14, 188–208. doi: 10.1002/rhc3.12263
Paton, D. (2019). Disaster risk reduction: psychological perspectives on preparedness. Aust. J. Psychol. 71, 327–341. doi: 10.1111/ajpy.12237
Paton, D. (2022). Advanced Introduction to Disaster Risk Reduction. London: Edward Elgar Publishing.
Paton, D., Anderson, E., Becker, J., and Petersen, J. (2015). Developing a comprehensive model of hazard preparedness: lessons from the Christchurch earthquake. Int. J. Disaster Risk Reduct. 14, 37–45. doi: 10.1016/j.ijdrr.2014.11.011
Paton, D., Anderson, E., Becker, J., and Petersen, J. (2017). “Understanding functional earthquake readiness: development and preliminary validation of earthquake readiness measures and predictors,” in GNS Science Report 2016/062 (Lower Hutt).
Paton, D., Becker, J. S., Johnston, D. M., Buergelt, P., Tedim, F., Jang, L.-J., et al. (2024). The development and use of Community Engagement Theory (CET) to inform readiness interventions for natural hazard events. Austalas. J. Disaster Trauma Stud. 1, 1–20.
Paton, D., Johnston, D., Bebbington, M. S., Lai, C. D., and Houghton, B. F. (2000). Direct and vicarious experience of volcanic hazards: implications for risk perception and adjustment adoption. Aust. J. Emerg. Manag. 15, 58–63.
Paton, D., Johnston, D., Mamula-Seadon, L., and Kenney, C. M. (2014). Recovery and development: perspectives from New Zealand and Australia. Disaster and development: Examining Global Issues and Cases, eds. N. Kapucu, and K. Liou (Cham: Springer), 255–272. doi: 10.1007/978-3-319-04468-2_15
Paton, D., Smith, L., and Johnston, D. (2005). When good intentions turn bad: promoting natural hazard preparedness. Aust. J. Emerg. Manag. 20, 25–30.
Potter, S. H., Becker, J. S., Johnston, D. M., and Rossiter, K. P. (2015). An overview of the impacts of the 2010-2011 Canterbury earthquakes. Int. J. Disaster Risk Reduct. 14, 6–14. doi: 10.1016/j.ijdrr.2015.01.014
Quigley, M. C., Hughes, M. W., Bradley, B. A., van Ballegooy, S., Reid, C., Morgenroth, J., et al. (2016). The 2010–2011 Canterbury earthquake sequence: environmental effects, seismic triggering thresholds and geologic legacy. Tectonophysics 672, 228–274. doi: 10.1016/j.tecto.2016.01.044
Red Cross (2024). Prepare for a disaster – get Good and Ready. Available online at: https://www.redcross.org.nz/get-help/emergencies-and-disasters/prepare-for-a-disaster-get-good-and-ready/ (accessed June 21, 2024).
Sato, T. (1996). Type I and type II error in multiple comparisons. J. Psychol. 130, 293–302. doi: 10.1080/00223980.1996.9915010
Siegel, J. M., Shoaf, K. I., Afifi, A. A., and Bourque, L. B. (2003). Surviving two disasters: does reaction to the first predict response to the second? Environ. Behav. 35, 637–654. doi: 10.1177/0013916503254754
Solberg, C., Rossetto, T., and Joffe, H. (2010). The social psychology of seismic hazard adjustment: re-evaluating the international literature. Nat. Hazards Earth Syst. Sci. 10, 1663–1677. doi: 10.5194/nhess-10-1663-2010
Spittal, M. J., Walkey, F. H., McClure, J., Siegert, R. J., and Ballantyne, K. E. (2006). The earthquake readiness scale: the development of a valid and reliable unifactorial measure. Nat. Hazards 39, 15–29. doi: 10.1007/s11069-005-2369-9
StatsNZ (2022). One in five say their household is prepared for a natural disaster. Available online at: https://www.stats.govt.nz/news/one-in-five-say-their-household-is-prepared-for-a-natural-disaster (accessed March 19, 2024).
Stevenson, J. R., Becker, J. S., Cradock-Henry, N., Johal, S., Johnston, D. M., Orchiston, C., et al. (2017). Economic and social reconnaissance: kaikoura earthquake 2016. Bull. N. Z. Soc. Earthq, 50, 343–351. doi: 10.5459/bnzsee.50.2.343-351
Toka Tū Ake EQC (2022). Be prepared: how safe will your home be in a disaster? Available online at: https://www.eqc.govt.nz/be-prepared/ (accessed June 21, 2024).
Vallance, S. (2015). Disaster recovery as participation: lessons from the Shaky Isles. Nat Hazards 75, 1287–1301. doi: 10.1007/s11069-014-1361-7
Vinnell, L. J. (2024). Canterbury Earthquake Preparedness. Open Science Framework (OSF). doi: 10.17605/OSF.IO/4T9U6
Vinnell, L. J., Milfont, T. L., and McClure, J. (2019). The impact of the Kaikoura earthquake on risk-related behaviour, perceptions, and social norm messages. Austalas. J. Disaster Trauma Stud. 23, 53–64.
Vinnell, L. J., Milfont, T. L., and McClure, J. (2021). Why do people prepare for natural hazards? Developing and testing a theory of planned behaviour approach. Curr. Res. Ecol. Soc. Psychol. 2:100011. doi: 10.1016/j.cresp.2021.100011
Walsh, L., Hay, J., Bent, D., Grant, L., King, J., Millar, P., and Watson, K. (2013). The UC QuakeBox Project: creation of a community-focused research archive. N. Z. Engl. J. 27, 20–32.
Wein, A., Potter, S., Johal, S., Doyle, E., and Becker, J. (2016). Communicating with the public during an earthquake sequence: improving communication of geoscience by coordinating roles. Seismolo. Res. Lett. 87, 112–118. doi: 10.1785/0220150113
Worley, M., Smith-Frigerio, S., and Houston, J. B. (2024). “Disaster fatigue, communication, and resilience: insights from natural hazards, human-caused disasters, and public health crises,” in Communicating Risk and Safety, eds. T. L. Sellno, and D. D. Sellnow (Berlin: Degruyter), 77–96. doi: 10.1515/9783110752427-005
Keywords: preparedness, readiness, earthquakes, Christchurch, Canterbury, New Zealand
Citation: Becker JS, Vinnell LJ, Doyle EEH, McBride SK, Paton D and Johnston DM (2024) A decade of shaking in the Garden City: the dynamics of preparedness, perceptions, and beliefs in Canterbury, New Zealand, and implications for earthquake information. Front. Commun. 9:1410333. doi: 10.3389/fcomm.2024.1410333
Received: 31 March 2024; Accepted: 18 July 2024;
Published: 11 November 2024.
Edited by:
Laure Fallou, European-Mediterranean Seismological Centre, FranceReviewed by:
Maria Vittoria Gargiulo, University of Salerno, ItalyJustine Celestin, UMR5115 Les Afriques dans le Monde (LAM), France
Copyright © 2024 Becker, Vinnell, Doyle, McBride, Paton and Johnston. This is an open-access article distributed under the terms of the Creative Commons Attribution License (CC BY). The use, distribution or reproduction in other forums is permitted, provided the original author(s) and the copyright owner(s) are credited and that the original publication in this journal is cited, in accordance with accepted academic practice. No use, distribution or reproduction is permitted which does not comply with these terms.
*Correspondence: Julia S. Becker, ai5iZWNrZXJAbWFzc2V5LmFjLm56
 Julia S. Becker
 Lauren J. Vinnell
 Emma E. H. Doyle
 Sara K. McBride
 Douglas Paton3
 David M. Johnston