 Fabienne Crettaz von Roten
95% of researchers rate our articles as excellent or good
Learn more about the work of our research integrity team to safeguard the quality of each article we publish.
Find out more
BRIEF RESEARCH REPORT article
Front. Commun. , 21 May 2024
Sec. Science and Environmental Communication
Volume 9 - 2024 | https://doi.org/10.3389/fcomm.2024.1382952
In Switzerland, the need to engage the public in science is rooted in the political system with its tools of initiatives, therefore the broadening of the audience is critically important. Using the 2021 Science and Technology Eurobarometer, we propose solutions by using machine-learning techniques which identified patterns of engagement and the interaction of sociodemographic characteristics that constitute the prediction (1) of lowest level of science engagement and (2) of non-visitors to the science and technology museum. The techniques allow a more precise targeting than traditional segmenttion analyses.
Development of science communication culture operates in global and national contexts. In Switzerland, a triggering factor is the direct democracy, which allows the citizen to launch a campaign to collect for signatures for a so-called initiative on any subject. In the 1990s, Swiss citizen have voted on a series of initiative related to science, among which the 1998 Gene Protection initiative. Indeed, the country’s role in biomedical research was preeminent in the late 1990s, but enough signatures were collected among the citizens to vote in 1998 on an initiative that would end this research.1 The debate was very intense and had an uncertain outcome until scientists and physicians entered the debate (Schatz, 1998; Crettaz von Roten and Moschler, 2010). Ultimately, 67% of Swiss voters rejected the initiative. Afterwards, various actions were undertaken, among which was the creation of the Science and Society Foundation to foster science communication culture – the Swiss Science Festival, as well as science cafés, Camp Discovery for children, the Annual Congress of Science Communication.2 These actions are very important as many science-related initiatives were subsequently launched in the country (i.e., to ban nuclear energy, to ban animal experimentation).
During the COVID-19 pandemic, scientific information took center stage, and the context underlined the importance of effective science communication (Wirz et al., 2022). Following the literature on crisis communication [i.e., Coombs and Holladay (2010) and Duhé (2010)], authorities had to send messages that allowed citizens to understand the complex information related to the pandemic, identify misinformation, and increase the adoption of adequate behaviors. To achieve this objective, authorities needed to rely on a solid communication strategy. The Swiss Science Council analysis of the pandemic determined the impact of conspiracy theories and that a lack of understanding of the scientific method and the correct use of critical thinking were the breeding ground for conspiracy theories; one of its recommendations was to encourage public engagement with science and to listen to the public (Swiss Science Council, 2022).
The foundation is therefore at the forefront to implement this recommendation. In 2023, the main theme of its annual congress was “science communications’ accessibility and fun factor,” which entailed how to make scientific topics fun and easily accessible to a broader public, particularly newer demographics. Implicitly, the foundation defined young people as a strategic target due to its low engagement.
Science communication proposes various models to conceptualize the interaction between science and society, namely the deficit model, dialogical and participatory models (Gregory and Miller, 1998; Callon, 1999; Wynne, 2006; Bucchi, 2008) and various activities related to engage the public with science (Gregory and Miller, 1998). Many scholars have examined the term “public,” underlining the heterogeneity of publics and the practical implications of this heterogeneity (Einsield, 2000), the preferred activities of engaged publics and characteristics of non-engaged publics, which was often the strategic target of science communicators (Crettaz von Roten, 2011).
Prior research on science communication have made significant use of segmentation analyses – creating typologies of science publics – based on attitudes toward science, science literacy or engagement practices (Mejlgaard and Stares, 2012; Füchslin, 2018; Schaefer et al., 2018; Losi, 2023). These studies are “less theoretically driven” (Füchslin, 2018: 855) than with practical aims: for example, scholars interpret these segments and investigate the sociodemographic characteristics of these segments to improve science communication efforts. This approach regularly highlights the fact that one group or another is less engaged with science (in terms of education or gender, for example), without documenting the complex patterns of interactions between the variables defining these groups. In other words, are all people with the lowest education level less engaged? Or are some people with the lowest education level and certain characteristics highly engaged? And conversely, are some people with the highest level of education and certain characteristics less engaged? So the question is: can we improve the approach to better understand the audiences and therefore to help broadening the audiences for science engagement?
This article will use new statistical analyses - i.e. machine learning techniques - that have been used in particular in marketing to segment customers (James, et al., 2017). Machine learning techniques are able to learn which patterns of individuals are frequent in the data. In one step, the technique defines the segments and characterized them by nonlinear relationship as well as interaction between sociodemographic characteristics (i.e., hierarchical associations among a series of explanatory variables). They offer new, easy to interpret tools to reflect on the way people participate in science engagement activities. This article will present the results of these new techniques on Swiss data of the last Eurobarometer Science and Technology 2021.
Switzerland has participated in Eurobarometer Science and Technology (S&T) since 2001. The last Eurobarometer on this issue was conducted from April 15 to May 10 2021 and collected responses from 1,083 people living in Switzerland. Methodological details are available at https://europa.eu/eurobarometer/surveys/detail/2237.
The survey asked questions about interest in and information about S&T, knowledge about S&T, attitudes toward science and scientists, governance of S&T, and public engagement with S&T.
Among the demographics, the level of education is measured as the age at which the respondent finished full-time education, then recoded as one of five levels – no full-time education, up to 15 years old, 16–19, more than 20 years old, still studying. The type of habitat encompassed three modalities: rural area, small/middle town, and large town. Switzerland is divided into three linguistic regions (French, German and Italian are spoken respectively), but the German-speaking part comprises five regions; therefore Switzerland has seven regions: 1 = French-speaking part, five regions in the German-speaking part (2 = Mittelland space, 3 = northwest CH, 4 = region of Zurich, 5 = east CH, 6 = center CH), and 7 = Italian-speaking part.
The level of scientific knowledge is determined from a series of 11 science-related questions (for example, Antibiotics kill viruses, as well as bacteria?), and then the number of correct answers is recoded as 0 to 4, 5 to 8, or 9 to 11. The trust in science is measured by asking “Do you think that the overall influence of science and technology on society is?”; the possible answers were very positive, fairly positive, fairly negative, and very negative. The last two categories were combined due to small frequencies in the Swiss data.
In this article we will perform two supervised learning techniques: first on the 12 items of engagement with science, then on the item focusing on science and technology museum.
To analyze science engagement activities, we had first to examine the dimensionality among the 12 items of engagement (for instance visit science and technology museum or attend public meeting or debate about S&T, four possible responses yes regularly, yes occasionnaly, hardly ever, no never). An exploratory factor analysis with extraction principal axis and Kaiser method for the optimal number of factors (eigenvalues higher than 1) indicated one factor (i.e., unidimensionality) among the answers on the 12 items of engagement with science. Therefore, we built an index of level of engagement ranging from 0 (answered never to each of the 12 activities) to 100 (answered yes, regularly to each of the 12 activities). Then we conducted a regression tree model to explain the differences in level of engagement in terms of gender, age group, education level, habitat type, country region, level of scientific knowledge, and trust in science.
The regression tree is a supervised machine-learning algorithm that allows for prediction of a quantitative variable based on quantitative and qualitative independent variables going beyond linearity and without imposing a complicated parametric structure (James et al., 2017). We split the overall sample into a training sample (60% of the sample randomly chosen) and a validation sample (40%). The analysis was performed in R with the rpart package, which is an open-source implementation of the trademarked algorithm CART. The rpart algorithm perform successive binary partitions of the dataset based on the independent variables: at each step, it keeps the partition that minimize the residual sum of squares. We choose to continue this process until the minimum number of observations in a node to be splitted is 20. The importance measure is the sum of the improvement measures that each independent variable contributes as either a surrogate or primary splitter in the decision tree. The greater a variable’s importance, the more it helps improve the model.
To understand the non-visitors of S&T museums, we built a decision tree model to characterize visitors/non-visitors of S&T museum in terms of gender, age group, level of education, habitat type, country region, level of scientific knowledge, and trust in science. A decision tree is a supervised machine-learning algorithm that allows for the prediction of a qualitative variable based on quantitative and qualitative independent variables (James et al., 2017). We split the overall sample into a training sample (60% of the sample randomly chosen) and a validation sample (40%). The analysis was performed in R with the rpart package. The rpart algorithm considers at each stage each predictor variable and choose the predictor that optimize the discrimination among the classes based on a classification parameter. Precisely, rpart decide on the best feature at each split based on the difference in entropy (parameter split = information) or based on the difference in Gini index (parameter split = Gini), in general both find very similar results. To carry out this analysis, a number of parameters must be selected: we choose the Gini parameter which is faster, prior probabilities proportional to the observed data frequencies, the minimum number of observations in a node to 20, the minimum number of observations in a terminal node to 20.
In 2021, 42% of Swiss people were very interested in new medical discoveries and 49% in new scientific discoveries and technological developments, but only 16% felt very informed on both issues. A common explanation of this gap refers to a deficit of trust in science; for example, Bauer (2023: 124) pointed out that “(W)hatever the substance and prevalence of such feelings (of deficit of trust) might be, ‘antiscience’ mobilizes institutional attention and resources and keeps science communicators on their toes.” Is it a question of trust?
The Eurobarometer 2021 indicated that 92% of Swiss people believed S&T had a positive overall influence on society – a very high level of trust in science – in line with the increase of trust in science between 2019 and 2020 that another Swiss survey indicated [from 88 to 90% of moderate or high trust, Wissenchaftbarometer, (2022)]. In the later survey, trust in scientists working in universities was similar to trust in science [respectively 94 and 95%, Wissenchaftbarometer, (2022)]. Therefore, one should not focus on the question of trust because on the whole, there is not a crisis of trust in science in the country. Another approach is to examine the attractiveness of the science engagement activities in Switzerland.
Among the 12 engagement activities proposed to respondents in the Eurobarometer, the most popular was watching documentaries or reading S&T-related publications (36% have done it regularly, Table 1), followed by talking about S&T with family or friends (32%) but less popular were visiting S&T museums (5%), and attending public meetings or debates about S&T (3%). These results indicate the proposed activities vary significantly in popularity.
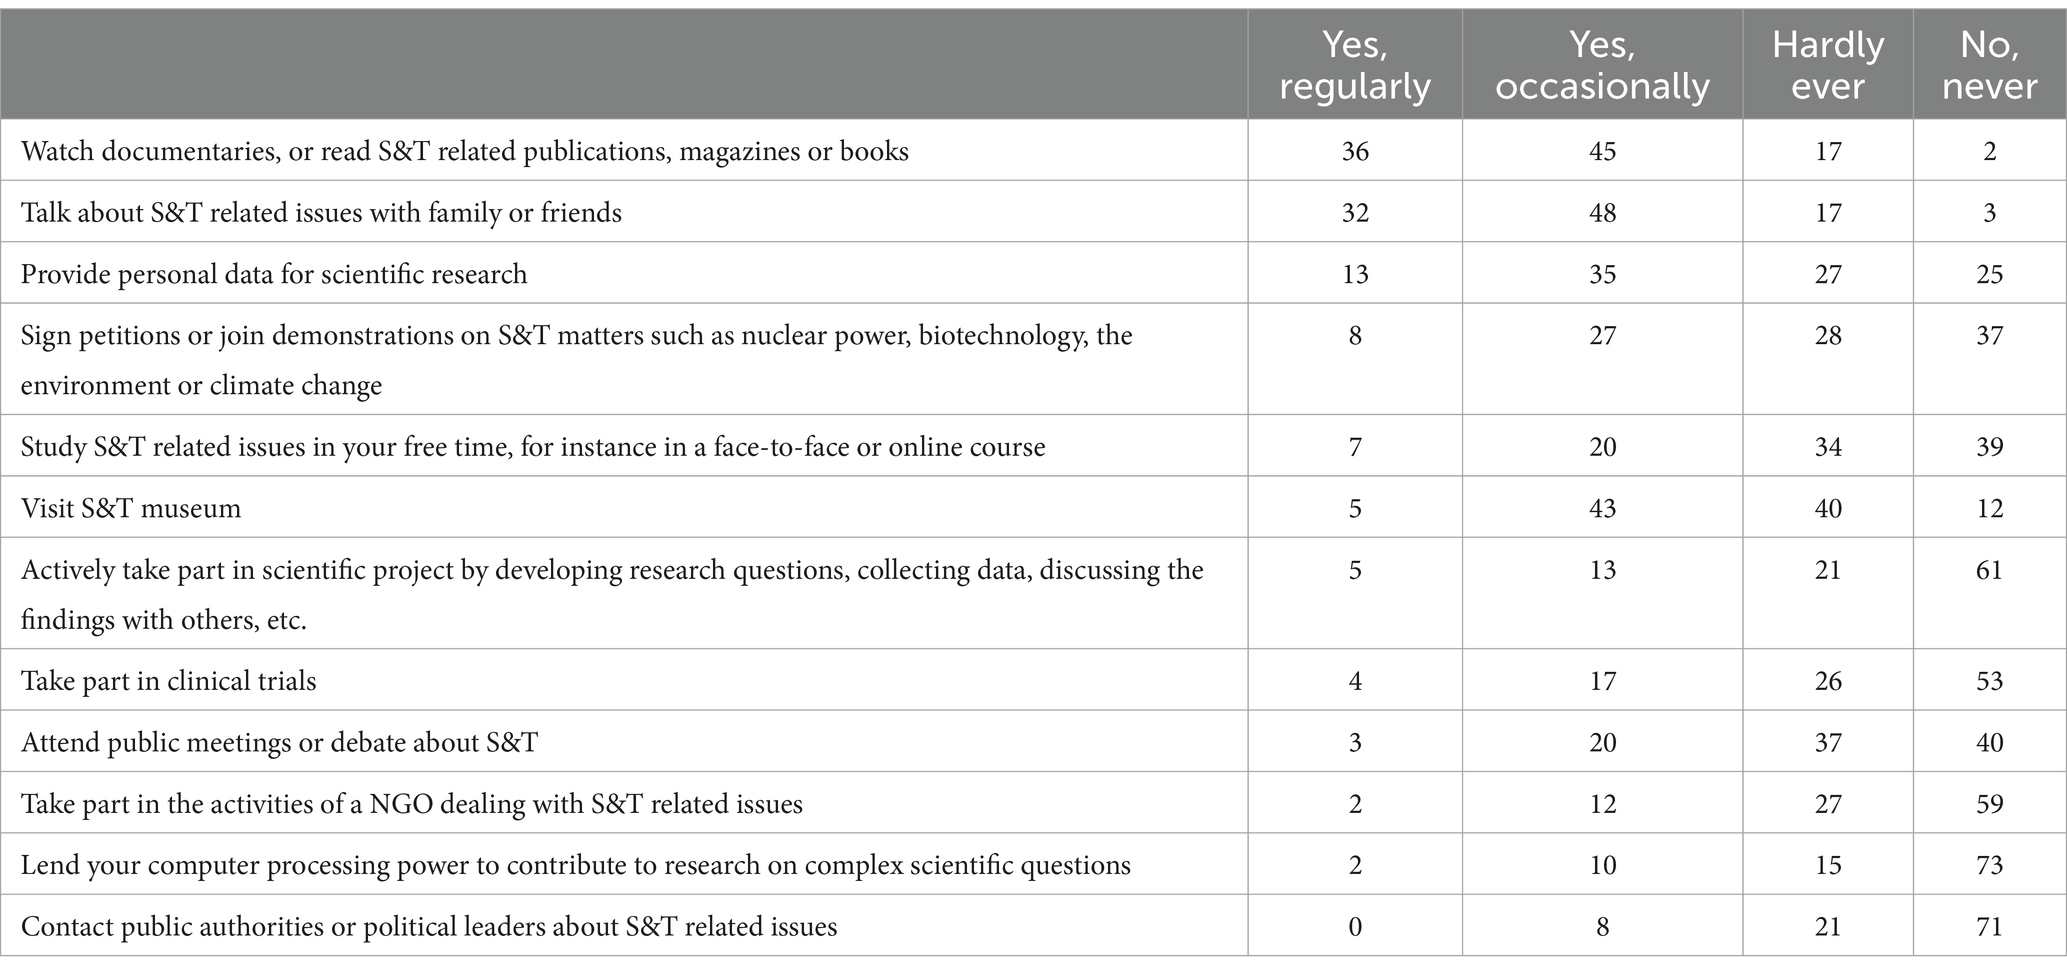
Table 1. Frequency of engagement in 12 activities (by order of percentage of “Yes, regularly” responses).
What are the possible reasons people do not engage with S&T? From a list of potential barriers, a majority of respondents selected lack of time (52%) and lack of knowledge about S&T (52%) followed by lack of information about S&T-related activities (33%), lack of interest (32%) and feeling not welcomed or unappropriate (20%).
Since there is unidimensionality among the items of engagement, the global picture can be summarized by the index of level of engagement with science which has a mean of 34, a standard deviation of 15.3, a minimum of 0, and a maximum of 88.9, meaning a heterogeneity in level of engagement and therefore that many mediation activities reached a very small audience. What explains this heterogeneity? The results of a regression tree on the level of engagement indicate eight terminal nodes with predicted level of engagement varying between 18 and 49 (Figure 1): two very low levels of engagement, four intermediary and two very high levels of engagement. More, education level is the most important factor in determining the respondents’ level of engagement (importance = 41), followed by level of scientific knowledge (30), trust in science (11), age group (7), habitat type (6), and gender (6).
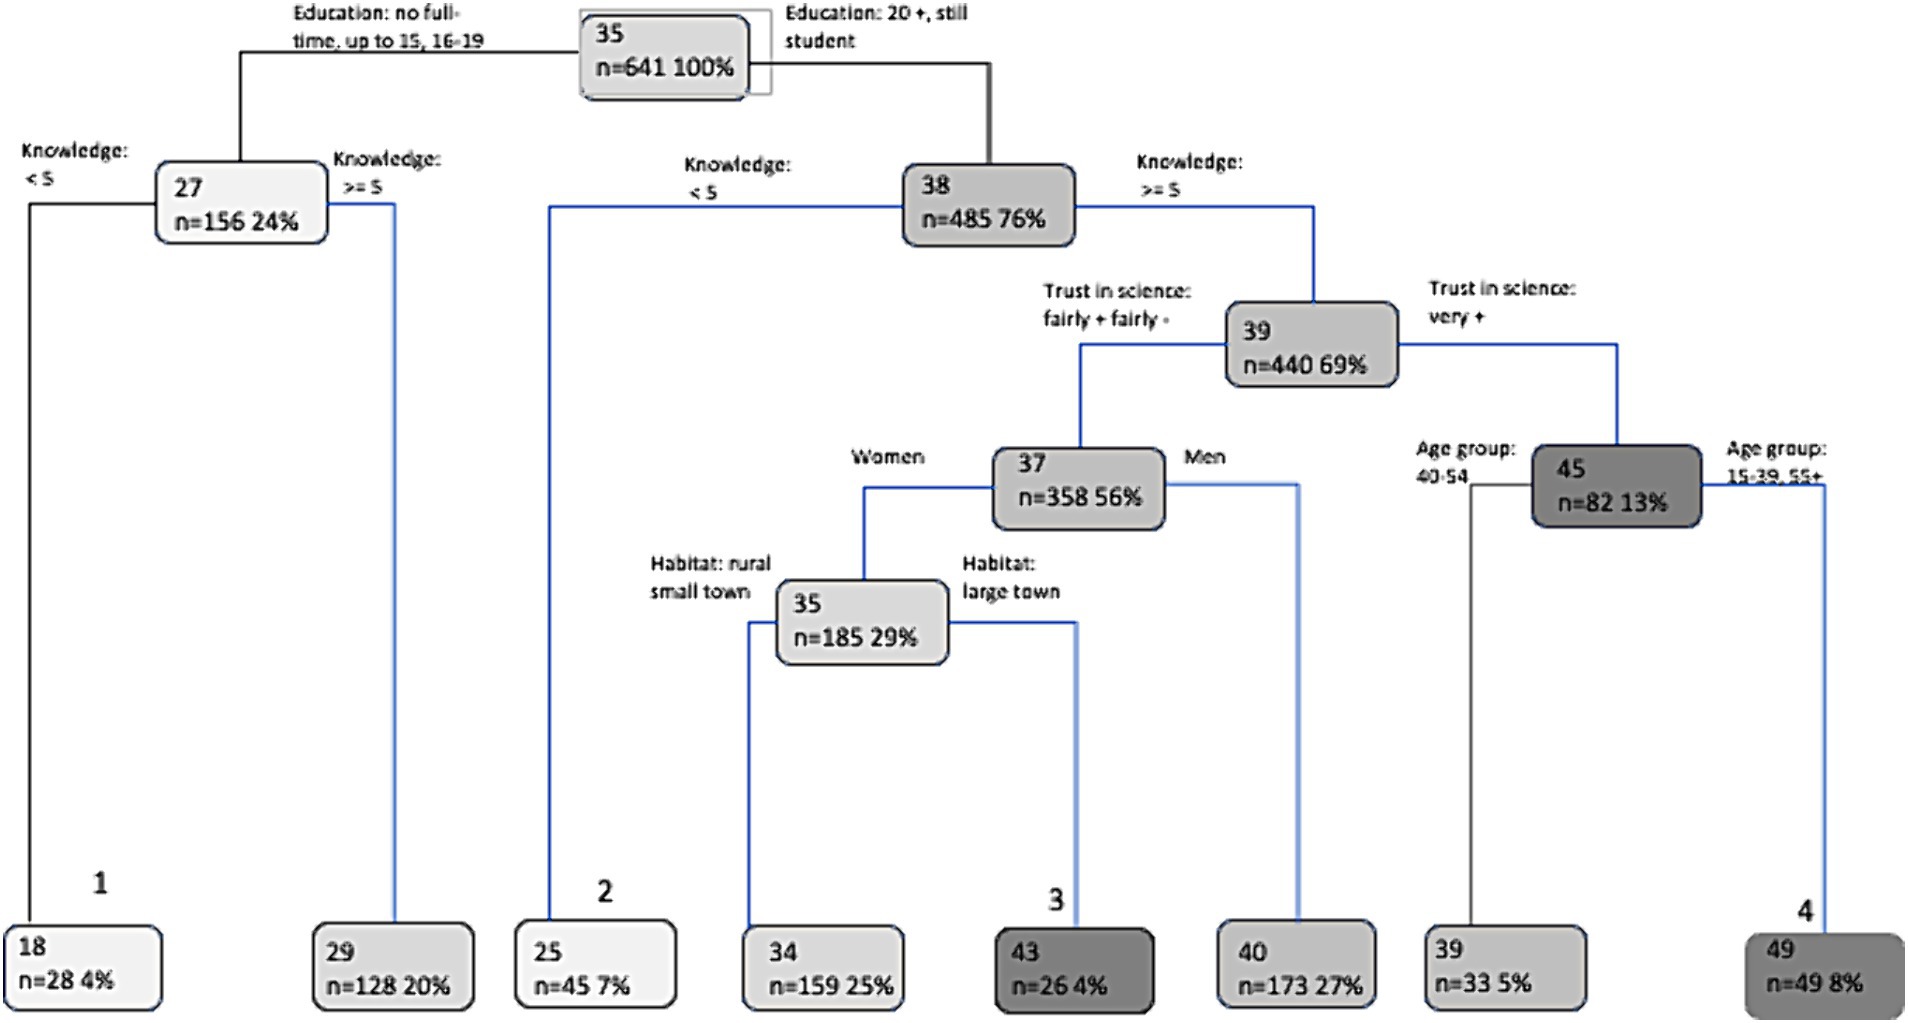
Figure 1. Regression tree results to explain the level of engagement. Each node indicates the predicted level of engagement as well as the number and percentage of subjects.
The lowest predicted levels of engagement are defined by those who have the lowest scores on scientific knowledge (less than 5 correct answers). In addition to this cognitive characteristic, we observed that respondents are those (1) with the lowest education level (the predicted level of engagement is 18) or (2) with the highest education level or still students (the predicted level of engagement is 25). These two nodes are the subgroups of the sample (12%) that the offer of science engagement in the country satisfy the least.
On the other side, the highest predicted levels of engagement are defined for those who are (4) highly educated or still students with a higher level of scientific knowledge, a high level of trust in science, and at both ends of the age spectrum – 15-24 and 55–98 years old – (the predicted level of engagement is 49) as well as those who are (3) more educated or still students with a higher level of scientific knowledge, a lower level of trust in science, female, and living in a large town (the predicted level of engagement is 43). These two nodes are the subgroups (12%) that draw heavily on the offer of science engagement.
We evaluated this model on the validation sample and found a square root of the mean square error of 16, indicating that this model leads to test predictions that are within around 16 points of the true score for the level of engagement.
A similar analysis can be performed separately for each activity of engagement. Historically, S&T museums have played an important role in scientific mediation (Gregory and Miller, 1998; Schiele, 2008). There are more than 1,100 museums in Switzerland, of which about a third focus on scientific topics, such as the Swiss Science Center Technorama in Winterthur, with 306,730 visitors in 2022. Therefore, we will examine this activity. In 2021, approximately half of the respondents indicated they visited S&T museums regularly or occasionally (Table 1). But who are the non-visitors (i.e., the 127 respondents (12%) who never visit S&T museums)?
The results of the decision tree model to characterize visitors/non-visitors of S&T museum indicate nine terminal nodes: five are nodes of non-visitors of S&T museums and four of visitors (Figure 2). More, the level of scientific knowledge is the most important factor to characterize these nodes (importance = 32), followed by region of Switzerland (18), level of education (16), habitat type (10), age group (10), gender (8), and trust in science (6).

Figure 2. Decision tree results to explain visitors/non-visitors of S&T museums. The Swiss regions are 1 = French-speaking part, the five regions in the German-speaking part (2 = Mittelland space, 3 = northwest CH, 4 = region of Zurich, 5 = east CH and 6 = center CH), and 7 = Italian-speaking part.
The non-visitor nodes correspond always to a lower level of scientific knowledge (i.e., less than 8 correct answers). Among the non-visitors, three nodes are the outcome of higher educated people or those who are still students and two nodes of less-educated people.
In addition to the education characteristic of the first three nodes, we observed that non-visitors are (1) males 40 to 54 years old, (2) females from the French-speaking region or Zurich and living in rural areas, and (3) females not living in the French-speaking region or Zurich.
In addition to the education characteristic of the two subsequent nodes, we observed that non-visitors lived in (5) the French-speaking area, Mitteland, Zurich, or the Italian-speaking area but not in a small/middle town and (4) the center, northwest, or east Switzerland.
We evaluated this model on the validation sample and found an accuracy of predictions of 76%, which indicates satisfactory predictions.
On the S&T Eurobarometer 2010, Mejlgaard and Stares (2012) classified countries based on a subset of engagement activities and Switzerland is in the group of countries with citizens only “attentive to engagement.” Comparing the 2010 and 2021 results regarding three engagement activities, we observed a decrease in the percentages of non-engaged: −25% for non-attending public meetings, −22% for non-signing petitions, and − 15% for not participating in the activities of a NGO. Comparing the 2005 and 2021 results’ on science museum, we observed a decrease in the percentage of non-visitors [−22%, Crettaz von Roten (2011)].
In this article, we aimed to provide new insights into who engaged or not with science by using new statistical methods. We will first discuss the results and then stress the specific contribution of these methods.
The tree analyses underline the importance of two variables: education level and level of scientific knowledge. Schaefer et al. (2018) found a similar effect of these two variables in their segmentation of the Swiss population. Losi (2023) pointed out these two effects on Europeans’ science engagement. This result should not alienate the non-audience or direct science communicators toward deficit model approach, which has its flaws pointed out in the literature (Einsield, 2000; Wynne, 2006; Irwin, 2009). How these cognitive aspects interact with the behavioral intentions at the individual level is complex. Many explanations can be formulated: a profound disinterest in science at the origin of these cognitive aspects leads to non-engagement with science, the proposed activities seem to necessitate a high education or knowledge level, finally low-educated people censor themselves because they do not feel educated enough to participate in these activities. Further analyses that link the nodes found by the tree analyses with potential barriers to engagement with science listed in the survey could discriminate between these explanations and improve our understanding of publics.
Trust in science is the third predictor variable that explains the level of engagement, but the relation with level of engagement is complex. Indeed, high trust in science among the youngest and oldest people yields the node with the highest predicted level of engagement whereas low trust in science among women living in large towns yields the node with the second-highest predicted level of engagement. Can we engender trust? Wynne (2006: 219) noted “the intrinsic futility of trying to engender public trust in science whether by public engagement, dialog or any others means,” more that scientific institution should acknowledge the fact that the only thing it “can expect to control, and to take responsibility for, is one’s own trustworthiness.”
Young people are one of the targets of science communication efforts, either for educational impetus or for inspiring young people to choose S&T fields of study (Swiss Academies of Arts and Sciences, 2021). Our analysis indicates that age is related with engagement, but some young people are more engaged with science than the Science and Society Foundation expected. Young people (15–24 years old) still students with more than 5 correct answers in science knowledge and with high trust in science have the highest level of engagement. Young male people still students are more likely in the visitor node of S&T museum. However, the broadening of audience should target either young women still students or young people having finished upper secondary education.
What are the specific contribution of these methods compared to traditional analyses that compare various segments of audience - built either through cluster analysis (i.e., k-means analysis) or latent class analysis [see, for example, Losi (2023)] - by sociodemographic characteristics? The later cannot reveal the complexity found in this article because they examine each characteristic separately, unlike the tree analyses presented here that are able to discern hierarchical associations among a series of explanatory variables. As an illustration of the problems with separate analyses, one can mention the fact that age group is not related to S&T museum visits (non-significant, see Table 2), but the variable is important in the decision tree analysis. More, if education level is related to S&T museum visits (fewer visitors among those with a secondary level of education), this analysis misses the fact that some highly educated combined with other demographics characteristics are in fact non-visitors of S&T museum. Similarly, age group or habitat are not related to global segments of audience, but theses variables are important in the regression tree analysis and define important interactions (Table 2).
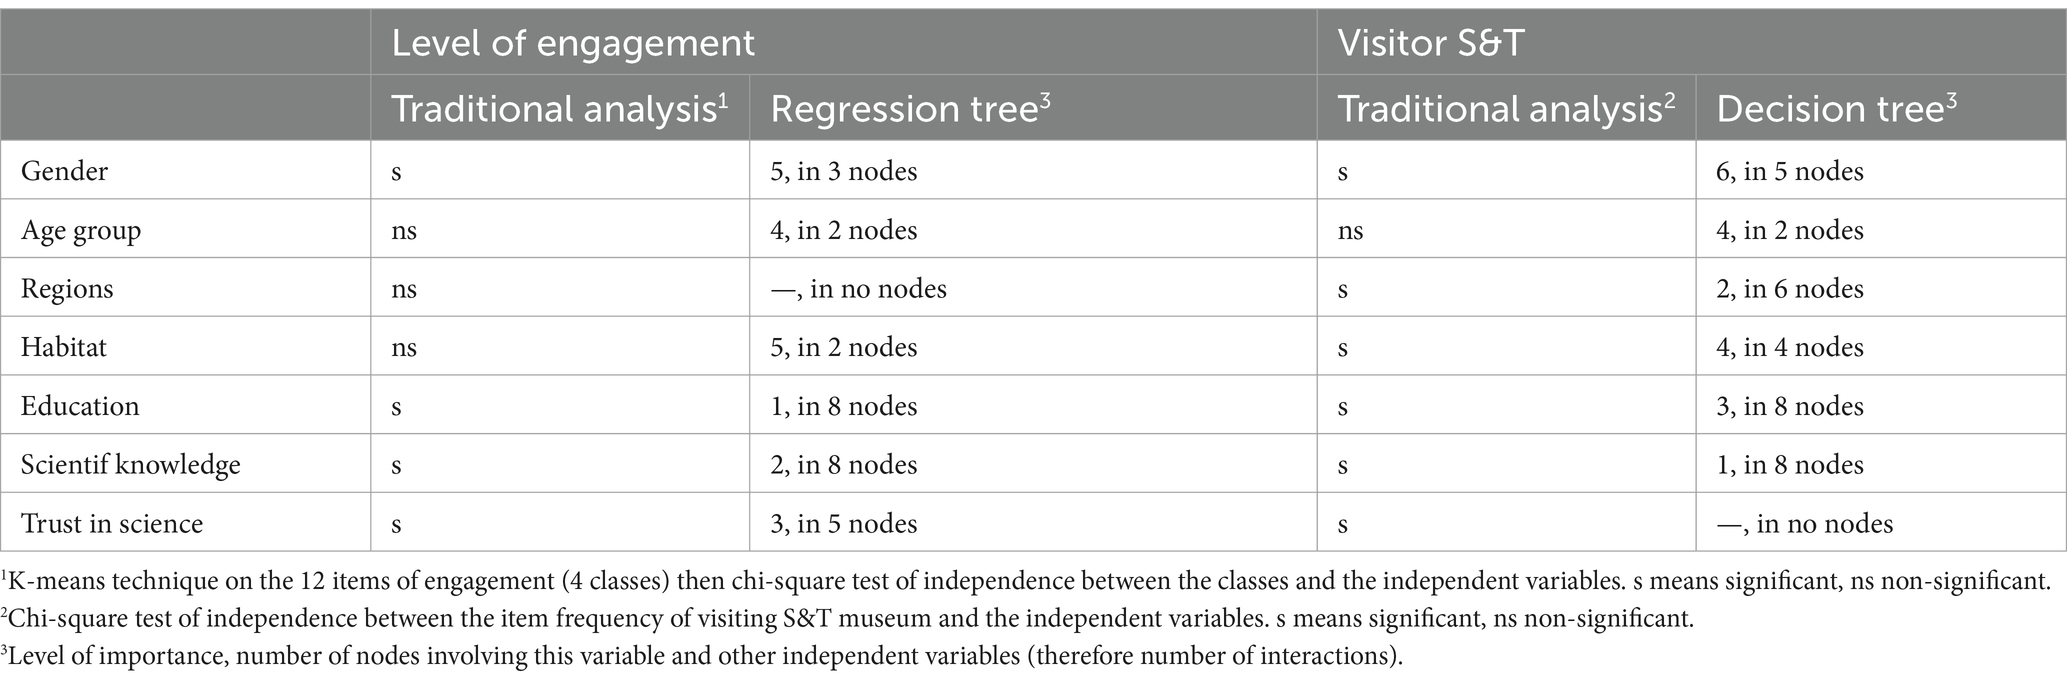
Table 2. Comparison between traditional and machine learning results.
Although machine-learning techniques have limitations (James et al., 2017), they offer new, easy to interpret tools to reflect on the way people participate in science engagement activities.
This study has some limitations. The analyses presented in this article rest on the choice of engagement activities included in the Eurobarometer. Among them, the recently included citizen-science activities do not show high frequencies, but it is not clear whether this finding reflects these activities’ actual frequency or a phrasing problem. Also, in the survey, the items refer to S&T in general, so the results cannot be directly generalized to specific scientific domains.
In conclusion, this study examined if machine learning techniques may improve knowledge on the public non-engaged with science. Indeed, these techniques discern interactions among the explanatory variables and exploring these interactions allows to build more precise targets for S&T museum or in general science engagement activities engagement activities. These analyses can be repeated separately for each of the 12 engagement activities and, more generally, for comparison of science engagement in each of the 38 countries participating in the Eurobarometer. This is easily done because these surveys are part of open data practices.
Publicly available datasets were analyzed in this study. This data can be found at: www.gesis.org/en/eurobarometer-data-service.
The studies involving humans were approved by the European Commission, European Parliament, Directorate General for Communication. The studies were conducted in accordance with the local legislation and institutional requirements. The ethics committee/institutional review board waived the requirement of written informed consent for participation from the participants or the participants’ legal guardians/next of kin because Computer assisted Telephone Interviewing (CATI).
FC: Conceptualization, Data curation, Formal analysis, Methodology, Validation, Visualization, Writing – original draft, Writing – review & editing.
The author(s) declare that financial support was received for the research, authorship, and/or publication of this article. Open access funding for this article was provided by University of Lausanne.
The author declares that the research was conducted in the absence of any commercial or financial relationships that could be construed as a potential conflict of interest.
All claims expressed in this article are solely those of the authors and do not necessarily represent those of their affiliated organizations, or those of the publisher, the editors and the reviewers. Any product that may be evaluated in this article, or claim that may be made by its manufacturer, is not guaranteed or endorsed by the publisher.
1. ^“The Gene Protection Initiative demanded that the government outlaw (i) the generation, purchase, or distribution of transgenic animals; (ii) the release of genetically altered organisms into the environment; and (iii) the patenting of transgenic animals and plants, of their components, and of the relevant processes” (Schatz, 1998: 1810).
Bauer, M. (2023). “Notes on attitudes to science-the emerging ‘longue durée’,” In Science communication: Taking a step back to move forward, eds M.W. Bauer, M., and B. Schiele, (Paris: CNRS Editions), 124–134.
Bucchi, M. (2008). “Of deficits, deviations and dialogues: theories of public communication of science” in Handbook of public communication of science and technology. eds. M. Bucchi and B. Trench (New York: Routledge), 57–76.
Callon, M. (1999). Des différentes formes de démocratie technique, Les Cahiers de la sécurité intérieure, 38, 35–52.
Crettaz von Roten, F. (2007). Sciences en société en Suisse: enjeux, impacts, limites. Jahresbericht 2007 des Akademien der Wissenschaften Schweiz, Akademien der Wissenschaften Schweiz.
Crettaz von Roten, F., and Moschler, O. (2010). Les relations entre les scientifiques et la société (Relations between scientists and society). Sociologie 1, 45–60. doi: 10.3917/socio.001.0045
Crettaz von Roten, F. (2011). In a search of a new public for scientific exhibitions or festivals: the lead of casual visitors. J. Sci. Commun. Akademien der Wissenschaften. 10:A02. doi: 10.22323/2.10010202
Duhé, S. F. (2010). “Crisis communication” in Encyclopedia of science and technology communication. ed. S. Priest (Los Angeles: Sage), 194–198.
Einsield, E. (2000). “Understanding ‘publics’ in the public understanding of science,” In Between understanding and trust: The public, science and technology, M. Dierkes and C. Grote von (Amsterdam, Harwood Academic Publishers), 205–215.
Füchslin, T. (2018). Science communication scholars use more and more segmentation analysis: can we take them to the next level? Public Underst. Sci. 28, 854–864. doi: 10.1177/0963662519850086
Gregory, J., and Miller, S. (1998). Science in public: Communication culture, and credibility. Cambridge: Basic Books.
Irwin, A. (2009). “Moving forwards or in circles? Science communication and scientific governance in an age of innovation” in Investigating science communication in the information age: Implications for public engagement and popular media. eds. R. Holliman, E. Whitelegg, E. Scanlon, S. Smidt, and J. Thomas (Oxford: Oxford University Press), 3–17.
James, G., Witten, D., Hastie, T., and Tibshirani, R. (2017). Introduction to statistical learning with applications in R. New York: Springer.
Losi, L. (2023). Who engages with science, and how? An empirical typology of Europeans’ science engagement. Pub. Understand. of Sci. 32, 798–814. doi: 10.1177/09636625231164340
Mejlgaard, N., and Stares, S. (2012). Performed and preferred participation in science and technology across Europe: exploring an alternative idea of “democratic deficit”. Public Underst. Sci. 22, 660–673. doi: 10.1177/0963662512446560
Schaefer, M., Füchslin, T., Metag, J., Kristiansen, S., and Rauchfleisch, A. (2018). The different audiences of science communication: a segmentation analysis of the Swiss population’s perceptions of science and their information and media use patterns. Public Underst. Sci. 27, 836–856. doi: 10.1177/0963662517752886
Schatz, G. (1998). The Swiss vote on gene technology. Science 281, 1810–1811. doi: 10.1126/science.281.5384.1810
Schiele, B. (2008). “Science museum and science centers” in Handbook of public communication of science and technology. eds. M. Bucchi and B. Trench (New York: Routledge), 27–39.
Swiss Academies of Arts and Sciences (2021). Science in the Swiss public. The state of science communication and public engagement with science in Switzerland. Swiss Acad. Rep. 16, 1–36. doi: 10.5281/zeno-do.4974312
Swiss Science Council (2022). L’acceptation des mesures de crise par la population. Available at https://wissenschaftsrat.ch/images/stories/pdf/fr/SWR_2022_Acceptation_f.pdf
Wirz, C., Cate, A., Brauer, M., Brossard, D., DiPreter Brown, L., Chen, K., et al. (2022). Science communication during COVID-19: when theory meets practice and best practices meet reality. J. Sci. Commun. 21:N01. doi: 10.22323/2.21030801
Wissenchaftbarometer (2022). WissenCHaftbarometer 2022. Available at: https://wissenschaftsbarometer.ch/en/science-barometer-switzerland
Keywords: public engagement with science and technology, non-public, machine learning, S&T museum, science communication
Citation: Crettaz von Roten F (2024) Broadening the audience for science engagement with machine-learning techniques. Front. Commun. 9:1382952. doi: 10.3389/fcomm.2024.1382952
Edited by:
Ataharul Chowdhury, University of Guelph, CanadaReviewed by:
Adriana Zait, Alexandru Ioan Cuza University, RomaniaCopyright © 2024 Crettaz von Roten. This is an open-access article distributed under the terms of the Creative Commons Attribution License (CC BY). The use, distribution or reproduction in other forums is permitted, provided the original author(s) and the copyright owner(s) are credited and that the original publication in this journal is cited, in accordance with accepted academic practice. No use, distribution or reproduction is permitted which does not comply with these terms.
*Correspondence: Fabienne Crettaz von Roten, ZmFiaWVubmUuY3JldHRhenZvbnJvdGVuQHVuaWwuY2g=
Disclaimer: All claims expressed in this article are solely those of the authors and do not necessarily represent those of their affiliated organizations, or those of the publisher, the editors and the reviewers. Any product that may be evaluated in this article or claim that may be made by its manufacturer is not guaranteed or endorsed by the publisher.
Research integrity at Frontiers
Learn more about the work of our research integrity team to safeguard the quality of each article we publish.