 Oliver Niebuhr
 Ingo Siegert
- 1Centre for Industrial Electronics, University of Southern Denmark, Sonderborg, Denmark
- 2Mobile Dialog Systems, Institute for Information Technology and Communication, Otto von Guericke University Magdeburg, Magdeburg, Germany
Introduction: Calls via video apps, mobile phones and similar digital channels are a rapidly growing form of speech communication. Such calls are not only— and perhaps less and less— about exchanging content, but about creating, maintaining, and expanding social and business networks. In the phonetic code of speech, these social and emotional signals are considerably shaped by (or encoded in) prosody. However, according to previous studies, it is precisely this prosody that is significantly distorted by modern compression codecs. As a result, the identification of emotions becomes blurred and can even be lost to the extent that opposing emotions like joy and anger or disgust and sadness are no longer differentiated on the recipients' side. The present study searches for the acoustic origins of these perceptual findings.
Method: A set of 108 sentences from the Berlin Database of Emotional Speech served as speech material in our study. The sentences were realized by professional actors (2m, 2f) with seven different emotions (neutral, fear, disgust, joy, boredom, anger, sadness) and acoustically analyzed in the original uncompressed (WAV) version and as well as in strongly compressed versions based on the four popular codecs AMR-WB, MP3, OPUS, and SPEEX. The analysis included 6 tonal (i.e. f0-related) and 7 non-tonal prosodic parameters (e.g., formants as well as acoustic-energy and spectral-slope estimates).
Results: Results show significant, codec-specific distortion effects on all 13 prosodic parameter measurements compared to the WAV reference condition. Means values of automatic measurement can, across sentences, deviate by up to 20% from the values of the WAV reference condition. Moreover, the effects go in opposite directions for tonal and non-tonal parameters. While tonal parameters are distorted by speech compression such that the acoustic differences between emotions are increased, compressing non-tonal parameters make the acoustic-prosodic profiles of emotions more similar to each other, particularly under MP3 and SPEEX compression.
Discussion: The term “flat affect” comes from the medical field and describes a person's inability to express or display emotions. So, does strong compression of emotional speech create a “digital flat affect”? The answer to this question is a conditional “yes”. We provided clear evidence for a “digital flat affect”. However, it seems less strongly pronounced in the present acoustic measurements than in previous perception data, and it manifests itself more strongly in non-tonal than in tonal parameters. We discuss the practical implications of our findings for the everyday use of digital communication devices and critically reflect on the generalizability of our findings, also with respect to their origins in the codecs' inner mechanics.
1. Introduction
1.1. What is flat affect?
The term “flat affect” comes from the medical field and describes a person's inability to express or display emotions in the same way as other people do, especially with regard to the intensity of the individual emotions, but also in terms of their differentiation. It already manifests itself at the level of the cognitive processes underlying emotional expressions. In principle, this makes the “flat affect” a condition in its own right, but in practice it often co-occurs with other conditions, such as autism or schizophrenia (Evensen et al., 2012).
A flat-affect condition concerns both verbal and nonverbal aspects of emotional communication. However, prosody is particularly impaired. For example, Gottheil et al. (1970) conducted an experiment in which participants rated either audio stimuli or only their transcribed texts from a flat-affect patient group and a control group. In the audio condition, both groups could be clearly differentiated by participants (with the control group stimulating significantly higher ratings of emotional intensity). By contrast, in the transcribed-text condition, i.e., without the phonetics and, in particular, the speech prosody, the participants were no longer able to differentiate between the two groups. In accord with that, Alpert et al. (2000) concluded from their study that it is not so much the use of emotional words (both positive and negative) that distinguishes flat-affect patients from a control group, but the (in)ability to express emotions nonverbally. Flat-affect patients, for example, cannot in the same way as a healthy control group convey emotions and their intensity levels by means of Fundamental Frequency (f0) inflection. In an earlier study, Alpert and Anderson (1977) have shown already that flat-affect patients also suffer from a reduced level and variability of voice intensity in their emotional statements.
The aim of the present study is to examine by means of a prosodic analysis whether popular speech compression codecs also make those acoustic patterns disappear partially or completely that allow listeners to perceive the emotional intensity of utterances (e.g., such that they become to some degree acoustically indistinguishable from neutral matter-of-fact utterances) and/or the emotional categories of utterances (e.g., such that the acoustic profiles of different emotions merge to some degree). We call this a “digital flat affect”; digital because the flat affect does not come from the speaker him/herself, but is caused by the codec as an artifact in the digital communication channel. The background to this question is explained below.
1.2. What is charisma?
Phonetic research on speaker impact or perceived speaker charisma began with the seminal papers of Touati (1993), Strangert and Gustafson (2008), and Rosenberg and Hirschberg (2009). The latter have defined charisma as “the ability to attract and retain followers without the benefit of formal authority” (p.640). We do not dispute the truth in this definition, but we agree with Antonakis et al. (2016) that charisma should not be defined in terms of its outcome, i.e., its effects. Such definitions easily become circular. They also ignore a key insight of charisma research over the past few decades, namely that charisma is not something a person has, but something a person does. It is a learnable signaling system, see also Antonakis et al. (2011) on teaching charisma. Antonakis et al. (2016) therefore, define charisma as “values-based, emotion-laden leader signaling” (p. 304).
We follow this definition. It focuses on our research subject: signals; and it leaves room for the same signals to be rated sometimes more and sometimes less charismatic (e.g., by different listeners or in different contexts) because it does not define charisma from an effects' perspective. The addition of “values-based” in the definition of Antonakis et al. expresses that, for charisma to unfold its intended effects, the same (e.g., moral) values must be shared by speaker and audience or, in more general terms, by sender and recipient (cf. Kelman, 1961). In telemarketing contexts like those investigated by Chebat et al. (2007), for instance, such shared values are often established by the call-center agent, who starts the dialogue with a rhetorical question like “Don't we all want to save taxes?”. Finally, and this is the crucial point here, the definition of Antonakis et al. (2016) links charisma to the expression of emotions (see Section 1.4).
In addition to the obvious verbal strategies such as three-part lists and metaphors (cf. the “Charismatic Leadership Tactics” of Antonakis et al., 2011), the complex bundle of charismatic signals also includes facial expressions and gestures (Keating, 2011), speech prosody (Rosenberg and Hirschberg, 2009), choice of words (Tur et al., 2021), clothing (Furnham et al., 2013; Karabell, 2016) as well as gender, age, and height (Grabo et al., 2017; Jokisch et al., 2018; Maran et al., 2021). The present study deals with the phonetic aspects of charisma, more precisely with the effects of charismatic prosody. Section 1.3 provides a research overview on this area.
1.3. Previous research on prosodic charisma and speech compression
Siegert and Niebuhr (2021a) carried out a perception experiment in which listeners rated short stimulus utterances that were presented both as uncompressed originals and as variants heavily reduced by four popular speech-compression codecs: AMR-WB, MP3, OPUS, and SPEEX. The rating was performed against the background of perceived speaker charisma, i.e., by using 10 scales that are associated with charisma according to a meta-analysis of previous studies. The results of Siegert and Niebuhr showed that, compared to the uncompressed baseline, speech compression had a significantly negative impact on the speakers' ratings along the charisma traits— and that, moreover, this negative effect was significantly more pronounced for female speakers than for male speakers. More pronounced means that the negative effect involved more codecs (including OPUS, which even improved the charisma ratings of male speakers) as well as more rating scales, and it additionally lowered the female speakers' ratings more strongly on many scales. For example, under speech compression, women lost more of their perceived trustworthiness, persuasiveness, and likability than men.
Later, Siegert and Niebuhr (2021b) showed in a supplementary investigation of the compressed and original stimulus material of Siegert and Niebuhr (2021a) that an automatic prosodic analysis yields significantly different results for the compressed and original stimuli. These differences concerned f0, intensity, and exponents of voice quality, but not durational measures. Crucially, if the different automatic measurement results were interpreted in view of known correlations between prosody and perceived speaker charisma, then the codecs' acoustic differences matched well with the codecs' perceptual effects in Siegert and Niebuhr (2021a). In other words, the codec-induced reduction of perceived speaker charisma in Siegert and Niebuhr (2021a) is consistent with the codec-induced acoustic-prosodic measurement changes in Siegert and Niebuhr (2021b).
This finding has practical everyday implications beyond a mere scientific relevance, because acoustic charisma can influence the opinions and behavior of recipients and, thereby, a speaker's professional success. For example, Antonakis et al. (2016) report that the enhanced charisma signals of charismatically trained speakers can lead to 17% more output among workers and increase people's contributions to the common good by up to 19%. Fischer et al. (2019) showed further that such effects can be transferred to machines, solely based on enhancing their prosodic cues to charisma: If one transfers the tone-of-voice patterns of Steve Jobs, Apple's former exceptionally charismatic CEO, to a robot, leaving all other features of the speech synthesis constant, then this robot becomes significantly more successful in making human interaction partners fill out longer questionnaires, eat healthier food, and take detours in traffic (Niebuhr and Michalsky, 2019); and when such a robot is used as a moderator in creativity workshops, then these workshops end with significantly more and better ideas, and give participants a more positive mindset in this idea-generation process (Fischer et al., 2022). Gregory and Gallagher (2002) were able to correlate all outcomes of the presidential elections in the USA between 1960 and 2000 with a single prosodic measure derived from f0 and the lower spectral harmonics of the candidates' voices. Niebuhr (2021) found correlations between a prosody-based charisma score and the oral exam grades of Danish university students. Pentland (2008) was able to predict with 87% accuracy only from nonverbal signals who would win a business-plan competition; a finding that stimulated the newspaper headline “no charisma—no funding” in a silicon-valley magazine. Similarly, but only by means of five tonal and five non-tonal prosodic parameters, Niehof and Niebuhr (2022) were recently able to determine 70–80% correctly which investor pitches win or lose in major German pitching contests.
So, the prosody of the sender (be it a human or a robot) is one of the key components in creating charismatic effects. Further supporting evidence for this statement comes from the field of speech technology. It has been repeatedly shown that machine-learning models benefit most from prosody (rather than from video or text information) when trying to replicate charisma-related human behavior; see the studies by Chen et al. (2014), Wörtwein et al. (2015), and Kimani et al. (2020) on modeling ratings of public-speaking performances, or the study by Amari et al. (2021) on modeling the success of persuasion strategies in consultant-client dialogues.
1.4. Charisma and the expression of emotions
It was House (1977) who, in the first psychological theory on charismatic leadership, made the expression of emotions a core element of charismatic impact. Also, according to Bass (1990), charismatic speakers are, amongst other things, “determined, self-confident, and emotionally expressive” (p.220), see Antonakis et al. (2016) for a historical summary. Emotions are important because they create the motivational basis for the transfer of goals, ideas, or instructions from the charismatic sender to his/her recipients via the emotional-contagion effect, see Bono and Ilies (2006). In the words of Sy et al. (2018), a charismatic impact relies heavily on “eliciting and channeling follower emotions” (p. 58).
In fact, there are many studies showing the positive influence of emotions on the perception of a person as charismatic—as well as the importance of displaying emotions for business success, see the overview in Humphrey et al. (2008). Kisfalvi and Pitcher (2003) provide case studies to demonstrate the connection between the emotional nature of a CEO and the economic success of his/her company and team. Similarly, significant correlations can be established between crowdfunding success on the one hand and the emotional intensity of the speech and non-speech content in the corresponding crowdfunding videos on the other (Kim et al., 2016; Liu et al., 2018); see also the related study of Zhao et al. (2022) who showed that it is the linguistic rather than the visual emotional content that determines the success of a campaign. Davis et al. (2017) also identified the emotional passion (of entrepreneurs) as a key factor for campaign success and, in this, particularly stressed the role of non-verbal features.
Passion as an element of perceived speaker charisma is often intuitively associated with positive emotions (Damen et al., 2008). There is, however, accumulating evidence that this intuitive idea is too simplistic. D'Errico and Poggi (2022) recently showed for a sample of Italian politicians that the expression of negative emotions can be interpreted as a sign of power and strength which, in challenging times, can create a charismatic effect as well (cf. also Gooty et al. 2010). D'Errico et al. (2019) already emphasized for a perception experiment with a set of well-known politicians that “activating emotions, joy and anger, increased the positive evaluation of the politician, whom participants perceived as more [...] charismatic” (p. 671). Zhao et al. (2022) pointed out in their research overview that funding (e.g., donation) campaigns can be successful based on negative emotions. Also, the results of Allison et al. (2022) suggest that it is primarily the high arousal of an emotion that makes speakers more charismatic, not the emotion's specific valence.
As with charisma, prosody plays an important role in expressing emotions. Different emotions have different prosodic patterns, see the detailed studies by Mozziconacci (2001), Gobl and Chasaide (2003), and Bänziger and Scherer (2005)— and the prosodic parameters within each pattern are unidirectionally related to the intensity of the emotion (e.g., Audibert et al. 2010 and see Rosenberg and Hirschberg 2009 for charisma). How central prosody is for the expression of emotions can be seen from two sets of robust findings. Firstly, based on prosodic factors alone, speech-recognition systems are able to identify the emotional category in a speech utterance with sometimes more than 90% accuracy (Luengo et al., 2005; Kao and Lee, 2006; Wang et al., 2008), see also the overview in Koolagudi and Rao (2012). Secondly, studies show that listeners are still able to reliably identify emotion categories in foreign-language stimuli, i.e., in the absence of any lexical cues (and visual cues), albeit worse than for their own native language and worse for the valence than for the arousal dimension of emotions, see Feraru et al. (2015) for a recent overview.
1.5. Connecting the threads: Toward the assumption of a digital flat affect
Prosodic patterns are an important source of perceived speaker charisma; and the compression of speech signals by codecs can weaken these prosodic patterns, both on the perceptual side and on the acoustic side—the latter in a way that matches with the former perceptual effects. The expression of charisma is closely related to the expression of emotions; and the perception of emotional categories and their intensity is also based in large part on prosodic patterns. It would therefore be reasonable to assume that emotional prosodic patterns are also negatively affected by codecs and that this results in what was referred to in 1.1 as a digital flat affect (note that studies on the connection between speech compression and emotion recognition are numerous, but so far only related to automatic emotion recognition and/or, if conducted with human listeners, then aimed at testing compression devices, such as for hearing aids, see Goy et al. 2016; Reddy and Vijayarajan 2020).
Taking up this flat-affect assumption, Niebuhr and Siegert (2022) extended their investigations from charisma to emotions. As before (see Section 1.3), the first step was a perception experiment. The experiment used the same charisma scales as in Siegert and Niebuhr (2021a), but now with a set of enacted emotional speech stimuli from the Berlin Database of Emotional Speech (EMODB) (Burkhardt et al., 2005). The stimuli represented the seven categories fear, disgust, boredom, neutral, anger, joy, and sadness. As in Siegert and Niebuhr (2021a), all emotional stimuli were compressed to various degrees by the codecs AMR-WB, MP3, OPUS, and SPEEX and then rated by listeners.
On this basis, Niebuhr and Siegert (2022) tested the ability of listeners to differentiate emotions in codec-compressed speech stimuli. Furthermore, Niebuhr and Siegert tested whether positive emotions generally trigger higher and negative emotions lower charisma rating levels or whether, in line with the above findings, the rating levels related to charisma tend to be independent of emotional valence. The study comes to three main conclusions: First, the applied charisma-related rating scales are generally able to significantly differentiate the seven emotion categories tested. Second, in line with the findings summarized above, valence was not the sole determining factor for rating levels. Negative emotional stimuli were thus also able to evoke high rating levels along the charisma-associated scales. Moreover, it was not the emotion with the lowest arousal, boredom, that triggered the lowest charisma ratings. Rather, the most uncharismatic emotion was disgust, not least because it evoked low charisma ratings regardless of speaker sex, while, e.g., fear made men sound more charismatic than women, and sadness made women sound more charismatic than men.
Third, both the type of audio codec and the strength of signal compression significantly impaired emotion differentiation along the rating scales. The worse the audio quality, the more the emotional impressions merged along the scales, even for popular codecs like MP3. For example, when being strongly compressed, high-arousal emotions such as joy became, in terms of the listener ratings, indistinguishable from low-arousal emotions such as boredom and sadness. Niebuhr and Siegert (2022) have thus provided the first perceptual evidence of a codec-induced digital flat affect. Analogous to the study by Siegert and Niebuhr (2021b), the present study is intended to shed light on the acoustic-prosodic side of this perceptual evidence.
1.6. Codecs and their influence on prosody
Speech compression is heavily used in modern mobile systems. It reduces the transmission bandwidth while maintaining speech intelligibility (Albahri et al., 2016). This allows engineers to reduce transmission delay as well as memory and storage capacities. Two different compression approaches have been developed. Psychoacoustic modeling is mainly used for transparent music compression, aiming to simultaneously reduce the file size and preserve all audible acoustic information. Prominent codecs are MP3, Ogg Vorbis, or Advanced Audio Coding (AAC). For real-time speech conversation applications, the Analysis-by-Synthesis approach predominates, designed to obtain an acceptable intelligibility at limited bandwidths, under real-time conditions and, if required, even at very low bit-rates. Important codecs using Analysis-by-Synthesis are SPEEX, AMR-(NB/WB/WB+), GSM-FR, or EVS. Furthermore, some codecs can switch between speech and audio compression modes based on signal content. Several codecs have been developed coordinating both approaches and offering various computational and intelligibility improvements (Vary and Martin, 2006). The Opus codec offers a hybrid mode in order to further improve speech intelligibility at low bit-rates.
Table 1 depicts an overview of parameters for selected audio codecs. Most Analysis-by-Synthesis codecs strive for perceptually optimizing the decoded (synthesis) signal in a closed loop. In order to achieve real-time processing, the algorithms involve three processing steps. This method is known as CELP: First, line spectral pairs (LSPs) are computed and quantized. The remaining properties of the speech signal are then estimated by using a codebook of fixed (i.e., hard-coded) quantization vectors, with a typical size of 16 bits. SPEEX uses CELP and AMR-WB as well, albeit an optimized version (i.e., an optimized codebook) referred to as ACELP for which frame rates are fixed at 20 ms. The codebook can contain more than 50 bits of entries. Another variant of this approach is SILK, used in the Opus codec. It also uses Analysis-by-Synthesis approaches but with variable frame sizes (10, 20, 40 and 60 ms), and it encodes up to 8 kHz. For full-bandwidth audio signals, Opus implements CELT, a high-quality, low-delay audio codec. CELT is based on the MDCT and supports frame sizes of 2.5, 5, 10, and 20 ms as well as wideband (8 kHz), super-wideband (12 kHz) and full-band (20 kHz) audio processing. Furthermore, the hybrid mode offered by OPUS uses SILK for frequencies up to 8 kHz and CELT to encode the frequencies above 8 kHz, but only based on frame sizes of 10 and 20 ms.
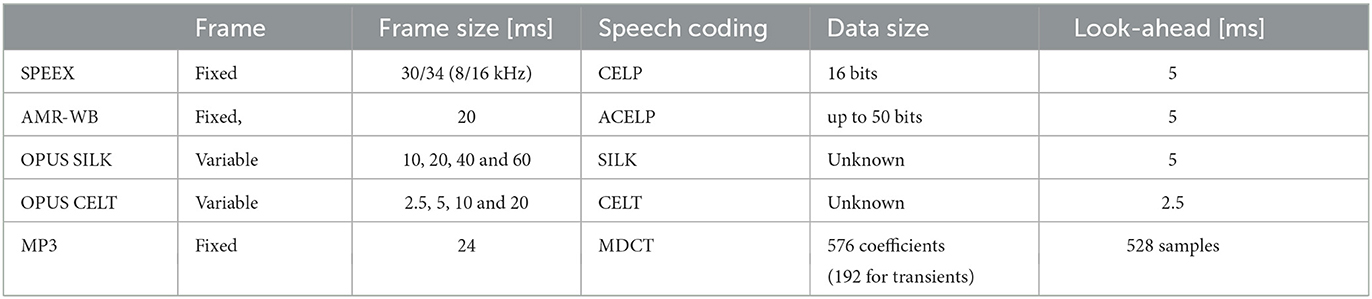
Table 1. Overview of important parameters of selected audio codes.
By contrast, the psychoacoustic modeling employed in MP3 compression strives to discard exactly those parts of the original sound signal that are considered beyond human auditory resolution. To that end, data frames of 24 ms are quantified using a polyphase filter bank with 32 equal frequency bands (less precisely perceptible frequency ranges with lower assumed resolution). Using equally wide frequency bands simplifies the filters but does not reflect human hearing, for which the resolution is non-linearly associated with frequencies. Afterwards, MDCT is applied, resulting either in 576 spectral coefficients (long blocks, 32 taps x 18 sub-bands) or three times 192 spectral coefficients (short blocks, 32 taps x 6 sub-bands). The 192-coefficient approach is applied—if there is a transient1—to limit the temporal spread of quantization noise accompanying this transient. Then, a quantization is used in which adjacent frequency bands are combined into groups of 4 to 18 bins and share a scaling factor determining the accuracy of the (in this case non-linear) coding for these frequency bands. Finally, the scale factors and the quantized amplitudes of the individual frequencies are Huffman-coded using fixed code tables (Lutzky et al., 2004). The relatively small block window decreases the coding efficiency, and the short time resolution can be too low for highly transient signals. That is, it can cause smearing of percussive sounds. Furthermore, the tree structure of the filter bank increases pre-echo problems and the combination of two adjunct filter banks creates aliasing problems, that are only partially compensated for at a later stage of the encoder.
Although a number of studies investigated the general impact of codec compression on spectral quality and acoustic features (Byrne and Foulkes, 2004; Guillemin and Watson, 2009; Siegert et al., 2016), the effects on the preservation of emotions, nonverbally conveyed ones in particular, have rarely been addressed (Albahri et al., 2016; Jokisch et al., 2016). Especially, the preservation of nonverbal emotional cues under low bandwidths is under-researched. In the following, some related findings for the codecs used in the current investigation are summarized.
Pollak and Behunek (2011) studied the masking and attenuation of frequency components under MP3 compression and found that this can lead to the suppression of a sound segment, and sometimes to inter-word pause shortening, which can reduce the perceived fluency of speech utterances. Furthermore, the masking and attenuation of frequency components can worsen the estimation error of power spectra in the output of the filter bank. This is especially crucial for MFCC and PLP features (Pollak and Behunek, 2011). The authors performed their experiments with quite high MP3 bit-rates (160 kbit/s). Thus, it can be assumed that the negative effects they reported would manifest themselves still more clearly at very low bit-rates. In Bollepalli (2013), a range of MP3 bit-rates from 8 to 160 kbit/s is investigated. The aim was to investigate the influence of compression on acoustic-prosodic features important for speech synthesis, such as f0, harmonics-to-noise ratio (HNR), line spectral frequencies (LSF) of voice source and vocal tract, harmonic amplitude difference (H1-H2), and normalized amplitude quotient (NAQ). For each compression rate, the relative error was determined between the parameter value computed from the uncompressed and compressed sound. Bollepalli (2013) observed that, for f0, the error was negligible at high bit-rates (64 kbit/s or more) and less than 5% on average at low bit-rates. However, it is noteworthy that lower bit rates not only made the magnitude of the error increase, but also its range. That is, in connection with other (spectral) signal properties, f0 errors are pushed in specific directions. For HNR, the error was considerably larger, particularly in high frequency bands, thus suggesting a better preservation of the harmonic structure in low-frequency bands. For LSF, an inverse observation was made. Both voice source and vocal tract measures showed the strongest increases in errors at low frequencies. Regarding how H1-H2 and NAQ differ as a function of original and compressed signals, Bollepalli et al. showed that the goodness of correlation between original and compression signal declined gradually with decreasing bit-rates. Especially H1-H2 suffers greatly from high compression, while NAQ remains relatively stable.
Another study of van Son (2005) analyzed the influence of codec compression on pitch, formant levels, and the spectral center of gravity (CoG). It was concluded that compression added a Root-Mean-Square (RMS) error of less than 1 semitone to vowel mid-point pitch, formant, and CoG measurements in general. Only for the lowest tested bit-rate (40 kbit/s), rather large CoG errors emerged in sonorous consonants and fricatives (> 2 semitones).
In summary, we see that codec compression has an effect on (automatic) prosodic measurements. The effect includes both f0 and spectral properties. However, f0 properties seem to be less affected than spectral properties, and among the latter, high-frequency spectral information seems to suffer more from compression than low-frequency spectral information, albeit both are affected. Furthermore, measures that integrate several signal features such as CoG are more strongly affected, particularly if these features are narrowly defined local characteristics as in the case of H1-H2. It is reasonable to assume that, when H1-H2 is particularly affected, that the same also applies to f0 range measures, which also represent a difference value between two local characteristics. For f0 measures, especially those related to levels, we can additionally expect an interaction with spectral characteristics, i.e., with the voice quality and, thus, with the type of emotion. That is, depending on the type of emotion, it is possible that the f0 measures get pushed in difference directions by compression. Thus, the question is not if codec compression affects the prosodic profiles of emotions, but only to what degree for the individual codecs. Based on the starting point for the present study outlined in Section 1.5, we therefore pursue three research questions, which we present in Section 1.7—and which we address according to Section 1.5 and Section 1.6 with reference to both tonal ( f0) and non-tonal parameters.
1.7. Questions
The present exploratory study aims to see behind the curtain of the perception results of Niebuhr and Siegert (2022) by means of a multi-parametric acoustic-prosodic analysis. This lays the foundation for three fields of knowledge, which are represented by the following three questions:
• How does speech signal compression, which is ubiquitous in the rapidly growing use of digital communication, affect the acoustics of different emotions?
• How is emotion acoustics related to listener ratings of perceived speaker charisma and related traits?
• Following up on question (2), how is the merging of emotions along the charisma scales reflected in prosodic parameters?
Note that all three questions have a gender-specific dimension that is taken into account here. Note further that the many emotions studied, and their compressed manifestations, provide an acoustic range that will also help us in subsequent studies to better understand which acoustic parameters and parameter classes are related to perceived charisma and how.
2. Study design
2.1. Stimuli
For the stimulus material, we relied on the Berlin Database of Emotional Speech, EMODB (Burkhardt et al., 2005). EMODB is a benchmark dataset of high-quality recordings of expressive emotions, similar to those used for analyzes of, e.g., speech synthesis (Steidl et al., 2012), spectral and temporal changes in emotional speech (Kienast and Sendlmeier, 2000), influences of different room acoustics (Höbel-Müller et al., 2019), or automatic emotion recognition (Schuller et al., 2009). EMODB is for German and has the advantage that it is established in the area of speech technology (Ververidis and Kotropoulos, 2006), with the largely unanimous identification of the emotional categories in the stimuli being repeatedly proven (Schuller et al., 2011; Weiss et al., 2013; Bhangale and Mohanaprasad, 2021). The emotions are: anger (Ärger), fear (Angst), joy (Freude), sadness (Trauer), disgust (Ekel), boredom (Langeweile), and neutral, a reference condition.
Studies on emotional expressions have in the past also relied on natural, real-life emotions, e.g., Tarasov and Delany (2011). Enacted emotions as in the EMODB are sometimes criticized as being exaggerated or prototypical and, thus, less ecologically valid. We agree that there are nowadays smart and indirect methods to elicit a range of emotions from native speakers (e.g., Pfitzinger and Kaernbach, 2008; Pfitzinger et al., 2011; Niebuhr et al., 2015). Yet, we would counter that, firstly, the underlying assumption that authentic everyday emotions always convey the speaker's actual feelings is unverifiable and cannot be taken for granted. In the case of negative emotions that are strongly regulated by society, this is actually rather unlikely. In this respect, authentic emotions are also not unproblematic in terms of their ecological validity. They probably mostly show a positivity bias in both their level of expressivity as well as in the frequency of occurrence of the displayed emotional categories. Secondly, a comparative study by Scherer (2013) shows that, at least for two basic types of emotions like happy and sad, the prosodic profiles of authentically stimulated and professionally enacted emotions came out largely congruent. Thirdly, it is essential for the present study that the emotions are realized on similar, if not identical, verbal statements. Such a high degree of experimental control is unattainable with naturally occurring, authentic emotions.
The crucial point, however, is that this authenticity was not necessarily desirable for the purposes of the present study. Rather, for our question of whether speech-compression codecs alienate or reduce the acoustic fingerprints of emotional speaker expressions, it makes sense to start from clearly pronounced, perhaps even exaggeratedly produced, emotional prototypes—and to include strongly contrastive emotions like joy, sadness, and disgust, the latter two of which are hard to find in authentic field data. On this basis, the chance to detect codec effects increases; and if there are already serious limitations in the acoustic discrimination of emotions for such clear speech material, then these discrimination limitations should be all the more problematic for blurrily separated, authentic emotions uttered outside of studio recording conditions (at least on an acoustic level, i.e., detached from the string of words and the conversational context). Based on EMODB, we can examine codec effects independently of effects of recording equipment and gain, speaker, and acoustic conditions.
Each utterance was contextualized for the speaker in the recording session, e.g., happiness after winning a large amount of money in the lottery or sadness caused by losing a very good friend or relative. The speakers were asked to put themselves in the given situation and then project that emotion onto the respective utterance. Afterwards, by conducting a perception test with 20 listeners, the final 494 single-sentence utterances have achieved naturalness ratings higher than 60%, and an emotion recognizability over 80% (Burkhardt et al., 2005).
For our study, we selected the same subset of 2 male and 2 female speakers (#11, #15 and #13, #14 in the corpus respectively) as in our previous studies (Siegert and Niebuhr, 2021a,b; Niebuhr and Siegert, 2022), but this time we utilized the neutral versions as well as the emotional version of the uttered sentence. This resulted in a total of 5 (codecs) *26 (samples) = 130 samples. For each emotion, we have 1 sample per speaker per emotion. Besides the obvious advantages of using the same set of speakers and utterances as in previous studies (the latter were focused on the emotionally neutral utterance renditions, though), four speakers sufficed for the purposes of the present study.
The small sample size may raise skepticism as to the generalizability of our findings. However, note that our study was not a classic speech production study in which, for example, meaningful patterns were to be derived from a speech acoustics that varies according to inter-individual anatomies and physiologies as well as due to trade-offs of redundant acoustics cues in the speech code. Such studies need large speaker samples to be able to separate the meaningful patterns from the performance “noise” in which they are embedded. In contrast, in our study, we apply a constant processing procedure in the form of each speech-compression codec to speech signals. This application always leads to the same result for the same speech signal, whereas, for example, a repetition of the same utterance, even by the same speaker, never leads to the same result. In this sense, the EMODB utterances are in our study design only demonstration objects for the acoustic consequences of applied codecs. In principle, the emotional utterances of a single speaker would have sufficed for this purpose. However, we wanted to take the factor speaker sex into account and, in addition, included two speakers per sex for a sufficient number of items in the statistical analysis (apart from the fact that we also wanted to use the same speakers and utterances as in Siegert and Niebuhr 2021a,b; Niebuhr and Siegert 2022). Of course, with a sample of 2x2 speakers, we cannot represent the full range of inter-individual and between-sex variations in the expression of emotional utterances; and although this is a very relevant follow-up question, it is not the aim of the present study to analyze the effects of speech-compression codecs on such phonetic variations within individual emotional categories. In this first step, our basic goal is to analyze the effects of speech-compression codecs on the acoustic differences between the emotional categories themselves. Not least because of this, it was important that we started from clear, prototypically produced emotions and included strongly contrastive emotions like fear, sadness, disgust, and joy.
2.2. Utilized audio codecs
The main purpose of applying speech compression for mobile communication is to reduce the bandwidth for transmission, the transmission delay as well as the required system memory and storage (Maruschke et al., 2016; Siegert et al., 2016). Several codecs have been developed to meet various applications with different quality requirements, aiming to retain the speech intelligibility (ITU-T, 1996, 2014; Maruschke et al., 2016). To be in line with the previous investigations by the Siegert and Niebuhr (2021a,b), and Niebuhr and Siegert (2022), the same four codecs were utilized here.
Adaptive Multi-Rate Wideband (AMR-WB) is a high-quality audio compression format mainly used in mobile communications (ITU-T, 2003). Due to the processing of a wider speech bandwidth (50–6,400/7,000 Hz), this codec is also known as “HD Voice” and Voice over LTE (VoLTE) as AMR-WB extended the previously usual telephone quality of 3.4 kHz. We chose a bit-rate of 12.65 kbit/s, which is intended for pure speech signals (ITU-T, 2003). For this bit-rate, all signals above 6,400 Hz are neglected and replaced by sounds of the lower frequency data (75–6,400 Hz) along with random noise (in order to simulate the high frequency band).
MPEG-1/MPEG-2 Audio Layer III (MP3) is a popular lossy full band audio codec (Brandenburg, 1999). It uses perceptual coding for audio compression: certain parts of the original signal, considered to be beyond auditory resolution, are discarded. Besides its usage for music storage, lower bit-rates (16 kbit/s) are used to encode audio dramas (Ahern, 2020).
OPUS is an open-source lossy audio codec usable for both speech and music (Valin et al., 2012). It is nowadays used in many communication tools, as Zoom for video conferencing or WhatsApp for voice messages (Hazra and Mateti, 2017). OPUS further offers a hybrid mode to improve the speech intelligibility at low bit-rates by enriching the synthesized signal with characteristics represented by a psychoacoustic model (Valin et al., 2013). The application of the hybrid mode can be controlled by the bit-rate, which was 34 kbit/s in our case.
SPEEX is an open-source full band speech codec for Internet applications requiring particularly low bit-rates (Xiph.Org Foundation, 2014). It is also used as a speech codec in common voice assistant platforms (Caviglione, 2015). The encoding is controlled by a quality parameter that ranges from 0 (worst) to 10 (best). In our study, we used 0 (i.e., 3.95 kbit/s).
Another reason for the limitation to low bandwidths is the fact that sufficient data transmission bandwidth cannot be expected everywhere and in every situation, or service providers limit the bandwidth. To illustrate the first case, Figure 1 shows the “Map of mobile service availability” from the German Federal Network Agency. It illustrates very well the network coverage in German metropolitan areas and the lack of coverage in the rural regions. Figure 2 also shows the map of cellular dead zones. Here, it is noticeable that such cellular dead zones occur in major cities as well as in rural areas. In the large cities, the cause is usually infrastructure congestion due to too many users logged on at the same time, while in rural areas it is more likely to be due to a lack of suitable infrastructure. This justifies the usage of low bitrates for the current investigation and to analyze how well the selected codecs perform under these (imperfect) circumstances.
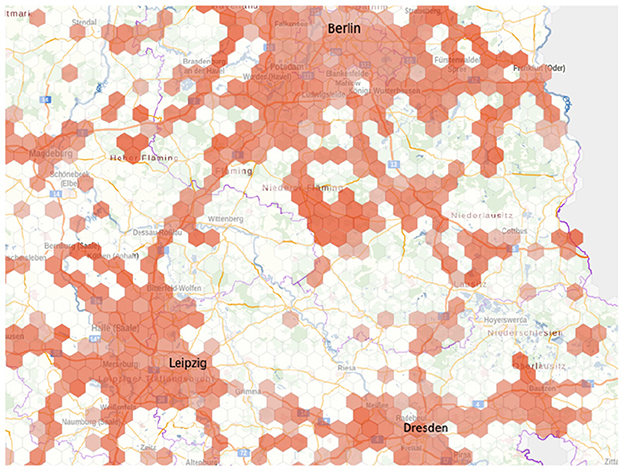
Figure 1. Mobile network coverage (5G) for the Vodafone Carrier Network as of June 2022. Map taken from Bundesnetzagentur (2022).
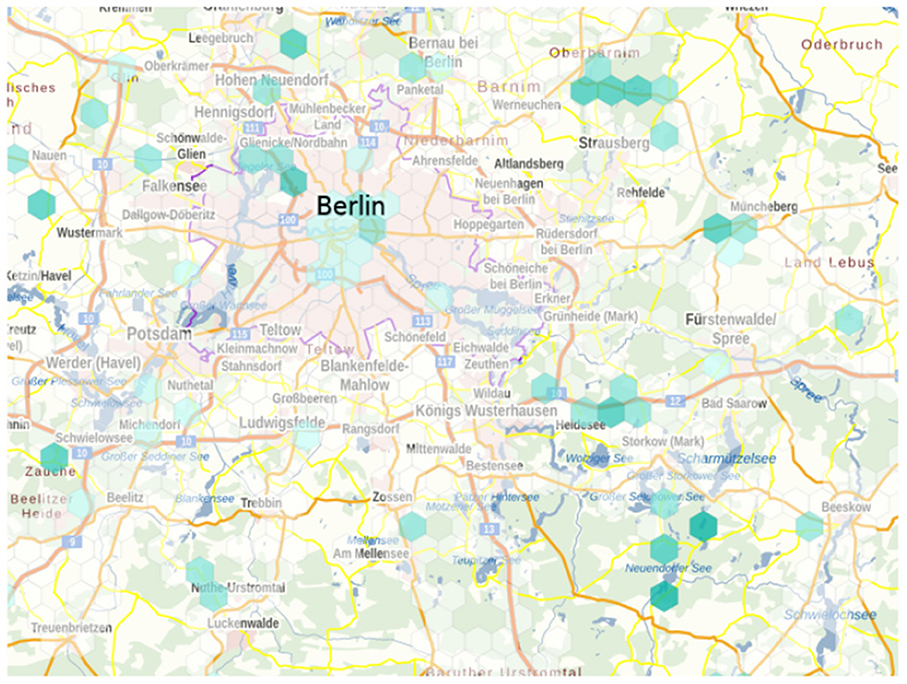
Figure 2. Map of cellular dead zones for Vodafone Carrier Network. Reported between Apr and Jun 2022. Map taken from Bundesnetzagentur (2022).
All 26 uncompressed stimuli have been compressed employing each of the four presented codecs at the specified bit-rate ( AMR-WB: 12.65 kbit/s, MP3: 16 kbit/s, OPUS: 34 kbit/s, SPEEX: 3.95 kbit/s). This resulted in 104 compressed stimuli. The total number of stimuli in our experiment was hence 26 + 104 = 130 stimuli.
2.3. Procedure
The uncompressed WAV originals and the audio files derived from them through compression codecs were subjected to an acoustic-prosodic analysis. In phonetic research, prosody represents “an umbrella term used to cover a variety of interconnected and interacting phenomena, namely stress, rhythm, phrasing, and intonation.” This definition by Arvaniti (2020) is functionally oriented, and although it excludes paralinguistic forms and functions like emotions and attitudes, it already suggests that prosody is far more than the fundamental frequency (i.e. f0) alone. It is true that f0, as the main acoustic correlate of perceived pitch, is perhaps most frequently examined in prosody research, not least because it is supposedly easy to measure (cf. Niebuhr et al. 2020). Nevertheless, prosody includes three further phenomenological dimensions. In phrasing, for example, duration plays a major role (with regard to intonation movements or phrase-final segmental units such as the syllable, e.g., Chavarría et al. 2004); and prominence as the basic building block of stress and rhythm is also encoded via changes in intensity and voice quality (Terken and Hermes 2000; Ludusan et al. 2021). Campbell and Mokhtari (2003) argue on empirical grounds “that voice-quality should be considered as the 4th prosodic parameter, along with pitch, power, and duration” (p.2417). In our study, we follow this phonetic (and hence pre-phonological and pre-functional) understanding of prosody of Campbell and Mokhtari. That is, by prosody we mean a bundle of phenomena constituted of four dimensions, namely f0, duration, intensity (or power) and voice quality—or their primary perceptual correlates pitch, length, loudness, and timbre.
Our acoustic analysis covers all of these prosodic dimensions through multiple measurement parameters, with the exception of duration. This is because the previous study by Siegert and Niebuhr (2021b), which was concerned with the neutral statements of EMODB, could not find any compression effects on durational features of the signal. This makes sense, given that it is essential for every codec (e.g., in video call conditions) to leave the time axis of the voice signal untouched. Accordingly, in the present acoustic analysis we have also omitted all parameters that reflect a change in prosodic dimensions over time—not because we are not convinced of the functional relevance of timing and slopes. On the contrary, the first author intensively studied the functional relevance of variation in slope (Barnes et al., 2012) or contour shape in general (Landgraf, 2014). However, there are neither empirical nor conceptual indicators that would motivate measuring these parameters in our study. On the other hand, there is compelling evidence showing that, based on holistic measures of descriptive statistics, such as means, ranges, and standard deviations, emotional profiles can be properly characterized and distinguished—to the extent that statistical models like the Linear Discriminant Analyzes (LDAs) perform at eye level with human listeners in terms of the classification accuracy of emotions. Lausen and Hammerschmidt (2020) provide a recent summary of the relevant works.
The f0-related tonal dimension of prosody was represented in the acoustic analysis by six parameters: (i) mean f0, (ii) absolute, full f0 range (span), (iii) narrow f0 range that disregards the upper and lower 10% of the measurements (p90 range), (iv) f0 variability (standard deviation, f0 std), (v) minimum f0, and (vi) maximum f0.
For the non-tonal dimensions of prosody, the acoustic analysis took seven parameters into account: (i) mean intensity (RMS. dB), (ii) speaking rate (syll/s) as well as (iii) mean H1-H2 and (iv) mean H1-A3 (both f0-corrected), and (v-vii) the mean levels of the first three formants (F1, F2, F3). Note that speaking rate may at first glance appear as a duration parameter, and to some degree it is of course one. But, the rate is estimated in terms of the rising-falling intensity peaks that are assumed to underlie each syllable, and it is the variability and separability of these intensity peaks that we are interested in here. The two amplitude-difference measures H1-H2 and H1-A3 are typical voice-quality parameters. H1-H2 is the difference between the first and the second harmonic amplitude of the spectrum. H1-A3 is the amplitude difference of the first harmonic and the harmonic closest to the third formant frequency. Both measures intend to estimate the speaker's spectral tilt. Menezes and Maekawa (2006) argue that H1-H2 reflects the open-quotient of the vocal-fold vibration cycle, whereas H1-A3 is associated with the abruptness of glottal closure. Therefore, H1-A3 may be more sensitive in capturing loudness- or effort-induced changes in voice quality, whereas H1-H2 performs well at representing differences between modal and breathy voices. Both measures have been found to be relevant for characterizing the acoustic profiles of emotions (Banse and Scherer, 1996; Liu and Xu, 2014).
Furthermore, mean F1, F2, and F3 seem to be unrelated to prosody. In fact, when measuring local formant-frequency targets or formant ranges, then the formant frequencies refer to segmental rather than prosodic characteristics, see, for example, the explanations in Ménard et al. (2007). However, when being measured in a literally suprasegmental way as mean resonance-frequency levels across entire utterances, the formant frequencies F1-F3 (and F4 too, see Rendall et al. 2005) become measures of voice quality. More specifically, they represent characteristics of vocal-tract length (or perceived speaker size), of the hollowness or brilliance of the voice, and of the speaker's articulatory setting, i.e., “vocal tract configurations that the articulators—including the jaw, larynx, pharynx, tongue, and lips—tend to be deployed from (and return to) in speech production” (Pratt, 2020:331). Such settings give all consonants and vowels of a speaker a certain constant coloring, and they play an important role in sociophonetics (Pratt, 2020). However, they also vary with the activity and potency features of emotions (Waaramaa et al., 2010) and are, additionally, very susceptible to effects of signal compression (Rozborski, 2007). For these reasons, we included mean F1-F3.
Given that we measured six tonal and seven non-tonal parameters, the acoustic analysis was based on 13 prosodic parameters in total. All parameters were measured per sentence. There were no pauses within the individual sentences. So, each sentence corresponds to a major prosodic phrase or an inter-pausal unit (IPU). Consequently, no pauses had to be taken into account or excluded, e.g., when measuring the speaking rate.
In our within-subjects study design, a normalization of measurements was basically not required. Individual speakers and speaker gender were perfectly balanced. That is, each condition included the same number of male and female tokens from the same speakers. Yet, while the measurements of parameters like speaking rate, intensity and F1, F2, and F3 differ between male and female speakers on average by about 10% or less (Pausewang Gelfer and Young, 1997; Iseli et al., 2007; Simpson, 2009), f0 measurements differ by almost factor two between male and female speakers, i.e., about 10 semitones on average (Traunmüller and Eriksson, 1995; Iseli et al., 2007; Simpson, 2009; Andreeva et al., 2014; Pépiot, 2014). Therefore, to reduce the statistical noise in our data, we gender-normalized the measurements of all f0 parameters by downscaling the women's values per speaker and IPU to the men's level based on the recent reference values in Pépiot (2014). That is, all female f0 values were recalculated by subtracting 10.5 semitones from each measurement, thereby bringing the female values in line with those of male speakers (the mean gender-specific f0 difference in Pépiot, 2014, which corresponds well to the difference determined by Andreeva et al., 2014).
This normalization represents a proportional rescaling of the measurements that leaves all other differences and aspects of the data intact. It was to be expected that at least part of the compression effects of the codecs on emotion acoustics would manifest itself in these other differences, such as distortions and blurring of measured parameter values (in a way that is perceptually relevant, see Siegert and Niebuhr, 2021b). For this reason we also refrained from, for example, a z-score transformation of measurements for all codec conditions of each sentence. Such a normalization could mask compression effects of the codecs on the emotion acoustics.
2.4. Statistics
The statistical analysis of the data was performed separately for the six tonal and seven non-tonal parameters and based on two types of tests. One of them was a multivariate analysis of covariance, MANCOVA. Two MANCOVAs tested separately for the sets of tonal and non-tonal parameters the effects of codec compression on the individual emotions, taking the individual four speakers into account. That is, Emotion (7 levels) and Codec (6 levels) were the two fixed factors (independent variables). The tonal and non-tonal measurement sets were the dependent variables. Sentence (in terms of its word count) was included as a covariate in the respective statistical model.
However, the key type of test in our analysis was a series of LDAs. We wanted to know whether the acoustic-prosodic parameters would lead to a significant discrimination of the seven emotion categories (including neutral) and whether and how much this discrimination performance deteriorates in combination with which compression codec. Therefore, the results of the LDAs are reported first in the Results section below. Note that, unlike analyzes of variance with equal sample sizes per condition, LDAs are not considered to be robust to data distortions, as we assume them to be more or less strongly created by the compression codecs. What is a problem in other studies—because the goal is usually to achieve the best possible discrimination, irrespective of data properties—is desirable in our study. We want a procedure, which provides us with sensitive insights into how the codecs worsen acoustic emotion discrimination. The LDA gives us these insights. Apart from that, the LDA is “currently the most used method for emotion classification in vocal stimuli” (Lausen and Hammerschmidt, 2020:3) and, thus, makes our results comparable to those of previous studies, not all of which used normalized or z-transformed data either (e.g., Hammerschmidt and Jürgens, 2007).
3. Results
Given our primary, emotion-oriented research questions, the key statistical analyzes were a series of LDAs. We wanted to know whether the acoustic-prosodic parameters would lead to a significant discrimination of the seven emotion categories (including neutral) and whether and how much this discrimination performance deteriorates in combination with which compression codec.
Figure 3 shows the key result of this series of predictive models: Relative to the WAV reference files, there are clear codec-specific effects on the discrimination performances of the LDAs. However, these effects differ fundamentally for the tonal and non-tonal parameters. For the tonal parameters, the discrimination performance does not deteriorate by signal compression. Rather, the opposite is true: it gets better. The WAV files achieve an overall performance of 50.0% for the seven emotion categories (chance level being 1/7 or 14.3%, because we have included 7 emotional categories and all are represented by the same number of sentences. Thus, 50%, although it often refers to a chance level performance, actually means a correct performance rate three times better than chance level in our study). When using the MP3 and SPEEX codecs, this overall performance increases to 76.9% and 69.2% respectively. An exactly opposite pattern emerged for the non-tonal parameters. At 88.5%, the overall discrimination performance of the seven emotion categories was highest for the uncompressed WAV files. This reference performance then gradually drops across the codecs, is only 80.8% for MP3 and reaches the low point of 73.1% for SPEEX. Note, however, that all of these performances are generally higher than for the six tonal parameters.
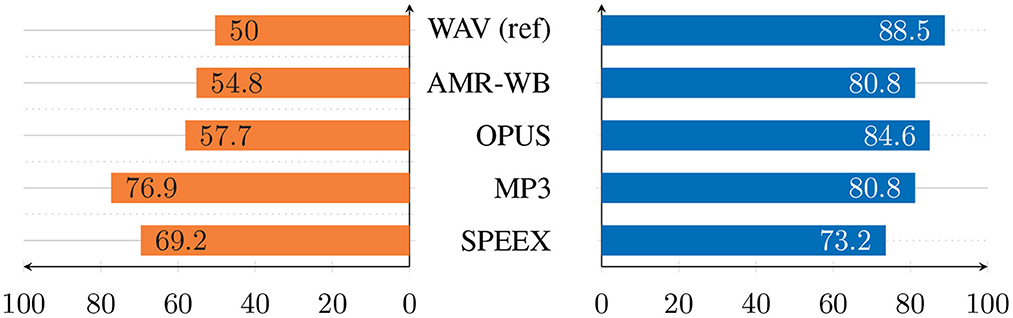
Figure 3. Overall emotion-discrimination performances (in %) of LDA series conducted per codec for the sets of tonal (Left) and non-tonal (Right) parameters. N = 26 per percentage.
In addition, Table 2 shows that the tonal and non-tonal LDAs also differ with respect to the emotions they could only discriminate poorly. For the tonal parameters, joy and sadness as well as the neutral rendering of the sentences were confused particularly often with other emotional categories. In the non-tonal LDAs, high confusion rates also occurred for joy and sadness, but additionally concerned anger, fear, and disgust. The neutral sentences were hardly confused with other, emotionally produced sentence. Furthermore, Table 2 shows that the top-three predictors the overall discrimination performance relied on were remarkably constant within each of the LDA series, the tonal and the non-tonal one. In the tonal LDA series, the f0-range parameters hardly played a role; what was primarily important were mean f0 level and the frequency scaling of the local minimum and maximum f0 values. In the non-tonal LDA series, the speaking rate did not play a major role. Instead, prediction or discrimination performances mainly relied on the voice-quality parameter H1-A3, the third formant F3, and the mean intensity.
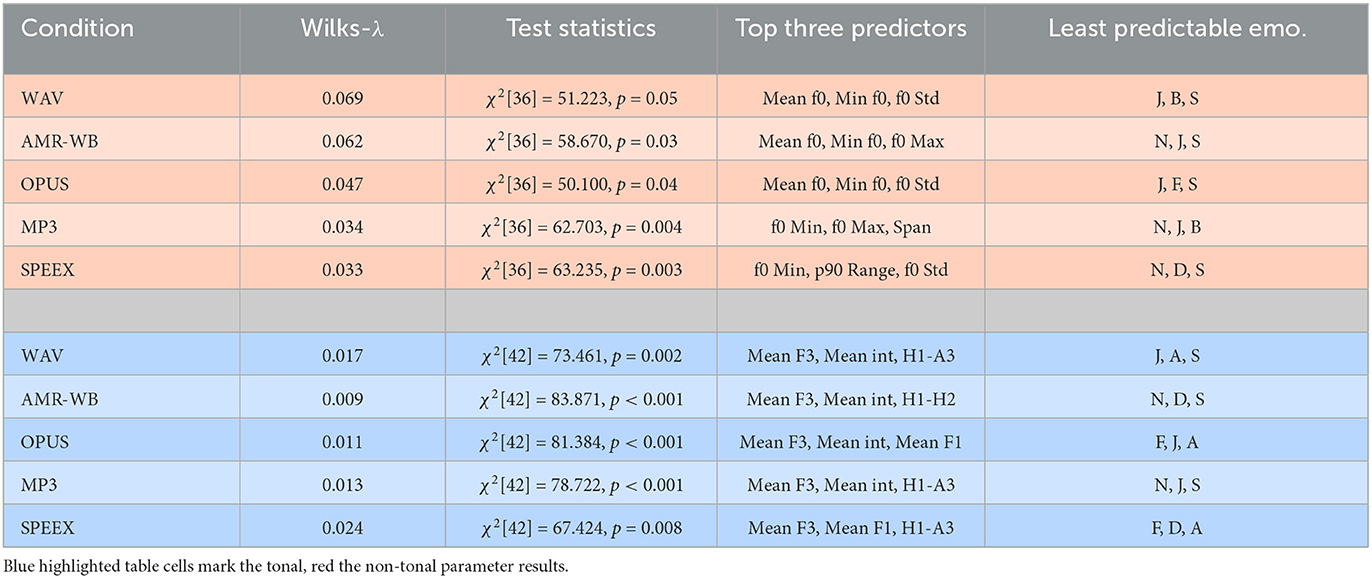
Table 2. Summary of key results of the LDAs conducted per codec for the sets of tonal (top) and non-tonal (bottom) parameters; J, joy; B, boredom; S, sadness; N, neutral; F, fear; D, disgust; A, anger.
Besides the two LDA series, we also calculated multivariate ANCOVAs, again separately for the two sets of tonal and non-tonal parameters. Sentence was integrated into the analyzes as a covariate. Emotion (7 levels) and Codec (6 levels) represented the two between-subjects fixed factors. Table 3 summarizes the relevant results of the two MANCOVAs. First, note that emotion resulted in main effects for almost all acoustic-prosodic parameters. That is, the seven emotional categories all differed clearly from each other in terms of the measured parameter set. It is beyond the scope of this study to present acoustic-prosodic profiles of all emotions involved, i.e., to detail how each emotion was characterized prosodically and to compare these characteristics to those carved out in previous studies. It is also well known from these previous studies how basic emotions differ acoustically (Mozziconacci, 2001; Gobl and Chasaide, 2003; Bänziger and Scherer, 2005); in fact, some comparative analyzes were also carried out for the EMODB corpus used here (Raju et al., 2018). However, note that two consistent patterns emerged across all 6 + 7 parameters. Firstly, the most extreme values along each parameter were always associated with the two emotions joy and anger on the one hand and boredom and sadness on the other, see, for example, Figure 4A for the emotion-specific f0 mimima. In contrast, there was, secondly, one single emotion whose measured values consistently fell in the middle of the acoustic range of all emotions. That is, one emotion did not stand out in any acoustic direction: disgust.
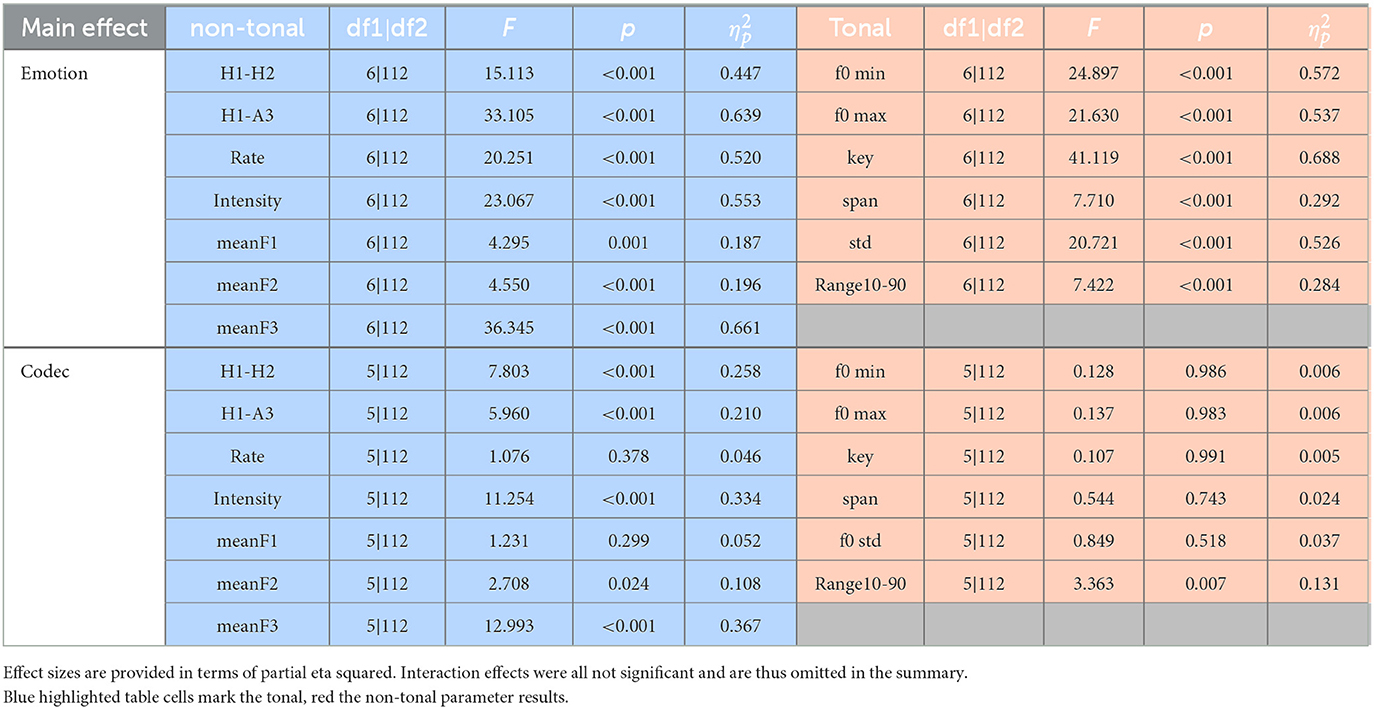
Table 3. Summary of the two MANCOVAs.
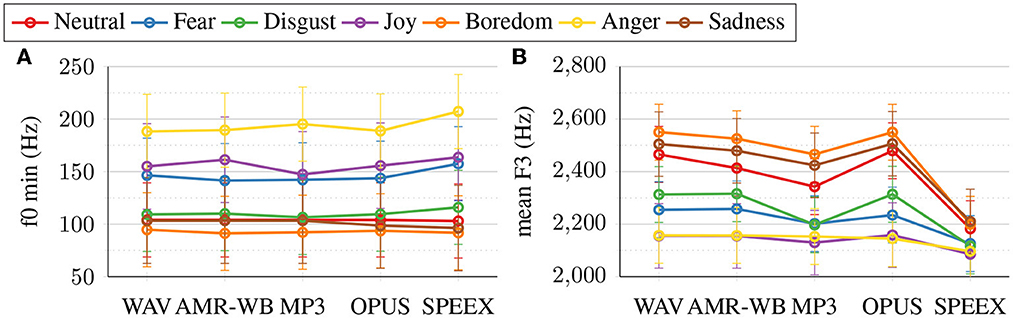
Figure 4. Estimated marginal means regarding Emotion*Codec interactions for the tonal parameter f0 min (A) and the non-tonal parameter mean F3 (B). Each datapoint N = 26.
Unlike for the fixed factor Emotion, Table 3 shows hardly any significant main effects of Codec on the acoustic parameters, especially not on the tonal ones. Only for the p90 range, there was a significant main effect of Codec. For f0 std, the main effect approached significance. A closer inspection of the data shows that both effects are due to a fanning-out of the measured values. That is, different emotions are influenced by compression in different directions. For example, the f0 values of joy tend to increase, whereas those of anger tend to decrease. Indications in these directions can also be seen for the f0 minima in Figure 4A. The fanning-out increases the acoustic distinctiveness of the emotions under compression and, thus, also f0 range or variability measures, especially in connection with MP3 and SPEEX. For the set of non-tonal parameters, there are a few significant main effects of Codec. This applies in particular to those measures that also had high prediction performances in the LDAs: mean F3, mean intensity, H1-A3, and H1-H2. The main effects are due to the fact that the values drop and merge to various degrees under speech compression. This applies even to something as popular as MP3 compression, but is especially pronounced under SPEEX compression. The latter is shown in Figure 4B, using the mean F3 as an example.
Note that there are no significant interactions of Emotion and Codec. The covariate Sentence yielded no significant effect either.
4. Discussion and conclusion
4.1. Interpretation of the findings
Siegert and Niebuhr (2021a) found that strong speech signal compression has significant effects on the perception of speaker charisma and related speaker traits. The perceived speaker charisma is significantly reduced, especially in connection with MP3 and SPEEX compression. Siegert and Niebuhr (2021b) then searched for the acoustic foundations of these perceptual changes and were able to determine that (a) codec compression systematically distorts the automatic measurements of charisma-relevant acoustic-prosodic parameters, that (b) these distortions are less strong for f0-based parameters than for spectral ones and less strong for holistic parameters than for ones that refer to local measurements, and that (c) the magnitude of codec-induced parameter changes correlates well with magnitude the lowering of perceived speaker charisma caused by these changes.
Niebuhr and Siegert (2022) extended this line of research to emotion perception using the same speech corpus (EMO-DB) and the same rating scales; firstly, because emotions are a key component of charisma (especially with regard to the degree of arousal) and, secondly, because the question to what extent codecs distort emotion recognition is of particular relevance to the everyday life of language users. Niebuhr and Siegert found that the seven emotion categories tested (incl. neutral) formed individual perception profiles along charisma-related rating scales—that compression blurred these emotion-specific profiles to codec-specific degrees, up to the point that they completely merged. That is, emotional speaker states were no longer perceptually distinct. Analogous to Siegert and Niebuhr (2021b), the task of the present acoustic analysis was to look for the foundations of these perceptual findings. If, to what degree, and along which parameters does an acoustic analysis reflect these perceptual findings? The conducted acoustic analysis relied on the same prosodic parameters as in Siegert and Niebuhr (2021b), i.e., temporal parameters were not included as they have already proved irrelevant in Siegert and Niebuhr (2021b).
Three questions were addressed. The first question concerned the qualitative nature of the connection between the perceptual distortions and their prosodic correlates: How does speech signal compression affect the acoustics of different emotions? The second question was conceptual in nature and asked which further insights can be gained from the above connection about the acoustic correlates of charisma and the relation of charisma and (different) emotions: How is emotion acoustics related to listener ratings of perceived speaker charisma and related traits? The third question was of a more specific, practical nature and asked which concrete acoustic patterns could be associated to the distortions in emotion perception: Does the merging of emotions along the charisma scales have an acoustic correspondence, and if so, along which prosodic parameters? The results of the present acoustic analysis provide the following answers to these three questions.
How does speech signal compression affect the acoustics of different emotions? The most important answer to this question is that the emotional acoustics are significantly and in some conditions to a considerable degree influenced by signal compression. The main effects of Codec in the MANCOVAs show this very clearly. The nature of this influence is complex. For f0 parameters, we find a fanning out of the measured values in emotion-specific directions. The (automatically measured) values can deviate by up to 20% from the values of the WAV reference condition. In particular, measures such as the (p90) f0 range or the f0 variability (std. dev.) are affected, which relate multiple values to one another, including local landmark values such as the f0 minimum. In the WAV condition, for example, the f0 variability values of joy and anger are only about 4 Hz apart (48.5 Hz vs. 52.7 Hz). Under MP3 compression, this difference increases to 22 Hz (40.3 Hz vs. 62.9 Hz)—and under SPEEX compression even to 29 Hz (38.2 Hz vs. 67.6 Hz). Figure 4A illustrates that this effect is also there for the f0 minimum, albeit less pronounced. For spectral measures, the effects of signal compression are qualitatively different. First, they are more numerous and stronger than for f0 (i.e. there are more significant main effects of Codec). Thus, this study replicates the findings of Siegert and Niebuhr (2021b), who also found that f0 measures are less susceptible to signal-compression effects than non-tonal measures. That f0 parameters are more robust against codec compression than spectral parameters is moreover in accord with van Son (2005) and Bollepalli (2013), whose studies were concerned with MP3 and Ogg Vorbis compressions. Our results suggest that this difference between the two different types of measures generally applies to codec compression. Second, the effects of compression on non-tonal parameters are more homogeneous across emotions. That is, the codecs affect the levels of measured values, but they do this similarly for all emotions, so that the acoustic distances between the emotions are more strongly preserved. A notable exception is SPEEX. This codec leads to an extensive merging of the non-tonal measurements across all emotions, as is exemplified in Figure 4B for the mean F3. The described differences are responsible for the fact that the LDA-based emotion discrimination gets almost 20% better under compression for tonal but more than 15% worse for non-tonal parameters.
The second question was: How is emotion acoustics related to listener ratings of perceived speaker charisma and related traits? Our findings provide a number of insights related to this question, based on clear parallels between the present results and the listener ratings in Niebuhr and Siegert (2022). In the latter study, joy and anger emerged as similarly charismatic emotions, and in fact these two emotions were also the most frequently confused ones in our acoustics-based LDAs, particularly in the WAV condition. Joy and anger stand out from the other emotion categories (incl. neutral) by the following characteristics: low values of H1-H2 and H1-A3, i.e. a shallow spectral slope, a high intensity level, high F1 values in combination with low F2 and F3 values, as well as the highest/largest f0 values of all emotions, including those of variability and range. These acoustic profiles are broadly consistent with those described as charisma-inducing in Niebuhr and Silber-Varod (2021). By far the most uncharismatic emotion in the perception study by Niebuhr and Siegert (2022) was disgust, ahead of boredom and sadness. In the present acoustic analysis, disgust emerged as the emotion whose acoustics was in the middle of all emotions. Expressing disgust meant to be neither particularly fast nor slow, neither high-pitched nor low-pitched, neither loud nor soft. Disgust meant relative mediocrity. This seems to imply that, not to stand out means not to be charisma-inducing. Furthermore, Niebuhr & Siegert reported that no significant emotion differentiation based on the charisma-related scales was possible under SPEEX. The present data show that the emotion discrimination of the LDAs improved for the f0 parameters, but worsened for the temporal and spectral parameters. All in all, these parallels between the present findings and those of Niebuhr & Siegert allow the following conclusions: In the tonal domain, charisma perception is essentially based on raised, more extensive, and more frequent (i.e., more variable) f0 movements. In the non-tonal domain, an essential ingredient of charismatic speech is an increased “vocal effort”, which (in addition to a raised f0) manifests itself in higher F1 and H1-A3 values (Liénard, 1999). The speaker's voice is loud, sounds resonant and is tense (negative H1-H2 values) than rather than breathy and thin. The speaker sounds big, i.e., the acoustic body size is high (lower F2 and F3 values; González, 2004). Moreover, these spectral aspects of prosody seem to carry more weight for perceived speaker charisma than the tonal aspects (in view of the comparisons between LDAs and the listener ratings in Niebuhr and Siegert 2022). This conclusion also fits with the latest data from Niehof and Niebuhr (2022), who concluded on the basis of their analyzes that a good tonal performance is required for investor pitches to win competitions—but it is a good spectral (and temporal) prosodic performance that decides about whether investor pitches loose competitions.
The third question was: Does the merging of emotions along the charisma scales have an acoustic correspondence, and if so, along which prosodic parameters? The answer to the second question already indicated that the answer to the third question is clearly positive. There are remarkable parallels between the codec-related merging of the emotion categories along the listener ratings in Niebuhr and Siegert (2022) on the one hand and the confusion and merging of emotion categories in the present LDAs on the other hand. Joy and anger were rated similarly charismatic in Niebuhr and Siegert (2022) and were particularly often confused in the present LDAs. The opposite is true for boredom and anger. These two emotions received very different charisma ratings in Niebuhr and Siegert (2022) and were not confused at all in the present LDAs. The charisma-related emotion ratings in Niebuhr and Siegert (2022) merged under SPEEX compression, and the same was true here to a large extent for the spectral and temporal prosodic parameters. Accordingly, the merging of the listener ratings in Niebuhr and Siegert (2022) is reflected here in the spectral dimensions—most strongly in the following three: intensity (RMS), mean F2 and mean F3.
To conclude the discussion of the results, the displays in Figure 5 provide a graphical summary of the findings. Shown are the largest moduli of the group centroids for the significant discriminant function(s) of the LDA—separately for each individual emotion. The centroids are mulivariate averages. They quantify how much a group—in this case an emotion—differs in standard deviation units from the zero mean of the discriminant function. They are thus a measure of the separability of the individual emotions from one another in the multivariate acoustic parameter space. As in Figure 3, the tonal and non-tonal values are differently color coded. At the level of the individual codecs it can be seen in Figure 5 that distinct shapes and area sizes emerge from the moduli of all emotions. The area size directly reflects the overall degree to which a codec can separate the individual emotions. In addition, how complementary (or non-complementary) the areas of the non-tonal and tonal moduli are in the value space contributes to the overall separability, too—as does a more circular shape as a sign of a more homogeneous discrimination performance across emotions. Consistent with the percentages in Figure 3, we see in Figure 5 that for WAV, as well as for OPUS and AMR-WB, the non-tonal areas are significantly larger than the tonal area. For WAV and OPUS, the areas are more circular, though, than the rather angular area of AMR-WB. We can also see that the non-tonal area for MP3 is already smaller than for the other three codecs, and in the case of SPEEX compression it shrinks considerably again. Simultaneously, SPEEX yielded the largest tonal area of all codecs. It is even larger than SPEEX's non-tonal area, albeit the least circular of all codecs. MP3 compression created a similarly large tonal area as SPEEX, but more circularly, which led to the overall highest tonal separation performance of all codecs (cf. Figure 3). For the WAV reference condition and the other two codecs, OPUS and AMR-WB, the tonal area is so much smaller than for SPEEX and MP3 that it lies entirely within the non-tonal area. Furthermore, the displays in Figure 5 also reflect the intermediate acoustic expression of disgust (in the form of consistently low group centroid moduli) and the generally more pronounced prosodies of anger and joy, with group centroid moduli for the latter emotion being higher than for the former, which reflects that anger was more often confused with joy than joy with anger.
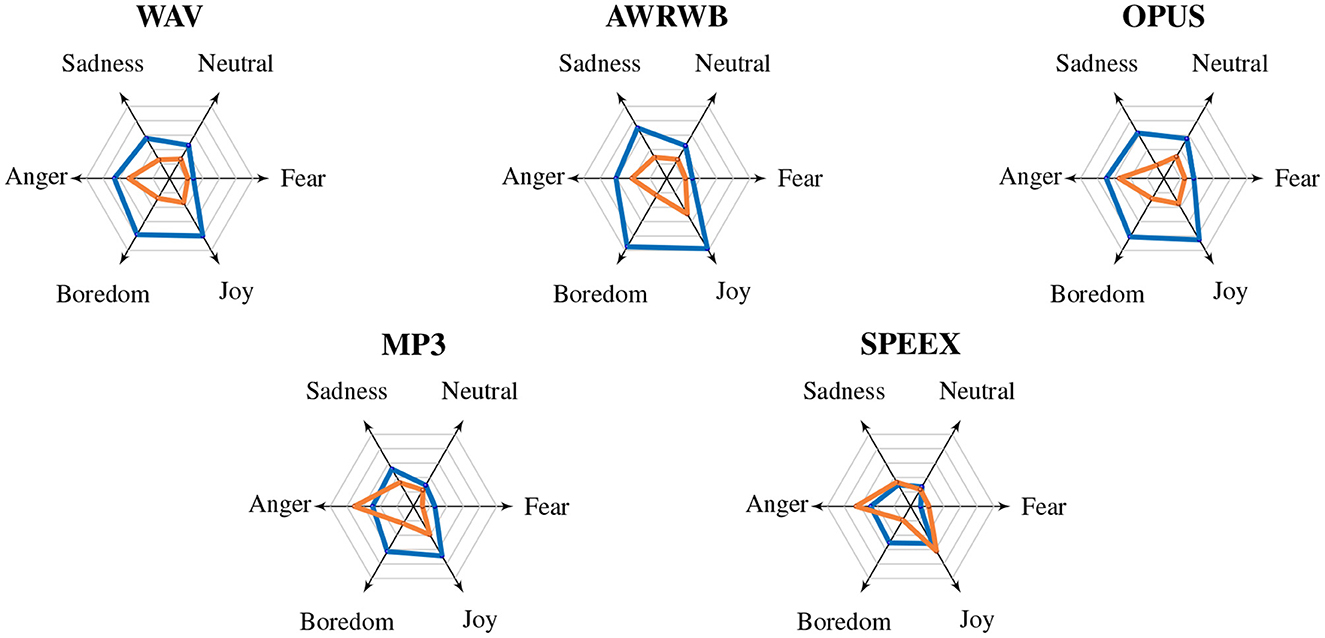
Figure 5. Spiderweb diagram for non-tonal () and tonal () moduli of the group centroids for the significant discriminant function(s) of the LDAs.
At the beginning of the paper and in its title, we asked whether there is a digital “flat affect” for emotional prosody. At the end of the results' discussion, the answer to this question is a conditional “yes”. Overall, this digital “flat affect” seems to apply more strongly to perception, for which emotional mergers were even more pronounced than in acoustics, and in the latter domain the “flat affect” did not apply to all codecs and all prosodic parameters. The non-tonal parameters seemed to be affected more than the tonal ones. In any case, it is particularly relevant for the nature of the “flat affect” that high-arousal emotions are more likely to be affected by acoustical codec distortions. For this reason, we can conclude even in view of our study's limitations (see Section 4.3) that a digital “flat affect” cannot be categorically ruled out in the everyday use of digital communication devices.
4.2. Toward explaining the compression effects
Finding technical explanations for the codec-related distortions of the acoustic-prosodic measurements goes beyond the aims of this study. Our goal was to test the audio files for the existence of such distortions and to examine the extent to which they match the results pattern of emotion perception from Niebuhr and Siegert (2022). Explaining the distortions technically would require correcting or manipulating the assumed origins of the distortions in the codecs so as to compare their new acoustic outputs and measurements with those of the original codec versions. This is an engineering question and no longer a socio- or psycho-phonetic question. However, paving the way to this engineering question, we offer below some assumptions about which basic mechanisms in the codecs could be responsible for the distortions.
First, we suspect the frame size of the codecs to be one of the three main causes, especially if the frame size is large and/or fixed. One of the defining characteristics of emotional (and also charismatic) speech vs. matter-of-fact speech is its altered signal dynamics (Banse and Scherer, 1996; Mozziconacci, 2001; Gobl and Chasaide, 2003; Niebuhr and Silber-Varod, 2021 for charisma). For higher arousal emotions like anger and joy, prosodic changes take place faster, and they involve larger contrasts, i.e., the used value range increases and syntagmatic differences are realized more pronounced, such as that between stressed and unstressed syllables. The opposite is true for low-arousal, low-dynamics emotions like sadness. It is plausible to assume that codecs can only inadequately represent altered dynamics, which deviate greatly from the emotionally neutral standard, if the frame size is not appropriate. A too large frame size means, for high arousal emotions, more changes than the codec can handle. Conversely, if the frame size is too small and the signal dynamics is too low, relevant prosodic changes could be overlooked by the codec. This would explain why emotions with particularly high/low arousal levels were (in terms of measurement distortions) acoustically changed the most by the codecs, either in the direction of better or worse discrimination to neighboring emotions in the LDA series. It would additionally explain why the MP3 and SPEEX compressions with their relatively large, fixed frame sizes of 24 ms or 30 ms (cf. Table 1) caused the greatest acoustic distortions. Furthermore, it would also explain why speaking rate, i.e., the measurement of defined intensity peaks and their frequency of occurrence per second, was not a major emotion discrimination factor for the compressed audios, although the general relevance of this factor is well documented (Banse and Scherer, 1996; Mozziconacci, 2001). Intensity peaks have a significantly higher dynamics than, for example, f0 or formant transitions and are therefore more susceptible to measurement errors and more variability within and between the emotion categories. In fact, for instance for SPEEX, the average speaking rate across all emotions is about 10% lower, i.e., intensity peaks got lost in the compression, while the variability of the speaking rate across all emotions increased.
A second reason, directly related to the first, we suspect is the size and adaptivity of a codec's codebooks. A codebook contains the range of quantization vectors that a codec is able to use. This applies in particular to the source signal. In the case of emotional speech, this source signal deviates partially or continuously from the modal voice signal of neutral utterances. This, in connection with the different f0 dynamics, could exceed the possibilities of some codebooks, such as SPEEX, whose codebook is not adaptive but hard-coded. The two codecs AMRWB and OPUS have larger and more adaptive codebooks. Only MP3 is based on a completely different compression method that does not require codebooks. It is striking in this context that MP3 was the only compression method that had the f0 range among the top-three tonal predictors and the only one whose non-tonal top-three predictors were identical to those of the WAV reference condition.
The third and perhaps most obvious reason is the range of spectral frequencies that the codecs took into account. We concluded here in line with, for example, Gobl and Chasaide (2003) that emotions are, in both dimensions arousal and valence, significantly defined by (differences in) voice quality, i.e., by (differences in) spectral energy distributions. Since the codecs took different spectral frequency ranges into account, it was therefore to be expected that this would cause perceptual distortions that match acoustically measured parameter distortions. SPEEX only covered the lower 4 kHz of the speech signal, AMR-WB reached up to 6.4 kHz, and OPUS included spectral frequencies until about 8 kHz. This order corresponds to the performance that the codecs achieved in terms of perceptual and acoustic discrimination relative to the WAV reference condition. Furthermore, it is consistent with this frequency-range explanation that emotions with a tenser voice and hence with a shallower spectral slope compared to neutral utterances—i.e., fear, anger, disgust—lost more of their acoustic discriminability through codec compression than other emotions.
4.3. Limitations and outlook
The present study had some limitations. This includes, among other things, that (1) the acoustic analysis was based on comparatively few speakers, that (2) the speech material was based on enacted emotions, and that (3) only very high compression rates of selected codecs were examined. For the present question, these limitations were acceptable. As we argued in 2.1, the aim here was to investigate the general nature of acoustic distortion effects caused by some technical signal-processing algorithms and not, for example, to separate meaningful prosodic patterns from variable human speech behavior. For the success of this investigation, it was the category diversity of the speech material that mattered and not its ecological validity—also because Scherer (2013) showed that the prosody of enacted emotions can basically be comparable with that of authentic emotional field recordings. It was also useful and reasonable here to begin this investigation with looking at a very high compression levels, for which the strongest effects could be expected. In addition, note that all limitations were not only acceptable—they were mandatory, because as we wanted to project the measured acoustic distortion effects onto the perception results of Niebuhr and Siegert (2022), which required using the same speech data, compression methods, and compression levels as in the latter study.
Although this projection was successful in that it revealed parallels between acoustic distortions and the listener ratings in Niebuhr and Siegert (2022), the above points (1)-(3) remain relevant limitations of this study. Regardless of these limitations, there can be no doubt in view of Section 4.1 that we were able to show here that codec compression of speech signals not only influences the naturalness and intelligibility of matter-of-fact utterances. It also influences the acoustics of emotions and—as shown by Niebuhr and Siegert (2022)—the identification of emotions in human speech. In this respect, the present data represent a call-to-action to go beyond phoneme and word recognition as performance criteria in researching and developing speech-signal compression procedures. Everyday conversations include a lot more than conveying and requesting propositional content, but this fact is currently not sufficiently reflected in speech compression/transmission technology.
When it comes to the details and diversification of this general call-to-action, the above limitations become relevant. Future research must therefore focus on comparatively examining the acoustics and perception of emotions—and higher-level concepts such as speaker charisma—taking into account the abundance of emotional variation and the availability of other codec variants and compression levels.
The first task of such follow-up studies should be to apply the codec variants and compression levels tested here to a wider range of speech material, i.e., to more speakers and more utterances. An extended speaker sample means additional voice-quality and f0-level conditions, and it also opens up the possibility of a separate investigation of speaker-sex effects (which are already well documented for charisma and uncompressed emotions, cf. Parkins, 2012; Niehof and Niebuhr, 2022). Testing more utterances means looking at a more diverse interplay of segmental and prosodic phenomena and, thus, at a richer and more variable prosody. In addition, follow-up studies could also test other languages and/or in-situ recorded emotions. For example, we assumed here that emotions which are less clearly pronounced (compared to enacted ones) would exacerbate compression-induced the acoustic overlap and, thus, the perceptual confusion of emotional categories. In principle, however, it is also possible that less strong emotions reduce the signal distortion caused by codecs as less strong typically means less extreme prosodic dynamics, in this way preserving the identification of emotional categories. Overall, our speaker and utterance samples are clearly too small to draw differentiated conclusions about exactly how, where, and under what conditions codecs weaken emotional signals.
A second task of follow-up studies, which is orthogonal to the first one, is to vary the codecs themselves, either with respect to the levels, versions, and types of codec compression or by iteratively modifying and testing the compression algorithms or procedures themselves. The first type of variation is relevant for everyday life, for example, in that it will allow determining compression thresholds up to which the distortion of the emotion acoustics and the identification of emotional categories are still acceptable. The targeted modification of the compression algorithms or procedures, on the other hand, is of conceptual relevance in that will allow revealing sources of distortions, to understand them and, if possible, to minimize them.
A third task of follow-up studies could ultimately be to use speech compression not as a research topic but as a research tool, for example, in order to gain insights into the importance of tonal and non-tonal prosodic cues to emotions, charisma, and related phenomena. The opposite LDA performances found here for tonal and non-tonal prosodic parameters, in combination with previous perception results that more closely resemble the non-tonal LDA performances (Niebuhr and Siegert, 2022) show the potential of this approach. This is all the more relevant since previous research into phenomena such as emotions and charisma has often focused on tonal parameters, while the factor voice-quality is currently gaining attention.
Data availability statement
Publicly available datasets were analyzed in this study. This data can be found at: http://emodb.bilderbar.info/index-1024.html.
Author contributions
All authors listed have made a substantial, direct, and intellectual contribution to the work and approved it for publication.
Conflict of interest
ON is the CEO and founder of the speech technology company AllGoodSpeakers ApS. Please visit https://oliverniebuhr.com for a conflict-of-interest statement.
The remaining author declares that the research was conducted in the absence of any commercial or financial relationships that could be construed as a potential conflict of interest.
Publisher's note
All claims expressed in this article are solely those of the authors and do not necessarily represent those of their affiliated organizations, or those of the publisher, the editors and the reviewers. Any product that may be evaluated in this article, or claim that may be made by its manufacturer, is not guaranteed or endorsed by the publisher.
Footnotes
1. ^A transient is a high amplitude, short-duration sound at the beginning of a waveform.
References
Ahern, S. (2020). Acoustical Design of Concert Halls and Theatres: A Personal Account, 3rd Edn. London: Routledge.
Albahri, A., Lech, M., and Cheng, E. (2016). Effect of speech compression on the automatic recognition of emotions. Int. J. Signal Process. Syst. 4, 55–61. doi: 10.12720/ijsps.4.1.55-61
Allison, T. H., Warnick, B. J., Davis, B. C., and Cardon, M. S. (2022). Can you hear me now? engendering passion and preparedness perceptions with vocal expressions in crowdfunding pitches. J. Bus. Venturing 37, 106193. doi: 10.1016/j.jbusvent.2022.106193
Alpert, M., and Anderson, L. T. (1977). Imagery mediation of vocal emphasis in flat affect. Arch. Gen. Psychiatry 34, 208–212. doi: 10.1001/archpsyc.1977.01770140098011
Alpert, M., Rosenberg, S. D., Pouget, E. R., and Shaw, R. J. (2000). Prosody and lexical accuracy in flat affect schizophrenia. Psychiatry Res. 97, 107–118. doi: 10.1016/S0165-1781(00)00231-6
Amari, Y., Okada, S., Matsumoto, M., Sadamitsu, K., and Nakamoto, A. (2021). “Multimodal analysis of client persuasion in consulting interactions: toward understanding successful consulting,” in Social Computing and Social Media: Applications in Marketing, Learning, and Health, ed G. Meiselwitz (Cham: Springer International Publishing), 29–40.
Andreeva, B., Demenko, G., Wolska, M., Möbius, B., Zimmerer, F., Jügler, J., et al. (2014). Comparison of pitch range and pitch variation in slavic and germanic languages. Proc. Speech Prosody 2014, 776–780. doi: 10.21437/SpeechProsody.2014-144
Antonakis, J., Bastardoz, N., Jacquart, P., and Shamir, B. (2016). Charisma: an ill-defined and ill-measured gift. Annu. Rev. Organ. Psychol. Organ. Behav. 3, 293–319. doi: 10.1146/annurev-orgpsych-041015-062305
Antonakis, J., Fenley, M., and Liechti, S. (2011). Can charisma be taught? tests of two interventions. Acad. Manag. Learn. Educ. 10, 374–396. doi: 10.5465/amle.2010.0012
Audibert, N., Aubergé, V., and Rilliard, A. (2010). “Prosodic correlates of acted vs. spontaneous discrimination of expressive speech: a pilot study,” in Proceedings of the 5th International Conference of Speech Prosody (Chicago, IL), 1–4.
Banse, R., and Scherer, K. R. (1996). Acoustic profiles in vocal emotion expression. J. Pers. Soc. Psychol. 70, 614–636. doi: 10.1037/0022-3514.70.3.614
Bänziger, T., and Scherer, K. R. (2005). The role of intonation in emotional expressions. Speech Commun. 46, 252–267. doi: 10.1016/j.specom.2005.02.016
Barnes, J., Veilleux, N., Brugos, A., and Shattuck-Hufnagel, S. (2012). Tonal center of gravity: a global approach to tonal implementation in a level-based intonational phonology. Lab. Phonol. 3, 337–383. doi: 10.1515/lp-2012-0017
Bass, B. (1990). Bass and Stogdill's Handbook of leadership: Theory, Research, and Managerial Applications, 3rd Edn. New York, NY: Free Press.
Bhangale, K., and Mohanaprasad, K. (2021). A review on speech processing using machine learning paradigm. Int. J. Speech Technol. 24, 367–388. doi: 10.1007/s10772-021-09808-0
Bollepalli, B. (2013). Effect of MPEG audio compression on HMM-based speech synthesis. Internship report, Aalto University, Finlad.
Bono, J. E., and Ilies, R. (2006). Charisma, positive emotions and mood contagion. Leadership Q. 17, 317–334. doi: 10.1016/j.leaqua.2006.04.008
Brandenburg, K. (1999). “MP3 and AAC explained,” in 17th AES International Conference: High-Quality Audio Coding (Florence).
Bundesnetzagentur (2022). “Karte,” in Breitband-Monitor. Available online at: https://gigabitgrundbuch.bund.de/GIGA/DE/Funklochkarte/start.html (accessed March 9, 2023).
Burkhardt, F., Paeschke, A., Rolfes, M., Sendlmeier, W., and Weiss, B. (2005). “A database of german emotional speech,” in Proceedings of the INTERSPEECH-2005 (Lissabon), 1517–1520.
Byrne, C., and Foulkes, P. (2004). The 'mobile phone effect' on vowel formants. Int. J. Speech Lang. Law 11, 83–102. doi: 10.1558/sll.2004.11.1.83
Campbell, N., and Mokhtari, P. (2003). “Voice quality: the 4th prosodic dimension,” in Proceedings of 15th International Congress of Phonetic Sciences (Barcelona), 2417–2420.
Caviglione, L. (2015). A first look at traffic patterns of siri. Trans. Emerg. Telecommun. Technol. 26, 664–669. doi: 10.1002/ett.2697
Chavarría, S., Yoon, T.-J., Cole, J., and Hasegawa-Johnson, M. (2004). “Acoustic differentiation of ip and IP boundary levels: comparison of l- and l-l% in the switchboard corpus,” in Proceedings of 2nd International Conference of Speech Prosody (Nara), 333–336.
Chebat, J.-C., Hedhli, K. E., Gélinas-Chebat, C., and Boivin, R. (2007). Voice and persuasion in a banking telemarketing context. Percept. Mot. Skills 104, 419–437. doi: 10.2466/pms.104.2.419-437
Chen, L., Feng, G., Joe, J., Leong, C. W., Kitchen, C., and Lee, C. M. (2014). “Towards automated assessment of public speaking skills using multimodal cues,” in Proceedings of the 16th International Conference on Multimodal Interaction, ICMI '14 (New York, NY: ACM), 200–203. doi: 10.1145/2663204.2663265
Damen, F., Van Knippenberg, D., and Van Knippenberg, B. (2008). Leader affective displays and attributions of charisma: the role of arousal. J. Appl. Soc. Psychol. 38, 2594–2614. doi: 10.1111/j.1559-1816.2008.00405.x
Davis, B. C., Hmieleski, K. M., Webb, J. W., and Coombs, J. E. (2017). Funders' positive affective reactions to entrepreneurs' crowdfunding pitches: the influence of perceived product creativity and entrepreneurial passion. J. Bus. Venturing 32, 90–106. doi: 10.1016/j.jbusvent.2016.10.006
D'Errico, F., Niebuhr, O., and Poggi, I. (2019). “Humble voices in political communication: a speech analysis across two cultures,” in Computational Science and Its Applications-ICCSA 2019 (Cham: Springer), 361–374.
D'Errico, F., and Poggi, I. (2022). ‘emotion that goes around comes around'. Political charisma and the emotions conveyed through social media. Acta Polytechn. Hungarica 19, 173–194. doi: 10.12700/APH.19.5.2022.5.9
Evensen, J., Røssberg, J. I., Barder, H., Haahr, U., Hegelstad, W. T. V., Joa, I., et al. (2012). Flat affect and social functioning: a 10 year follow-up study of first episode psychosis patients. Schizophr. Res. 139, 99–104. doi: 10.1016/j.schres.2012.04.019
Feraru, S. M., Schuller, D., and Schuller, B. (2015). “Cross-language acoustic emotion recognition: an overview and some tendencies,” in 2015 International Conference on Affective Computing and Intelligent Interaction (ACII) (Xi'an), 125–131. doi: 10.1109/ACII.2015.7344561
Fischer, K., Niebuhr, O., and Asadi, A. (2022). “The voice of creativity: effects of pitch range in the voice of a robot facilitator,” in Elektronische Sprachsignalverarbeitung 2022, volume 81 of Studientexte zur Sprachkommunikation (Sonderborg), 121–130.
Fischer, K., Niebuhr, O., Jensen, L. C., and Bodenhagen, L. (2019). Speech melody matters–how robots profit from using charismatic speech. J. Hum. Robot Interact. 9, 274. doi: 10.1145/3344274
Furnham, A., Chan, P. S., and Wilson, E. (2013). What to wear? the influence of attire on the perceived professionalism of dentists and lawyers. J. Appl. Soc. Psychol. 43, 1838–1850. doi: 10.1111/jasp.12136
Gobl, C., and Chasaide, A. N. (2003). The role of voice quality in communicating emotion, mood and attitude. Speech Commun. 40, 189–212. doi: 10.1016/S0167-6393(02)00082-1
González, J. (2004). Formant frequencies and body size of speaker: a weak relationship in adult humans. J. Phon. 32, 277–287. doi: 10.1016/S0095-4470(03)00049-4
Gooty, J., Connelly, S., Griffith, J., and Gupta, A. (2010). Leadership, affect and emotions: a state of the science review. Leadership Q. 21, 979–1004. doi: 10.1016/j.leaqua.2010.10.005
Gottheil, E., Paredes, A., Exline, R. V., and Winkelmayer, R. (1970). Communication of affect in schizophrenia. Arch. Gen. Psychiatry 22, 439–444. doi: 10.1001/archpsyc.1970.01740290055007
Goy, H., Pichora-Fuller, M. K., Singh, G., and Russo, F. A. (2016). Perception of emotional speech by listeners with hearing aids. Can. Acoustics 44, 182–183. Available online at: https://jcaa.caa-aca.ca/index.php/jcaa/article/view/2962
Grabo, A., Spisak, B. R., and van Vugt, M. (2017). Charisma as signal: an evolutionary perspective on charismatic leadership. Leadership Q. 28, 473–485. doi: 10.1016/j.leaqua.2017.05.001
Gregory, S. W., and Gallagher, T. J. (2002). Spectral analysis of candidates' nonverbal vocal communication: predicting u.s. presidential election outcomes. Soc. Psychol. Q. 85, 298–308. doi: 10.2307/3090125
Guillemin, B. J., and Watson, C. I. (2009). “Impact of the GSM AMR speech codec on formant information important to forensic speaker identification,” in Proceedings of IEEE ICASSP (Instanbul: IEEE).
Hammerschmidt, K., and Jürgens, U. (2007). Acoustical correlates of affective prosody. J. Voice 21, 531–540. doi: 10.1016/j.jvoice.2006.03.002
Hazra, S., and Mateti, P. (2017). “Challenges in android forensics,” in Security in Computing and Communications, eds S. M. Thampi, G. Martínez Pérez, C. B. Westphall, J. Hu, C. I. Fan, and F. Gómez Mármol (Singapore: Springer Singapore), 286–299.
Höbel-Müller, J., Siegert, I., Heinemann, R., Requardt, A. F., Tornow, M., and Wendemuth, A. (2019). “Analysis of the influence of different room acoustics on acoustic emotion features and emotion recognition performance,” in Tagungsband-DAGA 2019 (Rostock), 886–889.
House, R. (1977). A 1976 Theory of Charismatic Leadership, Carbondale: Southern Illinois; University Press.
Humphrey, R., Pollack, J., and Hawver, T. (2008). Leading with emotional labor. J. Manag. Psychol. 23, 151–168. doi: 10.1108/02683940810850790
Iseli, M., Shue, Y.-L., and Alwan, A. (2007). Age, sex, and vowel dependencies of acoustic measures related to the voice source. J. Acoust. Soc. Am. 121, 2283–2295. doi: 10.1121/1.2697522
ITU-T (2003). Wideband Coding of Speech at around 16 kbit/s using Adaptive Multi-Rate Wideband (AMR-WB). REC G.722.2.
ITU-T (2014). Methods for objective and subjective assessment of speech quality (POLQA): Perceptual Objective Listening Quality Assessment. REC P.863.
Jokisch, O., Iaroshenko, V., Maruschke, M., and Ding, H. (2018). “Influence of age, gender and sample duration on the charisma assessment of german speakers,” in Studientexte zur Sprachkommunikation: Elektronische Sprachsignalverarbeitung, eds A. Berton, U. Haiber, and W. Minker (Dresden: TUD Press), 224–231.
Jokisch, O., Maruschke, M., Meszaros, M., and Iaroshenko, V. (2016). “Audio and speech quality survey of the opus codec in web real-time communication,” in Elektronische Sprachsignalverarbeitung 2016. Tagungsband der 27. Konferenz, volume 81 of Studientexte zur Sprachkommunikation, ed O. Jokisch (Leipzig: TUD Press), 254–262.
Kao, Y.-H., and Lee, L.-S. (2006). “Feature analysis for emotion recognition from Mandarin speech considering the special characteristics of Chinese language,” in Proceedings of 17th International Interspeech conference (Pittsburgh, PA), 1814–1817. doi: 10.21437/Interspeech.2006-501
Karabell, S. (2016). “Dressing like a leader: style tips for women in the spotlight,” in Forbes Magazin. Available online at: https://www.forbes.com/sites/shelliekarabell/2016/01/16/dressing-like-a-leader-style-tips-for-women-in-the-spotlight/?sh=23e692412466 (accessed March 9, 2023).
Keating, C. F. (2011). “Channelling charisma through face and body status cues,” in Social Psychological Dynamics, eds D. Chadee and A. Kostic (Jamaica: University of the West Indies Press), 93–111.
Kienast, M., and Sendlmeier, W. F. (2000). “Acoustical analysis of spectral and temporal changes in emotional speech,” in Proceedings of ITRW on Speech and Emotion (Newcastle), 92–97.
Kim, J., Cho, D., and Lee, B. (2016). “The mind behind crowdfunding: an empirical study of speech emotion in fundraising success,” in Proceedings 37th International Conference on Information Systems (ICIS) (Bangkok), 1–11.
Kimani, E., Murali, P., Shamekhi, A., Parmar, D., Munikoti, S., and Bickmore, T. (2020). “Multimodal assessment of oral presentations using hmms,” in ICMI '20 (New York, NY: ACM), 650–654.
Kisfalvi, V., and Pitcher, P. (2003). Doing what feels right: the influence of ceo character and emotions on top management team dynamics. J. Manag. Inquiry 12, 42–66. doi: 10.1177/1056492602250518
Koolagudi, S., and Rao, K. (2012). Emotion recognition from speech: a review. Int. J. Speech Technol. 15, 99–117. doi: 10.1007/s10772-011-9125-1
Landgraf, R. (2014). “Are you serious? irony and the perception of emphatic intensification,” in Proceedings of 4th International Symposium on Tonal Aspects of Languages (TAL 2014) (Nijmegen), 91–94.
Lausen, A., and Hammerschmidt, K. (2020). Emotion recognition and confidence ratings predicted by vocal stimulus type and prosodic parameters. Humanit Soc. Sci. Commun. 7, 2. doi: 10.1057/s41599-020-0499-z
Liénard, J. S. D. B. M. (1999). Effect of vocal effort on spectral properties of vowels. J. Acoust. Soc. Am. 106, 411–422. doi: 10.1121/1.428140
Liu, L., Suh, A., and Wagner, C. (2018). Empathy or perceived credibility? an empirical study on individual donation behavior in charitable crowdfunding. Internet Res. 28, 240. doi: 10.1108/IntR-06-2017-0240
Liu, X., and Xu, Y. (2014). “Body size projection by voice quality in emotional speechEvidence from Mandarin Chinese,” in Proceedings of 7th International Conference on Speech Prosody (Dublin), 974–977. doi: 10.21437/SpeechProsody.2014-184
Ludusan, B., Wagner, P., and Włodarczak, M. (2021). Cue interaction in the perception of prosodic prominence: the role of voice quality. Proc. Interspeech 2021, 1006–1010. doi: 10.21437/Interspeech.2021-1357
Luengo, I., Navas, E., Hernáez, I., and Sánchez, J. (2005). Automatic emotion recognition using prosodic parameters. Proc. Interspeech 2005, 493–496. doi: 10.21437/Interspeech.2005-324
Lutzky, M., Schuller, G., Gayer, M., Krämer, U., and Wabnik, S. (2004). “A guideline to audio codec delay,” in Proceedings of 116th Audio Engineering Society Convention (Berlin), 1–10.
Maran, T., Liegl, S., Moder, S., Kraus, S., and Furtner, M. (2021). Clothes make the leader! how leaders can use attire to impact followers' perceptions of charisma and approval. J. Bus. Res. 124, 86–99. doi: 10.1016/j.jbusres.2020.11.026
Maruschke, M., Jokisch, O., Meszaros, M., Trojahn, F., and Hoffmann, M. (2016). “Quality assessment of two fullband audio codecs supporting real-time communication,” in Proceedings of the 18th International Conference on Speech and Computer SPECOM 2016 (Budapest), 571–579.
Ménard, L., Schwartz, J.-L., Bo,ë, L.-J., and Aubin, J. (2007). Articulatory-acoustic relationships during vocal tract growth for french vowels: analysis of real data and simulations with an articulatory model. J. Phon. 35, 1–19. doi: 10.1016/j.wocn.2006.01.003
Menezes, C., and Maekawa, K. (2006). “Paralinguistic effects on voice quality: a study in Japanese,” in Proceedings of the 3rd International Conference of Speech Prosody, Paper 049, 1–4.
Mozziconacci, S. (2001). Modeling emotion and attitude in speech by means of perceptually based parameter values. User Model Useradapt Interact. 11, 297–326. doi: 10.1023/A:1011800417621
Niebuhr, O. (2021). “Advancing higher education practice by analyzing and training students vocal charisma: evidence from a danish field study,” in Proceedings of 7th International Conference on Higher Education Advances (Head 2021) (Valencia), 1–8.
Niebuhr, O., and Michalsky, J. (2019). “Computer-generated speaker charisma and its effects on human actions in a car-navigation system experiment—or how steve jobs' tone of voice can take you anywhere,” in Procedings of Computational Science and Its Applications-ICCSA 2019, volume 11620 LNCS, eds S. Misra, C. Torre, E. Tarantino, B. O. Apduhan, O. Gervasi, B. Murgante, E. Stankova, V. Korkhov, A. M. A. Rocha, and D. Taniar (Saint Petersburg: Springer Verlag), 375–390.
Niebuhr, O., Peters, B., Landgraf, R., and Schmidt, G. (2015). “The kiel corpora of “speech and emotion”—a summary,” in Tagungsband-DAGA 2015 (Rostock), 1011–1014.
Niebuhr, O., Reetz, H., Barnes, J., and Yu, A. C. L. (2020). Fundamental Aspects in the Perception of f0. Oxford: Oxford University Press.
Niebuhr, O., and Siegert, I. (2022). ““high on emotion “? how audio codecs interfere with the perceived charisma and emotional states of men and women,” in Elektronische Sprachsignalverarbeitung 2022. Tagungsband der 33. Konferenz, volume 103 of Studientexte zur Sprachkommunikation (Sonderborg: TUD Press), 243–252.
Niebuhr, O., and Silber-Varod, V. (2021). How versatility performance influences perception of charismatic speech: a study on two israeli politicians. Interact Stud. 22, 303–342. doi: 10.1075/is.00007.nie
Niehof, J., and Niebuhr, O. (2022). “What's pitch got to do with it?—the connection between speech prosody and investor-pitch success,” in Proceedings of 1st International Conference on Tone and Intonation (TAI) (Sonderborg), 288–292.
Parkins, R. (2012). “Gender and emotional expressiveness: an analysis of prosodic features in emotional expression,” in Griffith Working Papers in Pragmatics and Intercultural Communication, Vol. 5, 46–54. Available online at: https://webarchive.nla.gov.au/awa/20130709003058/http://pandora.nla.gov.au/pan/85901/20130709-0954/Vol-5-Issue-1-complete_final.pdf
Pausewang Gelfer, M., and Young, S. R. (1997). Comparisons of intensity measures and their stability in male and female sneakers. J. Voice 11, 178–186. doi: 10.1016/S0892-1997(97)80076-8
Pépiot, E. (2014). Male and female speech: a study of mean f0, f0 range, phonation type and speech rate in parisian french and american english speakers. Speech Prosody 7, 305–309. doi: 10.21437/SpeechProsody.2014-49
Pfitzinger, H. R., Amir, N., Mixdorff, H., and B6sel, J. (2011). “Cross-language perception of hebrew and german authentic emotional speech,” in Proceedings of 17th International Congress of Phonetic Sciences (Hong Kong), 1586–1589.
Pfitzinger, H. R., and Kaernbach, C. (2008). Amplitude and amplitude variation of emotional speech. Proc. Interspeech 2008, 1036–1039. doi: 10.21437/Interspeech.2008-322
Pollak, P., and Behunek, M. (2011). “Accuracy of mp3 speech recognition under real-word conditions: experimental study,” in Proceedings of the International Conference on Signal Processing and Multimedia Applications (Seville), 1–6.
Pratt, T. (2020). Embodying “tech”: articulatory setting, phonetic variation, and social meaning. J. Sociolinguist. 24, 328–349. doi: 10.1111/josl.12369
Raju, V.V. V, Gurugubelli, K., Alluri, K. R., and Kumar Vuppala, A. (2018). “Differenced prosody features from normal and stressed regions for emotion recognition,” in 2018 5th International Conference on Signal Processing and Integrated Networks (SPIN) (Noida), 821–825. doi: 10.1109/SPIN42206.2018
Reddy, A., and Vijayarajan, V. (2020). Audio compression with multi-algorithm fusion and its impact in speech emotion recognition. Int. J. Speech Technol. 23, 277–285. doi: 10.1007/s10772-020-09689-9
Rendall, D., Kollias, S., Ney, C., and Lloyd, P. (2005). Pitch (f0) and formant profiles of human vowels and vowel-like baboon grunts: the role of vocalizer body size and voice-acoustic allometry. J. Acoust. Soc. Amer. 117, 944–955. doi: 10.1121/1.1848011
Rosenberg, A., and Hirschberg, J. (2009). Charisma perception from text and speech. Speech Commun. 51, 640–655. doi: 10.1016/j.specom.2008.11.001
Rozborski, B. (2007). “A preliminary study on the influence of sound data compression upon formant frequency distributions in vowels and their measurement,” in Proceedings of ICPhS XVI (Saarbrücken), 1833–1836.
Scherer, K. R. (2013). Vocal markers of emotion: Comparing induction and acting elicitation. Comput. Speech Lang. 27, 40–58. doi: 10.1016/j.csl.2011.11.003
Schuller, B., Batliner, A., Steidl, S., and Seppi, D. (2011). Recognising realistic emotions and affect in speech: state of the art and lessons learnt from the first challenge. Speech Commun. 53, 1062–1087. doi: 10.1016/j.specom.2011.01.011
Schuller, B., Vlasenko, B., Eyben, F., Rigoll, G., and Wendemuth, A. (2009). “Acoustic emotion recognition: a benchmark comparison of performances,” in Proceedings of the IEEE ASRU-2009 (Moreno: IEEE), 552–557.
Siegert, I., Lotz, A. F., l. Duong, L., and Wendemuth, A. (2016). “Measuring the impact of audio compression on the spectral quality of speech data,” in Elektronische Sprachsignalverarbeitung 2016, volume 81 of Studientexte zur Sprachkommunikation (Leipzig), 229–236.
Siegert, I., and Niebuhr, O. (2021a). Case report: women, be aware that your vocal charisma can dwindle in remote meetings. Front. Commun. 5, 135. doi: 10.3389/fcomm.2020.611555
Siegert, I., and Niebuhr, O. (2021b). “Speech signal compression deteriorates acoustic cues to perceived speaker charisma,” in Elektronische Sprachsignalverarbeitung 2021. Tagungsband der 32. Konferenz, volume 99 of Studientexte zur Sprachkommunikation (Berlin: TUD Press), 1–10.
Simpson, A. P. (2009). Phonetic differences between male and female speech. Lang. Linguist. Compass 3, 621–640. doi: 10.1111/j.1749-818X.2009.00125.x
Steidl, S., Polzehl, T., Bunnell, H. T., Dou, Y., Muthukumar, P. K., Perry, D., et al. (2012). Emotion identification for evaluation of synthesized emotional speech. Proc. Speech Prosody 2012, 661–664. Available online at: https://www.isca-speech.org/archive/speechprosody_2012/steidl12_speechprosody.html
Strangert, E., and Gustafson, J. (2008). What makes a good speaker? subject ratings, acoustic measurements and perceptual evaluations. Proc. Interspeech 2008, 1688–1691. doi: 10.21437/Interspeech.2008-368
Sy, T., Horton, C., and Riggio, R. (2018). Charismatic leadership: Eliciting and channeling follower emotions. Leadership Q. 29, 58–69. doi: 10.1016/j.leaqua.2017.12.008
Tarasov, A., and Delany, S. J. (2011). “Benchmarking classification models for emotion recognition in natural speech: a multi-corporal study,” in Proceedings of the 9th IEEE FG (Santa Barbara, CA), 841–846.
Terken, J., and Hermes, D. (2000). The Perception of Prosodic Prominence. Dordrecht: Springer Netherlands.
Touati, P. (1993). “Prosodic aspects of Political rhetoric,” in Proceedings of ESCA Workshop on Prosody (Lund), 168–171.
Traunmüller, H., and Eriksson, A. (1995). The frequency range of the voice fundamental in the speech of male and female adults. Linguistics Department, University of Stockholm, Stockholm, Sweden.
Tur, B., Harstad, J., and Antonakis, J. (2021). Effect of charismatic signaling in social media settings: evidence from ted and twitter. Leadership Q. 33, 101476. doi: 10.1016/j.leaqua.2020.101476
Valin, J.-M., Maxwell, G., Terriberry, T. B., and Vos, K. (2013). “The opus codec,” in 135th AES International Convention (New York, NY).
van Son, R. J. J. H. (2005). A study of pitch, formant, and spectral estimation errors introduced by three lossy speech compression algorithms. Acta Acustica United Acust. 91, 771–778.
Vary, P., and Martin, R. (2006). Digital Speech Transmission: Enhancement, Coding and Error Concealment. Chichester: Wiley & Sons.
Ververidis, D., and Kotropoulos, C. (2006). Emotional speech recognition: resources, features, and methods. Speech Commun. 48, 1162–1181. doi: 10.1016/j.specom.2006.04.003
Waaramaa, T., Laukkanen, A., Airas, M., and Alku, P. (2010). Perception of emotional valences and activity levels from vowel segments of continuous speech. J. Voice 1, 4. doi: 10.1016/j.jvoice.2008.04.004
Wang, Y., Du, S., and Zhan, Y. (2008). “Adaptive and optimal classification of speech emotion recognition,” in 2008 Fourth International Conference on Natural Computation, Vol. 5 (Washington: DC), 407–411. doi: 10.1109/ICNC.2008.995
Weiss, B., Burkhardt, F., and Geier, M. (2013). “Towards perceptual dimensions of speakers' voices: eliciting individual descriptions,” in Workshop on Affective Social Speech Signals (WASSS 2013) (Grenoble).
Wörtwein, T., Chollet, M., Schauerte, B., Morency, L.-P., Stiefelhagen, R., and Scherer, S. (2015). “Multimodal public speaking performance assessment,” in Proceedings of the 2015 ACM on International Conference on Multimodal Interaction (New York, NY), 43–50.
Xiph.Org Foundation (2014). Speex: A Free Codec for Free Speech. Available online at: https://gitlab.xiph.org/xiph/speex (accessed March 8, 2023).
Keywords: prosody, coded speech, emotional speech, phonetics, distant meetings, degraded speech
Citation: Niebuhr O and Siegert I (2023) A digital “flat affect”? Popular speech compression codecs and their effects on emotional prosody. Front. Commun. 8:972182. doi: 10.3389/fcomm.2023.972182
Received: 17 June 2022; Accepted: 24 February 2023;
Published: 23 March 2023.
Edited by:
Martti Vainio, University of Helsinki, FinlandReviewed by:
Hemanta Kumar Palo, Siksha O Anusandhan University, IndiaDafydd Gibbon, Bielefeld University, Germany
Copyright © 2023 Niebuhr and Siegert. This is an open-access article distributed under the terms of the Creative Commons Attribution License (CC BY). The use, distribution or reproduction in other forums is permitted, provided the original author(s) and the copyright owner(s) are credited and that the original publication in this journal is cited, in accordance with accepted academic practice. No use, distribution or reproduction is permitted which does not comply with these terms.
*Correspondence: Oliver Niebuhr, b2xuaUBzZHUuZGs=; Ingo Siegert, aW5nby5zaWVnZXJ0QG92Z3UuZGU=