
94% of researchers rate our articles as excellent or good
Learn more about the work of our research integrity team to safeguard the quality of each article we publish.
Find out more
ORIGINAL RESEARCH article
Front. Commun. , 21 June 2022
Sec. Psychology of Language
Volume 7 - 2022 | https://doi.org/10.3389/fcomm.2022.844862
This article is part of the Research Topic Fuzzy Boundaries: Ambiguity in Speech Production and Comprehension View all 12 articles
The notion of marginal contrasts and other gradient relations challenges the classification of phones as either contrastive phonemes or allophones of the same phoneme. The existence of “fuzzy” or “intermediate” contrasts has implications for language acquisition and sound change. In this research, we examine production and perception of two marginal contrasts [ɑ-ɔ] (“cot-caught”), where two original phonemes are undergoing a merger, and [ʌi-aɪ] (“writer-rider”), where a single original phoneme has arguably split into two contrastive sounds, albeit in a limited manner. Participants born and raised in Illinois were asked to provide recordings of cot-caught and writer-rider pairs embedded in sentences, followed by the target word in isolation. They then completed ABX and two-alternative forced choice two-alternative forced choice (2FC) perception tasks with stimuli produced by two native speakers from the Chicagoland area. Results showed that the [ʌi-aɪ] contrast, which has been defined as marginal in other work, is actually currently more phonetically and phonologically stable than [ɑ-ɔ] for the group of speakers that we have tested, with a more robust link between production and perception. The cot-caught merger appears to have progressed further, compared to what had previously been documented in the region. Our results and analysis suggest different sound change trajectories for phonological mergers, regarding the coupling of production and perception, as compared with phonemic splits.
The words in a language are commonly analyzed in terms of unique phonological units, which by themselves are meaningless but combine according to the constraints of the language to bring about meaning (Hockett, 1958, 1960). This system of categorizing sounds assumes a specific set of phones for each language, with phones falling into one of two categories: phoneme (contrastive) or allophone (non-contrastive). Traditionally, two sounds are considered to be contrastive if, in at least one phonological environment, the choice of phone may result in lexical minimal pairs; the choice of phone cannot be predicted from the environment alone. Conversely, if the choice between two sounds can be predicted from their phonological environment, then the two sounds are allophones. Many phonological processes appear to ignore non-contrastive features, and contrast-based theories hold that the only features that can be phonologically active are those that serve to distinguish and contrast members of the underlying phonemic inventory (see Kiparsky, 1985; Hall, 2007; Dresher, 2009).
However, numerous researchers have pointed out the existence of distinctions between phones which cannot be easily categorized as either phonemic or allophonic (e.g., Goldsmith, 1995; Ladd, 2006, 2014; Nadeu and Renwick, 2016). Hall (2013) offers a comprehensive overview of these intermediate phonological relationships and provides a typology illustrating the many different ways in which contrasts can be marginal. In the literature, such relationships have previously been referred to as semi-phonemic (e.g., Bloomfield, 1939; Crowley, 1998), quasi-phonemic (e.g., Scobbie et al., 1999; Hualde, 2005), weak contrast (e.g., Hume and Johnson, 2001; Walker, 2005; Martin and Peperkamp, 2011), partial contrast (e.g., Hume and Johnson, 2003; Chitoran and Hualde, 2007; Kager, 2008), gradient phonemicity (e.g., Boulenger et al., 2011; Ferragne et al., 2011), and marginal contrast or marginal phoneme (e.g., Vennemann, 1971; Kiparsky, 2003; Edwards and Beckman, 2008; see also Hall, 2013; Renwick et al., 2016). Even in cases of phonological neutralization, where a contrast that is neutralized in a specific environment is still considered to be present elsewhere, some researchers have interpreted neutralization as an example of a “partial contrast,” intermediate between full contrast and full allophony (Hume and Johnson, 2003; Kager, 2008). There are also cases where the distribution of a contrast in the lexicon may not be as reliably or consistently employed as expected, although the sounds themselves may be clearly distinct phonetically (Renwick and Ladd, 2016).
The notion of marginal contrasts and other gradient relationships challenges the division of phones into strict phonemic categories. The existence of marginal contrasts has implications for models of speech perception and language acquisition (both first and additional language) that rely on learner identification of contrastive phonological units and also has implications for sound change, in that speakers can acquire a distinction that is not necessarily utilized to identify words in speech.
Additionally, a speaker's ability to perceive marginal contrasts may not be directly correlated to their ability to produce that contrast and vice versa. Studies of sound changes in progress have shown that perception and production often do not proceed symmetrically, with changes occurring earlier in perception than in production (Di Paolo and Faber, 1990; Herold, 1990; Harrington et al., 2012; Kleber et al., 2012; Kuang and Cui, 2018), although some evidence has been found for a production lead when the relevant cues for production and perception are misaligned (e.g., Coetzee et al., 2018). Listeners may also still be able to perceive a contrast that they no longer produce (Labov, 1994; Hay et al., 2013; Coetzee et al., 2018; Pinget et al., 2020). Differences in perception and production in the actuation of a sound change may misalign, as perception and production may in fact be based on different targets or exemplars (Garrett and Johnson, 2013).
Speaker intuitions can also be a valuable resource for examining metalinguistic awareness of marginal contrasts. Previous research with Catalan (Nadeu and Renwick, 2016; Renwick and Nadeu, 2018) and Italian speakers (Renwick and Ladd, 2016), both populations with marginal mid vowel contrasts and the commonly used metalinguistic language to describe said contrast (“closed” and “open” mid vowels), has found speakers to be relatively accurate judges of their own productions. However, the prevalence of mismatches between production and speaker intuition involving members of a mid vowel contrast pair, relative to mismatches between pairs of mid vowels and corner vowels [i, a, u], separate the marginal mid vowel contrast on some dimension of phonological closeness.
In this article, we are concerned with the interaction between perception and production in two cases of marginal contrast in Illinois American English: [ɑ-ɔ], as in cot vs. caught (Experiment 1), and [ʌi-aɪ] as in writer vs. rider (Experiment 2). These two cases of marginal contrast differ in their diachronic provenance. The former represents an ongoing merger of two phonemes. The latter, instead, is a case of phonemic split, as it has arguably resulted from the phonological recategorization of allophones as (quasi-)contrastive units. This phenomenon is often known as Canadian raising. In both cases, we are interested in determining to what extent the degree to which the two categories are separated in individual speakers' productions determines their behavior in perception, as well as the relation of speakers' intuitions about contrastiveness to their own production and perception. Although there is a substantial literature on each of the two vowel phenomena we examine here, we are not aware of previous research that has compared the production-perception link in both a merger in progress and a split in progress for the same group of speakers.
One example of a contrast that could be considered marginal in some varieties of present-day American English is the [ɑ-ɔ] (“cot-caught”) low back vowel pair. The merger of these two phonemes was first attested in the US in the 1930s (Kurath, 1939) in parts of western Pennsylvania and eastern New England. Labov et al. (2006) later documented the distribution of the cot-caught merger, showing that the merger was highly advanced or completed in western Pennsylvania, and progressing in eastern New England and the western half of the United States. In contrast, the Inland North, the Mid-Atlantic, and the South were identified as regions that showed resistance to the low back merger. When the data for the Atlas of North American English (Labov et al., 2006) were collected, results of minimal pair perception tests for speakers in the Inland North (including Chicagoland, part of the area under study) showed no trace of a merger, with participants universally responding that the presented minimal pairs were different from one another. The maintenance of the /ɑ/ vs. /ɔ/ contrast was attributed to the fronting of /ɑ/, part of the Northern Cities Chain Shift (Labov, 1994; Clopper et al., 2005), making it rather distinct from /ɔ/. The low back merger was also found to be most advanced in syllables closed by nasal consonants and most conservative before velar /k/.
Even in varieties where /ɑ/ and /ɔ/ are clearly contrastive phonemes, the distribution of the two phones is not entirely free, and the presence or lack of a contrast is sometimes predictable from context. As Labov et al. (2006: 57) explain, historically, /ɑ/ descends from Middle English short /o/, with the addition of some /o/ words directly borrowed from French and some words where /a/ was rounded after /w/ (watch, want, wander, etc.). The resulting phone occurs before all but two consonants, /v/ and /ʒ/, in American English. In contrast, /ɔ/ has a more limited distribution. This vowel is, for the most part, a direct continuation of the Middle English diphthong /aw/ (which had a number of Old English and Old French sources). In addition, a number of words that had Middle English /o/ have been transferred to the /ɔ/ class, e.g., dog, long, loss (before /g/, /ŋ/, and voiceless fricatives, but without affecting all lexical items with these following contexts). Presently, for some speakers in Illinois, a contrast is attested in the phonological contexts shown in Table 1, where both phones occur (see also Labov et al., 2006: 57).
In the contexts in Table 2, on the other hand, the contrast appears to have been neutralized for all speakers in the Midwest dialect that we explore here. Labov et al. (2006: 57), describe a slightly different distribution, including a possible contrast before /g/, as in log vs. dog, that does not seem to exist in the geographical area under study. These authors do in fact report variation before /g/.
Even for contexts where a robust contrast has been reported, e.g., before /l/, the realization of the contrast may be less certain given the lack of representative words or given gaps in the lexicon. The merger between the two vowels appears to proceed in gradient fashion, occurring first before nasal consonants (Labov et al., 2006).
Based on informal observation, we suspect that the merger is currently more advanced in our target population (young speakers from northern and central Illinois) than some decades ago. We expect to find three or even four types of speakers: (a) speakers with a clear contrast in production and perception, (b) speakers who have merged the two phonemes in production and do not perceive them as different vowels, (c) as in other cases of mergers in progress, we also expect to find some speakers who have a marginal contrast in production, but cannot reliably identify or discriminate the two historical phonemes; that is, a merger in perception may precede a merger in production (Labov, 1994, 2011). Finally, some recent research indicates that in some mergers in progress there are listeners who can still perceive a contrast that they no longer produce (Hay et al., 2013; Coetzee et al., 2018; Pinget et al., 2020); thus, we may also expect to find a group (d) of speakers who do not produce the contrast but can reliably perceive it. Depending on the types of speakers found, these groups may help elucidate potentially differing patterns regarding the progression of the cot-caught merger.
Thirty-six participants were recruited among the undergraduate student population at an Illinois university to participate in this study. Of these participants, 11 did not complete all tasks and were excluded from analysis. Since the focus of this study is variation within northern and central Illinois, an additional 5 participants were excluded as they reported being born in a different country or state. The remaining 20 participants (14 females, 6 males) all reported being born and raised in Illinois. Of these, 14 are from Chicago and its suburbs, 4 from Central Illinois, and 2 from Illinois near the St. Louis area. We decided not to exclude the two St. Louis-area speakers1 because this area has been shown to participate in some of the vowel changes that are found in Chicago, such as the ones under study (Labov, 2007). For the place where each participant was raised, see Figure 1 (in Section Discussion). Their ages ranged from 18 to 25. Participants were volunteers or received extra credit for their participation in an undergraduate linguistics course. These subjects participated in one production task and two perception tasks.
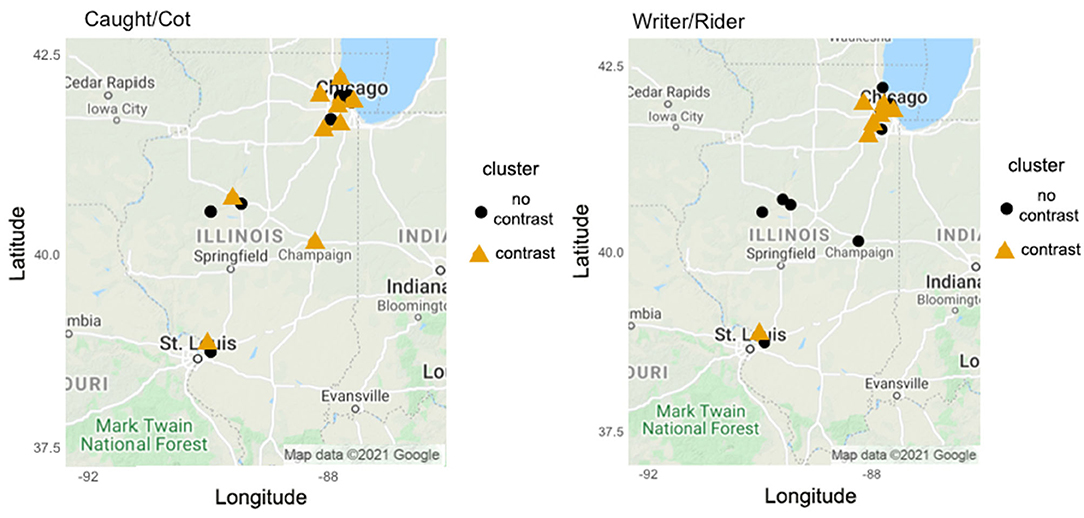
Figure 1. Participant locations by production cluster for cot-caught (left) and writer-rider (right). Participant locations by production cluster (black circle: no contrast [low Pillai score]; orange triangle: contrast [high Pillai score]; Google, n.d.).
For the production task, the goal was to create balanced lists of 20 pairs for each contrast under study. For the cot-caught contrast, the stimuli consisted of 13 monosyllabic minimal pairs with an alveolar coda (e.g., caught vs. cot), 3 monosyllabic near-minimal pairs (e.g., laud vs. lot), and 4 monosyllabic non-minimal pairs to complete the set of 20. Stimuli for our Experiment 2 (20 pairs) were also presented together. Filler items consisted of 10 pairs distinguished by their codas (e.g., bet vs. bed) and 10 homophone pairs (e.g., flower vs. flour). This resulted in 60 total pairs for a total of 120 productions. The stimuli for production are shown in Table 3.
For our perception study, our goal was to create balanced lists of 10 minimal pairs. The 10 minimal pairs (20 words) for the cot-caught contrast were all monosyllabic with coda consonants /t, d, n, k/. The stimuli used for the perception tasks are also shown in Table 3. Fillers in the perception tasks included 10 minimal pairs (20 words) distinguished by their codas (e.g., mat vs. mad, mate vs. made) and 4 homophone pairs (8 words) (e.g., metal vs. medal) as distractors. Tokens created for our Experiment 2 (9 minimal pairs, 18 words) on Canadian raising (see Experiment 2) also were presented together. Each word was presented two times, resulting in a total of 132 tokens.
The stimuli were produced by two native speakers, one female (Speaker F) and one male (Speaker M) from the Chicagoland area. These two model speakers were recruited to produce the stimuli because they reported producing a contrast between both cot-caught words and writer-rider words, and they both grew up in Illinois, like the participants in our experiments. The stimuli were recorded in a soundproof booth, using a Marantz PDM 750 solid state recorder and an AKG C5C20 head-mounted microphone at a sampling rate of 44.1 kHz. Based on formant values, all target stimuli included in the perception task showed a difference in vowel quality between cot-words and caught-words, although this difference was not always of the same magnitude or produced in the same manner. Figure 2 shows average time-normalized formant trajectories for the stimuli produced by each of the two model speakers. Note that cot-words have higher values for both formants than caught-words, indicating a lower and less retracted articulation for [ɑ] than for [ɔ].
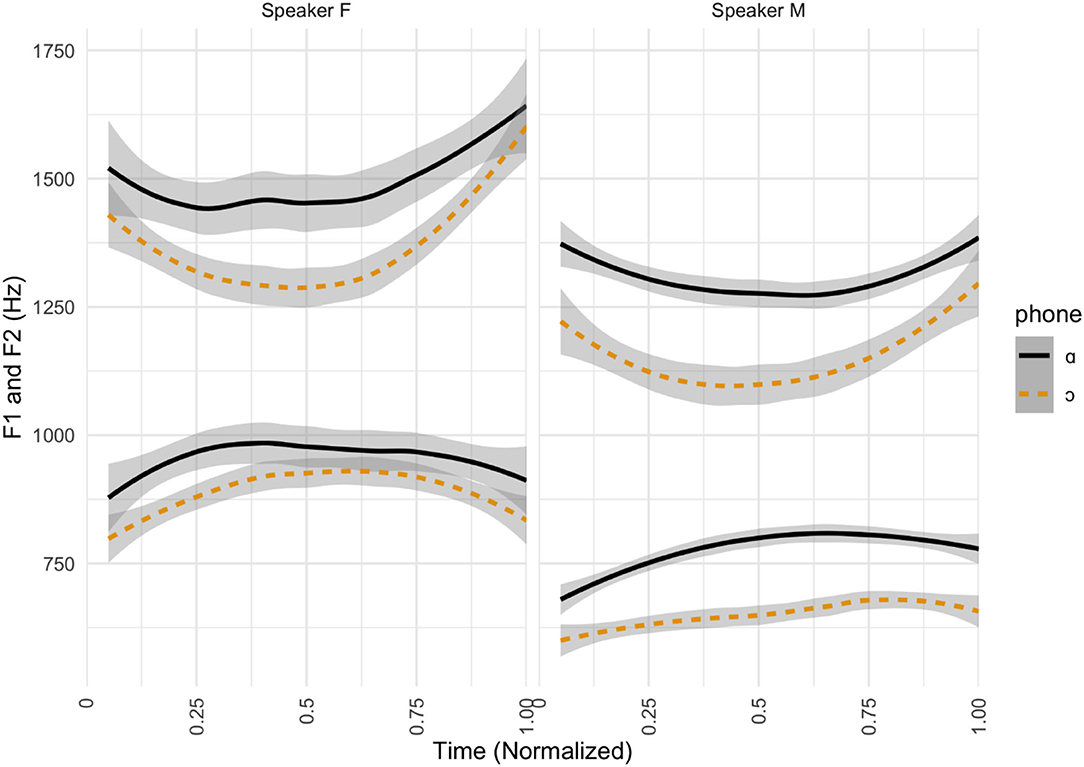
Figure 2. Formant contours for cot-caught stimuli. Time-normalized formant contours (F1 and F2) in Hz for the two speakers providing perception stimuli, separated by target phone. Formants for cot-words are shown in solid black lines and formants for caught-words in dashed orange lines.
Participants first completed a background questionnaire to provide demographic information and confirm that they had been born and raised in Illinois.
For the first experimental task, participants were asked to provide recordings of 120 target words (20 caught-cot pairs, 20 writer-rider pairs, and 20 filler pairs). Because of the COVID-19 pandemic situation, conducting the experiment in a phonetics laboratory was not feasible at that time. Instead, participants were asked to record themselves in a quiet room, using their phones2 or laptops. The recording material was presented via PowerPoint slides, and a copy of the PowerPoint slides was shared with each participant. Each target word was embedded in a sentence (e.g., “The word ____ in English [means/refers to/is…]”) which was presented on one slide, followed by the same target word in isolation on the next slide. The tokens were presented in pseudo-random order such that each presented token was not followed by a member of a potential minimal pair. The recording session was divided into four blocks, and participants were asked to submit their recordings at the completion of each block. The first production of each block consisted of a filler sentence and word.
Following production, participants completed the first perception task: an ABX task administered online via Qualtrics. The stimuli consisted of target words in isolation, with an interstimulus interval of 500ms. Participants heard a presented ABX series and were asked to select whether X was the same word as the first word they heard (A) or the second (B) by clicking on the number “1” or “2” on the screen. Upon making a selection, the next ABX series was automatically presented. Tokens produced by Speaker F were used for A and B of the ABX task, and tokens produced by Speaker M were used for X. The use of two speaker voices requires some level of abstraction by the participant, particularly as our speakers differ in sex. The stimuli were presented in pseudo-random order such that no two types of the same category (cot-caught, writer-rider, coda-distinguished filler, homophone filler) were presented sequentially; the presentation of one category of stimuli was always followed by a different category, e.g., rider-writer (rider-writer pair) followed by mist-missed (filler-pair) followed by cawed-cod (cot-caught pair), followed by mate-made (coda-distinguished pair). There was a total of 132 items presented, of which 40 tokens (20 pairs) were representative of the cot-caught contrast. Tokens created for our Experiment 2 on Canadian raising (see Experiment 2) also were presented together.
Participants then completed the second perception task: a two-alternative forced choice (2FC) word identification task administered online via Qualtrics. The stimuli presented were the same as in the ABX task, but participants were instead asked to identify an auditorily presented word by clicking on one of two words presented on the screen. For example, they would hear the word cot and either click on the presented text < cot> or < caught>. Upon making a selection, the task automatically moved to the next 2FC item.
Finally, participants completed an exit survey which probed their phonological intuitions of the contrast as spoken by themselves (e.g., “Do you think you pronounce cot and caught in the same way?”), their parents or guardians, and by their social circles. They were also asked to describe any differences in their pronunciation [A similar methodology was used in Renwick and Nadeu (2018)].
The target words were first force-aligned with the Montreal Forced Aligner (McAuliffe et al., 2017), then corrected by hand in Praat (Boersma and Weenink, 2021). Waveform and spectrogram information was used for manual corrections. When the preceding consonant was an obstruent, the left boundary of the vowel was placed at the first zero uprising after the onset of glottal vibration, when formant structure was visible. When the preceding consonant was a fricative, the left vowel boundary was similarly placed at the first zero uprising when formant structure was visible, after the offset of high energy frication noise. When the preceding consonant was a sonorant, changes in formant structure and intensity were used to place segmental boundaries. The right boundary of the vowel was similarly determined by decreases in intensity and changes in formant structure. The vowels were manually assigned labels that would correspond to the presence, rather than merger, of a phonological contrast. Following segmentation, F1 and F2 values were automatically extracted at the 50% duration of the vowel.
As a measure of distance between vowel distributions, we calculated Pillai scores for each vowel pair at the 50% duration of the vowel for each participant (Nycz and Hall-Lew, 2013; Jibson, 2021). A higher Pillai score, closer to 1, results from greater distance and less overlap between vowel pairs, indicating a stronger contrast. A lower Pillai score, closer to 0, results from greater overlap, indicating a weaker contrast or no contrast at all. The Pillai scores were then submitted to a k-means cluster analysis using the function kmeans from the stats package in R (R Core Team, 2019). The analysis was run for 2-4 groups. We decided to use cluster analysis as opposed to determining a threshold for the classification of participants as having one phoneme or two (as in, e.g., Labov et al., 2006), precisely because we want to allow for the possibility of having intermediate situations between merger or not merger and split or not split.
Since we are interested in determining the relation between production and perception, we ran correlations (cor.test from stats in R) between Pillai scores and perception accuracy results. Linear mixed effects regressions were run on accuracy rates and formant values with the function lmer in the package lme4 (Bates et al., 2015) and p-values were obtained with the emmeans package (Lenth, 2022). In addition, we considered the extent of participants' phonological intuitions concerning the existence of a contrast in their speech or lack thereof, and how this corresponded to their performance in our two perception tasks.
Figure 3 displays average F1 and F2 values over normalized time for words belonging to the traditional /ɑ/ class (cot) and words belonging to the /ɔ/ class (caught). Each participant is shown on their own plot, and the plots are organized from lowest Pillai score (Participant 003) to highest (Participant 026). Speakers ranged from no discernible contrast in Participant 003 (Pillai score = 0.02) to a very clear contrast in Participant 026 (Pillai score = 0.89).
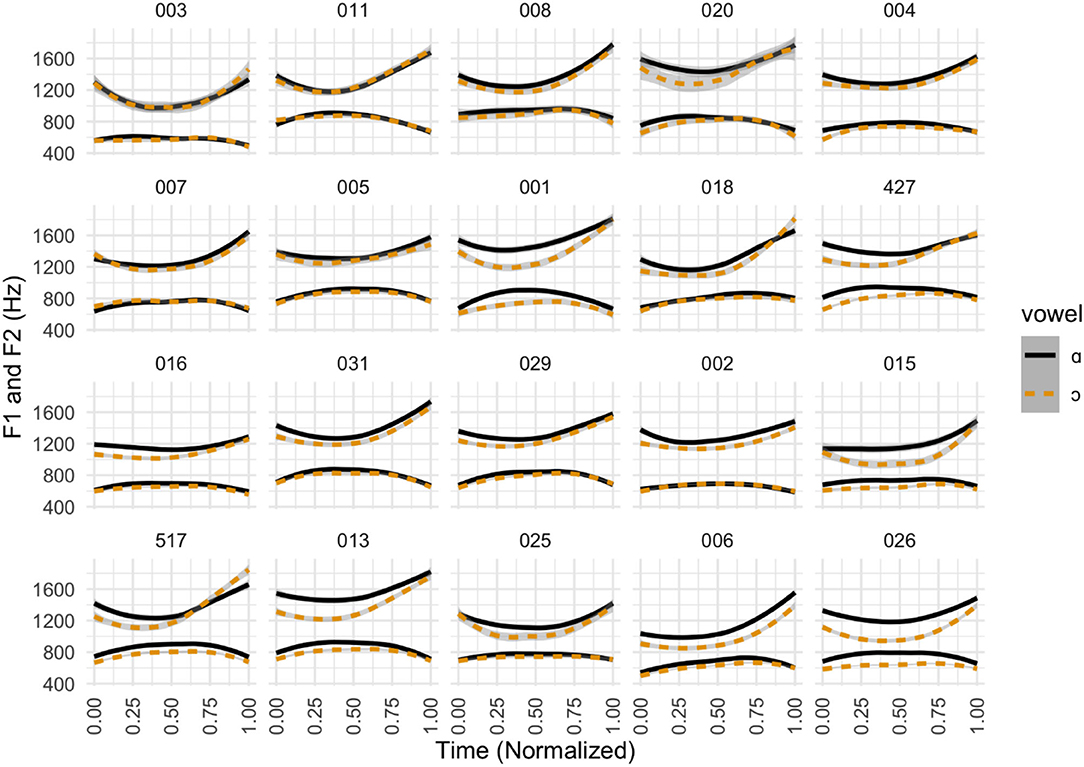
Figure 3. Formant contours for cot-caught by participant. Individual time-normalized formant contours (F1 and F2) in Hz, separated by target phone. Participants are organized from lowest to highest Pillai score at 50% vowel duration.
Figure 4 shows the vowel plots for Participants 003 (lowest Pillai score = 0.02) and 026 (highest Pillai score = 0.89), showing an example of the difference in degree of overlap for speakers with the merger and with the contrast. The vowel plot for Participant 003 shows a clear overlap between cot-type words and caught-type words. In comparison, the two types of vowels are clearly distinct for Participant 026.
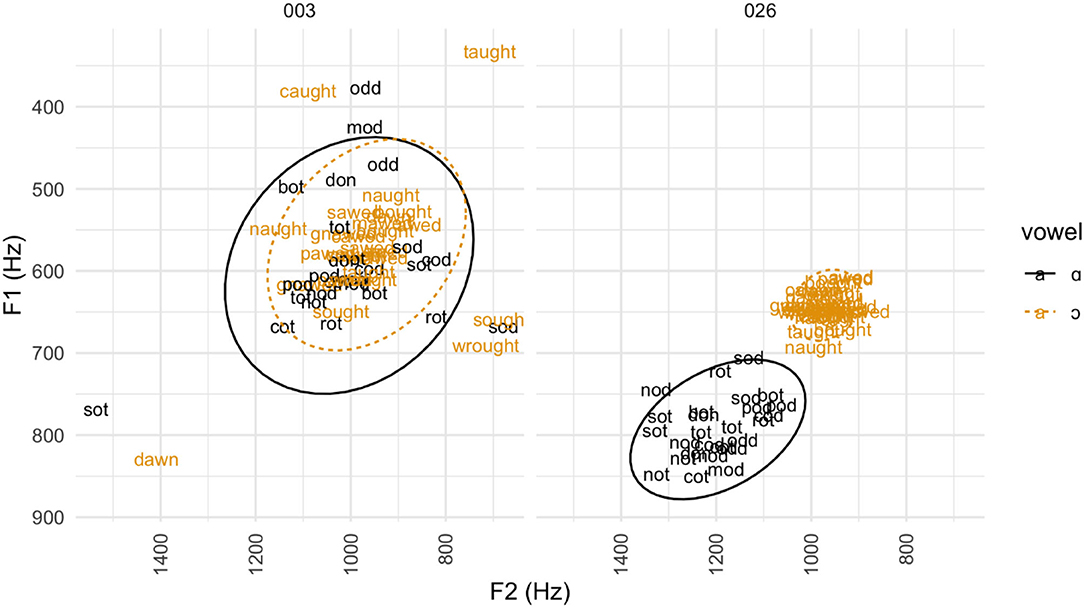
Figure 4. Vowel plot for cot-caught productions with low vs. high Pillai scores. Vowel plot of individual tokens representative of the cot-caught contrast for Participant 003 (lowest Pillai score) and Participant 026 (highest Pillai score). Cot-words are graphed in black and caught-words in orange. Ovals indicate the 95% confidence interval (2 standard deviations) for each vowel.
Participants were clustered first based on production alone, using cluster analysis specified for 2 to 4 clusters. Based on the total within-cluster sum of squares, the best clustering resulted in 2 groups according to their productions, which we may think of as mergers and non-mergers. The merger group includes 13 participants with Pillai scores ranging from 0.02 to 0.30, and the non-merger group includes 7 participants with Pillai scores ranging from 0.35 to 0.89.
Participants were also independently clustered based on average perception accuracy between ABX and 2FC. Participants did not fall into the same clusters for production as for perception, so the two clustering analyses were visually combined to show inconsistencies between mergers in perception and production. The resulting groups are shown in Figure 5, along with the correlation between production of [ɑ-ɔ] and each perception task.
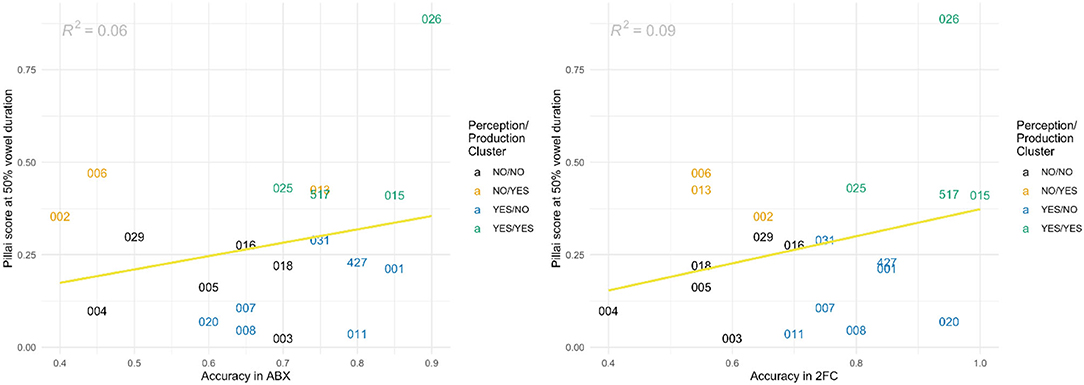
Figure 5. Correlations between Pillai scores at 50% vowel duration and ABX perception accuracy (left) or 2FC perception accuracy (right) for cot-caught. Participants are clustered based on perception and production independently, with the two clustering analyses visually combined to show 4 groups, where the first NO or YES of each label signifies the contrast in perception and the second NO or YES signifies a contrast in production. NO/NO (participant clustered in the group with no contrast based on Pillai scores for both production and perception) is shown in black. NO/YES (participant in no-contrast group in perception, but in contrast group in production) is in orange. YES/NO (participant in contrast group in perception, but in no-contrast group in production) is in blue and YES/YES (contrast in both production and perception) is in green.
As can be seen in Figure 5, participants fall into one of four possible groups according to Pillai-score-based clustering: (1) NO contrast in perception and NO contrast in production (black in Figure 5), (2) NO contrast in perception, YES contrast in production (orange), (3) YES contrast in perception, NO contrast in production (blue), and (4) YES contrast in both perception and production (green). For speakers with the contrast in both production and perception, formant values for [ɑ] and [ɔ] were significantly different for F1 (p < 0.05) and F2 (p < 0.001). Those without the contrast showed no significant differences among formant values. Perception accuracy rates between the NO/NO and YES/YES groups were significantly different for the 2FC task (p < 0.05) but not for ABX (p = 0.23).
Participants 002 and 006 are examples of speakers in group 2, who showed a contrast in their production (Pillai scores = 0.35 and 0.47), but their perception accuracy was around chance (40-65%). In the opposite direction, Participants 011 and 031 are examples of speakers in group 3, those who could perceive the contrast with accuracy rates ranging from 70 to 80%, but whose productions had low Pillai scores (0.04 and 0.29) and were therefore considered to be merged in production. Group 3 in particular was not specifically hypothesized to exist, based on the assumption that vowel mergers in perception tend to precede merger in production, yet it comprises 35% of our participants. These findings do align, however, with recent research regarding perception and production inconsistencies (e.g., Hay et al., 2013; Coetzee et al., 2018; Pinget et al., 2020).
Overall, the correlations between perception and production were very weak (R2 = 0.06 between production and ABX, R2 = 0.09 between production and 2FC). Perception accuracy for individuals clustered as non-mergers was 73% (averaged between ABX and 2FC), whereas average accuracy for those clustered as mergers was 69%; perception accuracy was thus similar regardless of their clustered status as mergers or non-mergers.
Based on their responses to the exit survey, participants who were clustered as non-mergers in both perception and production appeared to be metalinguistically aware of the contrast. For those who reported having a contrast (n = 12), 9 of them also showed the contrast in production. The other 3 participants who self-reported a distinction were instead clustered as showing a merger in their production. Fewer participants reported having merged productions (n = 8), and their productions were split between the merger group and the non-merger group. This data is visualized in the violin plots as seen in Figure 6, which show participants' self-reported distinctions compared with their Pillai scores at 50% vowel duration.
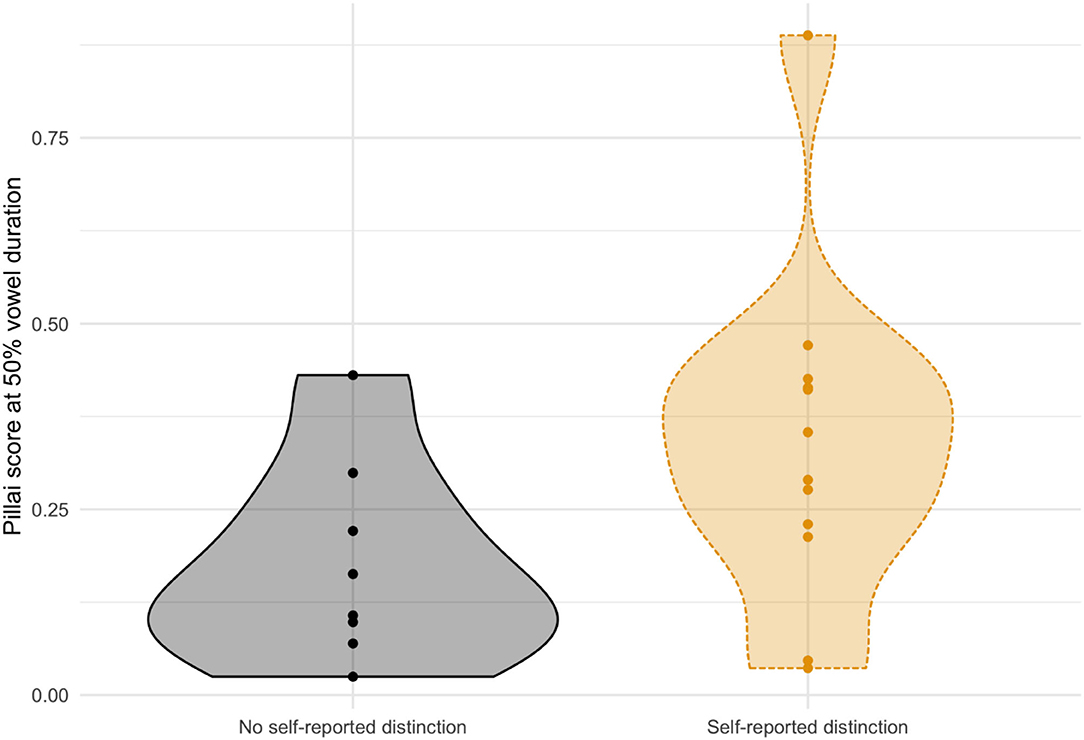
Figure 6. Pillai scores by self-reported contrast for cot-caught. Pillai scores for caught-cot by participant, separated by self-reported distinction of the contrast.
As for the correlation between participants' phonological intuitions and their performance in the perception tasks, participants who reported making a contrast between cot and caught outperformed participants who reported not making a distinction, as can be seen in Figure 7. This is an expected result. Accuracy was somewhat higher for both groups of participants in the forced-choice identification task.
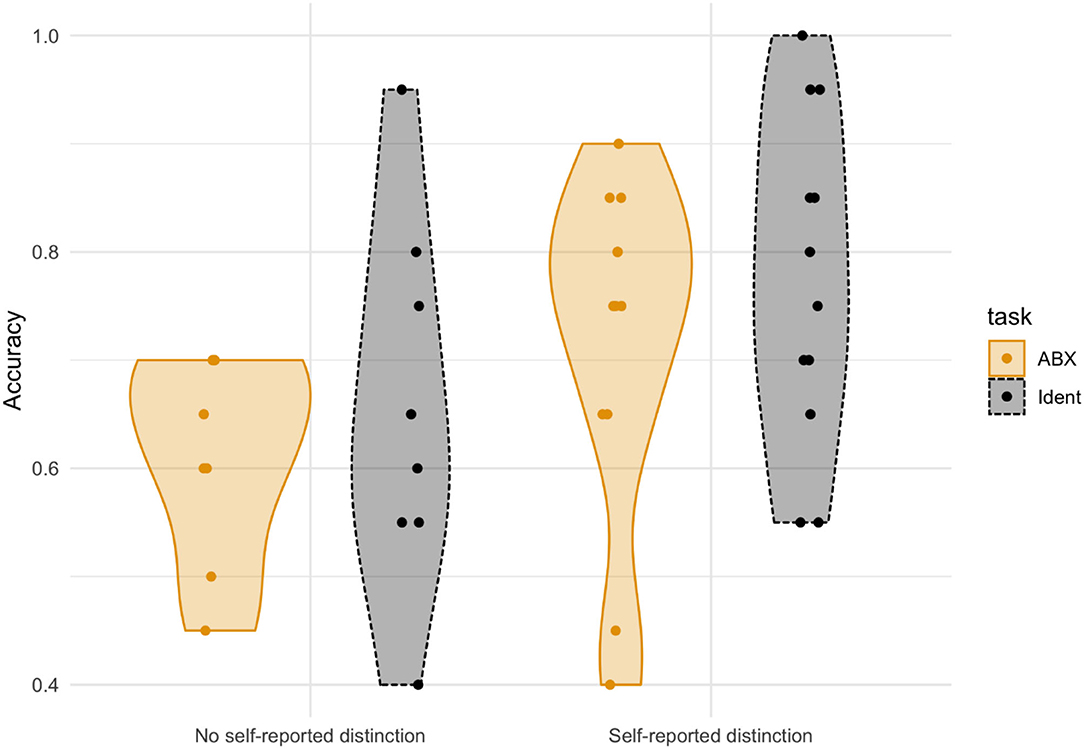
Figure 7. Accuracy in perception by self-reported contrast for cot-caught. Accuracy in the two perception tasks (ABX and 2FC Identification), separated by self-reported distinction of caught-cot.
Furthermore, participants who reported making a contrast in production also described differences in vowel pronunciation on the exit survey, with a number of participants transcribing [ɑ] in cot as < ah> and [ɔ] in caught as < aw> (e.g. “cot is more ‘KAHt' caught is more ‘CAWt”' and “In the word cot, the ‘o' makes more of an ‘ah' sound rather than the ‘aw' sound found in caught”). Our results suggest that speakers who believe they have a contrast do in fact produce it. However, their perceptual discrimination abilities, based on clustering, do not always mirror the contrast as found in production, again based on clustering. The resulting four groups from our clustering analyses also show different patterns of perception and production as they relate to a merger in progress. Out of our 20 speakers only 12 reported having a phonological contrast in their own speech, and less than half of them (3) fell within the non-merger clusters in both production (high-Pillai-score cluster) and perception (average ABX and 2FC accuracy). The historical phonemic contrast between /ɑ/ and /ɔ/ now thus has the status of a marginal or fuzzy contrast for this group of speakers, with most speakers showing variable behavior in perception and production that is inconsistent with the existence of a robust contrast between two phonemes.
The other marginal contrast that we are concerned with is the [ʌi-aɪ] (“writer-rider”) split, a phenomenon traditionally known as Canadian raising (Joos, 1942; Chambers, 1973, 1989, 2006). Historically, Canadian raising is an instance of an (incomplete) phonemic split, where a phonemic unit develops distinct allophones, a process opposite of the merger between [ɑ] and [ɔ]. The basic distribution of the Canadian raising diphthongs is that [ʌi] occurs before voiceless consonants (e.g., write, sight) and [aɪ] appears before voiced consonants and word-finally (e.g., ride, buy). However, this complementary distribution is rendered opaque by the neutralization of /t/ and /d/ as a flap before an unstressed vowel (Herd et al., 2010), leading to minimal pairs differentiated only by the quality of the diphthong, as in writer [ɹʌiɾɚ] vs. rider [ɹaɪɾɚ]. Before a flapped alveolar stop, phonological raising is purported to be triggered not by the phonetic realization of the stop, but rather by its underlying phonological specification (see also Mielke et al., 2003; Bermúdez-Otero, 2004; Idsardi, 2006; Pater, 2014). Additional instances of unconditional raising in monomorphic words have also been reported, e.g., tiger, spider (Vance, 1987; Dailey-O'Cain, 1997; Graham, 2019)3. Raising of the nucleus has been also reported before syllabic /r/, as in fire [fʌiɚ]; but in this phonological context as well, it is possible to have minimal pairs, as in hire [hʌiɚ] vs. higher [haıɚ], where the second member of the pair retains the quality of the word-final diphthong in the underived form high.
Despite its name, the [ʌi-aɪ] split has been documented in various regions of the US. In fact, for East Virginia, the phenomenon was described as early as the first decades of the twentieth century (Shewmake, 1925, 1943). The split has since been documented in areas such as Minnesota (Vance, 1987), Rochester, New York (Vance, 1987), Michigan (Milroy, 1996; Dailey-O'Cain, 1997), Philadelphia, Pennsylvania (Fruehwald, 2008, 2016), and Fort Wayne, Indiana (Davis et al., 2020). Progression of the split is at perhaps a less advanced stage in the Fort Wayne area, with Davis and colleagues finding evidence for an incipient phase of phonetic conditioning. Whereas in Canadian English both diphthongs /ai/ and /au/ undergo raising of the nucleus before a voiceless consonant (e.g., about vs loud), in many US varieties only /ai/ appears to be affected. Davis et al. (2020) have proposed the term “American raising” to refer to the phenomenon in varieties where the relevant effects are found for /ai/ but not for /au/.
Within northern and central Illinois, the area under study, the [ʌi-aɪ] contrast has been reported for the Chicago area. Kilbury (1983) provides minimal and near-minimal pairs from his own Chicago variety, noting that speakers in his area differed in their intuitions regarding the pronunciation of writer-rider pairs. This idea found recent support from Hualde et al. (2021), whose formant trajectory analysis showed notable interspeaker variation in degree of production of this contrast. Research on perception of the [ʌi-aɪ] contrast has also found that speakers of this variety also vary in their ability to differentiate minimal pairs in perception. The Chicago-area speakers tested in Hualde et al. (2017) were able to discriminate the sounds [ʌi-aɪ], but not at ceiling accuracy, unlike other contrasts tested in the same experiment, indicating that the [ʌi-aɪ] contrast is somewhat less robust. Though in Hualde et al. (2017) both production and perception were tested, the correlation between production and perception for individual speakers was not examined. Strickler (2019) analyzed the production and perception of speakers from Fort Wayne, Indiana, an area where Canadian raising appears to be spreading throughout the community. She found that speakers seemed unable to perceive a more advanced form of the split than the forms they produced.
Here we focus on the speech of young native English speakers from northern and central Illinois, a geographical area where both the [ɑ-ɔ] and the [ʌi-aɪ] contrasts appear to have different degrees of “robustness” for different speakers. The question that we wish to ask is how a speaker's ability to perceive marginal contrasts relates to the robustness of that contrast in their own production. We are also interested in learning to what extent speakers' intuitions regarding phonological contrasts correlate with their own performance in perception and production.
The same speakers participated in this experiment and in Experiment 1, as both experiments were run together. The stimuli for the production task, presented together with the other stimuli described in Experiment 1, consisted of 7 bisyllabic minimal pairs, 7 near-minimal pairs (e.g., bite vs. bide), and 6 non-minimal pairs (12 monosyllabic words).
The stimuli for the two perception tasks were produced by the same two model speakers who produced stimuli for the cot-caught distinction. Due to the environment conditioning the writer-rider contrast, minimal pairs are infrequent, and a maximum possibility of 8 bisyllabic pairs and 1 trisyllabic pair were compiled for the perception task. Of the 132 total items presented, 36 tokens (18 pairs) were representative of the writer-rider contrast. The procedure was described in Experiment 1, and the full list of stimuli for production and perception are shown in Table 3.
Figure 8 shows time-normalized average formant values for Speaker F and Speaker M separately. These contours show that both speakers have clearly distinct productions of the contrast, with Speaker F differentiating the sounds in frontness (F2) early on and height (F1) toward the middle and end of the diphthong. Speaker M also has distinct vowels, but to a less drastic degree, and differentiates using F1 early on in production and F2 later.
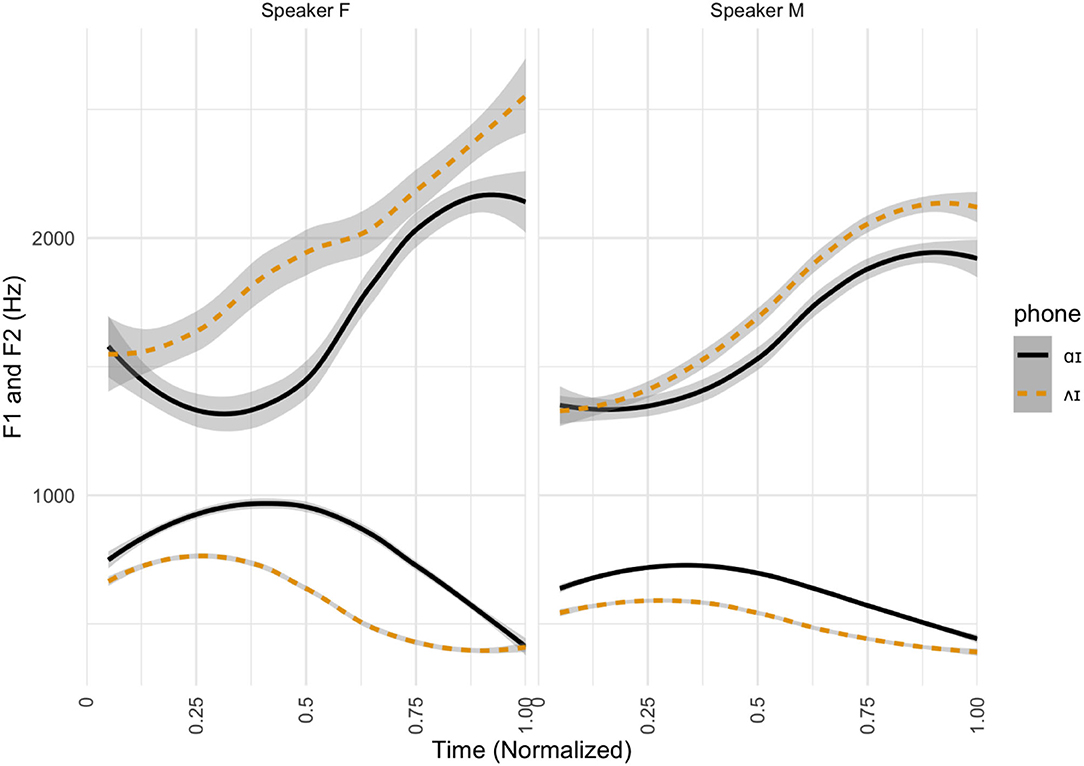
Figure 8. Formant contours for writer-rider stimuli. Time-normalized formant contours (F1 and F2) in Hz for the two speakers providing perception stimuli, separated by target phone. Formants for rider-words are shown in black and formants for writer-words in orange.
The acoustic analysis was also performed as in Experiment 1, but rather than taking formant measurements at 50% of the duration of the vowel, these measurements were taken at 30 and 80% of the duration. The use of multiple timepoints for diphthong analysis captures differences in the nucleus and the offglide (Hillenbrand, 2013; Hualde et al., 2017). While some have proposed 20 and 80% as optimal timepoints, our data suggest that 30% is a preferred first measure. As noted by others, this timepoint is well within the nucleus but avoids coarticulatory effects (Berkson et al., 2017). Two Pillai scores were calculated for each speaker using these measurements, which were then used for clustering. As with Experiment 1, this process resulted in two groups which can be interpreted as speakers with the contrast in production and speakers without. A similar clustering analysis was also performed for the perception data.
As in Experiment 1, we present the results of our production task before considering the perception results and the correlations between perception and production.
In Figure 9, we show average time-normalized F1 and F2 tracings for each participant. From the upper left to the bottom right, participants are organized by Pillai score (low to high). Pillai scores at 30 and 80% of the duration of the diphthong turned out to be highly correlated (R2 = 0.90), so this figure orders plots based on the 30% Pillai scores alone, and the 80% scores are not shown.
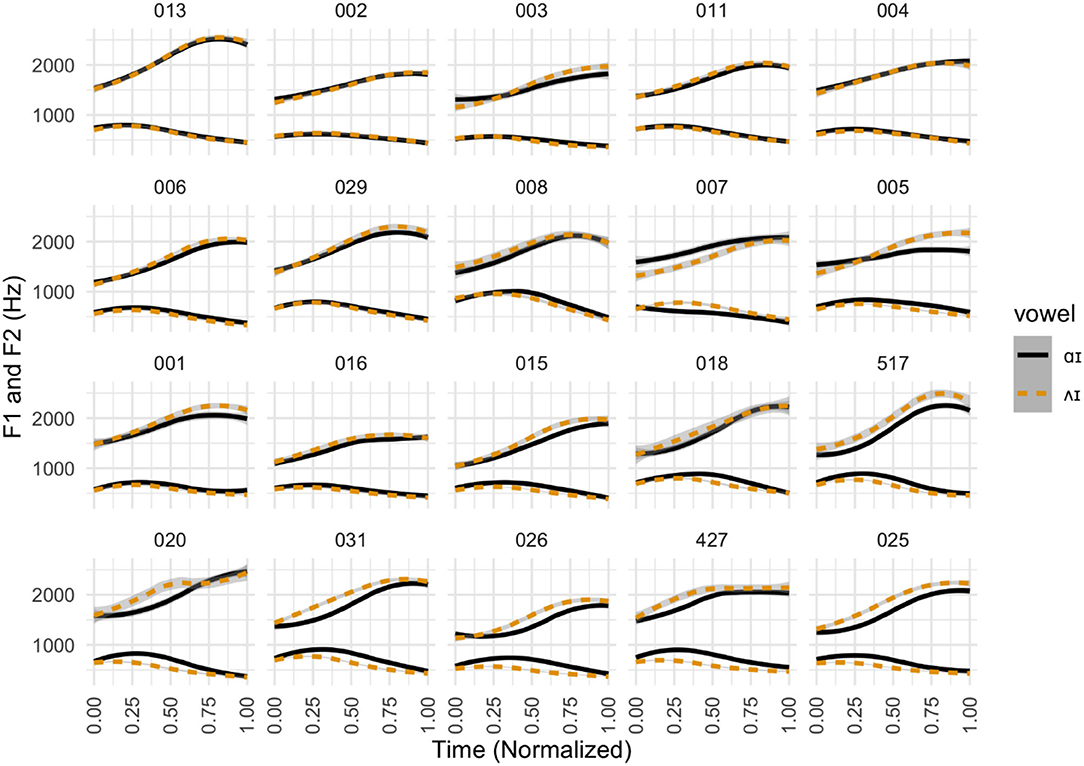
Figure 9. Formant contours for writer-rider by participant. Individual time-normalized formant contours (F1 and F2) in Hz, separated by target phone. Speakers are organized from lowest to highest Pillai score at 30% duration of the vowel.
As can be observed, some participants such as 025 (Pillai score = 0.93 at 30% and 0.83 at 80%) and 031 (Pillai score = 0.83 at 30% and 0.76 at 80%) have hardly any overlap in formant trajectories between writer-type words (in dashed orange) and rider-type words (solid black). Other speakers show near-total overlap, including 002 (Pillai score = 0.02 at 30% and 0.03 at 80%) and 004 (Pillai score = 0.13 at 30% and 0.07 at 80%).
The use of Pillai scores takes into account both distance between vowel clusters and overlap between them. Figure 10 shows the vowel plots for Participants 013 and 025, showing an example of the drastic difference in degree of overlap for speakers without a contrast (013) and for those with the split (025).
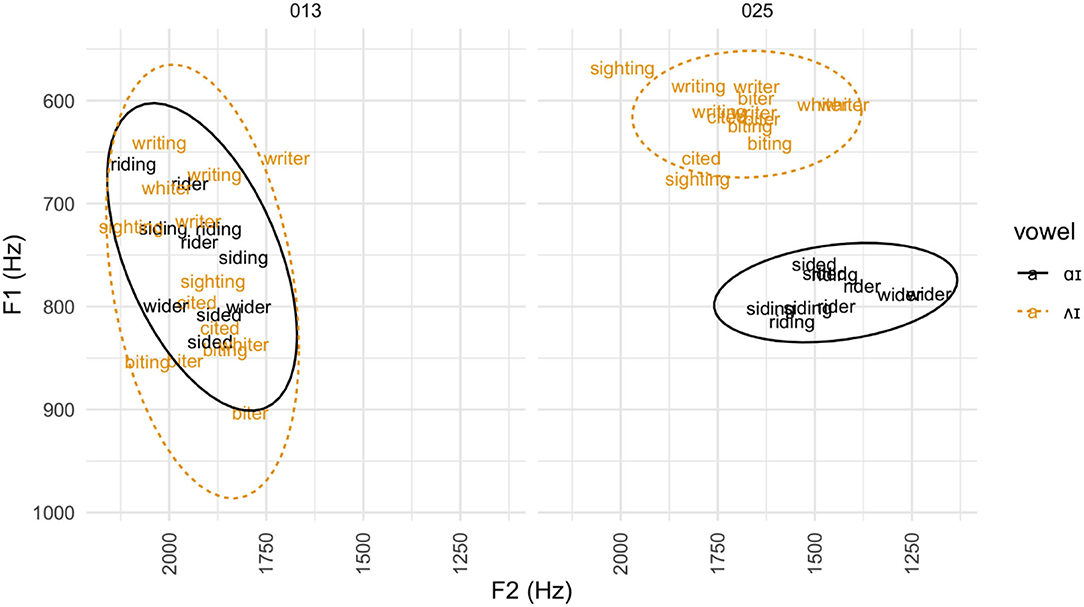
Figure 10. Vowel plot for writer-rider productions with low vs. high Pillai scores. Individual tokens of words representative of the writer-rider contrast for Participant 013 (lowest Pillai score) and Participant 025 (highest Pillai score). Ovals indicate 95% confidence intervals for each vowel.
The vowel plot for Participant 013 shows a clear overlap between writer-type words and rider-type words. The two types of vowels are clearly distinct for Participant 025, as there is notable distance between the production clouds and no overlap.
Results showing the correlation between Pillai scores (at 30% and 80% vowel duration) and perception accuracy (for ABX and 2FC) are shown in Figure 11.
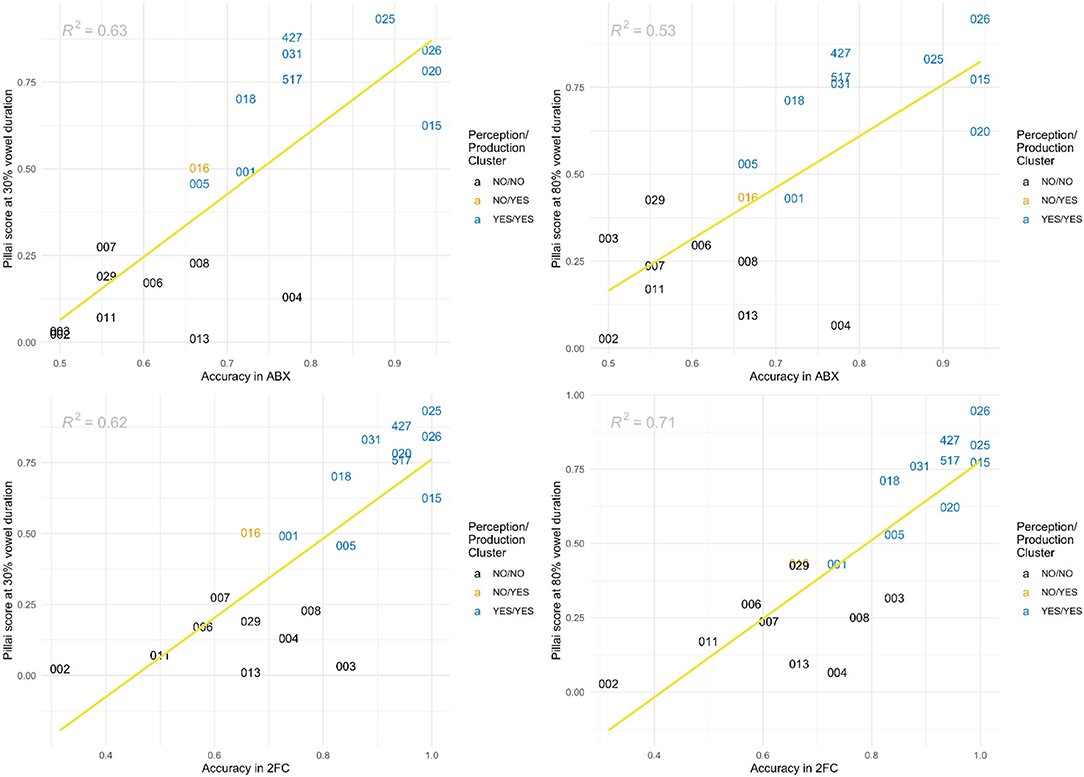
Figure 11. Correlations between ABX perception accuracy and Pillai scores at 30% vowel duration (top left) and 80% vowel duration (top right) and between 2FC perception accuracy and Pillai scores at 30% vowel duration (bottom left) and 80% vowel duration (bottom right) for writer-rider. Participants are clustered based on perception and production independently, with the two clustering analyses visually combined to show 3 groups, where the first NO or YES of each label signifies the contrast in perception and the second signifies a contrast in production. NO/NO (participant clustered in the group with no contrast based on Pillai scores for both perception and production) is shown in black. NO/YES (participant in no-contrast group in perception, but in contrast group in production) is in orange. YES/YES (contrast in both perception and production) is in blue.
Participants were first clustered based on production alone, resulting in a no-contrast group of 9 participants with Pillai scores 0.01 to 0.42, and a split group of 11 participants with Pillai scores ranging from 0.43 to 0.93. Participants were also independently clustered based on average perception accuracy between ABX and 2FC. As in Experiment 1, we cross-classified participants considering their clustering in production and their clustering in perception, which would potentially yield up to four groups. However, in contrast with cot-caught, the combination of both independent clustering procedures resulted in almost the same clusters in production and perception, with only one single participant for which production and perception-based clustering do not match. We therefore have a group of 9 participants with low accuracy in perception and low Pillai scores in production, consistent with lack of a phonological contrast (in black in Figure 11), a second group of 10 participants with high accuracy in perception and high Pillai scores in production (in blue) and a single participant with low accuracy in perception but a high Pillai score in production (in orange).
For speakers with the contrast in both production and perception, formant values for [ʌi] and [aɪ] were significantly different for F1 and F2 at 30% and at 80% (p < 0.01). Those without the contrast showed no significant differences among formant values for the two diphthongs. Perception accuracy rates between the NO/NO and YES/YES groups were significantly different for both the ABX (p < 0.01) and 2FC tasks (p < 0.001).
Our resulting clusters for writer-rider show that perception and production pattern very closely together, and that speakers with inconsistencies between perception and production are rather rare. Unlike our results for cot-caught, clustering analyses showed inconsistencies between perception and production for only one participant (Participant 016). We believe this to be an interesting result, perhaps pointing to a generalizable difference between mergers and splits.
Correlations between perception and production were moderate to strong, with the best correlation obtained when Pillai scores at 80% of the duration of the vowel were compared with results of the 2FC task (R2 = 0.71). Overall, our results suggest that speakers with the writer-rider contrast in production will perform better in perception of that contrast. Mean perception accuracy rates by production support this: those classified as speakers who produced the contrast had an average accuracy of 85% while those who were classified as not producing a contrast were at 62%. This is much larger than the difference found for cot-caught in average perception accuracy between the two tasks.
Metalinguistic awareness of the writer-rider contrast in a participant's own speech appears to be mixed at first blush, but further analysis of the responses shows that this is due, for the most part, to the possibility of pronouncing /t/ and /d/ differently in the context of flapping or orthographical differences. Of those who reported having a contrast (n = 16), only half of them were classified within the cluster with high Pillai scores in production. However, the 8 participants who did show a contrast in their production were participants who described differences in the vowel (e.g., “The vowel in rider lasts longer, and the mouth opens more for that vowel” and “The ‘i' in writer is a shorter sound and sounds more like ‘uh-ee.' The ‘i' in rider is longer and sounds more like ‘ah-ee.”'), with the majority of them (n = 6) describing differences in vowel duration specifically. Instead, participants who did not show a contrast in production primarily described differences in the consonant (e.g., “emphasis on the ‘d' consonant,” “In rider, I pronounce the D more,” and “There is a pronunciation of the ‘t' in writer not in rider.”). It therefore appears that, for those who participate in the Canadian raising split, they do have some level of metalinguistic awareness about changes or differences in the vowel. Other participants appeared to be more heavily influenced by orthographic < t> and < d> in their intuitions about their own productions. Participant intuitions according to the distinction they reported in their speech, relative to their Pillai scores at 30% vowel duration and their perception accuracy rates, are visualized in Figure 12. Almost all speakers who reported a vowel contrast in their own speech obtained very high Pillai scores in production and none of the speakers who reported lack of contrast had a Pillai score above 0.5.
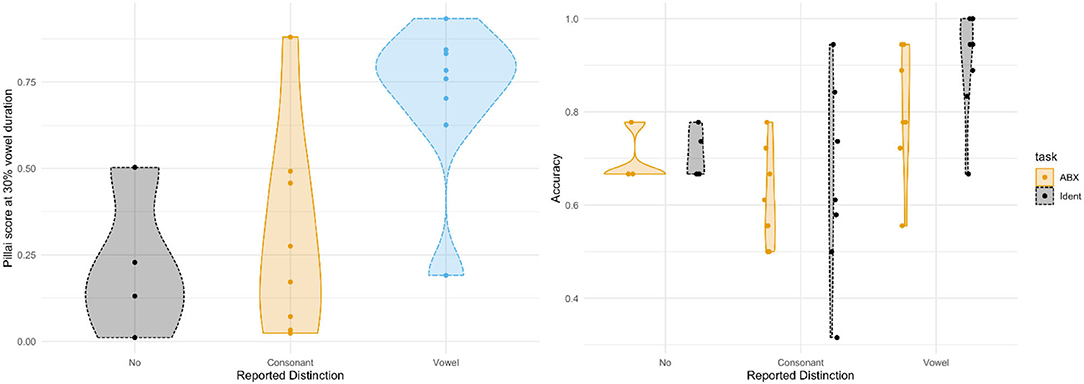
Figure 12. Pillai scores at 30% vowel duration (left) and perception accuracy rates (right) by self-reported distinction for writer-rider. Pillai scores and individual mean accuracy for perception tasks at 30% for writer-rider, separated by reported distinction. No, no self-reported contrast; Consonant, reported contrast and described difference as consonantal; and Vowel, reported contrast and described difference in terms of vowel quality.
Regarding the relationship between reported phonological contrast and perception, speakers who reported that they produced a phonological contrast in the diphthong clearly outperformed other speakers, most having over 80% accuracy in the 2FC identification task. As can also be seen in Figure 12, speakers who reported a difference in the pronunciation of the consonant show a very wide range of accuracy in that same task.
Our results for writer-rider show that perception and production of the contrast pattern very closely together. Those who were clustered as having a split in production were also clustered as being able to discriminate [ʌi] and [aɪ]. Those who were clustered instead as not producing a contrast were also clustered as being unable to discriminate the two phones. Intra-speaker inconsistencies between perception and production were rare. Speakers who participated in the split also tended to be aware of differences in vowel quality between the target vowels in writer and rider. These results are clearly different from those of Experiment 1, on the [ɑ-ɔ] contrast. Interestingly whereas Canadian raising has been described as resulting in a marginal contrast, this contrast appears to be more robust when production and perception are considered than the merger in progress that we are also analyzing here.
Research on perception and production has largely been conducted under the assumption of a binary distinction based on phonemic category. However, the contrasts under study here, [ɑ-ɔ] (“cot-caught”) and [ʌi-aɪ] (“writer-rider”), cannot be easily categorized as either phonemic or allophonic, due to ongoing sound changes involving each pair of phones.
Regarding production first, an examination of Pillai scores for the two contrasts shows larger Pillai scores (greater distance between vowels) for those who produced a contrast between writer-rider, compared to smaller Pillai scores for those who appeared to maintain a contrast between cot-caught. In other words, although some speakers did produce a discernible contrast between [ɑ-ɔ], the relative distance between the two phones is smaller than that between [ʌi-aɪ] of writer-rider. The number of participants in our experiment with relatively large Pillai scores is also greater in our writer-rider experiment than in the cot-caught experiment. The writer-rider split appears to have progressed to a point where it is more stable than the current state of the cot-caught contrast, both in terms of phonetic stability, in that the contrast is realized consistently with a greater distance between vowels, and in terms of phonological stability, in that speakers with the contrast patterned very closely in production and perception and were able to identify the contrast in terms of their own vowel productions.
As for the production-perception link, participants with a production contrast (high Pillai scores) for writer-rider showed higher accuracy in both perception tasks (ABX: 80%; 2FC: 89%) relative to those who had a contrast in production for cot-caught (ABX: 69%; 2FC: 78%). Results for perception accuracy for raisers and non-raisers of writer-rider are comparable to previously found results by Strickler (2019) for speakers in the Fort Wayne, Indiana area.
Additionally, the correlations between perception and production for writer-rider are much stronger than those for cot-caught, further supporting the view that the writer-rider split has progressed to a more stable point than the cot-caught contrast has at present. Those with the writer-rider contrast in production were highly accurate in perception, whereas those without the contrast had poorer performance (85% vs. 65% mean perception accuracy between ABX and 2FC). In comparison, for cot-caught, participants with the contrast in production averaged 73% in overall perception accuracy while those without the contrast averaged 69%; compared to the 20% difference between groups for writer-rider, the 4% difference for cot-caught seems to further indicate weaker perception-production correlation for the latter pair. These findings suggest that speakers in northern and central Illinois may receive variable input regarding the cot-caught contrast, although the current status of merger progression cannot be established solely from our experimental results due to a lack of real- or apparent-time data. However, compared to what had previously been documented for northern and central Illinois (including the Chicagoland area, from which we have 14 participants) (e.g., Labov et al., 2006), a number of speakers in our study have fully merged the two sounds. The place of where each participant was raised, along with their status as mergers or non-mergers, can be seen in Figure 1.
For cot-caught, these maps show a mix of speakers with and without the merger in both Chicagoland and central Illinois, supporting the idea that the merger has advanced in recent years beyond a mere transitional state for some speakers. Of the two speakers from southwest Illinois (the St. Louis area), one appears to maintain the cot-caught contrast while the other has merged the two phonemes. Location data for the writer-rider contrast showed less change from past data. Speakers in Chicagoland largely have the contrast, although not all of them do; speakers in central Illinois do not. One of the speakers from the St. Louis area shows evidence for the writer-rider split, which is a feature of Chicago English. This finding is consistent with previous work by Labov et al. (2006) and the general pattern showing that the St. Louis corridor, along Interstate Highway 55, has served to transmit sound changes from Chicago to the St. Louis area (Labov, 2007). These comparisons, albeit made with a relatively small sample size, tentatively suggest that listeners continue to receive variable input as to the status of the cot-caught merger in Illinois, while the geographical distribution of the writer-rider split has stayed largely the same.
For each contrast, our clustering analyses separated speakers into two groups for production (high vs. low scores, interpretable as “produce the contrast” and “do not produce the contrast”) and two groups for perception (“can perceive the contrast” and “cannot perceive”). Based on the distribution and overlap of speakers in each of these groups, our results appear to support interesting differences regarding the link between perception and production for splits as compared with mergers, and for the trajectories of both sound changes.
For the writer-rider split (Experiment 2), two main groups emerged: those who could produce and perceive a contrast between writer-rider, and those who could not produce or perceive the contrast. Only one participant was clustered separately as having a contrast in production but not perception. Perception and production showed moderate to strong correlations, suggesting that speakers with the writer-rider contrast in production will perform better in perception of that contrast; this corresponds with results found by Strickler (2019). There was only one participant who, despite being clustered as part of the group that produces a contrast, had relatively low accuracy rates in perception. These results show that production and perception largely go together in this case.
At the beginning of certain sound changes, such as phonemic splits, listeners may attend to secondary cues which are initially non-contrastive. Responses from speakers who participated in the split seemed to indicate that they were aware at some level of a difference in vowel duration, which has been found to vary depending on whether the flap is an underlying /t/ (138.44 ms) or /d/ (157.72 ms) (Hualde et al., 2017). Strickler (2019) also reports a vowel duration difference of ~15–17ms. Attention to secondary cues as a path to sound change has been previously suggested for other changes such as vowel fronting (Harrington et al., 2012; Kleber et al., 2012), and perceptual weighting of F0 vs. other primary cues (Kuang and Cui, 2018).
For phonological mergers, such as cot-caught (Experiment 1), our results show a more complicated relationship between perception and production, reflective of cot-caught as a more marginal contrast for our group of speakers. Although correlations between perception and production were very weak [in line with Baranowski (2013) and Hay et al. (2013)], our clustering analyses illuminated patterns among inconsistencies between perception and production. Our clustered participants were representative of four different groups, including those who were merged in their perception but maintained a contrast, as well as those whose productions were possibly merged but were still able to discriminate in perception.
A substantial body of work has shown that in mergers in progress, merger in perception may come before a merger in production (Labov, 2011: 334), with previous studies finding support for a perception lead (e.g., Di Paolo and Faber, 1990; Herold, 1990). Recent support for a perception lead comes from Pinget et al. (2020), who examined the devoicing of initial labiodental fricatives and initial bilabial stops in Dutch, a process that appears to be resulting in a merger or near merger. For those individuals who participated in this sound change, Pinget and colleagues found that most individuals tended to change their perceptual patterns before changing their production patterns in speech.
However, there have been mixed results regarding the directionality of mergers. In the same study, Pinget et al. (2020) found that even when productions of the voiced and voiceless categories were merged, results showed that perception lagged behind production, in that some participants were still able to discriminate a contrast that they no longer produced. Baranowski (2013), examining the pin-pen [ɪ-ε] merger in Charleston, South Carolina, found that speakers were more likely to be merged in production than perception, although there was no significant difference between production and perception for cot-caught. Austen (2020), tracking the distribution of the pin-pen [ɪ-ε] merger across the United States, found that almost all speakers who merged the two phones were still able to discriminate them above chance (but below 100% accuracy) in a two-alternative forced choice identification task. For the Ellen-Allen merger in New Zealand (Thomas and Hay, 2005; Hay et al., 2013), and for the cot-caught merger in Hawai'i and the western United States (Hay et al., 2013), speakers who were merged in production could still discriminate between both pairs in perception.
This group of speakers, classified as those who are merged in production but are still able to discriminate the target phones, comprised 35% of our participants; despite participating in the cot-caught merger, a large number of speakers still appeared to maintain the ability to perceive a contrast. This lends support to the hypothesis that the merger is still in progress in northern and central Illinois and that productions of the cot-caught contrast may vary at the level of individual speakers. However, it cannot be ruled out that there is instead stable variation in the regions under study, given the lack of real- or apparent-time data in our study.
While sound changes may begin with changes in perception for individual speakers, not all speakers participate in a sound change at the same rate. In a speech community where a merger is still in progress, different speakers may continue to produce both merged and unmerged variants, requiring listeners to maintain a contrast in their perceptual systems. This suggests that, for individual speakers, completion of the merger in perception may lag behind completion of said merger in production (Janson and Schulman, 1983; Pinget et al., 2020). In contrast, for phonemic splits and other sound changes that result in phones being added to a speaker's phonological inventory, no such lag in perception may be expected, as evidenced by the high correlations between perception and production of writer-rider by speakers in our study.
To summarize, two marginal contrasts as perceived and produced by the same group of speakers were examined in this study, with one marginal contrast representative of an ongoing phonological merger and the other representative of a phonemic split. For speakers in this study, overall lower accuracy levels in perception for cot-caught, and greater overlap in Pillai scores for production, suggest that this contrast is more marginal. The writer-rider contrast appears to exhibit more robustness in this community, although perception accuracy was not at ceiling (relative to control items, where perception accuracy was near or at ceiling), suggesting that writer-rider may still be considered an example of a marginal contrast (e.g., Hualde et al., 2017, 2021), albeit one that has become more stable in the speech community under study. Strikingly different results were obtained regarding clustering of participants based on their perception and production of the two contrasts, perhaps pointing to different sound change trajectories for mergers as compared with phonemic splits.
Participants of this study did not consent for their data to be shared publicly, so supporting data is not available.
The studies involving human participants were reviewed and approved by Office for the Protection of Research Subjects, University of Illinois at Urbana-Champaign. The participants provided their written informed consent to participate in this study.
JH, JZ, and LG contributed to conception and design of the study. JZ and LG recruited participants and organized the database. MB performed the statistical analysis. JZ wrote the first draft of the manuscript. All authors contributed to manuscript revision, read, and approved the submitted version.
The authors declare that the research was conducted in the absence of any commercial or financial relationships that could be construed as a potential conflict of interest.
All claims expressed in this article are solely those of the authors and do not necessarily represent those of their affiliated organizations, or those of the publisher, the editors and the reviewers. Any product that may be evaluated in this article, or claim that may be made by its manufacturer, is not guaranteed or endorsed by the publisher.
The Supplementary Material for this article can be found online at: https://www.frontiersin.org/articles/10.3389/fcomm.2022.844862/full#supplementary-material
1. ^All speakers in this study, due to their status as students at this university, were immersed in an environment with substantial input from Chicago area speakers. Illinois residents have comprised over 70% of the incoming student population in recent years, with over 70% of the Illinois population (21,936 out of 30,347 students in 2021) representing the Chicago metropolitan area. However, we acknowledge the heterogeneity of our limited sample size.
2. ^In a recent study, Freeman and De Decker (2021) report that recording with Apple devices may result in possibly deviant formant frequencies, which may affect the phonetic analysis of back and lower vowels in particular. We would like to add this caveat, since many of our participants submitted recordings from Apple devices.
3. ^It has been noticed [e.g., Hualde et al. (2021)] that in some monomorphemic words like cider and spider, the higher diphthong is sometimes found before the tap, contrary to what would be expected from the spelling. This shows a tendency for this diphthong to spread outside the context where it emerged (cf. also tiger, fire, without a following coronal stop, etc.). In our stimuli the diphthong is always followed by a morpheme-final coronal stop.
Austen, M. (2020). Production and perception of the Pin-Pen merger. J. Linguist. Geogr. 8, 115–126. doi: 10.1017/jlg.2020.9
Baranowski, M. (2013). On the role of social factors in the loss of phonemic distinctions1ss1. Engl. Lang. Linguist. 17, 271–295. doi: 10.1017/S1360674313000038
Bates, D., Maechler, M., Bolker, B., and Walker, S. (2015). Fitting linear mixed-effects models using lme4ee4. J. Stat. Softw. 67, 1–48 doi: 10.18637/jss.v067.i01
Berkson, K., Davis, S., and Strickler, A. (2017). What does incipient/ay/-raising look like?: A response to Josef Fruehwald. Lang. 93, e1e81–e1e91. doi: 10.1353/lan.2017.0050
Bermúdez-Otero, R. (2004). Raising and flapping in Canadian English: grammar and acquisition. In: Paper Presented at CASTL Colloquium, University of Tromsø. Available online at: http://www.bermudez-otero.com/tromsoe.pdf
Bloomfield, L. (1939). Menomini morphophonemics. Travaux du cercle linguistique de Prague. 8, 105–115.
Boersma, P., and Weenink, D. (2021). Praat: Doing Phon. by Computer [Computer program]. Version 6.2.04. Available online at: http://www.praat.org/ (retrieved on December 18, 2021).
Boulenger, V., Hoen, M., Jacquier, C., and Meunier, F. (2011). Interplay between acoustic/phonetic and semantic processes during spoken sentence comprehension: An ERP study. Brain lang. 116, 51–63. doi: 10.1016/j.bandl.2010.09.011
Chambers, J. K. (1973). Canadian raising. Can. J. Linguist. 18, 113–135. doi: 10.1017/S0008413100007350
Chambers, J. K. (1989). Canadian raising: blocking, fronting, etc. Am. Speech. 64, 75–88. doi: 10.2307/455114
Chambers, J. K. (2006). Canadian raising in retrospect and prospect. Can. J. Linguist. 51(2/3) 105–118. doi: 10.1017/S000841310000400X
Chitoran, I., and Hualde, J. I. (2007). From hiatus to diphthong: the evolution of vowel sequences in Romance. Phonology. 24. 37–75. doi: 10.1017/S095267570700111X
Clopper, C. G., Pisoni, D. B., and De Jong, K. (2005). Acoustic characteristics of the vowel systems of six regional varieties of American English. J. Acous. Soc. Am. 118, 16611661–1676. doi: 10.1121/1.2000774
Coetzee, A. W., Beddor, P. S., Shedden, K., Styler, W., and Wissing, D. (2018). Plosive voicing in Afrikaans: Differential cue weighting and tonogenesis. J. Phon.. 66, 185–216. doi: 10.1016/j.wocn.2017.09.009
Crowley, T. (1998). The voiceless fricatives [s] and [h] in Erromangan: O One phoneme, two, or one and a bit? Australian J. Linguist. 18, 149–168. doi: 10.1080/07268609808599565
Dailey-O'Cain, J. (1997). Canadian raising in a midwestern US city. Lang. Variation Change. 9, 107–120. doi: 10.1017/S0954394500001812
Davis, S., Berkson, K., and Strickler, A. (2020). Unlocking the mystery of dialect B: a note on incipient /aı/-raising in Fort Wayne, Indiana. Am. Speech. 95, 149–172. doi: 10.1215/00031283-7603207
Di Paolo, M., and Faber, A. (1990). Phonation differences and the phonetic content of the tense-lax contrast in Utah English. Lang. variation Change. 2, 155–204. doi: 10.1017/S0954394500000326
Dresher, B. E. (2009). The Contrastive Hierarchy in Phonology. Cambridge University Press. p. 121. doi: 10.1017/CBO9780511642005
Edwards, J.an, Mary, E., and Beckman. (2008). Some cross-linguistic evidence for modulation of implicational universals by language-specific frequency effects in phonological development. Lang. Learn. Develop. 4, 122–156. doi: 10.1080/15475440801922115
Ferragne, E., Bedoin, N., Boulenger, V., and Pellegrino, F. (2011). The perception of a derived contrast in Scottish English. In Proceedings of the 17th International Congress of Phonetic Sciences (ICPhS XVII) 667–670.
Freeman, V., and De Decker, P. (2021). Remote sociophonetic data collection: Vowels and nasalization over video conferencing apps. J. Acoust. Soc. Am. 149:11211–1223. doi: 10.1121/10.0003529
Fruehwald, J. (2008). The spread of raising: opacity, lexicalization, and diffusion. Univ Pa. Work. Papers Linguist 14, 83–92.
Fruehwald, J. (2016). The early influence of phonology on a phonetic change. Language. 92, 376–410. doi: 10.1353/lan.2016.0041
Garrett, A., and Johnson, K. (2013). “Phonetic bias in sound change,” in Origins of Sound Change: Approaches to Phonologization, Vol. 1, 51–97.
Goldsmith, J. A. (1995). Phonological theory. Handbook Phonol. Theor. 1–23. doi: 10.1111/b.9780631201267.1996.00003.x
Google (n.d.). Google Maps view of the state of Illinois. Available online at: https://goo.gl/maps/2Uu6nU1GakXJ3z6v7
Graham, L. (2019). Production and contrastiveness of Canadian Raising in Metro-Detroit English. In Sasha, C., Paola, E., Marija, T., and Paul, W. (eds.) Proceedings of the 19th International Congress of Phonetic Sciences, Melbourne, Australia. p. 127–131. Canberra: Australasian Speech Science and Technology Association.
Hall, D. C. (2007). The Role Representation of Contrast in Phonological Theory. Toronto: University of Toronto.
Hall, K. C. (2013). A typology of intermediate phonological relationships. Linguist. Rev. 30, 215–275. doi: 10.1515/tlr-2013-0008
Harrington, J., Kleber, F., and Reubold, U. (2012). The production and perception of coarticulation in two types of sound change in progress. Speech Plan. Dyn. 39–62.
Hay, J., Drager, K., and Thomas, B. (2013). Using nonsense words to investigate vowel merger1rr1. Engl. Lang. Linguist. 17, 241–269. doi: 10.1017/S1360674313000026
Herd, W., Jongman, A., and Sereno, J. (2010). An acoustic and perceptual analysis of/t/and/d/flaps in American English. J. Phon. 38, 504–516. doi: 10.1016/j.wocn.2010.06.003
Herold, R. (1990). Mechanisms of merger: The implementation distribution of the low back merger in Eastern Pennsylvania. University of Pennsylvania dissertation.
Hillenbrand, J. M. (2013). Static and dynamic approaches to vowel perception. In Vowel Inherent Spectral Change. p. 9–30. Berlin, Heidelberg: Springer. doi: 10.1007/978-3-642-14209-3_2
Hockett, C. F. (1960). The origin of speech. Sci. Am. 203, 88–97. doi: 10.1038/scientificamerican0960-88
Hualde, J. I. (2005). Quasi-phonemic contrasts in Spanish. In V. Chand, A. Kelleher, A. J. Rodriguez and B. Schmeiser (eds.), Proceedings of the 23rd West Coast Conference on Formal Linguist. p. 374–398. Somerville, MA: Cascadilla Press.
Hualde, J. I., Barlaz, M., and Luchkina, T. (2021). Acoustic differentiation of allophones of /aı/ in Chicagoland English: Statistical comparison of formant trajectories. J. Int. Phon. Assoc. 1–31. doi: 10.1017/S0025100320000158
Hualde, J. I., Luchkina, T., and Eager, C. D. (2017). Canadian Raising in Chicagoland: The production and perception of a marginal contrast. J. Phon. 65, 15–44. doi: 10.1016/j.wocn.2017.06.001
Hume, E., and Johnson, K. (2001). A model of the interplay of speech perception and phonology. In Elizabeth Hume and Keith Johnson (eds.) The Role of Speech Perception in Phonology, 3–26. San Diego: Academic Press. doi: 10.1163/9789004454095
Hume, E., and Johnson, K. (2003). The impact of partial phonological contrast on speech perception. In: Proceedings of the Fifteenth International Congress of Phonetic Sciences.
Idsardi, W. J. (2006). Canadian raising, opacity, and rephonemicization. Can. J. Linguist. 51, 119–126. doi: 10.1017/S0008413100004011
Janson, T., and Schulman, R. (1983). Non-distinctive features and their use. J. Linguist. 19, 321–336. doi: 10.1017/S0022226700007763
Jibson, J. (2021). Assessing merged status with Pillai scores based on dynamic formant contours. Proc. Linguist. Soc. Amer. 6, 203–212. doi: 10.3765/plsa.v6i1.4961
Kager, R. (2008). Lexical irregularity and the typology of contrast. In K. Hanson and S. Inkelas (eds.), The Nature of the Word: Essays in Honor of Paul Kiparsky. Cambridge, MA: MIT Press. doi: 10.7551/mitpress/9780262083799.003.0017
Kilbury, J. (1983). Talking about phonemics: Centralized diphthongs in a Chicago-area idiolect. In F. Agard, G. Kelley, A. Makkai, and V. B. Makkai (Eds.), Essays in Honor of Charles F. Hockett. p. 336–341. Leiden: Brill.
Kiparsky, P. (1985). Some consequences of lexical phonology. Phonology. 2, 85–138. doi: 10.1017/S0952675700000397
Kiparsky, P. (2003). Analogy as optimization: ‘Exceptions' to Sievers' Law in Gothic. In Aditi Lahiri (ed.) Analogy, Levelling, Markedness: Principles of Change, Phonology Morphology. p. 15–46. Berlin: Walter de Gruyter. doi: 10.1515/9783110899917.15
Kleber, F., Harrington, J., and Reubold, U. (2012). The relationship between the perception and production of coarticulation during a sound change in progress. Lang. Speech. 55, 383–405. doi: 10.1177/0023830911422194
Kuang, J., and Cui, A. (2018). Relative cue weighting in production and perception of an ongoing sound change in Southern Yi. J. Phon. 71, 194–214. doi: 10.1016/j.wocn.2018.09.002
Labov, W. (1994). Principles of Linguist. change. Vol. 1: Internal factors. Cambridge, Mass., and Oxford: Blackwell.
Labov, W. (2011). Principles of Linguistics Change, Volume 3: Cognitive Cultural Factors. JohnWiley and Sons. doi: 10.1002/9781444327496
Labov, W., Ash, S., and Boberg, C. (2006). The Atlas of North America English: Phonetics, Phonology and Sound Change. Walter de Gruyter. doi: 10.1515/9783110167467
Ladd, D. R. (2006). “Distinctive phones” in surface representation. In Louis M. Goldstein, D. H. Whalen and Catherine T. Best (eds.), Laboratory Phonology. Vol. 8. p. 3–26. Berlin: Mouton de Gruyter.
Ladd, D. R. (2014). Simultaneous Structure in Phonology, 28. OUP Oxford. doi: 10.1093/acprof:oso/9780199670970.001.0001
Lenth, R. V. (2022). Emmeans: Estimated Marginal Means, aka Least-Squares Means. R package version 1.7.3. Available online at: https://CRAN.R-project.org/package=emmeans
Martin, A., and Peperkamp, S. (2011). Speech perception and phonology. In M. van Oostendorp, C. J. Ewen, E. Hume and K. Rice (eds.), The Blackwell Companion to Phonology. p. 2334–2356. Oxford: Wiley-Blackwell. doi: 10.1002/9781444335262.wbctp0098
McAuliffe, M., Socolof, M., Mihuc, S., Wagner, M., and Sonderegger, M. (2017). Montreal Forced Aligner: Trainable Text-Speech Alignment Using Kaldi. In: Interspeech. p. 498–502. doi: 10.21437/Interspeech.2017-1386
Mielke, J., Armstrong, M., and Hume, E. (2003). Looking through opacity. Theor. Linguist. 29, 123–139. doi: 10.1515/thli.29.1-2.123
Milroy, J. (1996). Variation in /ai/ in Northern British English, with comments on Canadian Raising. Univ. Pa. Work. Papers Linguist. 3, 16.
Nadeu, M., and Renwick, M. E. (2016). Variation in the lexical distribution and implementation of phonetically similar phonemes in Catalan. J. Phon. 58, 22–47. doi: 10.1016/j.wocn.2016.05.003
Nycz, J., and Hall-Lew, L. (2013). Best practices in measuring vowel merger. Proc. Mtgs. Acoust. 20, 060008. doi: 10.1121/1.4894063
Pater, J. (2014). Canadian raising with language-specific weighted constraints. Language. 230–240. doi: 10.1353/lan.2014.0009
Pinget, A. F., Kager, R., and Van de Velde, H. (2020). Linking variation in perception and production in sound change: Evidence from Dutch obstruent devoicing. Lang. Speech. 63, 660–685. doi: 10.1177/0023830919880206
R Core Team (2019). R: A Language environment for statistical computing. R Foundation for Statistical Computing, Vienna, Austria. Available online at: https://www.R-project.org/
Renwick, M. E., and Nadeu, M. (2018). A survey of phonological mid vowel intuitions in central Catalan. Lang. Speech. 62, 164–204. doi: 10.1177/0023830917749275
Renwick, M. E. L., and Ladd, D. (2016). Phonetic Distinctiveness vs. Lexical Contrastiveness in Non-Robust Phonemic Contrasts. J. Assoc. Lab. Phonol. 7. 1–29. doi: 10.5334/labphon.17
Renwick, M. E. L., Vasilescu, I., Dutrey, C., Lamel, L., and Vieru, B. (2016). Marginal contrast among romanian vowels: evidence from ASR and functional load. In: Proceedings of Interspeech. p. 2433–2437. San Francisco, CA. Available online at: http://www.isca-speech.org/archive/Interspeech_2016/pdfs/0762.PDF
Scobbie, J. M., Hewlett, N., and Turk, A. E. (1999). Standard English in Edinburgh and Glasgow: The Scottish vowel length rule revealed. In P. Foulkes and G. Docherty (eds.), Urban Voices: Variation Change in British Accents. p. 230–245. London: Arnold.
Shewmake, E. F. (1925). Laws of pronunciation in eastern Virginia. Modern Lang. Notes. 40, 489–492. doi: 10.2307/2914584
Shewmake, E. F. (1943). Distinctive Virginia pronunciation. Am. Speech. 18, 33–38. doi: 10.2307/487265
Strickler, A. (2019). Within-speaker perception and production of dialectal /aı/-raising. In Proceedings of the 19th International Congress of Phonetic Sciences, Melbourne, Australia (pp. 3205–3209).
Thomas, B., and Hay, J. (2005). A pleasant malady: The Ellen/Allan merger in New Zealand English. Te Reo. 48, 69.
Vance, T. J. (1987). “Canadian Raising” in some dialects of the northern United States. Am. Speech. 62, 195–210. doi: 10.2307/454805
Keywords: marginal contrast, merger, split, Canadian raising, production, perception
Citation: Zhang J, Graham L, Barlaz M and Hualde JI (2022) Within-Speaker Perception and Production of Two Marginal Contrasts in Illinois English. Front. Commun. 7:844862. doi: 10.3389/fcomm.2022.844862
Received: 28 December 2022; Accepted: 29 April 2022;
Published: 21 June 2022.
Edited by:
Joseph V. Casillas, Rutgers, The State University of New Jersey, United StatesReviewed by:
Margaret Renwick, University of Georgia, United StatesCopyright © 2022 Zhang, Graham, Barlaz and Hualde. This is an open-access article distributed under the terms of the Creative Commons Attribution License (CC BY). The use, distribution or reproduction in other forums is permitted, provided the original author(s) and the copyright owner(s) are credited and that the original publication in this journal is cited, in accordance with accepted academic practice. No use, distribution or reproduction is permitted which does not comply with these terms.
*Correspondence: José Ignacio Hualde, amlodWFsZGVAaWxsaW5vaXMuZWR1
Disclaimer: All claims expressed in this article are solely those of the authors and do not necessarily represent those of their affiliated organizations, or those of the publisher, the editors and the reviewers. Any product that may be evaluated in this article or claim that may be made by its manufacturer is not guaranteed or endorsed by the publisher.
Research integrity at Frontiers

Learn more about the work of our research integrity team to safeguard the quality of each article we publish.