 Irena Yanushevskaya
 Andy Murphy
 Christer Gobl
 Ailbhe Ní Chasaide
- Phonetics and Speech Laboratory, School of Linguistic, Speech and Communication Sciences, Trinity College Dublin, Dublin, Ireland
This paper explores perceptual salience of voice source parameter manipulation in signaling prominence in the absence of f0 variation. Synthetic stimuli were generated based on an inverse filtered all-voiced utterance “We were away a year ago.” A global waveshape parameter Rd was manipulated in the stimuli to enhance prominence in the two potentially accentable syllables WAY and YEAR and to provide voice source deaccentuation post-focally. The manipulations were intended to mimic an increase in phonatory tension in the prominent syllable while decreasing it in the post-focal material. f0 was kept constant. Two listening tests were conducted in which participants rated the perceived prominence of the potentially accentable syllables in the manipulated utterances on a continuous visual analog scale. The results suggest that perceived focal prominence can be achieved by source variation in the absence of f0 modulations, although the results were not identical in the two tests. The extent of the enhancement of prominence by source manipulations in our data depended on the location of focal syllable in the intonational phrase and on the length of postfocal material (the effect was stronger for WAY than for YEAR).
Introduction
This paper explores the perceptual salience of voice source parameter manipulations in generating prosodic prominence in synthetic stimuli when f0 variation is not included.
Prosody of speech is typically described as modulations in speech melody (f0/pitch variation) and timing as well as adjustments in phonatory settings (Botinis et al., 2001; Wagner and Watson, 2010; Xu, 2011), but may also involve changes in articulatory settings (e.g., Keating, 2003).
The main body of work on prosody has been conducted on f0, timing and intensity, both in production and perception studies, and the advances in the field in relation to these phenomena are considerable. f0 and intensity are typically treated and studied as separable from the overall voice source modulations in prosody. This mainly has to do with the relative ease of measuring them compared to other features of the voice source perceptually correlated with voice quality, such as spectral tilt or glottal pulse shape. Intensity is often cited as a separate feature, e.g., Wagner and Watson (2010) but is to a large extent a reflection of source variation.
The role of the voice source in shaping linguistic prosody, although increasingly the focus of interest of phoneticians and speech scientists, is still understood to a much lesser extent (d'Alessandro, 2006). Voice source variation in signaling focus, deaccentuation, prominence, phrase boundaries has been explored in analytical production studies and (to a lesser extent) in perception studies (e.g., Gobl, 1988; Pierrehumbert, 1989; Strik and Boves, 1992; Epstein, 2003; Iseli et al., 2006; Ní Chasaide et al., 2011; Ludusan et al., 2021).
The main research interest here is the prosody of the voice (or voice prosody). By voice prosody we mean the modulations of the voice source in its entirety (including f0 and other source parameters describing the shape of the glottal pulse and reflecting changes in not only what is perceived as pitch but also in voice quality and loudness) that are used to signal important linguistic information. This approach was adopted in Ní Chasaide and Gobl (2004a,b).
This paper aims to investigate, using synthetic stimuli in perception tests, whether voice source modulations in the absence of f0 variation can generate linguistic prominence. This is important for developing flexible synthetic voices where control over voice quality, and not just f0 or intensity, is desirable while maintaining a relatively small number of control parameters, such as the global waveshape parameter Rd.
Focus and deaccentuation—Definition and the linguistic function of prosodic prominence
A linguistic entity is prosodically prominent if it stands out relative to its environment by virtue of its prosodic characteristics (Terken and Hermes, 2000; van Heuven, 2014; Wagner et al., 2015). Prosodic focus is generally described as a means of emphasizing, highlighting a piece of new or contrastive information relative to the information already shared by the conversation participants. Focal prominence can be signaled by a variety of phonetic and phonological properties such as the type and alignment of pitch accents, boundary tones, duration, intensity and f0 range (Burdin et al., 2015; Baumann and Winter, 2018). These cues work synergistically to provide “robust communication of prominence information” (Baumann and Winter, 2018). New information can be made salient not only through prosodic highlighting but also using various syntactic and semantic means (Kember et al., 2019). Prosodic highlighting is achieved by simultaneous de-highlighting or de-accentuation of the known, given information (Ladd, 2008).
The form/correlates of prosodic prominence—Evidence from production studies
f0 variation has been widely described as a primary acoustic correlate of focus (by assigning pitch accents to the syllables that are lexically stressed or by extending the range of f0) (e.g., Ladd, 2008; Féry, 2017). For example, in English, a narrow focus is generally characterized by a high falling (H*L) nuclear pitch accent. This is accompanied by an increase in the pitch range in the focally accented syllable and compression of pitch immediately following the focused syllable and deaccentuation, particularly of the post-focal material (no change is usually observed in the pitch range of pre-focus material) (Xu and Xu, 2005). Focally accented syllables have also been found to have longer duration and higher intensity (Turk and Sawusch, 1996; Leemann et al., 2016). Languages differ in the use of these acoustic cues to signal prominence and deaccentuation (Cruttenden, 2011; Leemann et al., 2016).
Most inferences on voice source correlates of more general phenomena of stress, accent and prominence (rather than focus) have been based on spectral measurements derived from the speech waveform, which should reflect source behavior. For example, the amplitude level of H1 can be compared to the level of some higher frequency component such as H2 or A1 (the amplitude level of the first formant F1) as a measure of overall shape and slope of the spectrum. For a discussion of such measures, and more generally of how source parameters relate to the spectral characteristics of speech, see Gobl and Ní Chasaide (2010).
The spectrum-based source measures in the analyses in Sluijter and van Heuven (1996) and Sluijter et al. (1997) suggested that a less steep spectral slope (boosting of the higher frequency regions) and consequently tenser voice quality is associated with focal stress and prominence in Dutch and American English. Similar findings are reported in Heldner (2003) who points to the overall intensity and spectral emphasis as reliable acoustic cues of focal accents in Swedish (spectral emphasis is a measure of a relative contribution of high frequency components to overall intensity). Spectral tilt has been reported as a reliable cue to prominence in dialogue speech in Campbell (1995) and Campbell and Beckman (1997).
Shue et al. (2007) compared voice source correlates of pitch accent and lexical stress. They found that stressed syllables have lower Open Quotient (indicative of tenser voice) irrespective of pitch accent, and also longer duration. Acoustic cues of lexical stress were found to be affected by the presence of pitch accent, boundary tone and by speaker gender.
More recently, Baumann and Winter (2018) used measures of spectral tilt H1-A2 and H1-A3 (difference between the amplitude level of the first harmonic and amplitude peaks near F2 and F3), along with other acoustic measures, in perception studies on word prominence in German and found that both measures of spectral slope were correlated to prominence judgment in statistically significant way.
Kakouros et al. (2018) provided a comprehensive review of spectral tilt as a correlate of prosodic prominence and explored its importance in signaling sentence prominence in Dutch and French relative to the more established acoustic correlates f0, intensity and duration. They point out that measures of spectral tilt are diverse and the standards are less established than for measures of f0 and intensity, e.g., some spectral tilt measures are directly computed using the speech pressure waveform (Campbell, 1995; Sluijter et al., 1997; Eriksson et al., 2001; Heldner, 2001) and others calculate spectral tilt of estimated glottal source obtained by inverse filtering (Iseli et al., 2006; Kreiman et al., 2007). The results of classification experiments on clean and corrupted speech in Kakouros et al. (2018) suggest that measures of spectral tilt are important contributors in differentiating prominent and non-prominent words.
Analyses of source parameters (described in more detail in Section Important voice source parameters) obtained by glottal inverse filtering and parameterisation generally point to changes in the shape of the glottal pulse in accented or prominent syllables that suggest greater tension in the mode of phonation (Koreman, 1995; Epstein, 2002; d'Alessandro, 2006; Iseli et al., 2006). Increased vocal effort associated with focal prominence entails greater volume-velocity airflow through the glottis, more asymmetrical glottal pulses with smaller open quotient and steeper, more abrupt glottal closure, which it turn generates relatively stronger higher harmonics and flatter spectral tilt (van Heuven, 2014).
Measures of source correlates of focal accent in Swedish using a manual interactive technique (Gobl, 1988) identified dynamic changes in the strength of the glottal excitation (Ee) in focal context, enhancing the vowel-consonant distinction. These data further suggest that the focal patterning of an utterance does not just affect the focally accented syllable but may also have consequences for the pre-focal and post-focal material.
Results of studies of focus and stress in Finnish (Airas et al., 2007; Vainio et al., 2010) run counter to the general trends mentioned above. In both studies the analysis was carried out using an automatic method—Iterative Adaptive Inverse Filtering (Alku, 1992), and the data analyzed were vowel segments extracted from connected speech. These studies report higher NAQ values in focally accented syllables (Vainio et al., 2010), as in stressed syllables (Airas et al., 2007). The NAQ measure (Alku et al., 2002) has been proposed as a global parameter, which correlates with the tense/lax dimension of vocal quality and, when scaled by 0.11, is essentially the same as the Rd parameter used in this study. A high NAQ value is indicative of lax voice, and a low NAQ value indicative of pressed or tense voice. NAQ has gained considerable popularity as a measure of the tense/lax dimension of voice variation.
Our earlier production studies based on a small amount of manually analyzed data have looked at the role of the voice source as part of sentence prosody, and have shown that voice source parameters are involved in the realization of accentuation (Ní Chasaide et al., 2013), focus (Yanushevskaya et al., 2010; Ní Chasaide et al., 2011) and declination (Ní Chasaide et al., 2015).
Yanushevskaya et al. (2010) found that focally accented syllables involve increased respiratory effort, with stronger excitation, a smaller Open Quotient (features essentially associated with tenser phonation). Similarly, a number of source parameters contributed to deaccentuation in the postfocal material of the utterance: falling normalized glottal frequency Rg, peak glottal flow Up, glottal excitation Ee and rising open quotient Oq. Ní Chasaide et al. (2015) found that declination—a downward trend of f0 over the course of an utterance is realized not only in f0 but also in other parameters of the source: e.g., there is declination in Ee, Rg and Cq (closed quotient, defined as 1−Oq) indicating a reducing level in the voice source excitation strength and increasing relative dominance of the lower end of the source spectrum (increasingly lax mode of phonation). Ní Chasaide et al. (2013) sought support for the Voice Prominence Hypothesis suggesting that prominence arises from the contribution of different source parameters, and that the extent to which a particular parameter contributes can vary. Thus, for example, accentuation of syllables which have no pitch prominence is signaled by other parameters of the source. Furthermore, speakers may use different strategies resulting in different combinations of source parameters when signaling prominence (Yanushevskaya et al., 2017).
The picture emerging is that prosody entails the modulation of the entire voice source (including f0) and that the different parameters appear to work synergistically in contributing to the realization of prominence, deaccentuation, etc. The findings in Ní Chasaide et al. (2013) suggested that even in the absence of f0 salience, other voice source parameters appear to take over in signaling prominence.
It can be noted that, although f0 and source parameters often covary, they can also be controlled independently of each other.
Source correlates of focus and prominence—Evidence from perception studies
As pointed out by van Heuven (2014), a reliable acoustic correlate is not necessarily an important perceptual cue to prominence: relatively small changes in terms of production in f0 might be highly perceptually salient. On the other hand, intensity, a highly reliable cue acoustically, may not emerge as a salient cue of prominence (van Heuven, 2014).
Although “it is currently still unclear which linguistic variables have the strongest impact on the perception of prominence” (Baumann and Winter, 2018), in general, the existing body of research suggests that f0 and to a somewhat lesser extent duration are of greatest perceptual importance in signaling prominence (van Heuven, 2014; Wagner et al., 2015; Gordon and Roettger, 2017; Kakouros et al., 2018).
A study into relative cueing power of f0 and duration in German (Niebuhr and Winkler, 2017) found that “an increase in f0 of < 1 semitone is needed in order to outweigh an increase in duration of 30% on a neighboring syllable.” Baumann and Winter (2018) studied how acoustic parameters, discrete prosodic categories and non-prosodic (e.g., semantic, syntactic) factors interact to signal prominence, a used a random forest classification algorithm to establish which of them were of relatively higher salience in a prominence identification task. While their findings support the general view that multiple cues to prominence interact, pitch accent position and type emerged as the most salient cue for prominence.
Intensity is generally viewed as a relatively minor cue to perceived prominence, stress/focus (e.g., Fant and Kruckenberg, 1994). According to van Heuven (2014), intensity has a perceptual effect only if its increase or decrease is concentrated in frequency bands above 500 Hz, thus affecting spectral slope.
The above views are not universally accepted. Some studies suggested that duration (Heldner, 1998) and loudness (Kochanski et al., 2005) may be more important cues to signaling prominence than f 0. As pointed out in a number of studies, cues operate synergistically. For example, Kuang and Liberman (2018) demonstrated that voice quality cues (spectral slope) are used by the listeners as an indicator of pitch range and affect their perception of pitch height. In a recent paper, Ludusan et al. (2021) explored the impact of CPP—Cepstral Peak Prominence (Hillenbrand et al., 1994), which they used as a measure of voice quality, alone and in combination with f0, duration and intensity, on perceived syllable prominence ratings by naïve and expert listeners in German. They report “stable but subtle” effect of voice quality cues on prominence perception: CPP cues are used by the listeners to identify prominent syllables and have a significant effect on prominence ratings. Random forest analysis showed, however, that duration and intensity (RMS) cues appeared more important than voice quality (CPP) and f0 for both expert and naïve participants.
While there have been many experimental studies demonstrating the role of f0 peaks in signaling prominence, accentuation and focus (Pierrehumbert, 1979; Terken, 1991, 1994; Gussenhoven et al., 1997; Hermes, 2006; Vainio and Järvikivi, 2006; Knight, 2008; Kuang and Liberman, 2018), there is little on the perceptual role of voice source adjustments other than f0. Fant and Kruckenberg (1996) wrote: “We are beginning to understand most of the basic phenomena but we lack systematic and sufficiently complete descriptions. A problem is that we have very little experience from perceptual experiments. Much work is needed to reach an insight in the relative perceptual salience of various components of a source rule system” (p. 45). This paper, we hope, will be among those to provide such an insight.
Voice prosody and prominence manipulation in synthesis
It has been shown that voice quality is an integral part of linguistic and paralinguistic prosodic signaling. Natural and intelligible speech synthesis must use “correct” prosody and must include voice quality variation (d'Alessandro, 2006).
Including voice quality features is desirable if the goal is to develop natural expressive speech synthesis. Voice quality manipulations have been implemented into speech synthesis with the goal of producing more expressive synthetic voices in a number of applications.
In d'Alessandro and Doval (2003), speech units within a concatenative speech synthesizer could be modified by manipulating the magnitude spectrum of the periodic source components, therefore changing the spectral tilt and glottal formant of the source. The method of expressive synthesis in Cabral and Oliveira (2006) uses pitch-synchronous time-scaling to modify the LPC residual of speech in order to transform f0 and other source parameters related to voice quality. Neutral speech samples were resynthesized using global transformations of voice source parameters derived from emotional speech data of several different affective states. Another method, developed by Cabral et al. (2011), allows for the control and transformation of the voice source in statistical parametric speech synthesis (SPSS) by removing the effects of the source from speech, and then replacing it with a synthetic LF-model based source signal. This parameterized signal can be transformed to change the voice quality. This method still requires a level of expert knowledge to carry out any transformations as it does not include a control interface. In addition, the synthetic speech produced by this system is sensitive to the errors in the analysis of the source. Control of voice quality along the tense-lax dimension in concatenative speech synthesis in Buchanan et al. (2018) was achieved by using LF-model pulses in place of the voice source. However, the transformations lead to a substantial drop in perceived naturalness.
Our earlier production and perception studies (Gobl et al., 2002; Gobl and Ní Chasaide, 2003b; Ryan et al., 2003; Yanushevskaya et al., 2018) involved detailed analysis and synthesis of many voice source parameters, many of which covary in natural speech production. Controlling such an array of parameters in synthesis would be very difficult, and would render the system unusable by all but experts in the field. One approach that has been used in speech synthesis applications is to reduce the number of parameters and to explore the use of a global waveshape parameter—the Rd parameter (Fant, 1995, 1997), also described in detail in Section The Rd parameter—to control voice quality modulations in synthetic speech.
Degottex et al. (2013) describe how the Rd parameter can be successfully used in the modification of breathiness in a HMM-based synthetic voice, while Huber and Roebel (2015) used variations in Rd to produce voice qualities from very tense to very lax. Sorin et al. (2017) used Rd manipulations as a means to transform the voice quality of synthetic speech by adjusting the source signal of voiced speech in a concatenative speech synthesis system, so that it became, what they called, semi parametric.
The aims of the current study
Exploring the use of the Rd parameter to control for the tense-lax dimension of voice quality in prosodic variation through perception experiments sets out to perceptually test the production findings, reviewed in the previous section, concerning the tense-lax source modulations associated with focus, accentuation and deaccentuation. It would also contribute to the development of flexible prosodically rich speech synthesis systems. It should be noted that in this study the voice quality alone is manipulated. This is done in order to demonstrate the importance of voice quality dimension of prosody—even in the absence of the f0 cues which typically accompany voice quality modulation in real speech.
Most models of prosody do not account for any voice source parameters other than f0. In exploring the perceptual contribution of voice quality dimensions (here the Rd parameter) to focal prominence, this study hopes to contribute to a deeper understanding of how f0 and other source parameters combine/covary, which is important in developing prosodic models accounting for voice quality variation.
This paper explores the perceptual importance of voice source adjustments which we have observed in sentences with variable location of focal accent. We further aim to elucidate whether such voice source adjustments on their own, without f0 salience, might be capable of shifting the perception of the location of focal accent within the sentence.
In this study a recording of the all-voiced sentence “We were away a year ago,” produced with broad focus, was analyzed and subsequently manipulated so that the two accentable syllables WAY and YEAR were subjectively deemed to have the same degree of prominence. This served as the baseline stimulus. Voice source characteristics were then further manipulated in ways that should in principle enhance the prominence of one or other of these syllables. Stimuli were constructed in which the voice source was manipulated in the potentially accentable syllables WAY and YEAR as well as in the postfocal part of the utterance.
The main research questions are:
(1) To what extent can such source manipulations (here Rd) induce the perception of focal accent on one or other syllable?
(2) Which of the source manipulations (or which combinations of source manipulations) are most effective in cueing focal accentuation?
In the experiments reported here, f0 did not vary across the stimulus set. This is not to suggest that f0 does not play a major role in cueing focus but rather an attempt to explore how voice factors other than f0 might be contributing, and to see whether source variations alone (without f0 variation) can alter the perception of where the focal accent lies in a phrase. The extent of source variation used in these stimuli falls well within the ranges observed in production studies.
Material and methods
Synthetic stimuli
Speech material
The stimuli were constructed on the basis of an all-voiced utterance “We were away a year ago” produced by a male speaker of Irish English. The utterance was elicited with broad focus (with the focal prominence realized by the speaker on YEAR) and was recorded as part of another study (Gobl et al., 2015), where further versions of the sentence with a focal accent on the syllables WAY and YEAR were also obtained and source characteristics analyzed. The utterance was manually inverse filtered using interactive inverse filtering software (Ní Chasaide et al., 1992; Gobl and Ní Chasaide, 1999). Voice source parameterization was subsequently conducted using the Liljencrants-Fant (LF) model (Fant et al., 1985).
Important voice source parameters
Important characteristics of the voice source pulse shape can be captured by source parameters, such as Ee, Ra, Rk, Rg, Oq and Up (see, e.g., Gobl and Ní Chasaide, 2010). Ee, the excitation strength, is the negative amplitude of the differentiated glottal waveform at the time point of maximum change in the waveform derivative. It relates to the overall strength of the glottal excitation. Ra is the normalized effective duration of the return phase, i.e., the interval for which the glottis remains open after the main excitation. Ra relates to the spectral slope: the higher the Ra value, the greater the spectral slope. Rk is a measure of glottal pulse symmetry, defined as the duration of the closing portion of the pulse relative to the duration of the opening portion. Thus, a lower Rk value means a more skewed pulse. Rg, the normalized glottal frequency, is a measure of the characteristic frequency of the glottal pulse (Fg), normalized to f0. Rg mainly affects the relative amplitudes of the low end of the source spectrum. Oq, the open quotient, is a measure of the open phase of the glottal pulse as a proportion of the glottal period. Oq can be determined entirely by Rg and Rk according to Oq = (1+Rk)/(2Rg). It thus excludes the return phase (captured instead by the Ra parameter). Oq mainly affects the amplitudes of the lower end of the source spectrum. Up, the peak glottal flow, is a measure of the maximum amplitude of the glottal flow pulse (Gobl et al., 2019), see also Figure 1.
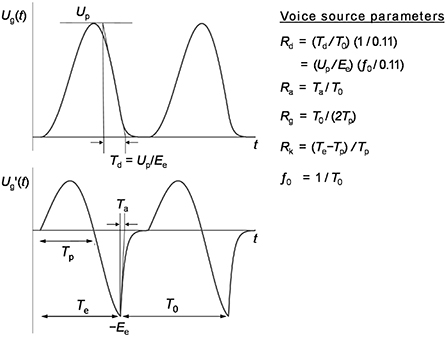
Figure 1. The LF-model extended to include the Rd parameter (adapted from Fant, 1995).
The source parameters tend to covary, and the global waveshape parameter Rd, described below, aims to take this covariation into account. It is a parameter that defines the overall shape of the LF-model pulse waveform capturing some of its important characteristics in one single measure. As a long-term aim is to explore the possibilities to control prosody in speech synthesis by using a limited set of parameters, the current work is focused mainly on Rd.
The Rd parameter
The Rd parameter was proposed in Fant (1995, 1997) as an extension of the LF model and “a data reduction scheme whereby the waveshape parameters Rk, Rg and Ra are collapsed into a single parameter Rd” (Fant and Kruckenberg, 1996, p. 47).
The Rd parameter is derived from f0, Ee and Up as follows:
where Ee is the excitation strength (measured as the negative amplitude of the differentiated glottal flow at the time point of maximum waveform discontinuity) and Up is the peak flow of the glottal pulse (Figure 1).
Note that Up/Ee is equivalent to the glottal pulse declination time Td during the closing phase of the glottal cycle (Figure 1). The scale factor (0.11−1) makes the numerical value of Rd equal to the declination time in milliseconds when f0 is 110 Hz (Fant, 1995).
Variation in Rd tends to reflect voice source variation along the tense-lax continuum; the values typically range between 0.3 (tense voice) to 2.7 (lax voice). Lower Rd values can be used to generate tenser voice quality (flatter spectral slope, stronger higher frequency harmonics). High values of Rd would result in a laxer voice and a steeper spectral slope.
Generally speaking, to synthesize the LF model glottal waveform, data for Rd, Ee, Ra, Rk and f0 parameters are required. An advantage of Rd is that other parameters of the glottal source can be predicted from Rd using formulas derived from linear regression analysis (Fant, 1995), e.g.:
A principal component analysis carried out on various voice source parameters in Yanushevskaya et al. (2017) suggested that Rd was important in describing cross-speaker differences in the source correlates of focus. As our earlier analyses of the speaker used here suggest shifts toward tenser phonation in focally accented syllables and toward laxer phonation in the post-focal material (Yanushevskaya et al., 2010, 2016a,b, 2017), the adjustments made to mimic these effects in our synthetic stimuli involved lowering the values of Rd in the potentially accentable syllables and raising it in the post-focal part of the utterance.
In the current study, Rd was used as a control parameter in synthesis and it is the Rd contours that were manipulated to generate synthetic stimuli. Based on the controlled changes in Rd, Ee was recalculated, while f0 and Up were kept constant (see Section Stimuli with source manipulations to enhance focal prominence).
Baseline stimulus
The f0 contour of the original broad focus utterance contained focal prominence on YEAR. Flattening of f0 and creating a sentence with equally non-prominent/ambiguously prominent syllables seemed appropriate given that the aim of the study was to test the ability of the voice source adjustments in the tense-lax continuum to signal focal prominence. As our earlier analytic studies showed Rd decrease in focal syllables and increase in the postfocal material, Rd contour was also flattened to remove these potential cues to prominence from the baseline stimulus.
In the baseline stimulus, the values of f0, Rd and Ee obtained in the inverse filtering and source parameterization analysis (Section Speech material) were first set to the global average values across the utterance (f0 = 120 Hz, Rd = 0.86, Ee = 69.8 dB).
As the overall impression of this stimulus was that it sounded rather tense, the values of f0 and Rd were adjusted to make it less tense and improve the naturalness: f0 was increased by 5% to 127 Hz and Rd was increased by 50% to 1.3. These changes also resulted in a lowering of Ee to 67.2 dB. This version of the utterance served as the baseline for further manipulations. There was only a minor difference in syllable durations: WAY 188 ms, YEAR 180 ms.
Stimuli with source manipulations to enhance focal prominence
Synthetic stimuli were constructed by manipulating the baseline stimulus as follows. Rd, Up, f0, formant parameters (frequencies and bandwidths) and timing values were loaded in from the text file of the manual inverse filtering data. As mentioned above, Rd and f0 means were calculated and adjusted (1.05 × f0 mean; 1.5 × Rd mean). The magnitude and timing of Rd “peaks” (located at the midpoint of the vowels in the syllables WAY and YEAR) in the baseline stimulus were modified and Rd in the post-focal material was adjusted in various combinations (described below). Rd contours were generated after manipulating the baseline stimulus and the f0 mean and Up mean values were used to calculate new Ee contours using:
Ra and Rk values were predicted from Rd according to Equations (2) and (3) respectively. However, since Rd is not actually a parameter of the LF model, we also needed to predict Rg. In this case we used the approximate formulas for the relationship between the two parameters derived from the amplitude-based expressions for Rk, Rg and Ei (the maximum positive value of the LF model pulse) in Gobl and Ní Chasaide (2003a).1
The obtained parameter values were then used to generate LF pulses, which were concatenated and filtered using the corresponding formant frequencies and bandwidths.
Increased phonatory tension tends to correspond to a drop in Rd; however, for the purpose of this paper we refer to such Rd drops as “peaks,” as it seems intuitively easier for a reader to associate increased phonatory tension with positive values. Note also that we will refer to the manipulated utterances in the text as WAY-manipulated and YEAR-manipulated ones, although the source manipulations concerned not just the potentially accentable syllables but the following material as well.
The ranges of values used in the manipulations were based on the voice analysis of the speaker in earlier production studies mentioned above (Yanushevskaya et al., 2010, 2016a,b; Ní Chasaide et al., 2011). f0 values were kept constant in all the syllables of the stimuli. The manipulations are described below and illustrated schematically in Figure 2.
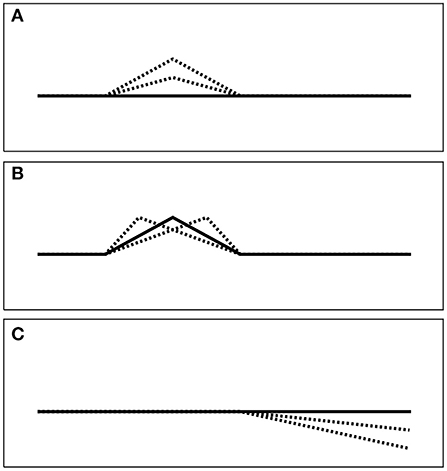
Figure 2. Schematic of types of manipulation in the synthesized stimuli: (A) peak magnitude; (B) peak timing (rate of change); (C) post-focal deaccentuation.
Peak height (magnitude) in focal syllables
Three levels of peak magnitude were used: no peak (=Baseline), low peak and high peak. The Rd values were set as follows: no peak, Rd = 1.3; low peak, Rd = 1.1; high peak, Rd = 0.9. These changes in Rd resulted in the following Ee values: no peak, Ee = 67.2 dB; low peak, Ee = 68.6 dB; high peak, Ee = 70.3 dB.
Peak timing
Stimuli were also generated where peak timing was changed relative to the vowel mid-points in the syllables WAY and YEAR. Two peak timing settings were used, in addition to the default baseline value: early peak and late peak. The values were shifted by 20% relative to the duration of the vowel. Early peak corresponds to faster increase toward the peak value and slower decrease of parameter values within the syllable; later peak corresponds to a slower rate of change of parameter values to the peak and a faster decrease of the values after the peak (Figure 2). These manipulations were added, as earlier studies of focal accentuation (Gobl, 1988; Yanushevskaya et al., 2010; Ní Chasaide et al., 2011) have suggested that source dynamics are heightened at the edge of the focally accented syllable.
Source deaccentuation in postfocal material
Three levels of deaccentuation in the postfocal material were used: no deaccentuation (=Baseline), shallow deaccentuation and steep deaccentuation. For the WAY-manipulated sentences, deaccentuation pertains to the entire sequence “a year ago,” whereas for the sentence where YEAR is manipulated, deaccentuation is necessarily limited to the syllables of “ago.”
The Rd values were as follows: no deaccentuation, final Rd value = 1.3; shallow deaccentuation, final Rd value = 1.52 (equivalent to a 20% increase in Rd); steep deaccentuation, final Rd value = 1.78 (equivalent to a 40% increase in Rd). These adjustments would result in two different rates of change for the WAY and YEAR stimuli due to the different duration of post-focal material. Thus the rate of change was for WAY shallow 0.5 units/s, for WAY steep 1 unit/s, for YEAR shallow 1.35 units/s, for YEAR steep 2.7 units/s. These changes in Rd resulted in following changes is Ee: no deaccentuation, final Ee value = 67.2 dB; shallow deaccentuation, final Ee value = 65.6 dB; steep deaccentuation, final Ee value = 64.3 dB.
Stimuli were generated in which peak magnitude, peak timing and deaccentuation were manipulated individually and in combinations. The combinations of manipulation types are shown in Table 1. Overall, 20 combinations were synthesized for each of the WAY-manipulated and YEAR-manipulated sentences. The total number of stimuli used in the listening tests was 41 (2 syllables × 20 combinations + 1 baseline stimulus). It should be noted that differences in peak magnitude and peak timing correspond to the rate of signal change. The extent of manipulation is within the ranges found in natural human speech production. Informal auditory analysis by the authors suggested adequate quality of the utterances and audible shifts in prominence in the manipulated utterances.
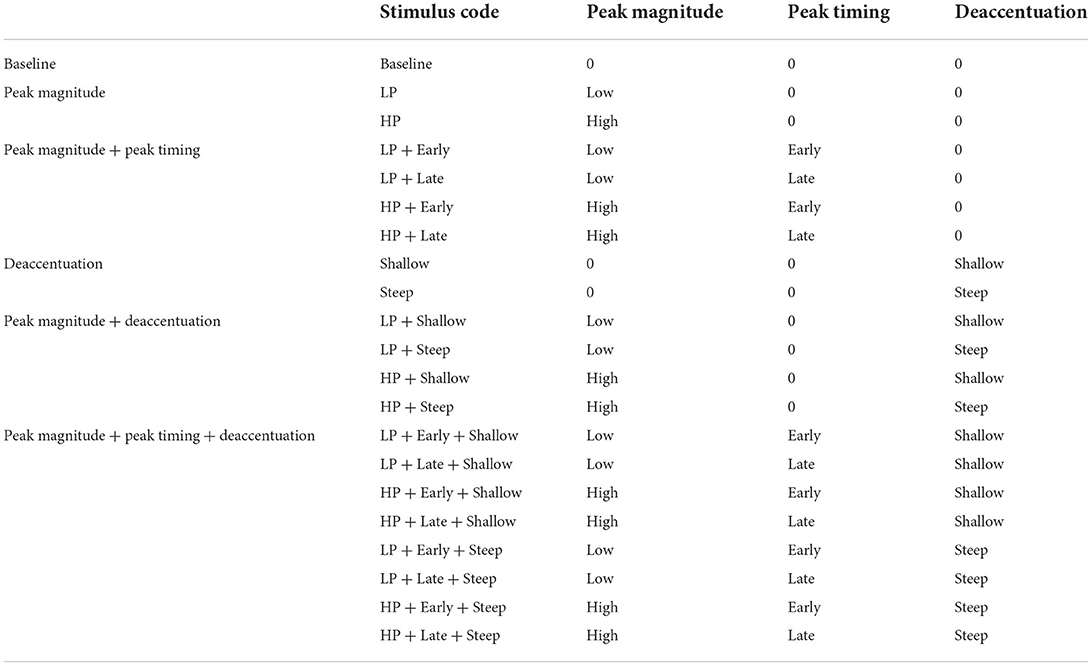
Table 1. Types of manipulation and their combinations in synthetic stimuli.
Listening tests
Two separate online listening tests were conducted in which the 41 synthesized stimuli were presented to participants in random order. In both tests, the participants were advised to use high quality headphones during the tests. The participants were informed that they were going to hear utterances in which the syllables WAY or YEAR may or may not be realized as prominent. They were asked to listen to each stimulus as many times as they wish and to complete several tasks.
Test 1 tasks
In the first test, the participants' tasks were as follows:
1) Select the prominent syllable (“Which word is the most prominent?” WAY, YEAR, Neither);
2) For the prominent syllable, indicate the magnitude of prominence, using a slider on a continuous visual analog scale;
3) Indicate how confident you are (on a continuous visual analog scale, “not at all confident—very confident”);
4) Indicate how natural the utterance sounds (on a continuous visual analog scale, “not at all natural—very natural”).
Test 2 tasks
In the second listening test, the participants were asked to mark the relative prominence of all the syllables in the utterance by adjusting sliders on a continuous visual analog scale, similar to the setup in Eriksson et al. (2001).
As in Test 1, the participants were asked to rate the naturalness of the stimuli and to indicate how confident they were in their judgment on a continuous visual analog scale.
The first experiment was completed by 29 participants; the second experiment was done by 28 participants. Each test took ~20 mins to complete. The experimental interface for both tests is illustrated in Figure 3.
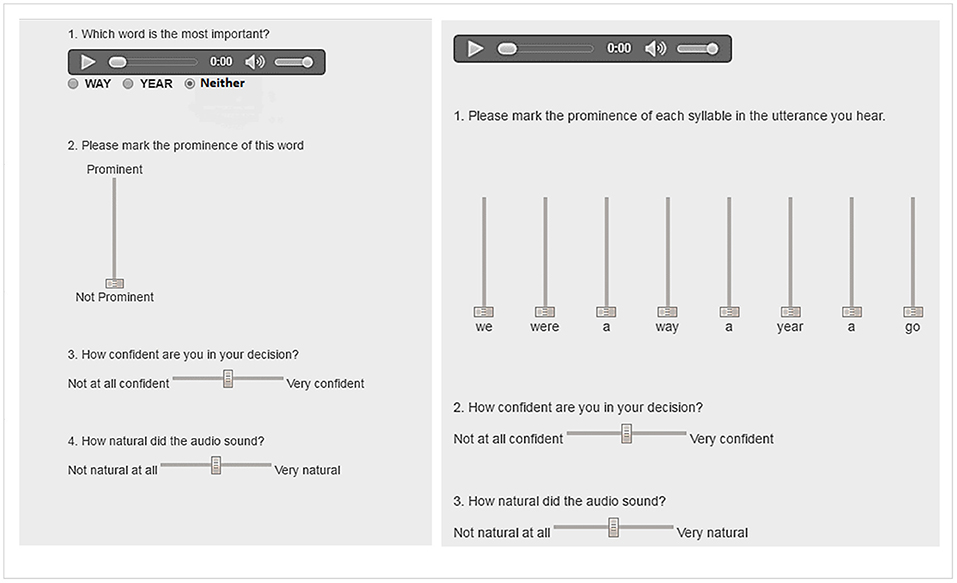
Figure 3. Experimental interface for Test 1 (left panel) and Test 2 (right panel).
The tests were different in terms of the complexity of the task. Test 1 required a simple choice between the two syllables to indicate a more prominent one and the extent of its prominence. Test 2 required that participants assess prominence relative to the overall utterance and paying attention to the adjacent syllables. While our study examines the effect of source manipulations on signaling focal accentuation, we asked our participants to indicate perceived prominence of the syllables rather than presenting them with mini-dialogue scenarios where a narrow focus could be elicited. This decision was made to simplify the task for the participants and reduce potential listener fatigue.
Expectations
Our expectation was that the WAY and YEAR syllables in the sentences where the voice source for those syllables and for the following material was systematically manipulated would tend to be identified as more prominent relative to the baseline. We also hypothesized that the degree of prominence perceived on the targeted syllable would correlate with the magnitude of the source manipulation carried out, e.g., the higher the magnitude of Rd peak (= the lower the Rd and the tenser the voice) the more prominent the syllable would be rated. Similarly, steeper deaccentuation was expected to contribute more than the more shallow kind. Furthermore, it was expected that the combined extreme manipulations (e.g., high peak combined with steep deaccentuation) would produce higher prominence magnitude ratings compared to individual manipulations.
Results
Listening Test 1
Analysis of response count data
Table 2 shows the summary confusion matrix of perception of the stimuli in Test 1. The results show a clear difference in how the prominence of WAY-manipulated and the YEAR-manipulated stimuli was rated. Overall, the WAY-manipulated sentences (the sentences in which the WAY syllable and following material were manipulated) were identified as having prominence on WAY in most cases (64%). For the YEAR-manipulated sentences, listeners were as likely to hear prominence on WAY (37%) as on YEAR (39%). The Baseline stimulus was intended to have no prominence on either WAY or YEAR; the results of the listening test appear to suggest that that was indeed the case.
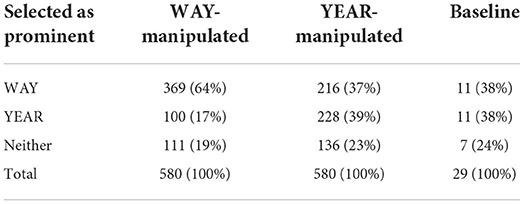
Table 2. Summary confusion matrix of perception of the stimuli in Test 1 (count, %).
The results of Test 1 for the individual stimuli are shown in Figure 4. As clear from Figure 4, there is a bias toward WAY: more stimuli were selected as having a prominent WAY syllable in the WAY-manipulated sentences than YEAR in the YEAR-manipulated sentences. The stimuli for which 70% or more of the listeners identified WAY as prominent were mainly those with high Rd “peaks” (=tenser voice) and steep postfocal deaccentuation (=greater increase in voice laxness). Interestingly, stimuli LP+Steep and Steep were frequently selected as prominent in the way-set and thus were quite effective in prominence cueing. This points at importance of postfocal deaccentuation in signaling prominence. Conversely, the stimuli which include manipulations involving a low peak or shallow deaccentuation were identified as prominent by fewer participants.
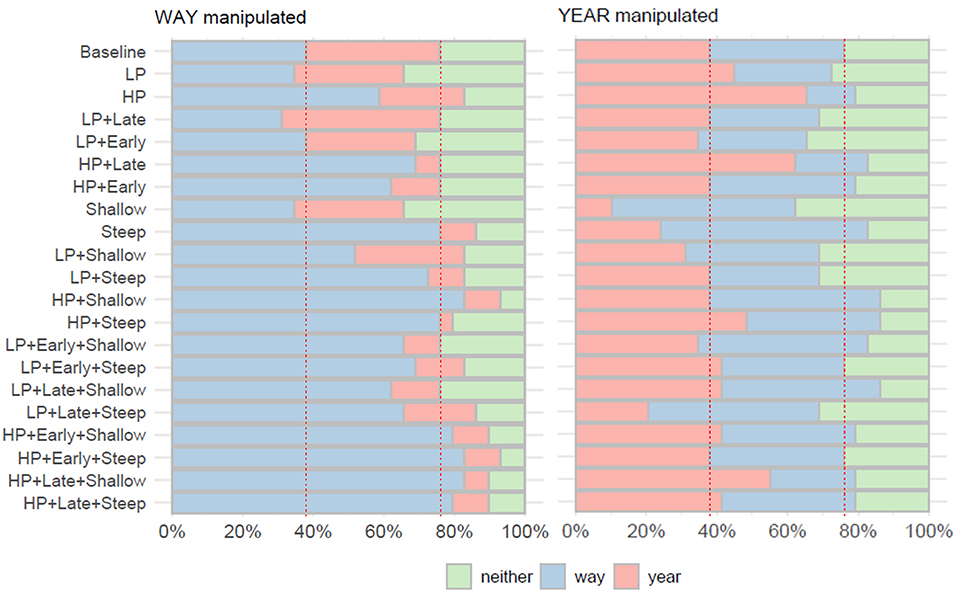
Figure 4. Frequencies with which syllables WAY, YEAR or neither were identified as prominent in the synthetic stimuli. LP, low peak; HP, high peak; Late, late peak; Early, early peak; Steep, steep deaccentuation; Shallow, shallow deaccentuation (see also Table 1). Red dotted lines indicate results for the Baseline stimulus.
For the YEAR-manipulated stimuli, results were very different: here, there were only relatively minor shifts from the results obtained by the baseline stimulus. In the YEAR-manipulated set, none of the stimuli was selected as having prominence on YEAR by 70% or more of the participants.
Multinomial logistic regression analysis was performed to explore the relationship between the types of manipulation (peak magnitude, peak timing, deaccentuation) and the likelihood of choice of the manipulated syllable as prominent. The analysis was conducted in R (R Core Team, 2019) using mlogit package (Train, 2009).2 The analysis was conducted separately for the WAY-manipulated and the YEAR-manipulated stimulus sets. The reference category was “neither.” The parameter estimates are shown in Tables 3A,B.
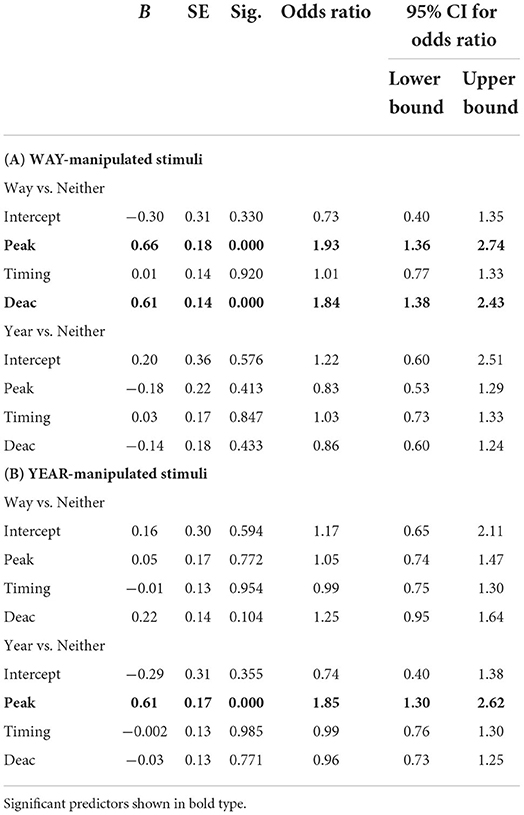
Table 3. Results of multinomial logistic regression analysis.
Way-manipulated stimuli
Addition of peak magnitude (Peak), peak timing (Timing) and deaccentuation (Deac) as main predictors to a model that contained only the intercept significantly improved the fit between model and data, χ2 (6) = 56.01, McFadden R2 = 0.05, p < 0.001. Significant unique contributions were made by Peak, χ2 (2) = 27.64, p < 0.001, and Deac χ2 (2) = 35.63, p < 0.001, but not Timing χ2 (2) = 0.04, p = 0.982. As the peak height and the steepness of deaccentuation increase, the odds of the WAY syllable being selected as prominent (relative to “neither”) also increase (multiplicatively by 1.93 and 1.84 respectively).
Year-manipulated stimuli
Similar to the above, including peak magnitude (Peak), peak timing (Timing), deaccentuation (Deac) as main predictors in the model compared to the intercept only model significantly improved the model fit, χ2 (6) = 25.72, McFadden R2 = 0.02, p < 0.001. Significant unique contributions were made only by Peak, χ2 (2) = 17.58, p < 0.001. The parameter estimates are shown in Table 4. The reference category was “neither.” As the peak magnitude increases, the YEAR syllable is increasingly more likely to be selected as prominent, multiplicatively by 1.85. Deaccentuation did not emerge as an important factor, most likely because of the difference in duration of postfocal material in the WAY-manipulated and YEAR-manipulated stimuli: four syllables vs. two syllables respectively.
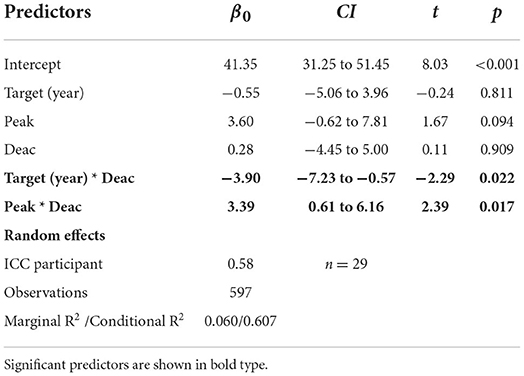
Table 4. Estimated coefficients, confidence intervals and t values for the mixed effect model fitted to the perceived prominence magnitude data (Test 1).
Magnitude of perceived prominence
Figure 5 shows the mean magnitude of perceived prominence of WAY- and YEAR-manipulated syllables across different stimuli. Only cases where manipulated WAY and YEAR were identified as prominent by the participants in the listening test are shown. At a glance, the magnitude mean values of perceived syllable prominence range between about 40 and 70 (=no extreme values); perceived prominence magnitude is higher for the way-set than for the year-set overall (Figure 5B).
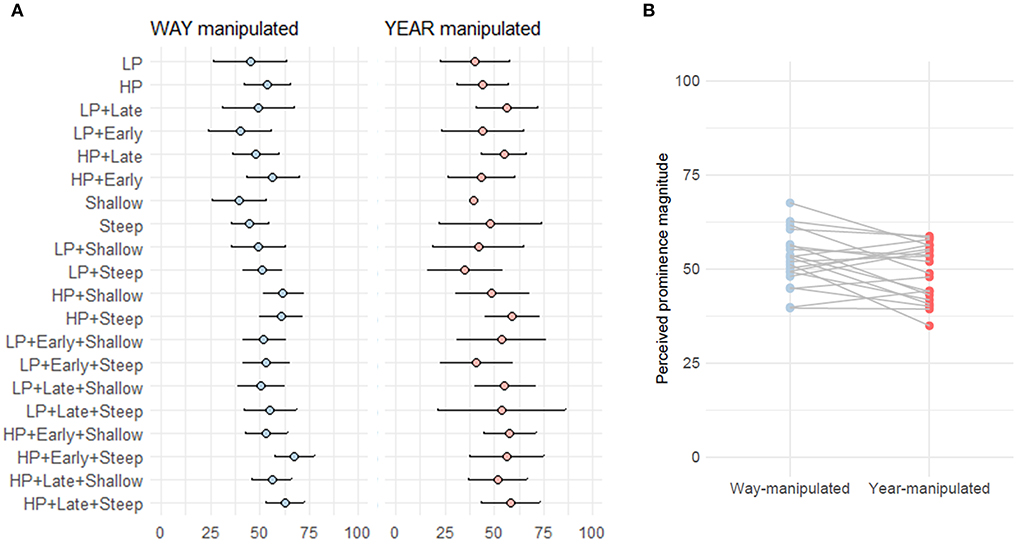
Figure 5. Perceived prominence of manipulated syllables in Test 1. Shown are prominence magnitude mean and 95% CI of stimuli with different types of manipulation in Test 1 (A) and general spread of point estimates (means) (B).
To test if the type of parameter manipulation has an effect on the magnitude of perceived prominence of the manipulated syllable, a series of linear mixed effect model analyses were conducted. The cases when neither syllable was selected in the listening test as prominent were excluded from the analysis.
Analyses were conducted in the R environment (R Core Team, 2019) using the lme4 (version 1.1-29) package (Bates et al., 2015) for model fitting. The lmerTest package (Kuznetsova et al., 2017) was used for step-down model simplification by eliminating non-significant effects and for calculating denominator degrees of freedom using Satterthwaite's approximations. The models were fit by maximum likelihood (ML) method. The initial model included Peak, Timing, Deaccentuation (Deac) and Target (=manipulated syllable) as the main predictor variables (fixed effects) as well as their interaction; random effects included by-subject random intercepts: [Magnitude~Target*Peak*Timing*Deac +(1|Participant)]. The final reduced model included Target, Peak and Deaccentuation as the fixed predictors, the Target:Peak and Target:Deac interactions and by-subject random intercepts: [Magnitude~Target+Peak+Deac+(1|Participant)+Target:Peak+Target:Deac]. ICC (indicative of the correlation of the items within a cluster) as well as marginal and conditional R2 statistics (Nakagawa et al., 2017) were obtained using sjPlot package (Lüdecke, 2018). Marginal R2 describes the proportion of the variance explained by the fixed effects; conditional R2 indicates the variance explained by both fixed and random effects.
The summary of the estimated coefficients of the mixed effect model fitted to the magnitude of perceived prominence values obtained in the listening test is given in Table 4; values of perceived prominence predicted by the model are shown in Figure 6. The amount of variance explained by both fixed and random effects amounted to over 60%. Fixed effects account for only about 6% of the variance. Analysis of the fixed effects suggests an association between perceived prominence and manipulations involving Rd peak height and postfocal deaccentuation: increasing peak height and the steepness of deaccentuation results in an increase in syllable prominence. In other words, changing Rd toward tenser phonation in the focal syllable and increasing the extent of postfocal deaccentuation by changing Rd more toward laxer phonation results in an increase in the magnitude of perceived prominence of the target syllable. This effect is stronger in WAY than in YEAR. It should be noted, however, that the size of the effect is very small.
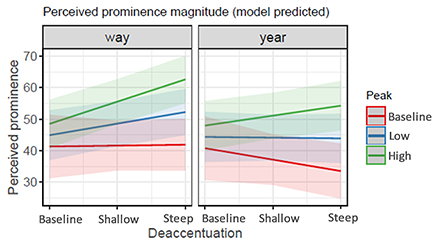
Figure 6. Predicted values of perceived prominence (Test 1). Shaded areas represent 95% confidence intervals.
The naturalness and the confidence ratings are discussed for both tests in Section Stimuli naturalness and confidence ratings.
Listening Test 2
As mentioned earlier in the description of methodology (Section Listening tests), the same 41 stimuli were presented to another group of participants (n = 28) in Test 2. In this test, rather than deciding on the prominence of either WAY or YEAR, participants were asked to mark the relative prominence of all the syllables in the utterance on a continuous visual analog scale. They were also asked to rate the naturalness of the stimuli and to indicate how confident they were in their ratings.
The obtained magnitude ratings were first normalized [0, 1] to account for differences in the use of the visual analog scale range by individual participants. These normalized values were used in the subsequent analyses.
General observations
Figure 7 (top panels) shows the mean normalized magnitude of perceived prominence of the syllables in the synthetic stimuli (blue lines = WAY-manipulated stimuli; red lines = YEAR-manipulated stimuli) relative to the baseline stimulus (black). Although the representation in Figure 7 does not allow for detailed comparison of individual types of manipulation, it is clear that practically all stimuli of the WAY-manipulated set yielded perceptual enhancement of WAY relative to the baseline. However, only some stimuli were effective in signaling prominence in the YEAR-manipulated set (so that YEAR actually sounded more prominent than WAY).
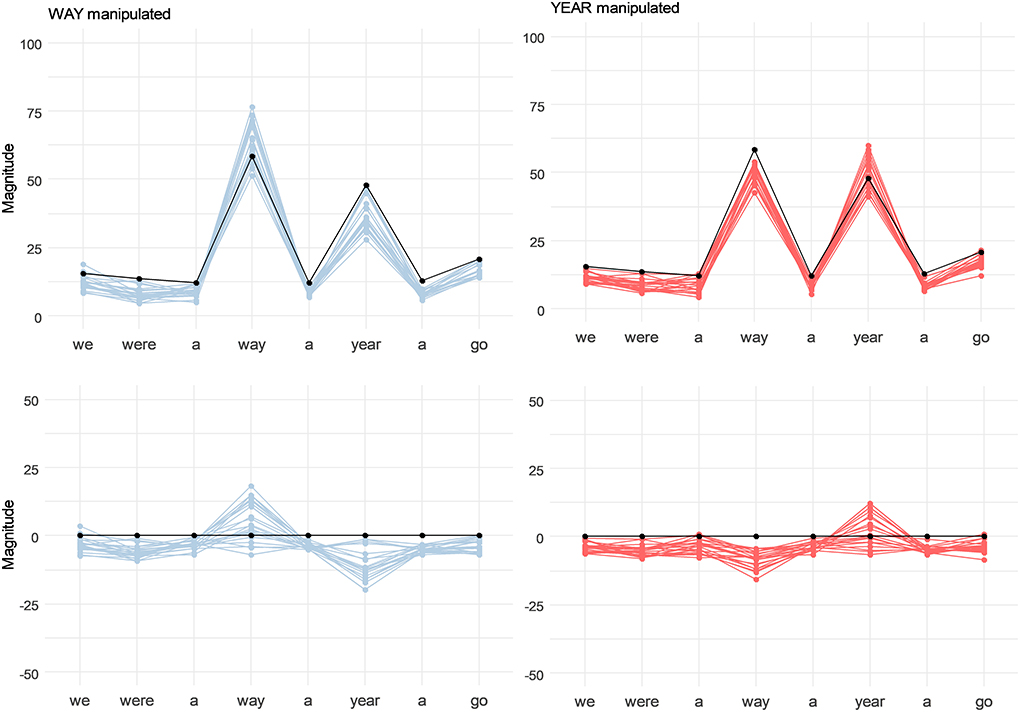
Figure 7. Perceived prominence of all syllables in synthetic stimuli in Test 2. (Top panels) The contours for individual stimuli averaged across participants; baseline stimulus is shown in black. (Bottom panels) Same contours normalized to the baseline.
The baseline stimulus where both WAY and YEAR were prosodically flattened in terms of f0, Rd (see also Section Baseline stimulus) was perceived as having somewhat more prominent WAY. This bias toward higher prominence of WAY also affects the perception of YEAR-manipulated stimuli. This might go some way to explain why relatively few of the stimuli from the YEAR-manipulated set emerged as effective in “tipping the balance” of perceived prominence from WAY to YEAR.
It is worth noting also that the prominence of the unstressed syllables before and after focally accented syllables was adjusted by the participants to a level below that of the corresponding unstressed syllables in the baseline stimulus.
As the baseline stimulus still conveyed information on the syllable prominence (more prominent WAY than YEAR), we normalized the prominence magnitude contours further to remove the undesirable characteristics of the baseline and to be able to more clearly observe the effect of controlled Rd manipulations. This was done by subtracting the prominence magnitude of the baseline from the prominence magnitude ratings of each speaker. It is clear from these normalized prominence contours (Figure 7, bottom panels) that in both way- and year-sets most of the stimuli are rated as having prominence on the target syllable (which is rated above the baseline) with the non-prominent syllable receiving prominence magnitude below the baseline.
Performance of individual stimuli
A more detailed treatment of the individual stimuli is given in Figure 8 which shows the baseline-normalized difference in perceived prominence of WAY and YEAR syllables within the same stimulus (essentially the figure captures whether and to what extent the prominence balance is tipped toward WAY or YEAR in the manipulated syllables). The bars in Figure 8 show the difference in prominence magnitude of WAY and YEAR, so when the WAY is perceived as more prominent, the values are positive and when the YEAR is more prominent the values are negative. The color coding indicates what syllables were manipulated to generate prominence.
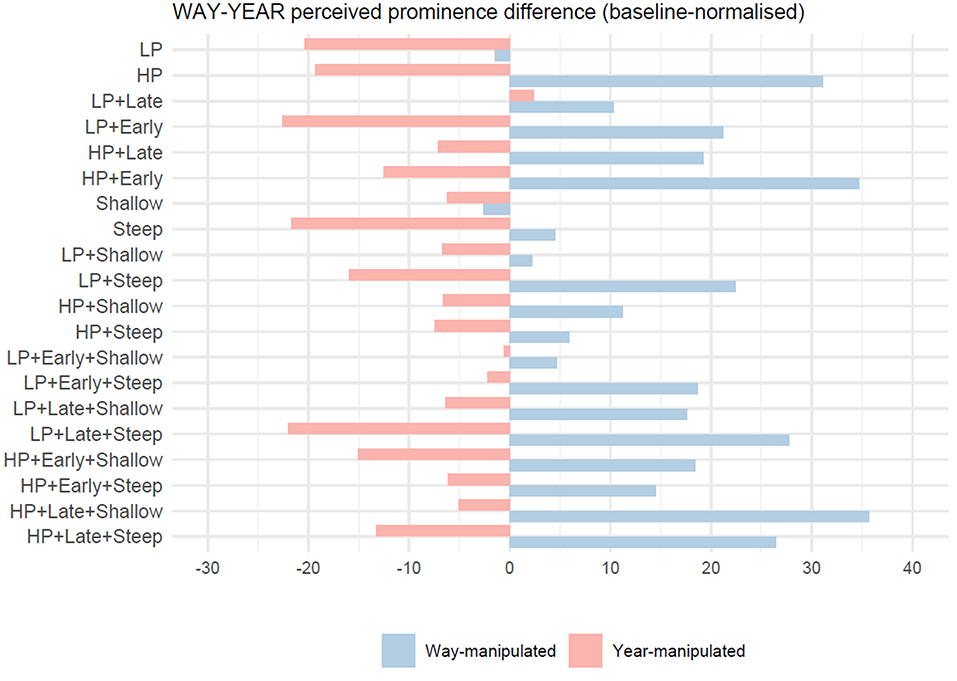
Figure 8. The difference in perceived prominence of WAY and YEAR syllables within the same stimulus, baseline-normalized (Test 2).
Our initial model in the mixed-effect analysis included Manipulation and Syll as fixed predictors with by-participant random intercept diff_val ~ Syll + Manipulation + (1|Participant). A likelihood ratio test indicated that including Syll as a fixed factor to the Manipulation-only model significantly improved the model fit χ2 (1) = 356. 9, p < 0.001 (unsurprisingly). However, due to data sparsity this model was found rank-deficient. We thus conducted the analysis separately for the way- and year- sets; linear mixed-effect models were fit to the baseline-normalized WAY-YEAR difference values as a dependent variable and Manipulation as the fixed factor; a by-subject intercept was included as random effect. Analyses were conducted in the R environment (R Core Team, 2019) using the lme4 (version 1.1-29) package (Bates et al., 2015) for model fitting. Model estimates are shown in Table 5 and Supplementary Figure 1.
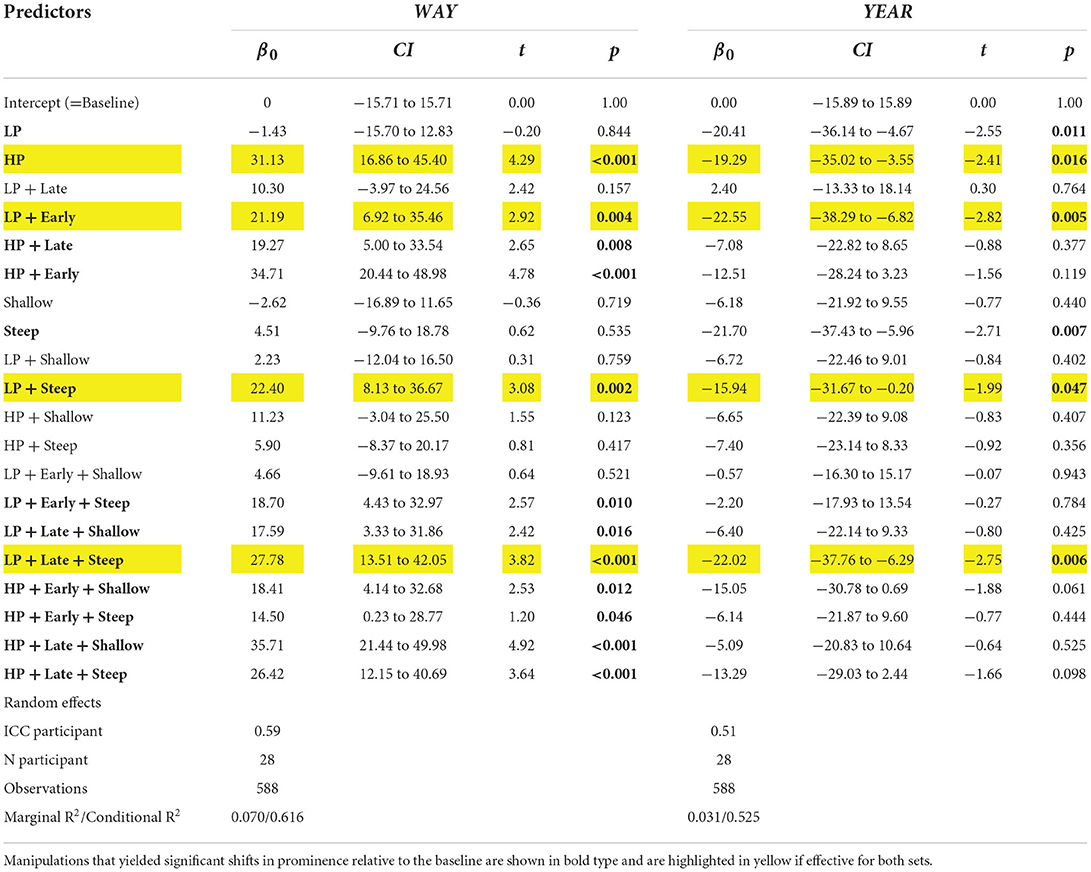
Table 5. Estimated coefficients, confidence intervals and t values for the mixed effect model with manipulation as a fixed factor fitted to the perceived prominence magnitude data (baseline-normalized) in Test 2.
As noted earlier, there is a clear difference between the effect of voice source manipulation on the relative prominence of WAY and YEAR in the two stimulus sets, with a bias toward WAY. Twelve out of twenty stimuli in the WAY-manipulated set generated prominence on WAY significantly above the baseline. Stimuli containing high peak (HP) and steep deaccentuation appear to have the largest effect on prominence (see Table 5; Supplementary Figure 1).
In the YEAR-manipulated stimulus set, only six out of 20 stimuli were perceived as having YEAR more prominent than WAY. These are LP, HP, LP+Early, Steep, LP+Steep, LP+Late+Steep. Stimuli containing high peak (HP) are not predominant among those enhancing prominence for YEAR, four out of six stimuli contain low peak (LP) with or without further manipulations such as peak timing and deaccentuation. Against expectations, combined stimuli containing HP (=higher increase in phonatory tension) did not yield higher prominence enhancement compared to the LP ones.
Comparing the results of mixed-model analysis in Table 5, stimuli that yielded enhancement of perceived prominence in the target syllables in both manipulated sets (highlighted in yellow in Table 5) are: HP, LP+Early, LP+Steep, LP+Late+Steep. Apart from HP, all these stimuli involve additional adjustments of either peak timing or rate of deaccentuation. It should be noted, however, that the effect of the Rd manipulations is small (low marginal R2 values) accounting only for 7% (way-set) and 3% (year-set) of the variance.
Stimuli achieving significant increase in the prominence of the target syllable relative to the baseline were largely different for WAY and YEAR sets. The effect of the location of the manipulated syllable in the utterance and consequently the length of the postfocal material appears to be of importance. It is also possible that increased phonatory tension of the voice is not effective in cueing focal accentuation for syllables located toward the end of an utterance because it runs counter to the overall source deaccentuation/declination (which may be associated with laxer phonation or an increase in creaky phonation) and needs to be adjusted accordingly.
Perceived prominence and types of manipulation
Mixed model analysis was conducted to explore if and to what extent perceived prominence of the manipulated syllables can be predicted from the types of manipulation (peak magnitude, peak timing, deaccentuation). The analyses were conducted separately for way-manipulated and year-manipulated sets in the R environment (R Core Team, 2019) and followed the same procedure as described above for Test 1 (Section Magnitude of perceived prominence). The lmerTest package (Kuznetsova et al., 2017) was used for step-down model simplification by eliminating non-significant effects and for calculating denominator degrees of freedom using Satterthwaite's approximations. The models were fit by the maximum likelihood (ML) method.
The initial model included the WAY-YEAR prominence difference as the dependent variable, Peak, Timing and Deac as fixed predictors as well as their interactions; random effects included by-subject random intercepts [diff_value~ Peak*Timing*Deac +(1|Participant)].
The final reduced model for the way-set excluded a number of non-significant interactions: [diff_value_w ~ Peak + Deac + Timing + (1 | Participant) + Peak:Deac + Deac:Timing]; for the year-set the model was not reduced. Estimated coefficients of the mixed effect models are shown in Table 6.
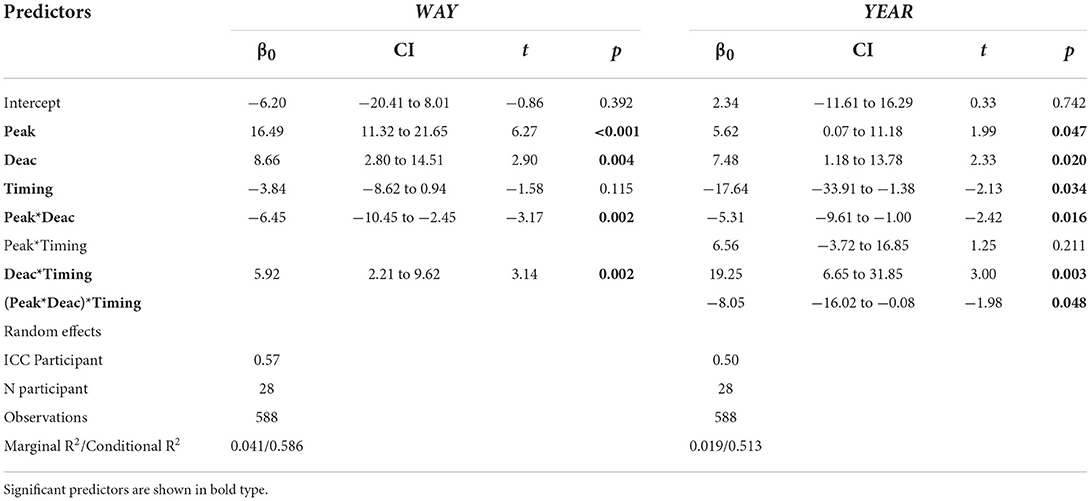
Table 6. Estimated coefficients, confidence intervals and t values for the mixed effect model with types of manipulation as fixed factors fitted to the magnitude of to the perceived prominence magnitude data (baseline-normalized) in Test 2.
Fixed effects (marginal R2) are very small accounting for 4% of the variance in the way-set and 2% of the variance in the year-set. Random and fixed effects (conditional R2) accounted for about 59 and 51% of the variance in the way-set and year-set data respectively. Analysis of the fixed effects suggests an association between manipulations which involved peak height and postfocal deaccentuation and an increase in the perceived difference in the relative prominence of WAY and YEAR (Peak and Deac were found to be important predictors of prominence magnitude in Test 1 also). Two-way interactions Peak:Deac and Deac:Timing were significant in both sets; three-way interaction Peak:Deac:Timing was significant only in the year-set.
The main effects of manipulations on perceived prominence of the target syllables in the two sets are shown in Figure 9. As clear from Figure 9, the effect of manipulations varies with the location of the manipulated syllables in the utterance (and also with the length of the postfocal deaccentuation); the effect is much stronger in the WAY-manipulated utterances than in the YEAR-manipulated ones.
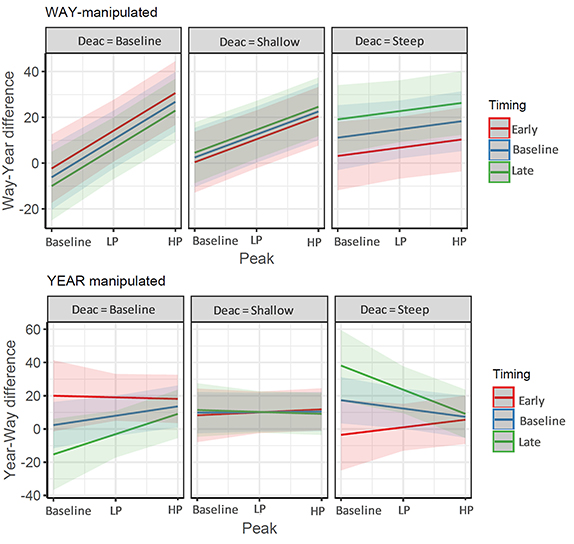
Figure 9. Predicted values of difference in the relative prominence of WAY and YEAR in the same utterance (Test 2). Shown are the interactions of peak, timing, deaccentuation types of manipulations. Shaded areas represent 95% confidence intervals.
In WAY-manipulated utterances, as the peak magnitude increases, the perceived prominence of the syllable increases. The extent of the increase diminishes with the increase in the steepness of deaccentuation (Peak:Deac interaction). A delay in the Rd peak (Timing = Late) appears to enhance the prominence (Deac:Timing interaction). In YEAR-manipulated utterances, the observed trend is different from the way-set and there is a clear three way interaction effect. As the height of the Rd ‘peak' increases, the prominence of the manipulated syllable increases, but the trend is counterbalanced and even reversed (for early peaks) with an increase in the steepness of deaccentuation (Peak:Deac:Timing interaction).
Comparing stimuli performance across the two tests
As the tasks for the two tests were rather different—the first one required a forced choice decision selecting a prominent syllable (WAY, YEAR, Neither) while the second one asked the participants to mark the prominence of all the syllables in the manipulated utterances, only very broad comparison of the performance of individual stimuli across the two tests can be made. One would expect that the stimuli most frequently selected by participants as prominent in Test 1 would also be the ones resulting in significant enhancement of prominence in Test 2. The results are very different for way- and year-sets (Supplementary Table 1). There are quite a few stimuli that were frequently selected as prominent in Test 1 and also achieved significant enhancement of prominence in Test 2 in the way-set, but none of the stimuli was as effective in the year-set. Four stimuli, HP, LP+Early, LP+Steep, LP+Late+Steep, significantly enhanced the prominence of the manipulated syllable in Test 2 in both way- and year- sets, but the year-set ones were not selected in 70% of the cases in Test 1. Although this 70% cutoff is rather arbitrary, it shows again a very clear bias toward the WAY syllable.
Stimuli naturalness and confidence ratings
The overall mean naturalness ratings of the stimuli and the confidence in ratings were as follows:
Test 1—Naturalness 43.3 (SD = 25.7, n = 597), confidence 64.7 (SD = 22.8, n = 597). Pearson's correlation between naturalness and confidence r(595) = 0.22, t = 5.49, p < 0.001 (significant but weak correlation).
Test 2—Naturalness 50.5 (SD = 21.9, n = 1, 148), confidence 59.1 (SD = 21.0, n = 1, 148). Pearson's correlation between naturalness and confidence r(1145) = 0.17, t = 5.98, p < 0.001 (significant but weak correlation). Unsurprisingly, there is a significant, albeit weak, positive correlation between naturalness and confidence ratings in both tests.
Fitting a mixed-effect model to naturalness ratings in Test 1 [Naturalness ~ Target + (1|Participant)] showed that Target syllable is not a significant predictor of stimulus naturalness. Refitting the model to Peak*Timing*Deac as fixed predictors with a random by-participant intercept (Supplementary Figure 2) showed that naturalness ratings tend to decrease as the extent of individual manipulations increases, e.g., high peak or steep declination may signal higher prominence but may not necessarily sound natural. However, the results also showed significant Peak*Timing and Timing*Deac interaction as well as three-way Peak*Timing*Deac interaction.
Discussion
Overall summary of results
In this paper we describe two perception experiments exploring the perceptual salience of voice source adjustments in signaling focal prominence in the absence of f0 variation. The sentence “We were away a year ago” was analyzed using manual interactive inverse filtering and source parameterization and subsequently manipulated to flatten its prosody in terms of f0 and Rd, yielding the baseline stimulus. Stimuli were then constructed in which the voice source (the Rd parameter) was manipulated in order to achieve focal prominence on either WAY or YEAR syllables. The manipulations involved decreasing the Rd parameter (tenser voice) in the syllables WAY or YEAR and increasing it (laxer voice) in the following material, in order to mimic postfocal deaccentuation. The extent of Rd manipulation varied in terms of the height of Rd “peak,” its location within the syllable (early or late) and extent of deaccentuation. f0 remained constant across the stimulus set. The stimuli were presented to participants in two listening tests. In Test 1, the participants were asked to identify which of WAY or YEAR was the most prominent, with a Neither option where listeners could not decide between them. In Test 2, the participants were asked to indicate the relative prominence of all the syllables in the utterance on a visual analog scale.
Our main research questions were: (1) To what extent can such source manipulations induce the perception of focal accent on one or other syllable? (2) Which of the source manipulations (or which combinations of source manipulations) are most effective in cueing focal accentuation? Our results suggest that voice source (here Rd parameter) manipulation, even in the absence of f0 salience, produced the desired effect of shifting focal prominence to the manipulated syllable, although in this study there was a clear bias toward the WAY syllable. Not all manipulations or their combinations achieved cueing of prominence and the stimuli effective in cueing prominence were not identical in the two tests. Increasing the height of the Rd “peak” (changing Rd toward tenser phonation in the focal syllable) and increasing the extent of postfocal deaccentuation by changing Rd toward laxer phonation appear to be particularly effective and resulted in an increase in the magnitude of perceived prominence of the target syllable. This effect is stronger in WAY than in YEAR. The naturalness of the stimuli appears to decrease with an increase in the extent of source manipulation.
Expectations/hypotheses against findings
Our expectation was that the syllables WAY and YEAR in the sentences where the voice source for those syllables and for the following material was systematically manipulated would tend to be identified as more prominent. We also expected that the degree of prominence perceived on the targeted syllable would correlate with the extent of the source manipulation carried out, e.g., the higher the Rd “peak” (and the tenser the voice), the more prominent the syllable would be rated or conversely, greater Rd deaccentuation would be correlated with greater focal prominence on the preceding syllable. Furthermore, it was expected that the combined manipulations would produce higher prominence ratings compared to individual manipulations. We expected broad similarities across the two tests. Our initial hypotheses did not include any predictions about the effect of the location of the potentially accentable syllable in the utterance.
Expectation: Syllables where systematic manipulation was done are perceived as prominent
As expected, syllables where systematic manipulations were done were perceived as prominent by the participants of the listening tests, but there was a strong bias toward WAY: all stimuli in the way-set were perceived with prominence on the target syllable in both tests and above the baseline.
This was not the case for the year-set: in Test 1, the perception of YEAR prominence was closer to chance, and none of the stimuli were perceived as prominent by 70% of participants or more. In Test 2, only 6/20 stimuli were perceived as having higher prominence on YEAR than WAY relative to the baseline (Supplementary Table 1).
Expectation: The degree of prominence perceived on the targeted syllable correlates with the extent of manipulation; combined manipulations are more effective
The results (Test 2, Figure 9) suggest that the extent of manipulation (peak height, steepness of deaccentuation) has an effect on the magnitude of perceived prominence, but this effect is different for the two target syllables. In WAY-manipulated utterances, perceived prominence increased with the increase in the Rd “peak” and was further enhanced by a delay in the Rd “peak”. The addition of a steeper deaccentuation, however, diminished this effect. In YEAR-manipulated utterances, the observed trend is different from the way-set and there is a clear three-way interaction effect of Peak, Timing and Deaccentuation. As the height of the Rd “peak” increases, the prominence of the manipulated syllable increases, but the trend is counterbalanced and even reversed (for early peaks) with an increase in the steepness of deaccentuation (Peak:Deac:Timing interaction). It is worth noting here that the extent of manipulation appears to have a negative effect on the naturalness of the stimuli.
Although the results seem to suggest that combining more extreme Peak and Deaccentuation enhances prominence cuing, there is no strong consistent evidence in our data that combined manipulations are more effective than individual ones. For example, HP, HP+Early and HP+Late+Shallow were equally effective in signaling prominence of WAY in Test 2 (the difference between them is not significant). In the year-set, the Steep stimulus was as effective as LP+Late+Steep or LP+Early. In fact, HP was the only stimulus that was consistently effective in signaling prominence across the two sets. The timing of the Rd “peak” appear to be of perceptual consequence in our experiments only as an interaction effect.
Cuing of focal accentuation can vary depending on the location of the focal syllable in the utterance
In our experiments the two potentially accentable syllables were manipulated in order to evoke prominence. We made no specific a priori predictions about the impact of the location of the manipulated syllable within an utterance on its perceived prominence.
Stimuli achieving significant increase in the prominence of the target syllable relative to the baseline were largely different for WAY and YEAR (Table 5). It is clear in these data that the cueing of focal accentuation can vary depending on its location in the utterance. In the non-final position (i.e., WAY), even relatively small changes in the source parameter values (e.g., LP+Early, LP+Steep) appear to make a difference, and can tip the balance in terms of where focal accent is likely to be perceived. It is also clear that there is a synergy between the local prominence on the syllable (HP) and deaccentuation in the postfocal material.
In the final accentable syllable (YEAR) the findings were not symmetrical. Here Steep and LP “simple” manipulations significantly enhance the prominence ratings, something not observed in the way-set. While HP on its own is effective in this set as well, combinations including low peak and steep declination are more effective than combinations with high peak.
As mentioned earlier, the effect of the location of the manipulated syllable in the utterance and consequently the length of the postfocal material appears to be of importance. It is also possible that increased phonatory tension of the voice (HP) is not effective in cueing focal accentuation for syllables located toward the end of an utterance (the year-set) because it runs counter to the overall source deaccentuation/declination trend associated with increasingly laxer phonation. In future work this overall source declination trend needs to be included in synthetic stimuli. There is similarity here to f0 peaks and the “compensation for declination” (Pierrehumbert, 1979; Gussenhoven and Rietveld, 1998; Terken and Hermes, 2000): for the f0 peak to be perceived as having the same pitch as the previous one it needs to be lower.
It is likely that the differences observed here between the final (YEAR) and non-final (WAY) syllables have to do with what was not included in these tests, i.e., manipulations to f0. The f0 was kept constant in these stimuli as the objective was to ascertain the role of other voice source features. However, f0 movement co-occurs with the kinds of source features implemented here and it is very likely that f0 movement is far more crucial in final than in non-final syllables. In a production study of focus (Yanushevskaya et al., 2010) an f0 fall was found in both WAY and YEAR syllables when focally accented, but the fall was greater and more rapid in YEAR. A further study of source correlates of accentuation (Ní Chasaide et al., 2013) indicated that while accented syllables in non-final position may, but need not, exhibit f0 movement, a sharp f0 fall always characterized the final accented syllable. To the extent that this fall is missing in the present stimuli, it is likely to militate strongly against the perception of greater prominence on YEAR, regardless of the source changes that occur.
Apart from the position in the utterance, other factors may be relevant. Vowels in the target syllables in the stimuli are of different quality, which may have an impact on perceived prominence. Open vowels have inherently greater intensity and longer duration than close vowels (van Heuven, 2014). This could further explain the bias toward WAY we observed in our results.
Findings across the tests are not identical: Test setup has an impact
The stimuli were presented to participants in two different online tests, and the tasks were different: in Test 1, the participants had to select the prominent syllable (forced choice) and estimate its prominence, in Test 2 they were required to mark the prominence of all the syllables in an utterance on a visual analog scale. There are certain similarities in the findings: the same types of manipulation were effective in both tests (though not in both sets); in both tests we see a strong bias toward WAY; the naturalness and confidence ratings of the stimuli were largely similar (Supplementary Table 1). However, against expectations, the stimuli most frequently selected by participants as prominent in Test 1 were not necessarily the ones yielding notable enhancement of prominence in Test 2. As mentioned earlier, stimuli LP+Early, LP+Steep, LP+Late+Steep significantly enhanced the prominence of manipulated syllable in Test 2 in both way- and year- sets, however, these stimuli in the year-set were not selected by 70% of the participants in Test 1.
These differences in the findings suggest that the context of the test has an effect on the listener prominence judgement.
Strengths—What this paper contributes
This paper is the first to look at the perceptual salience of source variation when f0 is kept constant. Our earlier production and perception studies (Gobl et al., 2002; Gobl and Ní Chasaide, 2003b; Ryan et al., 2003; Yanushevskaya et al., 2018) involved the analysis and synthesis of many voice source parameters, many of which covary in natural speech production. Controlling such an array of complex parameters in synthesis is difficult and require expert knowledge, and it would be therefore desirable to achieve control of voice quality modulation using a smaller set of parameters. This work is a contribution to our understanding of how the Rd parameter might be used as a control parameter in synthesis. This research contributed to the development of a system, described in Murphy et al. (2021) that allows the user to manually manipulate the voice quality dimension of prosody of a synthetic utterance using a graphical interface for use in voice and prosody research as well as in various applications involving synthetics speech (educational games, assistive technology). The paper further contributes to the development of a model of voice source modulation in linguistic prosody (focus, prominence and deaccentuation).
Limitations
To keep the number of manipulations manageable, synthetic stimuli were created adopting a rather simplistic modeling approach. The parameter contours were stylized using linear interpolation, the overall source declination was not included and the heights of the later peak was not adjusted accordingly; duration of the syllables were not adjusted to account for pre-pausal lengthening and the vowel quality in the target syllables was different. For example, WAY is slightly longer than YEAR (8 ms, below JND threshold of 10 ms; Plack, 2018) but is located earlier in the utterance (YEAR needs to be longer rather than shorter to account for the overall lengthening of the syllables toward the end of the utterance). Furthermore, the [eı] vowel in WAY is more open and its intensity is intrinsically higher than that of a closer vowel in YEAR. These differences might have contributed to the strong bias toward prominence on WAY that we observed in our data for both way- and year-sets.
There were sources of variation in our data that were not accounted for by the models we used. The length of postfocal material and the extent of deaccentuation were different for the syllables located earlier and later in the utterance. These were not possible to control for in the current experimental setup, but their influence on perceived prominence of manipulated syllables need to be explored separately in a follow-up study.
The aim of the experiments was to establish perceptual salience of source modulations in the absence of f0 variation. In speech, f0 and other source parameters interact (Fant, 1997; Fant and Kruckenberg, 2007; Ní Chasaide et al., 2011); this was ignored in the current experiment.
Perception experiments were conducted with a relatively small number of participants. The certainty of the point estimates of the magnitude data under the models in our study is rather low as shown by the wide 95% CI, so only tentative conclusions can be made. A follow-up confirmatory study is necessary.
The naturalness ratings of the stimuli were not very high and were negatively correlated with the extent of manipulations. It may be the case that the target syllables were marked as prominent because they sounded less natural. As mentioned earlier, the low naturalness ratings are likely to be related to the extent of deviation from the original parameter values in combination with the absence of f0 manipulations. Source modulation in real speech, although separately controllable, typically co-occur with changes in f0. The discussion of naturalness is relevant: the higher extent of manipulation appears to have a negative effect on naturalness. This suggests that extreme manipulations are less desirable if it is possible to achieve prominence with relatively moderate manipulations.
Conclusions
Our exploratory study indicates that increasing phonatory tension in the focal syllable and reducing it in post-focal material by manipulating the global waveshape parameter Rd can be effective in cuing focal prominence in synthetic speech in the absence of f0 modulation. It further suggests that having a source prominence peak (tenser phonation) on the focally accented syllable may work synergistically with a degree of source deaccentuation in the postfocal material.
The manipulations that induced the perception of focal accentuation in the non-final syllable (WAY) had much less effect on the syllable located later in the utterance (YEAR), where focal accentuation was not well cued. The cueing of focal prominence may depend on its location in the utterance, and that in the case of the final accented syllable f0 movement (not included) is a necessary component.
However, conclusions based on a single study can only be tentative (Nicenboim et al., 2018) and confirmatory follow-up studies need to be conducted. As a next step in these studies, we hope to look at the interplay of source parameters with f0 in final and non-final syllables, and also the effects of deaccentuation when the postfocal tail is longer. Future work will also control for vowel quality and duration in focally accented syllables as well as for the overall source declination in the course of an utterance. The effect of the manipulations of Rd parameter in our experiments is rather low (2–6% of the variance, as shown by marginal R2 values). In natural speech, f0 and other source parameters work synergistically. Future work is required to test to what extent source parameters such as Rd enhance prominence, when manipulated together with f0.
Our subsequent work reported in Murphy et al. (2018) made use of listener-driven decisions. The same approach needs to be applied here to establish perception-driven optimal prominence settings. Adjusting local manipulations of the target syllables to control for the overall source declination as well as pre-focal and post-focal material is likely to improve the naturalness of the stimuli. This will also bring us closer to formulating voice prominence model.
Data availability statement
The raw data supporting the conclusions of this article will be made available by the authors, without undue reservation.
Ethics statement
Ethical review and approval was not required for the study on human participants in accordance with the local legislation and institutional requirements. Written informed consent for participation was not required for this study in accordance with the national legislation and the institutional requirements.
Author contributions
AM generated synthetic stimuli. IY and AM collected the listening test data. IY performed inverse filtering and source parameterization as well as statistical analyses and wrote the first draft of the manuscript. AM, CG, and ANC wrote sections of the manuscript. All authors contributed to conception and design of the study, manuscript revision, read, and approved the submitted version.
Funding
This research was carried out in the Róbóglór-ABAIR project, which is supported by An Roinn Turasóireachta, Cultúir, Ealaíon, Gaeltachta, Spóirt agus Meán, with funding from the National Lottery, as part of the Straitéis 20 Bliain don Ghaeilge.
Acknowledgments
We thank Christopher La Pat for assistance with the setup of the listening tests. We thank the editor and reviewers for their helpful and detailed comments. An earlier version of this research was presented at Interspeech 2016 (Yanushevskaya et al., 2016a).
Conflict of interest
The authors declare that the research was conducted in the absence of any commercial or financial relationships that could be construed as a potential conflict of interest.
Publisher's note
All claims expressed in this article are solely those of the authors and do not necessarily represent those of their affiliated organizations, or those of the publisher, the editors and the reviewers. Any product that may be evaluated in this article, or claim that may be made by its manufacturer, is not guaranteed or endorsed by the publisher.
Supplementary material
The Supplementary Material for this article can be found online at: https://www.frontiersin.org/articles/10.3389/fcomm.2022.1026222/full#supplementary-material
Footnotes
1. ^Since these formulas provide an approximation of the relationship between the parameters of the LF pulse, some small fluctuations in Up might in fact be present in the stimuli, but these were considered sufficiently small to be disregarded.
2. ^The model for the analysis of WAY-manipulated was: mlogit(formula = Sel ~ 1 | Peak + Deac + Timing, data, reflevel = “neither”, method = “nr”); the model for YEAR-manipulated included the same predictors.
References
Airas, M., Alku, P., and Vainio, M. (2007). “Laryngeal voice quality changes in expression of prominence in continuous speech,” in 5th International Workshop on Models and Analysis of Vocal Emissions in Biomedical Applications (MAVEBA 2007) (Florence, Italy).
Alku, P. (1992). Glottal wave analysis with pitch synchronous iterative adaptive inverse filtering. Speech Commun. 11, 109–118. doi: 10.1016/0167-6393(92)90005-R
Alku, P., Bäckström, T., and Vilkman, E. (2002). Normalized amplitude quotient for parameterization of the glottal flow. J. Acoust. Soc. Am. 112, 701–710. doi: 10.1121/1.1490365
Bates, D., Mächler, M., Bolker, B., and Walker, S. (2015). Fitting linear mixed-effects models using lme4. J. Stat. Softw. 67, 1–48. doi: 10.18637/jss.v067.i01
Baumann, S., and Winter, B. (2018). What makes a word prominent? Predicting untrained German listeners' perceptual judgments. J. Phonet. 70, 20–38. doi: 10.1016/j.wocn.2018.05.004
Botinis, A., Granström, B., and Möbius, B. (2001). Developments and paradigms in intonation research. Speech Commun. 33, 263–296. doi: 10.1016/S0167-6393(00)00060-1
Buchanan, C., Aylett, M. P., and Braude, D. (2018). “Adding personality to neutral speech synthesis voices,” in 20th International Conference, SPECOM 2018, Proceedings, eds A. Karpov, O. Jokisch, and R. Potapova, 49–57. doi: 10.1007/978-3-319-99579-3_6
Burdin, R. S., Phillips-Bourass, S., Turnbull, R., Yasavul, M., Clopper, C. G., and Tonhauser, J. (2015). Variation in the prosody of focus in head- and head/edge-prominence languages. Lingua 165, 254–276. doi: 10.1016/j.lingua.2014.10.001
Cabral, J. P., and Oliveira, L. C. (2006). “EmoVoice: a system to generate emotion in speech,” in Interspeech 2006—ICSLP (Pittsburgh, Pennsylvania, USA).
Cabral, J. P., Renals, S., Yamagishi, J., and Richmond, K. (2011). “HMM-based speech synthesiser using the LF-model of the glottal source,” in 2011 IEEE International Conference on Acoustics, Speech and Signal Processing (ICASSP).
Campbell, N. (1995). “Loudness, spectral tilt and perceived prominence in dialogues,” in XIIIth International Congress of Phonetic Sciences (Stockholm, Sweden).
Campbell, N., and Beckman, M. (1997). “Stress, prominence, and spectral tilt,” in Proceedings of the ESCA Tutorial and Research Workshop on Intonation: Theory, Models and Applications, eds A. Botinis, G. Kouroupetroglou, and G. Carayannis (Athens, Greece).
Cruttenden, A. (2011). “The de-accenting of given information: A cognitive universal?,” in Pragmatic Organization of Discourse in the Languages of Europe, eds B. Giuliano and L. S. Marcia (De Gruyter Mouton), 311–356. doi: 10.1515/9783110892222.311
d'Alessandro, C. (2006). “Voice source parameters and prosodic analysis,” in Methods in Empirical Prosody Research, eds S. Sudhoff, D. Lenertová, R. Meyer, S. Pappert, P. Augurzky, I. Mleinek, N. Richter, et al. (Berlin: Walter de Gruyter GmbH and Co), 63–87.
d'Alessandro, C., and Doval, B. (2003). “Voice quality modification for emotional speech synthesis,”in Eurospeech 2003 (Geneva, Switzerland).
Degottex, G., Lanchantin, P., Roebel, A., and Rodet, X. (2013). Mixed source model and its adapted vocal tract filter estimate for voice transformation and synthesis. Speech Commun. 55, 278–294. doi: 10.1016/j.specom.2012.08.010
Epstein, M. (2003). “Voice quality and prosody in English,” in XVth International Congress of Phonetic Sciences (Barcelona, Spain).
Eriksson, A., Thunberg, G. C., and Traunmüller, H. (2001). “Syllable prominence: a matter of vocal effort, phonetic distinctness and top-down processing,” in Intperspeech 2001 (Aalborg, Denmark).
Fant, G. (1995). The LF-model revisited: transformations and frequency domain analysis. STL-QPSR 2–3, 119–156.
Fant, G. (1997). The voice source in connected speech. Speech Commun. 22, 125–139. doi: 10.1016/S0167-6393(97)00017-4
Fant, G., and Kruckenberg, A. (1994). Notes on stress and word accent in Swedish. STL-QPSR 35, 125–144.
Fant, G., and Kruckenberg, A. (1996). Voice source properties of the speech code. TMH-QPSR 37, 45–56. doi: 10.1121/1.417754
Fant, G., and Kruckenberg, A. (2007). Co-variation of acoustic parameters in prosody. TMH-QPSR 50, 1–4.
Fant, G., Liljencrants, J., and Lin, Q. (1985). A four-parameter model of glottal flow. STL-QPSR 4, 1–13.
Gobl, C., Bennett, E., and Ní Chasaide, A. (2002). “Expressive synthesis: how crucial is voice quality?,” in IEEE Workshop on Speech Synthesis (Santa Monica, CA).
Gobl, C., and Ní Chasaide, A. (1999). “Techniques for analysing the voice source,” in Coarticulation: Theory, Data and Techniques, eds W. J. Hardcastle and N. Hewlett (Cambridge: Cambridge University Press), 300–321.
Gobl, C., and Ní Chasaide, A. (2003a). “Amplitude-based source parameters for measuring voice quality,” in VOQUAL'03 (Geneva, Switzerland).
Gobl, C., and Ní Chasaide, A. (2003b). The role of voice quality in communicating emotion, mood and attitude. Speech Commun. 40, 189–212. doi: 10.1016/S0167-6393(02)00082-1
Gobl, C., and Ní Chasaide, A. (2010). “Voice source variation and its communicative functions,” in The Handbook of Phonetic Sciences, 2 edition, eds W. J. Hardcastle, J. Laver, and F. E. Gibbon (Hoboken, NJ: Blackwell Publishing Ltd), 378–423.
Gobl, C., Yanushevskaya, I., Murphy, A., and Ní Chasaide, A. (2019). “Comparison of the time and frequency domain measures of the voice source,” in The XIX International Congress of Phonetic Sciences (Melbourne, Australia).
Gobl, C., Yanushevskaya, I., and Ní Chasaide, A. (2015). “The relationship between voice source parameters and the Maxima Dispersion Quotient (MDQ),” in Interspeech 2015 (Dresden, Germany).
Gordon, M., and Roettger, T. (2017). Acoustic correlates of word stress: a cross-linguistic survey. Ling. Vanguard 3, 7. doi: 10.1515/lingvan-2017-0007
Gussenhoven, C., Repp, B. H., Rietveld, A., Rump, H. H., and Terken, J. (1997). The perceptual prominence of fundamental frequency peaks. J. Acoust. Soc. Am. 102, 3009–3022. doi: 10.1121/1.420355
Gussenhoven, C., and Rietveld, T. (1998). On the speaker-dependence of the perceived prominence of F0peaks. J. Phonet. 26, 371–380. doi: 10.1006/jpho.1998.0080
Heldner, M. (1998). “Is an F0-rise a necessary or sufficient cue to perceived focus in Swedish?,” in Nordic Prosody: Proceedings of the VIIth Conference, Joensuu 1996, ed S. Werner. Frankfurt am Mein: Peter Lang.
Heldner, M. (2001). Spectral Emphasis as a Perceptual Cue to Prominence. TMH-QPSR 42, Speech, Music and Hearing. Stockholm: KTH, 51–57.
Heldner, M. (2003). On the reliability of overall intensity and spectral emphasis as acoustic correlates of focal accents in Swedish. J. Phonet. 31, 39–62. doi: 10.1016/S0095-4470(02)00071-2
Hermes, D. J. (2006). “Stylization of pitch contours,” in Methods in Empirical Prosody Research, eds S. Sudhoff, D. Lenertová, R. Meyer, S. Pappert, P. Augurzky, I. Mleinek, et al. (Berlin: Walter de Gruyter), 29–61.
Hillenbrand, J., Cleveland, R. A., and Erickson, R. L. (1994). Acoustic correlates of breathy vocal quality. J. Speech Hear. Res. 37, 769–778. doi: 10.1044/jshr.3704.769
Huber, S., and Roebel, A. (2015). “On glottal source shape parameter transformation using a novel deterministic and stochastic speech analysis and synthesis system,” in 16th Annual Conference of the International Speech Communication Association (Interspeech ISCA) (Dresden, Germany).
Iseli, M., Shue, Y. -L., Epstein, M. A., Keating, P., Kreiman, J., and Alwan, A. (2006). “Voice source correlates of prosodic features in American English,” in Interspeech 2006—ICSLP (Pittsburgh, PA).
Kakouros, S., Räsänen, O., and Alku, P. (2018). Comparison of spectral tilt measures for sentence prominence in speech—effects of dimensionality and adverse noise conditions. Speech Commun. 103, 11–26. doi: 10.1016/j.specom.2018.08.002
Keating, P. A. (2003). “Phonetic encoding of prosodic structure,” in The 6th International Seminar on Speech Production (Sydney, Australia).
Kember, H., Choi, J., Yu, J., and Cutler, A. (2019). The processing of linguistic prominence. Lang. Speech 64, 413–436. doi: 10.1177/0023830919880217
Knight, R. -A. (2008). The shape of nuclear falls and their effect on the perception of pitch and prominence: peaks vs. plateaux. Lang. Speech 51, 223–244. doi: 10.1177/0023830908098541
Kochanski, G., Grabe, E., Coleman, J., and Rosner, B. (2005). Loudness predicts prominence: fundamental frequency lends little. J. Acoust. Soc. Am. 118, 1038–1054. doi: 10.1121/1.1923349
Koreman, J. (1995). “The effects of stress and f0 on the voice source,” in PHONUS 1 (Saarland: Institute of Phonetics, University of Saarland), 105–120.
Kreiman, J., Gerratt, B. R., and Antoñanzas-Barroso, N. (2007). Measures of the glottal source spectrum. J. Speech Lang. Hear. Res. 50, 595–610. doi: 10.1044/1092-4388(2007/042)
Kuang, J., and Liberman, M. (2018). Integrating voice quality cues in the pitch perception of speech and non-speech utterances. Front. Psychol. 9, 2147. doi: 10.3389/fpsyg.2018.02147
Kuznetsova, A., Brockhoff, P. B., and Christensen, R. H. B. (2017). lmerTest package: tests in linear mixed effects models. J. Stat. Softw. 82, 1–26. doi: 10.18637/jss.v082.i13
Leemann, A., Kolly, M. -J., Li, Y., Chan, R., Kwek, G., and Jespersen, A. (2016). Towards a Typology of Prominence Perception: The Role of Duration. Boston: Speech Prosody.
Lüdecke, D. (2018). sjPlot: Data Visualization for Statistics in Social Science. Available online at: https://cran.r-project.org/web/packages/sjPlot/index.html (accessed October 7, 2022).
Ludusan, B., Wagner, P., and Włodarczak, M. (2021). “Cue interaction in the perception of prosodic prominence: the role of voice quality,” in Interspeech 2021 (Brno, Czechia).
Murphy, A., Yanushevskaya, I., Ní Chasaide, A., and Gobl, C. (2018). “Voice source contribution to prominence perception: Rd implementation,” in Interspeech 2018 (Hyderabad, India).
Murphy, A., Yanushevskaya, I., Ní Chasaide, A., and Gobl, C. (2021). “Integrating a voice analysis-synthesis system with a TTS framework for controlling affect and speaker identity,” in 2021 32nd Irish Signals and Systems Conference (ISSC).
Nakagawa, S., Johnson, P. C. D., and Schielzeth, H. (2017). The coefficient of determination R2 and intra-class correlation coefficient from generalized linear mixed-effects models revisited and expanded. J. R. Soc. Interf. 14, 20170213. doi: 10.1098/rsif.2017.0213
Ní Chasaide, A., and Gobl, C. (2004a). “Decomposing linguistic and affective components of phonatory quality,” in Interspeech 2004 (Jeju Island, Korea).
Ní Chasaide, A., and Gobl, C. (2004b). “Voice quality and f0 in prosody: towards a holistic account,” in Speech Prosody 2004 (Nara, Japan).
Ní Chasaide, A., Gobl, C., and Monahan, P. (1992). A technique for analysing voice quality in pathological and normal speech. J. Clin. Speech Lang. Stud. 2, 1–16. doi: 10.3233/ACS-1992-2103
Ní Chasaide, A., Yanushevskaya, I., and Gobl, C. (2011). “Voice source dynamics in intonation,” in XVIIth International Congress of Phonetic Sciences (Hong Kong, China).
Ní Chasaide, A., Yanushevskaya, I., and Gobl, C. (2015). “Prosody of voice: declination, sentence mode and interaction with prominence,” in XVIIIth International Congress of Phonetic Sciences (Glasgow, United Kingdom).
Ní Chasaide, A., Yanushevskaya, I., Kane, J., and Gobl, C. (2013). “The Voice Prominence Hypothesis: the interplay of F0 and voice source features in accentuation,” in Interspeech 2013 (Lyon, France).
Nicenboim, B., Roettger, T. B., and Vasishth, S. (2018). Using meta-analysis for evidence synthesis: the case of incomplete neutralization in German. J. Phon. 70, 39–55. doi: 10.1016/j.wocn.2018.06.001
Niebuhr, O., and Winkler, J. (2017). “The relative cueing power of F0 and duration in German prominence perception,” in Interspeech, 611–615. doi: 10.21437/Interspeech.2017-375
Pierrehumbert, J. (1979). The perception of fundamental frequency declination. J. Acoust. Soc. Am. 66, 363–369. doi: 10.1121/1.383670
Pierrehumbert, J. B. (1989). A preliminary study of the consequences of intonation for the voice source. STL-QPSR 30, 23–36.
R Core Team (2019). R: A Language and Environment for Statistical Computing. R Foundation for Statistical Computing. Available online at: https://www.r-project.org/ (accessed October 7, 2022).
Ryan, C., Ní Chasaide, A., and Gobl, C. (2003). “Voice quality variation and the perception of affect: continuous or categorical?,” in XVth International Congress of Phonetic Sciences (Barcelona, Spain).
Shue, Y. -L., Iseli, M., Veilleux, N., and Alwan, A. (2007). “Pitch accent versus lexical stress: quantifying acoustic measures related to the voice source,” in Interspeech 2007 (Antwerp, Belgium).
Sluijter, A. M. C., and van Heuven, V. J. (1996). Spectral balance as an acoustic correlate of linguistic stress. J. Acoust. Soc. Am. 100, 2471–2485. doi: 10.1121/1.417955
Sluijter, A. M. C., van Heuven, V. J., and Pacilly, J. J. (1997). Spectral balance as a cue in the perception of linguistic stress. J. Acoust. Soc. Am. 101, 503–513. doi: 10.1121/1.417994
Sorin, A., Shechtman, S., and Rendel, A. (2017). “Semi parametric concatenative TTS with instant voice modification capabilities,” in INTERSPEECH 2017 (Stockholm, Sweden).
Strik, H., and Boves, L. (1992). On the relation between voice source parameters and prosodic features in connected speech. Speech Commun. 11, 167–174. doi: 10.1016/0167-6393(92)90011-U
Terken, J. (1991). Fundamental frequency and perceived prominence of accented syllables. J. Acoust. Soc. Am. 89, 1768–1776. doi: 10.1121/1.401019
Terken, J. (1994). Fundamental frequency and perceived prominence of accented syllables. II. Nonfinal accents. J. Acoust. Soc. Am. 95, 3662–3665. doi: 10.1121/1.409936
Terken, J., and Hermes, D. (2000). “The perception of prosodic prominence,” in Prosody: Theory and Experiment. Studies presented to Gösta Bruce, ed M. Horne (Alphen aan den Rijn: Kluwer).
Train, K. E. (2009). Discrete Choice Methods with Simulation. Cambridge: Cambridge University Press.
Turk, A. E., and Sawusch, J. R. (1996). The processing of duration and intensity cues to prominence. J. Acoust. Soc. Am. 99, 3782–3790. doi: 10.1121/1.414995
Vainio, M., Airas, M., Järvikivi, J., and Alku, P. (2010). “Laryngeal voice quality in the expression of focus,” in Interspeech 2010 (Chiba, Japan).
Vainio, M., and Järvikivi, J. (2006). Tonal features, intensity, and word order in the perception of prominence. J. Phonetics 34, 319–342. doi: 10.1016/j.wocn.2005.06.004
van Heuven, V. J. (2014). “Acoustic correlates and perceptual cues of word and sentence stress: Mainly English and Dutch,” in 4th International Symposium on Tonal Aspects of Languages (TAL-2014) (Nijmegen, the Netherlands).
Wagner, M., and Watson, D. G. (2010). Experimental and theoretical advances in prosody: a review. Lang. Cogn. Process. 25, 905–945. doi: 10.1080/01690961003589492
Wagner, P., Origlia, A., Avesani, C., Christodoulides, G., Cutugno, F., d'Imperio, M., et al. (2015). “Disentangling and connecting different perspectives on prosodic prominence,” in XVIIIth International Congress of Phonetic Sciences (Glasgow, Scotland).
Xu, Y. (2011). Speech prosody: a methodological review. J. Speech Sci. 1, 85–115. doi: 10.20396/joss.v1i1.15014
Xu, Y., and Xu, C. X. (2005). Phonetic realization of focus in English declarative intonation. J. Phon. 33, 159–197. doi: 10.1016/j.wocn.2004.11.001
Yanushevskaya, I., Gobl, C., Kane, J., and Ní Chasaide, A. (2010). “An exploration of voice source correlates of focus,” in Interspeech 2010 (Makuhari, Japan).
Yanushevskaya, I., Gobl, C., and Ní Chasaide, A. (2018). Cross-language differences in how voice quality and f0 contours map to affect. J. Acoust. Soc. Am. 144, 2730–2750. doi: 10.1121/1.5066448
Yanushevskaya, I., Murphy, A., Gobl, C., and Ní Chasaide, A. (2016a). “Perceptual salience of voice source parameters in signaling focal prominence,” in Interspeech 2016 (San Francisco, CA).
Yanushevskaya, I., Ní Chasaide, A., and Gobl, C. (2016b). “The interaction of long-term voice quality with the realisation of focus,” in Speech Prosody 2016 (Boston, MA).
Keywords: voice source, Rd, prominence, deaccentuation, perception
Citation: Yanushevskaya I, Murphy A, Gobl C and Ní Chasaide A (2022) Global waveshape parameter Rd in signaling focal prominence: Perceptual salience in the absence of f0 variation. Front. Commun. 7:1026222. doi: 10.3389/fcomm.2022.1026222
Received: 23 August 2022; Accepted: 30 September 2022;
Published: 20 October 2022.
Edited by:
Donna Mae Erickson, Haskins Laboratories, United StatesReviewed by:
Zhaoyan Zhang, UCLA Head and Neck Surgery, United StatesAlbert Rilliard, Université Paris-Saclay, France
Copyright © 2022 Yanushevskaya, Murphy, Gobl and Ní Chasaide. This is an open-access article distributed under the terms of the Creative Commons Attribution License (CC BY). The use, distribution or reproduction in other forums is permitted, provided the original author(s) and the copyright owner(s) are credited and that the original publication in this journal is cited, in accordance with accepted academic practice. No use, distribution or reproduction is permitted which does not comply with these terms.
*Correspondence: Irena Yanushevskaya, eWFudXNoZWlAdGNkLmll