- Cognitive and Information Sciences, University of California, Merced, Merced, CA, United States
While philosophers of science generally agree that social, political, and ethical values can play legitimate roles in science, there is active debate over whether scientists should disclosure such values in their public communications. This debate depends, in part, on empirical claims about whether values disclosures might undermine public trust in science. In a previous study, Elliott et al. used an online experiment to test this empirical claim. The current paper reports a replication attempt of their experiment. Comparing results of the original study and our replication, we do not find evidence for a transparency penalty or “shared values” effect, but do find evidence that the content of scientific conclusions (whether or not a chemical is found to cause harm) might effect perceived trustworthiness and that scientists who value public health and disclose this value might be perceived as more trustworthy.
1. Introduction
Over the past 15 years, many philosophers of science have rejected the ideal of value-free science and related, traditional understandings of objectivity and political neutrality of science (Douglas, 2009; Elliott, 2017). According to the value-free ideal, social and political values—such as feminism, environmentalism, or the protection of human health—have no legitimate role to play in the evaluation of scientific hypotheses. The value-free ideal is compatible with allowing social and political values to play important roles earlier and later in inquiry. Specifically, these values may legitimately shape the content and framing of research questions—researchers might decide to investigate whether chemical X causes cancer out of a concern to protect human health—and will be essential when scientific findings are used to inform public policy—say, banning the use of chemical X. But, according to the value-free ideal, these values must not influence the collection and analysis of data and the process of reaching an overall conclusion about whether or not chemical X causes cancer.
Challenges to the value-free ideal argue that at least some social and political values may, or even should, play a role in the evaluation of scientific hypotheses. Keeping with the example, the question of whether chemical X causes cancer has much more significant social and political implications than the question of whether chemical X fluoresces under ultraviolet light. So, in the interest of protecting human health, it would be appropriate to scientifically accept the hypothesis that chemical X is carcinogenic for regulatory purposes based on relatively weak or provisional evidence (Cranor, 1995; Elliott and McKaughan, 2014; Fernández and Hicks, 2019).
While this kind of argument indicates that at least some social and political values may or should play at least some role in the evaluation of at least some scientific hypotheses, it doesn't provide us with much positive guidance: which values, playing which roles, in the evaluation of which hypotheses? (Hicks, 2014). One (partial) answer to this set of questions appeals to the ideal of transparency: scientists should disclose to the public the social and political values that have influenced their research (McKaughan and Elliott, 2013; Elliott and Resnik, 2014). But some philosophers have objected to this transparency proposal, arguing that it might undermine trust in science.
Specifically, ethicists make a distinction between trust and trustworthiness (Baier, 1986). Trust is a verb: placing one's trust in someone else, with respect to some activity or domain. Trustworthiness is an assessment of whether or not that trust is appropriate. According to the objection to the ideal of transparency, transparency would not change how trustworthy science actually is—the science is conducted in the same way—but might reduce public perceptions of trustworthiness—as members of the public see how the scientific sausage is made. For instance, if members of the public generally accept the ideal of value-free science, then values disclosures would violate this ideal, making scientists (incorrectly) appear biased and untrustworthy (John, 2017; Kovaka, 2021).
This objection is an empirical prediction: if scientists disclose their values, they will be perceived as less trustworthy. Elliott et al. (2017) conducted an online survey study to evaluate this prediction. The authors found tentative evidence that disclosing values may reduce the perceived trustworthiness of a scientist, and that this effect may be moderated by whether or not participants share the same values as the scientist and whether or not the scientist reports findings contrary to their stated values. However, these authors collected data from a somewhat small sample using Amazon Mechanical Turk, and adopted an analytical approach that diluted their sample across different conditions. In this paper, we report the results of a replication of Elliott et al. (2017) study 1, using a larger sample and a more statistically efficient analytical approach. The major results found by Elliott et al. (2017) serve as the basis for our hypotheses, described below.
2. Methods and materials
2.1. Experimental design
We used the same experimental stimulus and design as Elliott et al. (2017), which we embedded within a larger project examining the public's perceptions of the values in science. In this paper, we are only reporting the replication component of the project. The replication component was the same 3 (Values: No Disclosure, Economic Growth, Public Health) × 2 (Harm: Causes Harm, Does Not Cause Harm) experimental design as used by Elliott et al. (2017). In each condition, participants are first shown a single presentation slide and the following explanatory text:
For several decades, a scientist named Dr. Riley Spence has been doing research on chemicals used in consumer products. One chemical—Bisphenol A, popularly known as BPA—is found in a large number of consumer products and is suspected of posing risks to human health. Yet, scientists do not agree about these possible health risks. Dr. Spence recently gave a public talk in Washington, D.C., about BPA research. Here is the final slide from Dr. Spence's presentation.
No other information about the (fictional) Dr. Spence is provided. The content of the slide varies across the conditions (Figure 1). Each slide has the header “My conclusion,” followed by a list of 2 or 3 bullets. The first bullet, if present, makes a values disclosure, stating that either economic growth or public health should be a top national priority. This first bullet is not present in the “no disclosure” values condition. The second bullet, identical across conditions, states “I examined the scientific evidence on potential health risks of BPA.” The third bullet concludes that BPA either does or does not cause harm to people, depending on whether the subject is in the “causes harm” or “does not cause harm” condition.

Figure 1. Example of the experimental stimulus, from the “public health values disclosure” + “causes harm” conclusion.
After viewing the slide, the participant is then asked to rate Dr. Spence's trustworthiness using a semantic differential scale. Elliott et al. (2017) used an ad hoc scale; we used the Muenster Epistemic Trustworthiness Inventory (METI; Hendriks et al., 2015), which substantially overlaps but is not identical to the Elliott et al. (2017) scale. Even though the ad hoc scale created by Elliot and colleagues had acceptable internal reliability, the METI was developed and psychometrically validated to measure the perceived trustworthiness of experts. On the METI, participants rate the target scientist (the fictional Dr. Spence) on a 1–7 scale for 14 semantic differential items, where each item is anchored at the ends by a pair of words, such as competent-incompetent or responsible-irresponsible. The METI scale captures perceived trustworthiness of a target along three dimensions: competence, benevolence, and integrity. However, the three dimensions were strongly correlated in our sample (Pearson r-values ranging from 0.75 to 0.92). To avoid issues of multicollinearity in our analyses, we averaged participant scores into a single composite measure. In both Elliott et al. (2017) and our replication analysis, all items were averaged together to form a 1–7 composite measure of trustworthiness. To aid interpretation, in the analysis the direction of the scale has been set so that increased values correspond to increased perceived trustworthiness.
As its name indicates, METI assesses perceived trustworthiness rather than trust (such as accepting Dr. Spence's conclusion about BPA). It is conceivable that participants might trust Dr. Spence's conclusion even if they judge Spence to be untrustworthy, or vice versa. But we would typically expect trust and trustworthiness to go together.
Elliott et al. (2017) explain that they selected BPA as a complex, ongoing, public scientific controversy. For our replication, we chose to keep BPA, rather than switching to a different public scientific controversy with a higher profile in 2021, such as climate change, police violence, voter fraud, or any of numerous aspects of the COVID-19 pandemic. All of these controversies are highly politically charged, with prominent public experts and counterexperts (Goldenberg, 2021, p. 100–101, Chapter 6). While we anticipated some effects of political partisanship in the BPA case, we felt it would be less likely to swamp the values disclosure that was our primary interest.
After filling in the METI, participants provided demographic information, including self-identifying their political ideology, and other sections of the survey that are not examined here. Due to researcher error, a question about the participants' values (whether they prioritize economic growth or public health) was omitted in the first wave of data collection; this question was asked in a followup wave.
2.2. Replication hypotheses and analytical approach
We identified five major findings from Elliott et al. (2017) for our replication attempt:
H1. Modest correlation between values and ideology(a) Political liberals are more likely to prioritize public health over economic growth, compared to political conservatives; but (b) a majority of political conservatives prioritize public health.
H2. Consumer risk sensitivityScientists who find that a chemical harms human health are perceived as more trustworthy than scientists who find that a chemical does not cause harm.
H3. Transparency penaltyScientists who disclose values are perceived as less trustworthy than scientists who do not.
H4. Shared valuesGiven that the scientist discloses values, if the participant and the scientist share the same values, the scientist is perceived as more trustworthy than if the participant and scientist have discordant values.
H5. Variation in effectsThe magnitude of the effects for hypotheses 2–4 vary depending on whether the participant prioritizes public health or economic growth.
Hypothesis H3, the transparency penalty, corresponds to the objection to transparency: disclosing values undermines trust in science. However, the shared values effect works in the opposite direction, counteracting the transparency penalty.
Hypothesis 1 was analyzed using Spearman rank order correlation to test H1a and a visual inspection of descriptive statistics to test H1b. Hypotheses 2–5 were analyzed using linear regression models as a common framework, with a direct acyclic graph (DAG) constructed a priori to identify appropriate adjustments (covariates) for H4 and H5. Because Elliott et al. (2017) made their data publicly available, and our analytical approaches differ somewhat from theirs, we conducted parallel analyses of their data, and report these parallel results for H2 and H3. Exploratory data analysis was used throughout to support data validation and aid interpretation.
2.3. Participants
Participants were recruited using the online survey platform Prolific, and the survey was administered in a web browser using Qualtrics. Prolific has an option to draw samples that are balanced to be representative by age, binary gender, and a 5-category race variable (taking values Asian, Black, Mixed, Other, and White) for US adults (Representative Samples FAQ, 2022). A recent analysis finds that Prolific produces substantially higher quality data than Amazon Mechanical Turk for online survey studies, though three of the five authors are affiliated with Prolific (Peer et al., 2021). Preliminary power analysis recommended a sample of ~1,000 participants to reliably detect non-interaction effects (H1–H4).
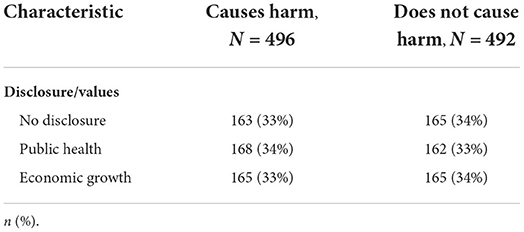
After excluding participants who declined consent after opening the survey or did not complete the survey, we had 988 participants in the full analysis sample (Mage = 44-years-old, SDage = 16-years, Woman/Female = 498, Man/Male = 458, White = 712, Black = 124, Asian or Pacific Islander = 63, Hispanic = 33, American Indian or Alaskan Native = 5, Mixed or Other = 51). Participants were randomly assigned to condition, with 163 assigned to the No Disclosure + Causes Harm condition, 165 assigned to the No Disclosure + Does Not Cause Harm condition, 165 assigned to the Economic Growth + Causes Harm condition, 165 assigned to the Economic Growth + Does Not Cause Harm condition, 168 assigned to the Public Health + Causes Harm condition, and 162 assigned to the Public Health + Does Not Cause Harm condition (Table 1). Due to researcher error a question about participants' values was not included in the original survey. Of the full 988 participants, 844 participants (85%) responded to the followup question about their own values (participant prioritizes economic growth or public health). Consequently, subsamples for hypotheses 4 and 5 were substantially smaller than the full analysis sample.
The study was approved by the UC Merced IRB on August 17, 2021, and data collection ran October 18–20, 2021. The followup survey asking the initial sample of participants about their own values regarding economic growth and public health was conducted December 8, 2021 through March 5, 2022.
2.4. Software and reproducibility
Data cleaning and analysis was conducted in R version 4.1.2 (R Core Team, 2021), with extensive use of the tidyverse suite of packages version 1.3.1 (Wickham et al., 2019). Regression tables were generated using the packages gt version 0.5.0 (Iannone et al., 2022) and gtsummary version 1.6.0 (Sjoberg et al., 2021).
Anonymized original data and reproducible code are available at https://github.com/dhicks/transparency. Instructions in that repository explain how to automatically reproduce our analysis.
3. Results
Critically, our data are unlikely to be representative by education level and political ideology. In 2021, about 9% of US adults 25 or over had a less than high school education, and 38% had a Bachelor's degree or higher (CPS Historical Time Series Visualizations, 2022, Figure 2). Only 1% of our participants reported a less than high school education, and 57% reported a Bachelor's degree or higher. For political ideology, the General Social Survey has consistently found over several decades that about 30% of US adults identify as liberal, about 30% identify as conservative, and about 40% as moderate (GSS Data Explorer, 2022). Among our participants, liberals (574) heavily outnumber conservatives (248; Figure 2). Both overrepresentation of college graduates and underrepresentation of conservatives (especially conservatives with strong anti-institutional views) are known issues in public opinion polling (Kennedy et al., 2018). In exploratory data analysis, we noted that there was essentially no correlation between political ideology and perceived trustworthiness (in the online supplement, see subsection H5-shared). This was surprising, since general trust/distrust in science has become a partisan phenomenon over the last few decades: data from the General Social Survey shows increasing trust in science from liberals and decreasing trust from conservatives (Gauchat, 2012; Lee, 2021), and many (though not all) prominent public scientific controversies align with liberal-conservative partisanship (Funk and Rainie, 2015).
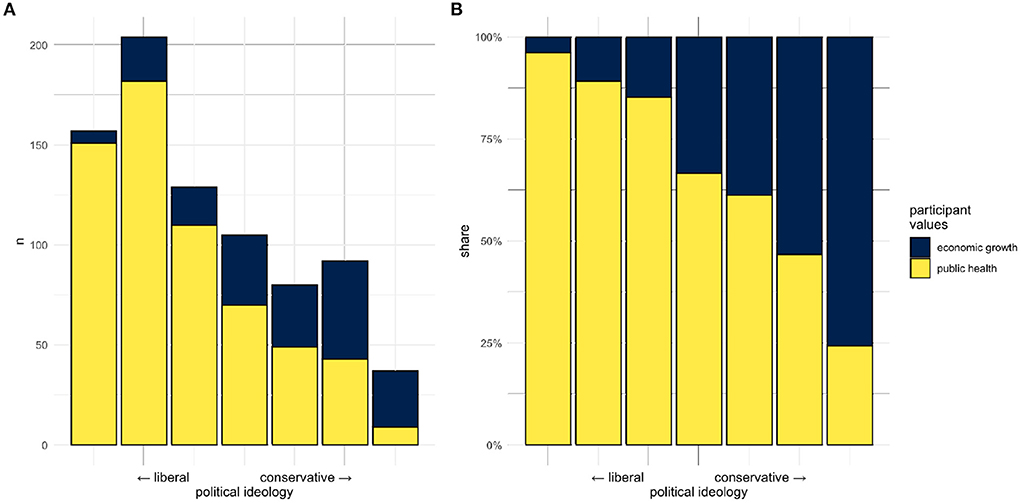
Figure 2. Participant values by political ideology. (A) Absolute counts, (B) shares within political ideology categories. (A) Shows that our sample substantially over-represents political liberals.
Because of these representation issues, insofar as some political conservatives are both less likely to participate in studies on Prolific (or at least in our particular study) and likely to perceive Spence as less trustworthy, this will produce omitted variable bias for analyses that require adjustment by political ideology. Analysis of our a priori DAG indicated that, for the hypotheses examined here, this adjustment was not necessary in any case. When some adjustment was necessary (H4–H5), we included political ideology along with other demographic variables in an alternative model specification as a robustness check. In line with the DAG, in no case did these robustness checks produce indications of omitted variable bias.
3.1. H1: Correlation between values and ideology
We tested the hypothesis of a modest correlation between values and ideology in two ways. First, to test (H1a) whether political liberals are more likely to prioritize public health over economic growth compared to conservatives, we conducted a Spearman's rank order correlation. Results revealed a significant correlation in line with the hypothesis, Spearman's ρ = −0.47, p < 0.001. Political liberals were more likely than conservatives to value public health over economic growth. To test (H1b) that a majority of political conservatives prioritize public health over economic growth we cross-tabulated the data. Results revealed that, contrary to the hypothesis, slightly more than half of the self-reported political conservatives in our sample reported valuing economic growth (51.7%) over public health (48.3%; see Figure 2).
3.2. H2 and H3: Consumer risk sensitivity and transparency penalty
Next, we tested the hypotheses that (H2) a scientist who find a chemical harms human health is perceived as more trustworthy than a scientist who find that a chemical does not cause harm and (H3) a scientist who discloses values is perceived as less trustworthy than a scientist who does not. For this analysis, we regressed participants' METI ratings onto both the Conclusions and Disclosure experimental conditions. The full model was significant, adj. R2 = 0.148, F(2, 985) = 86.59, p < 0.001 (see Table 2). Specifically, results revealed that the conclusions reported by the scientist predicted participants' perceived trustworthiness, in line with our hypothesis. Participants rated the scientist who reported that BPA does not cause harm as less trustworthy (Msd = 4.481.26) than the scientist who reported that BPA causes harm (Msd = 5.471.12), β = −0.99, t(985) = −13.09, p < 0.001. By contrast, the results do not provide evidence in favor of our hypothesis that a scientist disclosing their values (Msd = 4.941.33) are perceived as less trustworthy than a scientist who does not disclose values (Msd = 5.051.21), β = −0.12, t(985) = −1.46, p = 0.143.
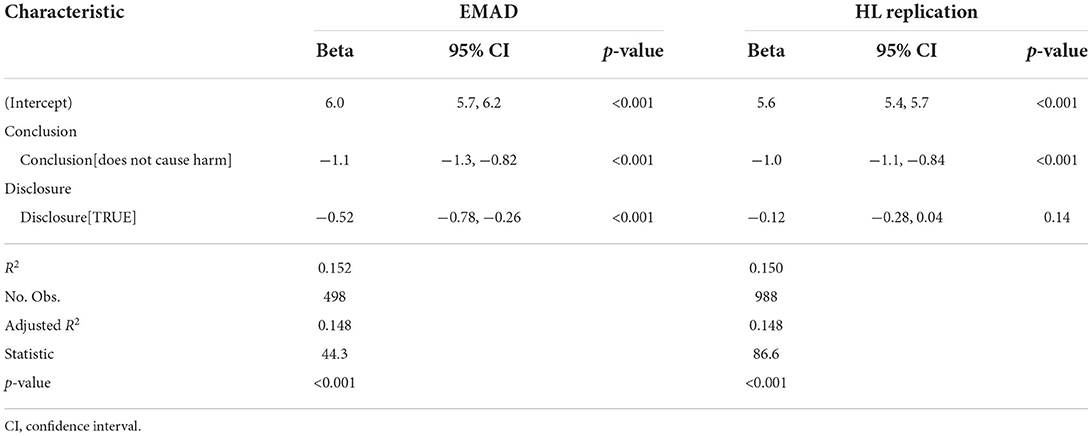
Table 2. Regression analysis for hypotheses H2 (consumer risk sensitivity) and H3 (disclosure effect).
3.3. H4: Shared values
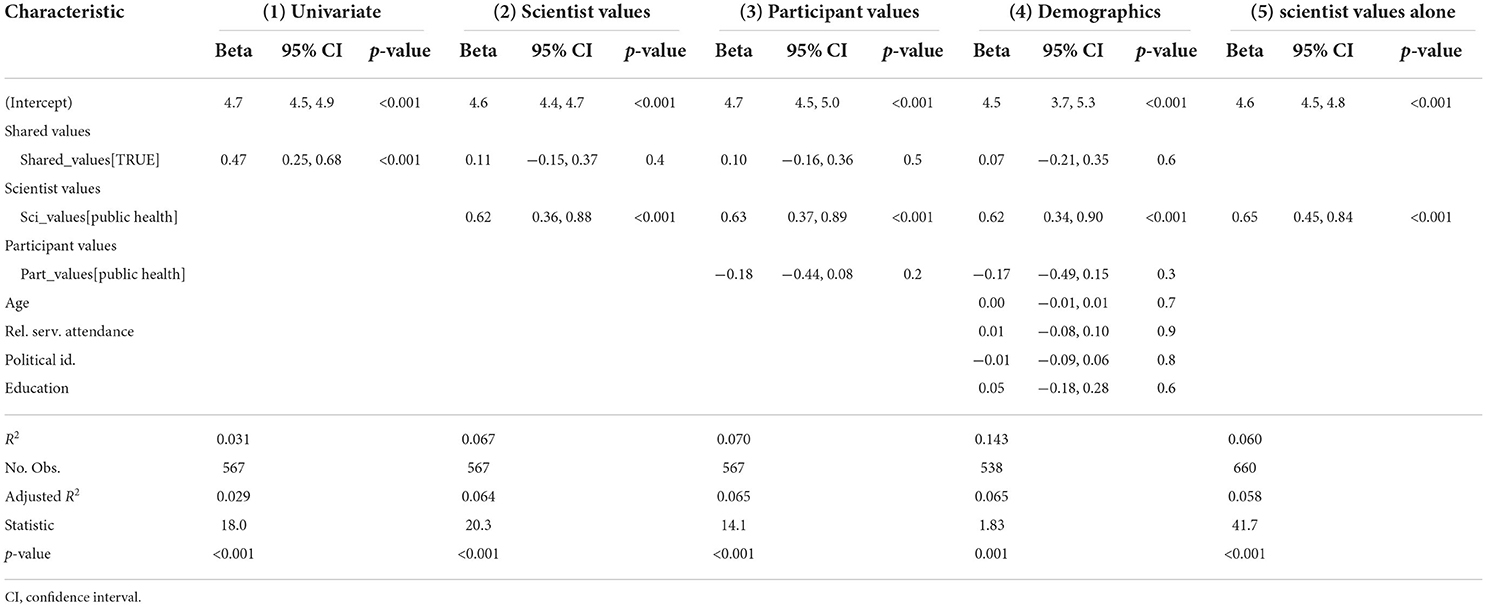
Next, we tested the hypothesis that (H4) if the participant and scientist share the same values, the scientist is perceived as more trustworthy than if the participant and scientist do not share the same values. For this and related analyses, we only included data from participants who were assigned to either of the Disclosure conditions and self-reported their own values, reducing the sample to 567. Following this, we created a new Shared Values variable as a composite of the participants' reported values and the scientist's values. For this analysis, an a priori directed acyclic graphic (DAG) indicated that a univariate regression of participants' METI rating onto Shared Values would produce a biased estimate, that adjustments were required for both the participant's and scientist's values, and that including demographic variables would not effect this estimate (Figure 3). While the univariate model was significant, adj. R2= 0.029, F(1, 565) = 18.0, p < 0.001 (Table 3, model 1), after adjusting for scientist values Shared Values did not emerge as a significant predictor of participants' perceptions of the trustworthiness of the scientist (Table 3, models 2–4), indicating that the univariate estimate was indeed biased. Rather, only the scientist's disclosed values significantly predicted how trustworthy participants rated the scientist, such that a scientist who disclosed valuing public health was rated as more trustworthy than a scientist who disclosed valuing economic growth. This scientist values effect was robust across alternative model specifications, with an estimated effect of 0.6 (95% CI 0.4–0.8; Table 3, models 2–5), again consistent with the DAG.
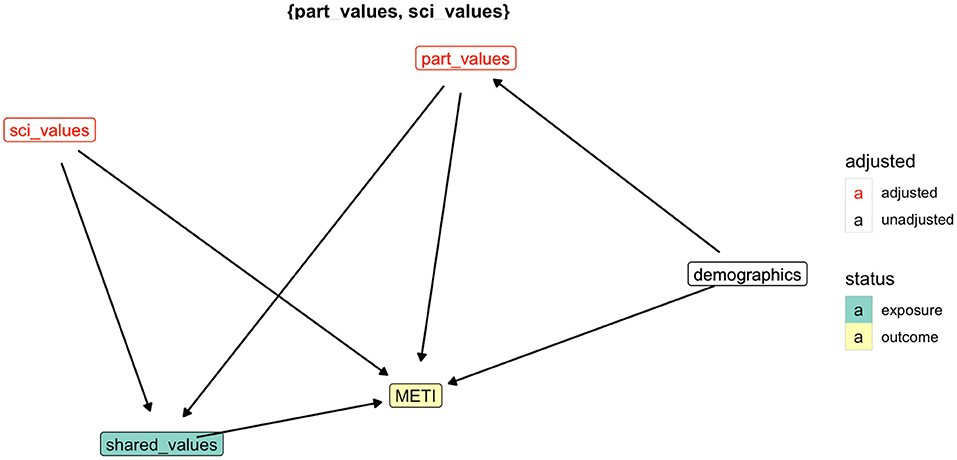
Figure 3. Directed acyclic graph (DAG) for analysis of the shared values effect. If the DAG is faithful, adjusting for scientist values (sci_values) and participant values (part_values) is sufficient for estimating the effect of shared values on perceived trustworthiness (METI). In particular, adjusting for demographics should not change the regression coefficient on shared values.
3.4. H5: Variation in effects
We ran the following analyses to test our hypothesis that (H5) the magnitude of the effects found for the tests of H2–H4 vary depending on whether the participant prioritizes public health or economic growth. Results are presented in Tables 4–6.
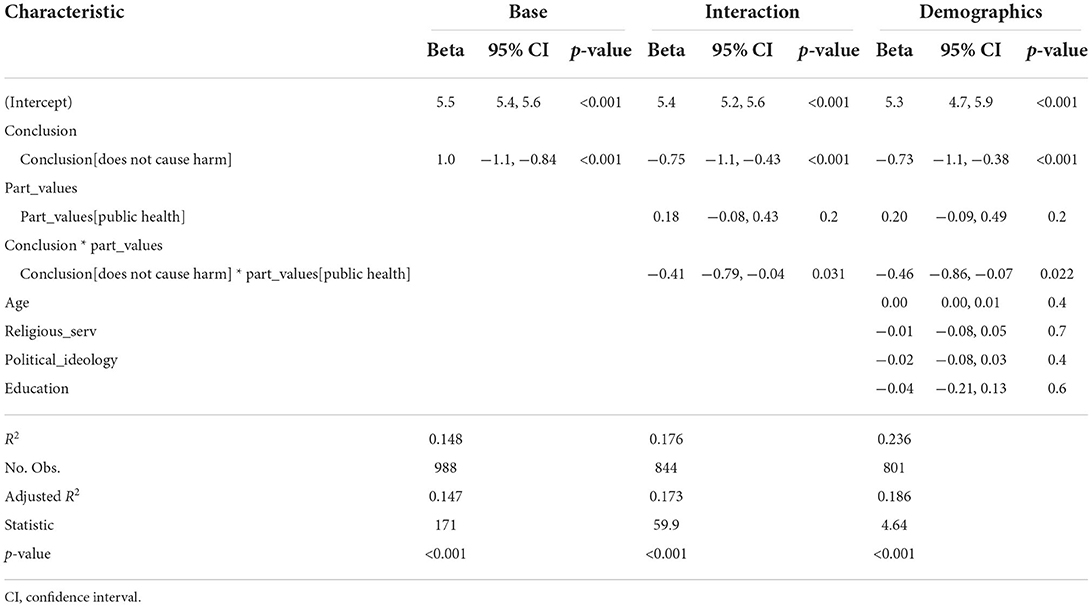
Table 4. Regression analysis of H5-consumer, interaction between participant values and consumer risk sensitivity.
3.4.1. Consumer risk sensitivity
To test whether the findings regarding consumer risk sensitivity vary as a function of participants' values, we regressed participants' METI ratings of the scientist in the stimuli onto the Conclusions condition, Participants' Values variable, and the Conclusions by Participants' values interaction term. The full model was significant, adj. R2 = 0.173, F(3, 840) = 59.95, p < 0.001 (Table 4, model 2). As with the earlier analysis, results showed a main effect of the Conclusions condition, such that participants rated the scientist who reported that BPA does not cause harm as less trustworthy than the scientist who reported that BPA causes harm, β = −0.75, t(840) = −4.51, p < 0.001. However, this effect was qualified by a significant interaction with participants' values, β = −0.41, t(840) = −2.16, p = 0.031. Participants who prioritized public health and read about a scientist who concluded that BPA causes harm rated the scientist as more trustworthy (Msd = 5.561.09) than participants with the same values who read about a scientist who concluded that BPA does not cause harm (Msd = 4.401.24; Figure 4).
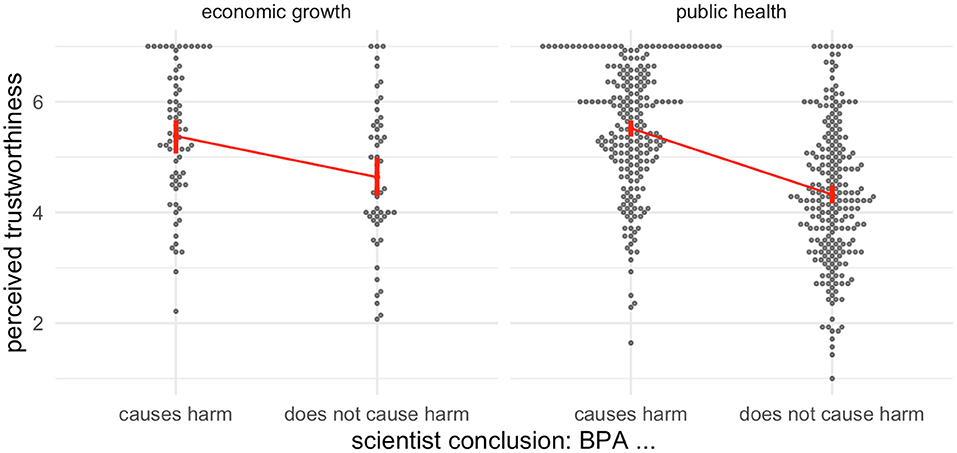
Figure 4. Data, group means, and 95% confidence intervals for H5-consumer, interaction of consumer risk sensitivity and participant values. Panels correspond to participant values.
3.4.2. Transparency penalty
To test whether the findings above about a hypothesized transparency penalty may vary based on participants' values, we regressed participants' METI ratings of the scientist onto the Disclosure condition variable, Participants' Values variable, and the Disclosure by Participants' Values interaction term. The full model was not significant, adj. R2 <0.001, F(3, 840) = 1.19, p = 0.31 (Table 5 model 2). As with the earlier analysis, our results do not provide evidence for a transparency penalty to the perceived trustworthiness of a scientist, either in general or interacting with participants' own reported values, β = −0.23, t(840) = −1.07, p = 0.286.
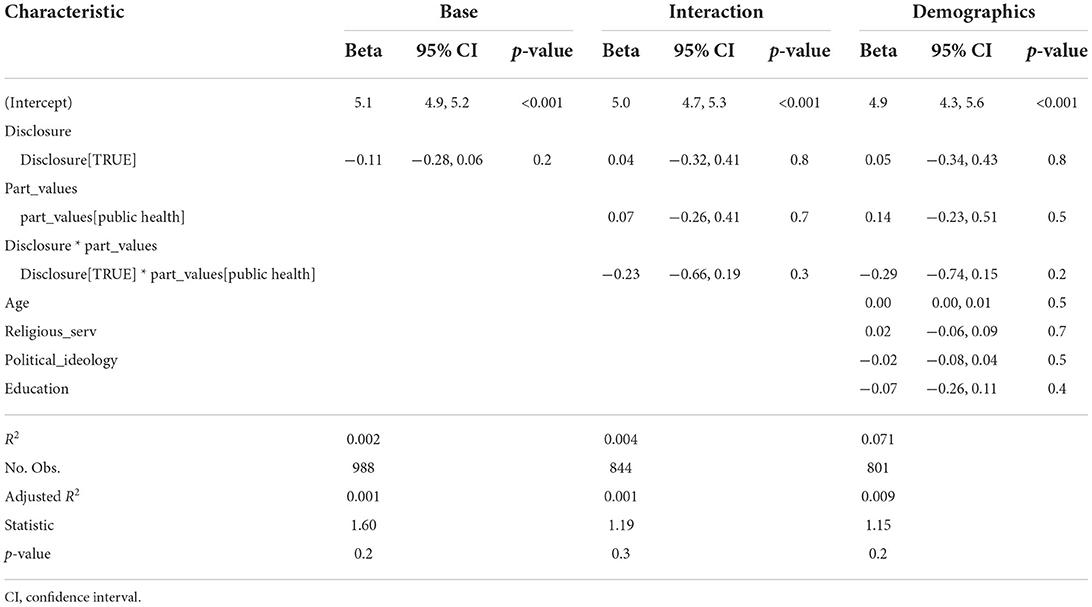
Table 5. Regression analysis of H5-transparency, interaction between participant values, and transparency penalty.
3.4.3. Shared values and scientist values
Without adjustments, Shared Values appears to have a substantial interaction with Participant Values: Shared Values appears to increase perceived trustworthiness for participants who value public health, while decreasing perceived trustworthiness for participants who value economic growth (Figure 5). However, as indicated by our analysis for a potential shared values effect, the estimated effects for both shared values and participant values are biased if the model is not adjusted for scientist values. (Figure 3 and Table 3 show how this bias occurs. Shared Values is a collider between Participant Values and Scientist Values; hence, if a model specification includes Participant Values and Shared values but not Scientist Values, there is an open path between Participant Values and METI, resulting in a biased estimate for Participant Values.) Because Shared Values is the logical biconditional of Participant Values and Scientist Values, and the Shared Values × Participant Values interaction term is their logical conjunction, including all four variables (Participant, Scientist, and Shared Values, along with the interaction term) in a regression model creates perfect collinearity.
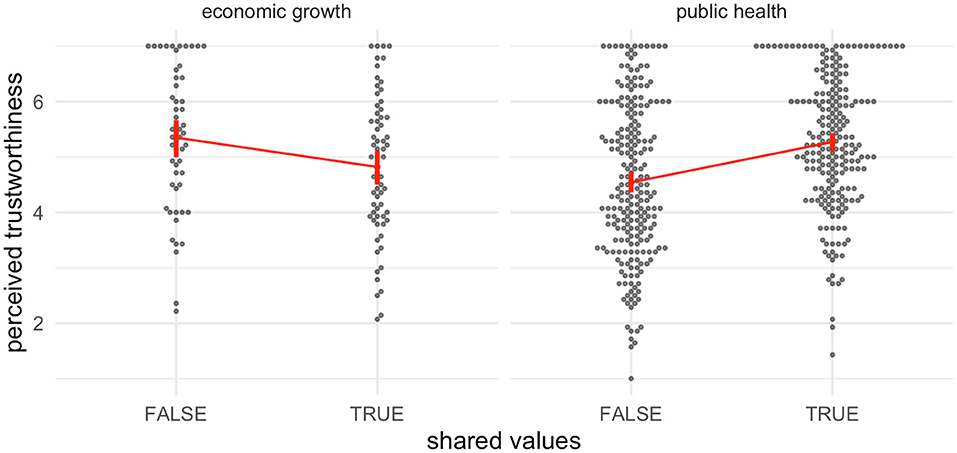
Figure 5. Data, group means, and 95% confidence intervals for H5-shared, interaction of shared values and participant values. Panels correspond to participant values.
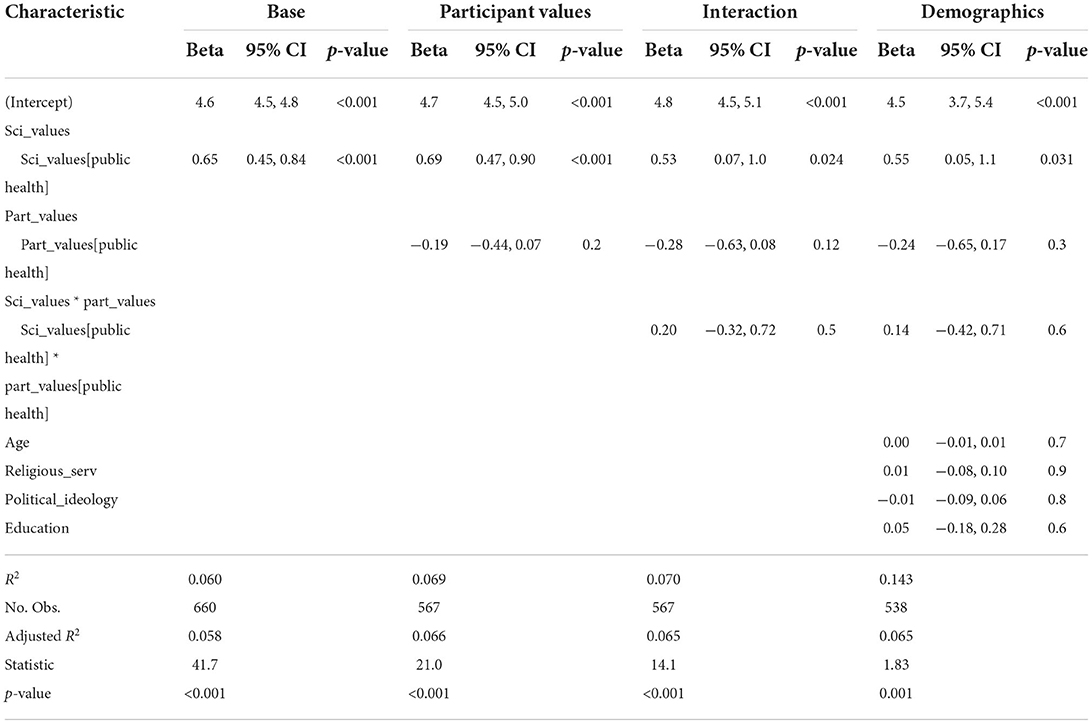
As we found above, rather than a shared values effect there appears to be an effect of scientist values. Replotting the same data as Figure 5 based on scientist values, rather than shared values, suggests a more consistent effect across participant values (Figure 6). Therefore, we conducted an unplanned post hoc analysis to test whether an effect of scientist values might vary as a function of participants values. We regressed participants' METI of the scientist in the stimulus onto the Scientist Values variable, Participants' Values variable, and their interaction (Table 6). This model was significant, adj. R2 = 0.065, F(3, 563) = 14.15, p < 0.001. The estimate for the scientist values term was significant, β = 0.53, t(563) = 2.26, p = 0.02, while the estimate for the interaction term was not, β = 0.20, t(563) = 0.75, p = 0.45. Estimates for both variables had large uncertainties, with confidence intervals of about 1 (95% confidence intervals, scientist values: 0.07, 1.0; interaction term: −0.32, 0.72).
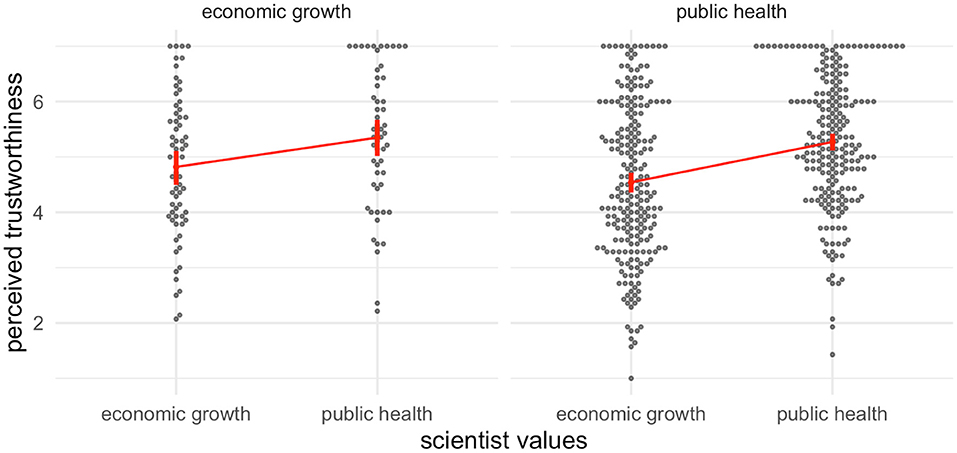
Figure 6. Data, group means, and 95% confidence intervals for a potential interaction of scientist values and participant values. Panels correspond to participant values. This figure is identical to Figure 5, except the columns in the economic growth panel have been switched.
4. Conclusion
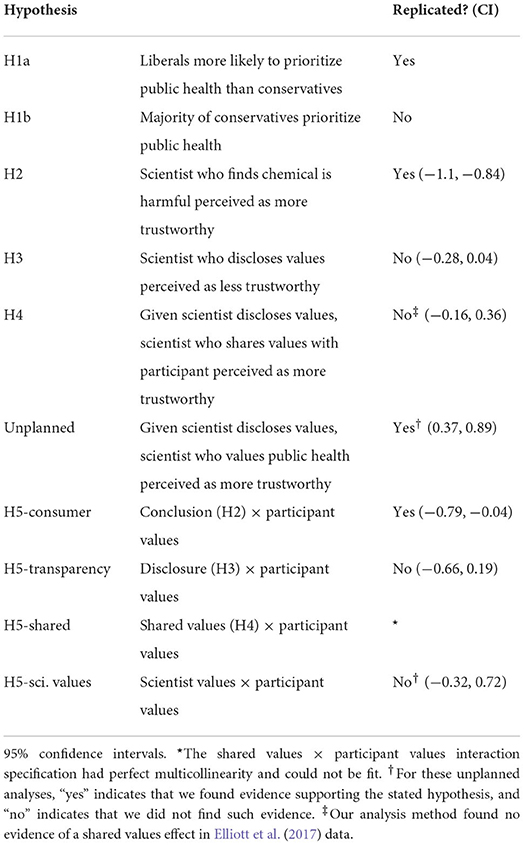
Table 7 summarizes the results of our replication attempts. We were able to successfully replicate the correlation between political ideology and valuing public health and consumer risk sensitivity (a scientist who concludes BPA is harmful is perceived as more trustworthy), and in addition found evidence of an interaction between consumer risk sensitivity and whether the participant values public health (participants who value public health have more extreme reactions to the scientist's conclusion).
We did not find evidence for a transparency penalty or shared values effect. And we found evidence of a scientist values effect (a scientist who discloses valuing public health is perceived as more trustworthy), which was not identified by Elliott et al. (2017).
Elliott et al. (2017) claim evidence for a shared values effect by comparing values disclosure vs. no disclosure (that is, estimating a transparency effect) in quasi-independent subsamples across a 2 × 2 × 2 design [participant values × scientist conclusion × scientist values; Elliott et al. (2017) Figure 1]. This approach is difficult to interpret; their reasoning seems to be that this estimate is statistically significant in 4/8 cells, and in 3/4 of these cells (1 where respondent values economic growth) the participant and scientist share values. But these analyses are underpowered (for example, sample sizes are well below 100 for some of the cells in which participants value economic growth) and the overall approach cannot distinguish a shared values effect from other potential effects (scientist values, participant values). Applying our regression analysis approach to the data published by Elliott et al. (2017), the estimate for shared values was not statistically significant, β = 0.29, t(335) = 1.75, p = 0.08; while the estimate for scientist values was statistically significant, β = 0.41, t(335) = 2.48, p = 0.014. It seems likely that claims of a shared values effect could have been an artifact of a less appropriate analytic approach given the nature of the data.
The disagreement over a transparency penalty is more difficult to explain. Using our approach and the data from Elliott et al. (2017), the estimate for a values disclosure was statistically significant (Table 2, model 1). One possible explanation is that, over the course of the COVID-19 pandemic, members of the general public have become used to “scientists” (broadly including both bench researchers and public health officials) making claims about the importance of protecting public health. A values disclosure that might have been regarded as violating the value-free ideal, pre-pandemic, might now be seen as routine.
The scientist values effect—a scientist who discloses valuing public health is perceived as more trustworthy—might be interpreted as supporting some of the claims of the “aims approach” in philosophy of science. This approach argues that scientific fields often have both social or practical aims, along with epistemic aims such as the pursuit of truth (Elliott and McKaughan, 2014; Intemann, 2015; Potochnik, 2017; Fernández and Hicks, 2019; Hicks, 2022). For example, the field of public health might have the practical aim of promoting the health of the public. Where certain values are seen as conflicting with these aims, it is morally wrong for a scientist to promote those values. Rather than violating the value-free ideal, a scientist who discloses valuing public health might be seen as following the norms of the field of public health.
All together, regarding the philosophical debates over values in science, the evidence from this replication study suggests that the effects of transparency on perceived trustworthiness might be context-dependent. Transparency about the influence of values might be detrimental in some cases, beneficial in others, and neutral in still others. Notably, both of the papers cited as objecting to transparency (John, 2017; Kovaka, 2021) focus on climate change, while many of Elliott's examples come from toxicology or environmental public health. The critics might be right that transparency has undermined trust in the climate context, while Elliott might be right that transparency can be neutral or even beneficial in some public health contexts. Because philosophers of science tend to work with a small number of rich case studies, methods such as qualitative comparative analysis (QCA; Ragin, 2013) would be worth exploring.
An obvious difference between climate and BPA is the public prominence and political polarization of the two issues. For decades, the fossil fuels industry has used a range of strategies to successfully attack the perceived trustworthiness of climate scientists, especially in the minds of conservative publics (Oreskes and Conway, 2011; Supran and Oreskes, 2017). While the chemical industry has also had a substantial influence on the environmental safety regulatory system (Michaels, 2008; Vogel, 2013), controversies over BPA have received much less public attention. A LexisNexis search indicates that uses of “bisphenol” in US newspapers rose and then almost immediately fell around 2008, shortly after a US consensus conference concluded that “BPA at concentrations found in the human body is associated with organizational changes” in a number of major physiological systems (vom Saal et al., 2007).
In more prominent and/or polarized cases than BPA, a number of other psychological mechanisms might be activated. Motivated reasoning or identity-protective cognition (Kahan et al., 2012) might cause members of the general public to rate a scientist as more or less trustworthy insofar as the scientist agrees with the respondent's “side” of the debate, regardless of whether and which values are disclosed. That is, the scientist's conclusion might have a larger effect than the scientist's disclosed values. Alternatively, respondents might use values disclosures to identify whether a scientist is on “their side,” and so the scientist's disclosed values might have a larger effect than the scientist's conclusion. Careful attention to experimental design will be needed to separate these potential multiway interactions between conclusions, disclosures, and public prominence.
4.1. Limitations
As noted above, a major limitation of the current study is that the sample substantially underrepresents political conservatives. Our a priori DAG analysis and empirical robustness checks do not indicate any bias in our reported estimates due to this representation problem. However, our estimates could still be biased if any of the effects examined here have interactions with political ideology.
Another limitation is that our sample only considers US adults. It does not include residents of any other country, and does not track where our participants might live within the US. Public scientific controversies often have different dynamics both across national borders and within different regions of geographically large countries (Miles and Frewer, 2003; Howe et al., 2015; Mildenberger et al., 2016, 2017; Sturgis et al., 2021).
A third limitation is that the stimulus only considers a single controversy, over the safety of the chemical bisphenol A (BPA). Public attention to this controversy peaked around 2009. While it remains unsettled in terms of both science and policy, it is much less socially and politically salient than controversies over topics such as climate change or vaccination. This limitation affects our ability to speculate about the generalizability of our findings. That is, the effects we reported may only apply narrowly to a subset of sociopolitically controversial scientific topics that have not achieved the degree of salience or persistence in sociopolitical discourse for as long as topics like climate change or vaccinations.
4.2. Directions for future work
The design from Elliott et al. (2017) assesses public perceptions of the value-free ideal indirectly, by probing whether violations of this ideal would lead to decreased perceived trustworthiness. But do members of the general public accept the value-free ideal? Concurrently with this replication study, we also asked participants directly for their views on the value-free ideal and related issues and arguments from the philosophy of science literature. A manuscript discussing this effort to develop a “values in science scale” is currently under preparation.
We suggest three directions for future work in this area, two in the experimental stimulus and one in the endpoint or outcome measured.
The stimulus developed by Elliott et al. (2017) involves a single (fictional) scientist. But public scientific controversies often feature conflicting claims made by contesting experts and counterexperts. For example, as the Omicron wave of the COVID-19 pandemic waned in the US in spring 2022, various physicians, public health experts, science journalists, and government officials made conflicting claims about the effective severity of Omicron, the relative effectiveness of masks in highly vaccinated populations, and the need to “return to normal” (Adler-Bell, 2022; Khullar, 2022; Yong, 2022). For members of the general public, the question was not whether to trust the claims of a given expert, but instead which experts to trust. Publics might perceive both expert A and expert B to be highly trustworthy, but would need to make a decision about who to trust if these experts are making conflicting claims. It would be straightforward to modify the single-scientist stimulus to cover this kind of “dueling experts” scenario. To modify METI, participants might be asked which of the two experts they would consider more competent, ethical, honest, etc. (Public scientific controversies can include other prominent actors with no relevant expertise, such as political journalists, elected officials, or social media conspiracy theorists. Such individuals might nonetheless be treated by publics as trusted sources for factual claims. Understanding why many people might trust a figure like Alex Jones over someone like Anthony Fauci would likely require prior work disentangling trustworthiness, expertise, and institutional standing.)
Brown (2022) emphasized a distinction between individuals, groups, and institutions, as both trustors and trustees, and argued that much of the philosophical and empirical research on trust in science has focused on either individual-individual trust (as in Elliott et al., 2017) or individual-group trust (as in the General Social Survey, which asks individual respondents about their confidence in “the scientific community”). In future experiments, “Dr. Riley Spence” could be represented with an institutional affiliation, such as “Dr. Riley Spence of the Environmental Protection Agency” or “Dr. Riley Spence of the American Petroleum Institute.” Or claims could be attributed directly to institutions, such as “Environmental Protection Agency scientists” or “a report published by the American Petroleum Institute.”
As noted above, ethicists make a distinction between trust and trustworthiness. Instruments such as METI assess trustworthiness: whether a speaker is perceived to have qualities that would make it appropriate to trust them. Trust itself is closer to behavior than attitudes, and would probably be better measured (in online survey experiments and similar designs) by asking whether participants accept claims made by speakers or support policy positions endorsed by speakers. In addition, research on the climate controversy suggests that acceptance of scientific claims might underpredict policy support. Since 2008, public opinion studies by the Yale Program on Climate Change Communication have found that only about 50–60% of the US public understands that there's a scientific consensus on climate change, that this understanding is politically polarized (conservatives are substantially less likely to recognize the consensus), but also that some climate policies enjoy majority support even among conservatives (Leiserowitz et al., 2022). Putting these points together, future research could ask participants whether they would support, for example, increased regulation of BPA, either instead of or along with assessing the perceived trustworthiness of the scientific expert.
Data availability statement
The datasets presented in this study can be found in online repositories. The names of the repository/repositories and accession number(s) can be found at: https://github.com/dhicks/transparency.
Ethics statement
The studies involving human participants were reviewed and approved by University of California, Merced, IRB. The Ethics Committee waived the requirement of written informed consent for participation.
Author contributions
DH: accountability and conception. DH and EL: manuscript approval, manuscript preparation, data interpretation, data analysis, data acquisition, and design. All authors contributed to the article and approved the submitted version.
Funding
Funding for this project was provided by the University of California, Merced.
Acknowledgments
For feedback on this project, thanks to Kevin Elliott and participants at the Values in Science conference and Political Philosophy and Values in Medicine, Science, and Technology 2022 conference.
Conflict of interest
The authors declare that the research was conducted in the absence of any commercial or financial relationships that could be construed as a potential conflict of interest.
Publisher's note
All claims expressed in this article are solely those of the authors and do not necessarily represent those of their affiliated organizations, or those of the publisher, the editors and the reviewers. Any product that may be evaluated in this article, or claim that may be made by its manufacturer, is not guaranteed or endorsed by the publisher.
References
Adler-Bell, S. (2022). The Pandemic Interpreter. Intelligencer. Available online at: https://nymag.com/intelligencer/2022/02/david-leonhardt-the-pandemic-interpreter.html (accessed February 24, 2022).
Brown, M. (2022). Trust, Expertise and Scientific Authority in Democracy. Michigan State University. Available online at: https://www.youtube.com/watch?v=y3XeP6e646g (accessed May 09, 2022).
CPS Historical Time Series Visualizations (2022). United States Census Bureau. Available online at: https://web.archive.org/web/20220312234236/https://www.census.gov/library/visualizations/time-series/demo/cps-historical-time-series.html (accessed July 13, 2022).
Cranor, C. F. (1995). The social benefits of expedited risk assessments. Risk Anal. 15, 353–358. doi: 10.1111/j.1539-6924.1995.tb00328.x
Douglas, H. E. (2009). Science, Policy, and the Value-Free Ideal. Pittsburgh, PA: University of Pittsburgh Press.
Elliott, K. C. (2017). A Tapestry of Values: An Introduction to Values in Science. Oxford: Oxford University Press.
Elliott, K. C., McCright, A. M., Allen, S., and Dietz, T. (2017). Values in environmental research: citizens' views of scientists who acknowledge values. PLoS ONE 12:e0186049. doi: 10.1371/journal.pone.0186049
Elliott, K. C., and McKaughan, D. J. (2014). Nonepistemic values and the multiple goals of science. Philos. Sci. 81, 1–21. doi: 10.1086/674345
Elliott, K. C., and Resnik, D. B. (2014). Science, policy, and the transparency of values. Environ. Health Perspect. 122, 647–650. doi: 10.1289/ehp.1408107
Fernández, P. M., and Hicks, D. J. (2019). Legitimizing values in regulatory science. Environ. Health Perspect. 127:035001. doi: 10.1289/EHP3317
Funk, C., and Rainie, L. (2015). Americans, Politics and Science Issues. Pew Research Center. Available online at: http://www.pewinternet.org/2015/07/01/americans-politics-and-science-issues/ (accessed July 02, 2015).
Gauchat, G. (2012). Politicization of science in the public sphere a study of public trust in the United States, 1974 to 2010. Am. Sociol. Rev. 77, 167–187. doi: 10.1177/0003122412438225
Goldenberg, M. J. (2021). Vaccine Hesitancy: Public Trust, Expertise, and the War on Science. Pittsburgh, PA: University of Pittsburgh Press.
GSS Data Explorer (2022). GSS Data Explorer. NORC at the University of Chicago. Available online at: https://web.archive.org/web/20220629231111/https://gssdataexplorer.norc.org/variables/178/vshow (accessed June 29, 2022).
Hendriks, F., Kienhues, D., and Bromme, R. (2015). Measuring Laypeople's trust in experts in a digital age: the muenster epistemic trustworthiness inventory (METI). PLoS ONE 10:e0139309. doi: 10.1371/journal.pone.0139309
Hicks, D. J. (2014). A new direction for science and values. Synthese 191, 3271–3295. doi: 10.1007/s11229-014-0447-9
Hicks, D. J. (2022). When virtues are vices: ‘anti-science' epistemic values in environmental politics. Philos. Theory Pract. Biol. 14:12. doi: 10.3998/.2629
Howe, P. D., Mildenberger, M., Marlon, J. R., and Leiserowitz, A. (2015). Geographic variation in opinions on climate change at state and local scales in the USA. Nat. Clim. Change 5, 596–603. doi: 10.1038/nclimate2583
Iannone, R., Cheng, J., and Schloerke, B. (2022). Gt: Easily Create Presentation-Ready Display Tables. Available online at: https://CRAN.R-project.org/package=gt
Intemann, K. (2015). Distinguishing between legitimate and illegitimate values in climate modeling. Eur. J. Philos. Sci. 5, 217–232. doi: 10.1007/s13194-014-0105-6
John, S. (2017). Epistemic trust and the ethics of science communication: against transparency, openness, sincerity and honesty. Soc. Epistemol. 32, 75–87. doi: 10.1080/02691728.2017.1410864
Kahan, D. M., Peters, E., Wittlin, M., Slovic, P., Ouellette, L. L., Braman, D., et al. (2012). The polarizing impact of science literacy and numeracy on perceived climate change risks. Nat. Clim. Change 2, 732–735. doi: 10.1038/nclimate1547
Kennedy, C., Blumenthal, M., Clement, S., Clinton, J. D., Durand, C., Franklin, C., et al. (2018). An evaluation of the 2016 election polls in the United States. Publ. Opin. Q. 82, 1–33. doi: 10.1093/poq/nfx047
Khullar, D. (2022). Will the Coronavirus Pandemic Ever End? The New Yorker. Available online at: https://www.newyorker.com/news/daily-comment/will-the-coronavirus-pandemic-ever-end (accessed May 23, 2022).
Kovaka, K. (2021). Climate change denial and beliefs about science. Synthese 198, 2355–2374. doi: 10.1007/s11229-019-02210-z
Lee, J. J. (2021). Party polarization and trust in science: what about democrats? Socius 7:23780231211010101. doi: 10.1177/23780231211010101
Leiserowitz, A., Maibach, E., Rosenthal, S., and Kotcher, J. (2022). Politics & Global Warming, April 2022. Yale Program on Climate Change Communication. Available online at: https://climatecommunication.yale.edu/publications/politics-global-warming-april-2022/ (accessed July 15, 2022).
McKaughan, D. J., and Elliott, K. C. (2013). Backtracking and the ethics of framing: lessons from voles and vasopressin. Account. Res. 20, 206–226. doi: 10.1080/08989621.2013.788384
Michaels, D. (2008). Doubt Is Their Product How Industry's Assault on Science Threatens Your Health. Oxford: Oxford University Press.
Mildenberger, M., Howe, P., Lachapelle, E., Stokes, L., Marlon, J., and Gravelle, T. (2016). The distribution of climate change public opinion in Canada. PLoS ONE 11:e0159774. doi: 10.1371/journal.pone.0159774
Mildenberger, M., Marlon, J. R., Howe, P. D., and Leiserowitz, A. (2017). The spatial distribution of republican and democratic climate opinions at state and local scales. Clim. Change 145, 539–548. doi: 10.1007/s10584-017-2103-0
Miles, S., and Frewer, L. J. (2003). Public perception of scientific uncertainty in relation to food hazards. J. Risk Res. 6, 267–283. doi: 10.1080/1366987032000088883
Oreskes, N., and Conway, E. M. (2011). Merchants of Doubt: How a Handful of Scientists Obscured the Truth on Issues from Tobacco Smoke to Global Warming. New York, NY: Bloomsbury.
Peer, E., Rothschild, D., Gordon, A., Evernden, Z., and Damer, E. (2021). Data quality of platforms and panels for online behavioral research. Behav. Res. Methods 54, 1643–1662. doi: 10.3758/s13428-021-01694-3
Potochnik, A. (2017). Idealization and the Aims of Science. Chicago, IL: London: University of Chicago Press.
R Core Team (2021). R: A Language and Environment for Statistical Computing. R Foundation for Statistical Computing. Available online at: https://www.r-project.org/ (accessed August 27, 2018).
Ragin, C. C. (2013). The Comparative Method: Moving Beyond Qualitative and Quantitative Strategies. Oakland, CA: University of California Press.
Representative Samples FAQ (2022). Prolific. Available online at: https://web.archive.org/web/20220313050153/https://researcher-help.prolific.co/hc/en-gb/articles/360019238413-Representative-samples-FAQ (accessed March 13, 2022).
Sjoberg, D. D., Whiting, K., Curry, M., Lavery, J. A., and Larmarange, S. (2021). Reproducible summary tables with the Gtsummary package. R J. 13, 570–580. doi: 10.32614/RJ-2021-053
Sturgis, P., Brunton-Smith, I., and Jackson, J. (2021). Trust in science, social consensus and vaccine confidence. Nat. Hum. Behav. 5, 1528–1534. doi: 10.1038/s41562-021-01115-7
Supran, G., and Oreskes, N. (2017). Assessing ExxonMobil's climate change communications (1977–2014). Environ. Res. Lett. 12:084019. doi: 10.1088/1748-9326/aa815f
Vogel, S. A. (2013). Is It Safe?: BPA and the Struggle to Define the Safety of Chemicals. Oakland, CA: University of California Press.
vom Saal, F. S., Akingbemi, B. T., Belcher, S. M., Birnbaum, L. S., Crain, D. A., Eriksen, M., et al. (2007). Chapel hill bisphenol a expert panel consensus statement: integration of mechanisms, effects in animals and potential to impact human health at current levels of exposure. Reprod. Toxicol. 24, 131–138. doi: 10.1016/j.reprotox.2007.07.005
Wickham, H., Averick, M., Bryan, J., Chang, W., D'Agostino McGowan, L., François, R., et al. (2019). Welcome to the tidyverse. J. Open Source Softw. 4:1686. doi: 10.21105/joss.01686
Yong, E. (2022). How Did This Many Deaths Become Normal? The Atlantic. Available online at: https://www.theatlantic.com/health/archive/2022/03/covid-us-death-rate/626972/ (accessed March 8, 2022).
Keywords: trust, trust in science, values in science, replication, philosophy of science
Citation: Hicks DJ and Lobato EJC (2022) Values disclosures and trust in science: A replication study. Front. Commun. 7:1017362. doi: 10.3389/fcomm.2022.1017362
Received: 11 August 2022; Accepted: 19 October 2022;
Published: 03 November 2022.
Edited by:
Dara M. Wald, Texas A&M University, United StatesReviewed by:
Merryn McKinnon, Australian National University, AustraliaMichael Dahlstrom, Iowa State University, United States
Copyright © 2022 Hicks and Lobato. This is an open-access article distributed under the terms of the Creative Commons Attribution License (CC BY). The use, distribution or reproduction in other forums is permitted, provided the original author(s) and the copyright owner(s) are credited and that the original publication in this journal is cited, in accordance with accepted academic practice. No use, distribution or reproduction is permitted which does not comply with these terms.
*Correspondence: Daniel J. Hicks, ZGhpY2tzNEB1Y21lcmNlZC5lZHU=
 Daniel J. Hicks
 Emilio Jon Christopher Lobato