 Paige Brown Jarreau1,2*
 Leona Yi-Fan Su3Elfy Chun-Lin Chiang4Shauna M. Bennett5
 Jennifer Shiyue Zhang3Matt Ferguson1Doryan Algarra1
- 1LifeOmic, Baton Rouge, LA, United States
- 2LSU, College of Science, Communications, Baton Rouge, LA, United States
- 3Charles H. Sandage Department of Advertising, University of Illinois at Urbana-Champaign, Champaign, IL, United States
- 4Freelance, Taipei City, Taiwan
- 5Freelance, Washington, DC, United States
Visual narratives are promising tools for science and health communication, especially for broad audiences in times of public health crisis, such as during the COVID-19 pandemic. In this study, we used the Lifeology illustrated “flashcard” course platform to construct visual narratives about COVID-19, and then assessed their impact on behavioral intentions. We conducted a survey experiment among 1,775 health app users. Participants viewed illustrated (sequential art) courses about: 1) sleep, 2) what COVID-19 is and how to protect oneself, 3) mechanisms of how the virus works in the body and risk factors for severe disease. Each participant viewed one of these courses and then answered questions about their understanding of the course, how much they learned, and their perceptions and behavioral intentions toward COVID-19. Participants generally evaluated “flashcard” courses as easy to understand. Viewing a COVID-19 “flashcard” course was also associated with improved self-efficacy and behavioral intentions toward COVID-19 disease prevention as compared to viewing a “flashcard” course about sleep science. Our findings support the use of visual narratives to improve health literacy and provide individuals with the capacity to act on health information that they may know of but find difficult to process or apply to their daily lives.
Introduction
The COVID-19 (Coronavirus Disease 2019) pandemic is a serious global health threat. COVID-19 has spread quickly and unrelentingly since its emergence in Wuhan, China in December 2019. The pandemic has had devastating impacts on human lives, public health, and the global economy. But it has also unified the scientific community in a mission to educate and engage the public in solutions such as public health precautions, including social distancing, testing, masks, engagement in clinical trials for vaccine candidates, and vaccination with approved vaccines. Educational resources about COVID-19 have subsequently exploded. However, communication efforts have left out large segments of the population with low health literacy skills (Frieden, 2020).
Health information has historically been presented such that it is not accessible to most Americans [“Health Literacy” by CDC (2021)]. Nearly a third of Americans have low general health literacy (Paasche-Orlow et al., 2005). While in this study we focused on developing and assessing health literate COVID-19 materials in a U.S. context, low health literacy and a lack of health literate materials are also problems globally. Nearly half of all Europeans have inadequate and problematic health literacy skills according to a WHO report (Kickbusch et al., 2013). Further, nine out of 10 adults in the U.S. struggle to understand and use personal and public health information that doesn’t follow health literacy guidelines [“Health Literacy” by CDC (2021)]. Much of the information about COVID-19 has fallen into this trap and is not accurate, trustworthy, and understandable by most people (Caballero et al., 2020). Many experts have pointed out that health literacy has been underestimated as a public health problem during the COVID-19 pandemic (Abdel-Latif, 2020; Paakkari and Okan, 2020).
Health-related educational resources designed for broad audiences, especially for adults with low levels of formal education, adults with mental health issues or disabilities (Kamalakannan et al., 2021), non-English speakers, or children, should follow health literacy best practices (CDC, 2021). They should be accurate, accessible, and actionable (CDC, 2021). They should make effective use of plain language, narrative, and visuals or multimedia to improve accessibility. But COVID-19 educational resources incorporating all of these elements remain rare as of the writing of this manuscript. Caballero and colleagues (2020) found that only 39% of assessed COVID-19 consumer materials from the internet included visual images that would have helped readers understand the information. Most of the materials failed to use plain language. Other experts have pointed out similar problems, including infectious disease specialist Benjamin P. Linas, MD. In late March, Linas observed an “absence of COVID-19 health education materials that could speak across language, literacy levels, and cultural norms” (Bailey, 2020).
Broadly accessible resources increased in availability in the months following the outbreak of COVID-19 and stay-at-home orders in the U.S. People produced simple cartoon-like patient factsheets in multiple languages (Bailey, 2020), kids’ visual storybooks, and other accessible resources1. Yet, these resources remained limited and urgently needed in more languages and on more topics, such as updated information on COVID-19, immune system responses, and vaccine candidates.
Early in the outbreak of COVID-19 in the U.S., we observed few educational materials or graphics that were accessible and actionable. We observed few resources that helped people understand how they should prepare, how and when they should self-isolate, what they could expect if they got sick, how their bodies would fight the virus, and who should seek emergency care and when. Such actionable information is critical given the devastating potential impact of COVID-19 for people with any risk factors, and every person’s role in helping limit the spread of COVID-19.
Park and colleagues (2020) found that among more than 1,000 U.S. adults recruited to a survey via Amazon’s Mechanical Turk, many people expressed uncertainty about length of quarantine and social distancing requirements. In another study from Germany, up to 52% of just over 1,000 participants reported difficulty accessing, understanding and applying information about how to recognize infection, when and how to find professional help upon infection, and risk factors of disease (Okan et al., 2020). Although these findings don’t necessarily mean that there weren’t educational materials available on these topics, materials on these topics may not have been accessible, easy to understand or health literate.
In addition, while stories of people’s COVID-19 infection experiences did start to appear in the local news media once COVID-19 began to spread in their communities, we didn’t see these stories within the educational resources of government and healthcare institutions. Most resources (especially visual ones) that we saw focused on the history and science of SARS-CoV-2 and the respiratory disease it causes, or abstract concepts such as “flatten the curve”. Meanwhile, there were mixed messages about mask wearing, risk factors and airborne infection risks. There seemed to be a gap in visual and broadly accessible educational materials covering the COVID-19 experience and how people should navigate the disease from prevention to treatment.
More accessible COVID-19 educational resources on a variety of topics are critical for the one in five U.S. adults with low literacy skills2 and the nearly one-third with low health literacy. But they are also important for people who may be experiencing isolation-exacerbated feelings of fear, stress, anxiety, and/or depression (Park et al., 2020). Stress and mental health issues can make it more difficult for people to process technical health-related information (CDC, 2021) and adhere to public health recommendations (Middleton et al., 2013; Beutel et al., 2018). Stress can lower health literacy or an individual’s capacity to put recommended preventative health behaviors into action.
In this study, we started to evaluate the impact of educational resources designed to address the audience and COVID-19 education gaps highlighted above. To do this, we leveraged a new visual science communication format developed by the science-art platform Lifeology.io. In March 2020, Lifeology published two expert-created illustrated “flashcard” courses about COVID-19 that contained plain language visual narratives suitable for broad audiences and people with low health literacy. The courses featured visuals created by professional artists. They were available in 20 + languages and addressed the topic gaps we identified above. One course (“Prevention Primer”) covered the basics of COVID-19 prevention and care, through the story of a family learning to navigate the pandemic. The other course (“Mechanism”) was more technical and covered the mechanisms of COVID-19 inside the body, risk factors and medical considerations for at-risk individuals.
The goal of this study was to test the impact of these two different “flashcard” courses on people’s self-reported self-efficacy, perceived threat, and behavioral intentions toward COVID-19, based on the Extended Parallel Process Model (EPPM). Another goal was to evaluate the ability of these courses to improve health literacy by helping people understand and use information about COVID-19. We did this through self-reported data of people’s experiences with and takeaways from the course content. We conducted an online survey experiment via Qualtrics. We were particularly interested to see any differences in impact between a course with more basic information about COVID-19, a course with more technical information about the mechanisms and risk factors of SARS-CoV-2 infection, and a control course about the general health benefits of sleep.
This study also represents a collaborative effort to put evidence-based science communication into practice (Jensen and Gerber, 2020) and then to measure some outcomes of that practice. We (the authors of this study) are a team of science communication researchers, health writers, industry science communicators, artists and designers. Evidence in science and health communication research, including literature in the field of health literacy reviewed below, informed the creation of the COVID-19 “flashcard” courses evaluated herein. These courses were viewed by over 24,000 people in 3 months; one course was translated into 20 + languages by community volunteers who wanted to share the courses with audiences in their own languages/countries/communities. While the courses were still highly relevant, we began collecting data via survey experiment to evaluate their impact on people’s self-efficacy and behavioral intentions, plugging practice back into research.
Literature Review
COVID-19 Pandemic and Educational Interventions
The necessity of clear, actionable, and broadly accessible health education (CDC, 2021) has never been more apparent than during the COVID-19 pandemic. According to the World Health Organization (WHO), risk communication and community engagement “is integral to the success of responses to health emergencies” (WHO, 2020a). Risk communication and community engagement “helps prevent “infodemics”; (an excessive amount of information about a problem that makes it difficult to identify a solution), builds trust in the response, and increases the probability that health advice will be followed” (WHO, 2020b, p. 1). Effective communication around COVID-19 should translate scientific information to improve understanding, make it relatable, and deliver it in an accessible manner to diverse populations and communities.
WHO has also provided specific recommendations for communication materials intended for community engagement during the pandemic. They have recommended that countries translate materials into relevant languages, adapt them to appropriate literacy levels, and create shareable (online) visuals/multimedia pieces that present key information. They have encouraged the creation of materials that “explain the disease etiology, symptoms, transmission, how to protect oneself, and what to do if someone gets sick” (WHO, 2020a). The United Nations and WHO even launched an unprecedented global call to creators3 to help stop the spread of COVID-19 through artwork, encouraging creativity and “empathetic communication” to promote the adoption of public health precautions across age groups, affiliations, geographies, and languages.
But despite these recommendations, there has been a dearth of COVID-19 educational materials in the U.S. that make information accessible to most adults and that are inclusive of different people and cultures. This has been despite the disproportionate impact of COVID-19 and related serious illness among racial and ethnic minority groups who are more likely to experience low health literacy (Eichler et al., 2009), including Hispanic/Latino and Black/African American persons (CDC, 2020).
Health Literacy and Models of Health Behavior Change
Health literacy has been defined as “the degree to which individuals have the capacity to obtain, process, and understand the basic health information and services needed to make appropriate health decisions” (Wagner et al., 2009, p. 860; Institute of Medicine, 2004). Modern definitions also focus on the capacity to process and understand health information and use and apply it. Health literacy “entails people’s knowledge, motivation and competencies to access, understand, appraise, and apply health information in order to make judgments and take decisions in everyday life concerning healthcare, disease prevention and health promotion to maintain or improve quality of life during the life course” (Sorensen et al., 2012). Low health literacy is associated with poorer health outcomes (Institute of Medicine, 2004). Health literacy can impact health-related knowledge, beliefs, motivations, self-efficacy, and ability to problem-solve with regard to self-care as well as using healthcare services (Paasche-Orlow and Wolf, 2007). Health-related knowledge, beliefs, motivations, and self-efficacy (and fear) are critical in determining health behaviors according to theories of health behavior action and change. These theories include the Health Belief Model and the Extended parallel process model (Jones et al., 2015; Sheeran et al., 2016).
Difficult-to-read health information and an overabundance of conflicting media health messages (as seen in the COVID-19 “infodemic”) exacerbate health literacy issues. They also contribute to poor health outcomes (Paasche-Orlow and Wolf, 2007). However, educational materials that are accessible and promote experiential learning, i.e., learning through a transforming experience (Kolb, 1984), can improve health literacy (Day, 2009). Improving health literacy can, in turn, improve beliefs, attitudes, and motivations toward health behaviors (Wagner et al., 2009). Educational materials that improve health literacy and address determinants of health behavior change are most likely to drive better health outcomes. Educational materials about COVID-19 should improve health literacy and help people turn their perceived threat from COVID-19 into action by helping them believe that they can act in ways that make a difference.
Educational materials that follow guidelines for improving health literacy are easier to read, digest, understand, and act upon. Health literacy guidelines focus on plain language, actionable information, resources that include visuals such as pictures and drawings, and an audience-centered approach that includes culturally appropriate messages (CDC, 2021). A growing body of research also focuses on the positive impact of visual narratives or storytelling, as seen in the body of research on Graphic Medicine. Storytelling and visual narratives with relatable human characters provide a fun and experiential way of learning that allows people to reflect on information and relate to it on a personal level (Day, 2009).
With this study, we sought to evaluate the impact of health literate visual narratives (Lifeology “flashcard” courses) on content experiences, attitudes and behavioral intentions toward COVID-19. Below, we review relevant literature on the potential impact of visuals and storytelling on health literacy and determinants of health behavior.
Research Question RQ1: To what extent do people report visual narratives (about COVID-19 or another health topic) as being easy to understand, informative and engaging?
Role of Visuals in Science and Health Education
People typically enjoy content that is visual or that includes illustrations and sequential art (e.g., comics) more than they do content that is not visual (Z. Dayan, 2018). In a recent study, medical and healthcare students indicated enjoying multimedia (a mix of images and text, and sometimes sound) as a practical learning tool (Vagg et al., 2020). Visuals can also aid learning among students with different learning styles and preferences (Aisami, 2015). Visuals can improve people’s motivation to learn (Aisami, 2015), increase their engagement with message content (Lazard and Atkinson, 2015), and improve information processing and retention: “Words are abstract and rather difficult for the brain to retain, whereas visuals are concrete and, as such, more easily remembered” (Aisami, 2015, p. 542). Scientific concepts, like words, are also abstract. Visuals can make them more concrete and easier to grasp.
Visuals can also stimulate critical thinking. Visual representations draw more attention than text-only messages. Visuals facilitate information processing and enhance message elaboration (Cvijikj and Michahelles, 2013; Kim et al., 2015; Lazard and Atkinson, 2015). Townsend et al. (2008) found that text with color photographs increases understanding and learning of a food behavior checklist most when compared with text alone, text with line drawings, and text with grayscale photographs. This highlights the positive potential of colorful artwork in improving people’s engagement with science and health information.
People with limited literacy or language skills in particular “benefit from illustrations, not just words” (Osborne, 2012 p. 214). Visuals “can help people take in information faster and more accurately, and remember it better” (Osborne, 2012, p. 214), improving attention to, comprehension of, and recall of technical and health information (Houts, et al., 2006). People with low literacy skills are especially likely to benefit from visuals accompanying text (Houts et al., 2006).
Healthcare providers are encouraged to use visuals and multimedia resources when communicating with people with low health literacy (Hart et al., 2015) to improve patient knowledge (Nova et al., 2019). Empathetic and positively framed visuals and data visualizations in health education materials may help reduce anxiety (Demircelik et al., 2016) and minimize emotional stress associated with risk communication and getting negative prognostic information (Kim et al., 2020). Visuals may even improve behavioral intentions and behaviors, especially among low literacy audiences (Houts et al., 2006). These impacts are observed when viewers have a positive emotional response to visuals in health education materials (Delp and Jones, 1996).
Visual Storytelling for Science and Health Communication
There is a growing field of research around the use of narrative visual formats, sequential art, or visual storytelling for science and health communication. These formats combine the power of visuals with the power of storytelling (Green and Brock, 2002; Leung et al., 2014; Wang X. et al., 2019) to aid information processing and recall, enhance understanding, and increase engagement. For example, comics are a form of sequential art that combines visuals and plain language storytelling. Comics are preferred over other types of visual narratives because they often include characters readers can relate to, short text that is easy to read, and a story arc that keeps their attention (Wang Z. et al., 2019).
In school and healthcare settings, comics are effective at increasing knowledge and awareness of health issues/conditions (Ohyama et al., 2015; Tekle-Haimanot et al., 2016). In one study, a comic about pediatric anesthesia helped reduce preoperative anxiety in children (Kassai et al., 2016). In another study, Leung and colleagues (2014) found that exposure to relatable characters in a detailed artwork comic can capture imagination and influence health behaviors. A comic combining concise text and detailed artwork that encouraged fruit intake increased self-reported self-efficacy and snack selection in urban minority youth (n = 57). This happened regardless of changes in knowledge. The youth who read the comic were also more absorbed in the content (they reported paying attention without getting distracted) than youth who read a newsletter. The researchers surmise that greater transportation into the narrative of the comic lead to the observed changes in health-related outcomes: “(N)arratives that transport readers have been shown to change beliefs and motivate behavior change” (Leung et al., 2014).
Most studies have investigated the impact of visual narratives among younger audiences. However, there is early evidence that they can also help people of all ages. Health professionals are being encouraged to apply similar mediums—illustrated stories or comic strips—to communicate with older patients and their caregivers. According to behavioral science expert and RN Sarah Kagan, “(m)uch of what we provide as educational material lacks interest, overshoots reading level, and necessarily includes an enormous level of detail” (Kagan, 2018). Some researchers and science communicators have used visual narratives to engage people in preventing the spread of COVID-19. Igarashi et al. (2020) found that manga comics, as a form of visual storytelling steeped in culture and lived experience, can “provide the public with a deeper understanding of (scientific) messages through … characters and their “real-life” situations” (2020, p. 1).
Visual narratives in health education may be especially appropriate for individuals with low health literacy or limited prior knowledge about the topic being communicated (Mayer, 1997; Schnotz and Bannert, 2003). According to comic research expert Matteo Farinella, “the visual language of comics might make information, not only more accessible, but also help to overcome linguistic barriers” (Farinella and Mbakile-Mahlanza, 2020). The cartoon-like visual nature of comics and other visual narratives may also make scientific information less daunting and more approachable for people. When it comes to the communication of sensitive health topics or complex, unfamiliar, or scary topics like vaccines (Muzumdar and Pantaleo, 2017), people often prefer simplified, stylized, conceptual, or interpretational illustrations over photographs and realistic art (Haragi et al., 2019; Farinella and Mbakile-Mahlanza, 2020).
Despite the burgeoning research field around comics and other narrative visual formats, visual storytelling remains poorly studied in terms of its efficacy for health and risk communication among broader publics in real-world settings (Farinella, 2018). Lifeology “flashcard” courses provide opportunities for further research in this area. They are similar to graphic novels or comics in combining short text with relevant detailed visuals in cards that tell a story and often include characters. We wanted to see when or for whom the visuals in these courses mattered, which we explored through participants’ self-reported content experiences.
Research Question RQ2: Which factors are correlated/associated with self-reported attention to the visuals in a visual narrative about COVID-19 or another health topic?
Heuristic-Systematic Model of Information Processing
Developed by Chaiken (1980), the heuristic-systematic model (HSM) stated that information can be processed via two approaches: systematic and heuristic. Systematic processing often occurs when an information seeker is highly motivated and capable of digesting data; thus, the individual pays more attention to message content (Metzger et al., 2010; Katz et al., 2018). Conversely, when an individual lacks motivation or the ability to comprehend information, they may rely on contextual factors such as visual or vocal cues to make judgments (Wang X. et al., 2019; Kim, 2018; Lahuerta-Otero et al., 2018). Additionally, some researchers have found that heuristic processing is more dominant than systematic processing, because the former requires less cognitive effort (Chan and Park, 2015; Lahuerta-Otero et al., 2018).
In this study, we use HSM as a framework to investigate the impacts of visual narratives on health-related perceptions (attitudes and beliefs) and behavioral intentions. For example, individuals with lower health literacy or education (lower education is related to lower health literacy) may rely on and pay greater attention to the visuals in an illustrated flashcard course about COVID-19 to process the message. But even highly educated individuals could rely on and pay greater attention to the visuals in a more technical course about the mechanisms of COVID-19 in the body, because technical science and health information can be difficult for anyone to understand and apply in their own lives. Regardless, we would expect greater attention to visuals to result in improved engagement with the content/message and improved outcomes.
This idea—that greater attention to visuals in educational materials improves engagement and outcomes - is related to the concept of absorption (Oh et al., 2015), immersion, or transportation with content being related to associated outcomes. Absorption is defined as “the degree to which users experience temporal dissociation, focused immersion, heightened enjoyment, curiosity, and control over the computer interaction” (Agarwal and Karahanna, 2000; Oh et al., 2015, p. 740) when interacting with media. Greater absorption can improve behavioral intentions. Both attention and absorption can be conceptualized as components of content engagement. But in this study, we were particularly interested in attention to visuals as a key component of engagement—consisting of qualities like attention, focus, curiosity, interest (Webster and Ho, 1997)—with illustrated flashcard courses.
Research Question RQ3: Is greater self-reported attention to the visuals in a visual narrative about COVID-19 associated with increased self-efficacy, perceived threat, and protective behavioral intentions toward COVID-19?
Health Communication and the Extended Parallel Process Model
In this study, we also explored whether and how understandable and engaging visual narratives about COVID-19 can drive behavior change, either directly and by activating perceived threat and self-efficacy (Witte, 1994). According to the EPPM, external stimuli that increase perceived efficacy and perceived threat (including severity of the threat and one’s susceptibility to it) along with fear can increase protection motivation, message acceptance, and behavioral intentions. People can respond to risk messages and fear appeals in one of three ways: 1) through danger control, for instance in the form of behavioral intentions in line with the message recommendations; 2) fear control (e.g., denial, avoidance); 3) no response.
It is important to note that during the global spread of SARS-CoV-2, fear and perceived threat from COVID-19 have generally been high, especially among older adults. In May 2020, Pew Research found that in the U.S., 38% of adults total, 43% of adults between the ages of 50 and 64, and 49% of adults over the age of 65 see COVID-19 as a major threat to their personal health (Schaeffer and Rainie, 2020). Younger adults also tended to report high levels of emotional distress. In light of this, we expected that educational content that delivered empowering information about COVID-19 prevention and care would improve protective behavioral intentions through improvements in self-efficacy in particular. While perceived threat is key to motivating behavior change according to the EPPM, self-efficacy is key to a positive response. Some researchers have also proposed that “as perceived threat increases when perceived efficacy is low, people will do the opposite of what is advocated” (Popova, 2012, p. 463).
Based on the EPPM, risk messages that increase people’s self-efficacy in the face of a health threat can help to drive positive behaviors that may protect them from that threat. Based on research we’ve reviewed above related to health literacy, highly health literate educational content (which is understandable, visual, engaging, actionable) should be best able to help improve people’s understanding of the health threat, and their self-efficacy or knowledge of how to protect themselves and confidence in their ability to do so. We explore this idea through our final research question and corresponding hypotheses, which we analyze in Means of Self-Efficacy, Perceived Threat and Behavioral Intentions Across Course Conditions and Course Impacts on Behavioral Intentions.
Research Question RQ4: Can understandable and engaging visual narratives about COVID-19 improve self-efficacy and protective behavioral intentions?
Hypothesis H1: People who view a visual narrative about COVID-19 will have increased self-efficacy toward protecting themselves from COVID-19 than people who view a control narrative.
Hypothesis H2: People who view a visual narrative about COVID-19 will have improved protection behavioral intentions toward COVID-19 than people who view a control narrative.
Hypothesis H3: Self-efficacy and perceived threat will mediate the impact of viewing a visual narrative about COVID-19 on protection behaviors.
For all hypotheses, we planned to look at the impact of two illustrated flashcard courses about COVID-19 separately.
We did not predict that viewing an illustrated flashcard course about COVID-19 would increase viewers’ perceived threat from COVID-19 compared to a control course. We did not predict this because we thought that perceived threat would already be high in general among study participants given the state of the pandemic in the U.S. at the time (late March). However, we did plan to explore whether the more technical “Mechanisms” COVID-19 course would raise perceived threat, as this course discussed risk factors of severe COVID-19 illness.
Methods
Educational Platform—Lifeology “Flashcard” Courses
Lifeology’s illustrated flashcard courses are self-contained digital and interactive online card decks, where each card contains a small amount of text (one to three short sentences) along with a custom illustration. The cards contain sequential art that, along with bite-sized text, tells a story. The course viewer allows users to swipe or click through the course flashcards. It also allows users to toggle between different language options, tap/click to see information sources, tap/click to learn more about the course creators, and submit feedback. The course viewer is optimized for mobile devices but is responsive and works in any smart-device or desktop web browser. Courses are free and often published under a CC-BY-SA Creative Commons license.
Each course is the product of a collaboration between one or more technical experts, one or more plain-language writers, and an artist. It is becoming increasingly important to incorporate diverse, creative, and non-technical voices in the creation of science and health educational materials. Diverse perspectives improve the accessibility and relatability of science and health information for broad audiences. Every course also goes through a collaborative creation process4 that conforms to established health literacy strategies (Osborne, 2012). The process includes collaborative identification of one or a few key messages, card script-writing by a plain-language writer, visual storyboarding, fact-checking by external scientists, and listening to early audience feedback.
The courses evaluated in this study incorporate features that meet modern recommendations of health literacy experts (Osborne, 2012; “Principle: Understandable”; WHO, 2020a; Simmons et al., 2017; Mayer, 2003). These include: plain language and succinct sentences; definition of technical terms; conversational and positive tone; actionable information; narrative elements including characters and a story-arc; text in close proximity to related visuals. The visuals also incorporate features important for health literacy including: high detail but not hyper-realistic visuals; informative visuals that show characters/people at their best modeling desired behaviors; illustrations that communicate scale and context, as for cells or virus particles; storytelling.
Study Procedure
We conducted an online survey experiment. Participants were randomly assigned to one of three stimulus (flashcard course) conditions: a course about sleep; a Prevention Primer course about the basics of COVID-19 prevention and self-care; a Mechanism course about how the novel coronavirus impacts our body. The study was approved for IRB exemption by Louisiana State University (IRB# E11953).
Study participants first answered questions about whether their state of residence was under a stay at home order, their perceived knowledge about COVID-19, and attention to news about it. Participants were then instructed to open and swipe/click through “a series of health-related flashcards organized into a mini-course” and answer some questions about it. We used an opened-ended question asking participants what the course was about and what they had learned, to ensure that participants had opened and browsed through the course cards. Finally, participants answered questions related to their perceptions of the course they had viewed, their perceptions of COVID-19 as a threat to their health, their self-efficacy and their behavioral intentions toward COVID-19 protection and care, and demographics.
Stimulus Content
The control flashcard course5 covered why we sleep, sleep patterns of humans and animals, and sleep hygiene tips for brain health. It was illustrated in a storybook style by artist Ariella Abolaffio.
The COVID-19 Prevention Primer course6 titled “What do I need to know about the 2019 novel coronavirus?” focused on explaining and clarifying basic information about COVID-19. It introduced and explained the viral cause of COVID-19 and the lifestyle and environmental changes that are recommended to keep people healthy and safe from infection. The content addressed what people could expect during the outbreak and what they might do if a family member were to get sick. The course used a detailed cartoon-like visual style and pictorial/representation visuals (Haragi et al., 2019) to illustrate preventative behaviors and processes people could adopt such as handwashing and social distancing (Figure 1). The course was illustrated by science artist Elfy Chiang.
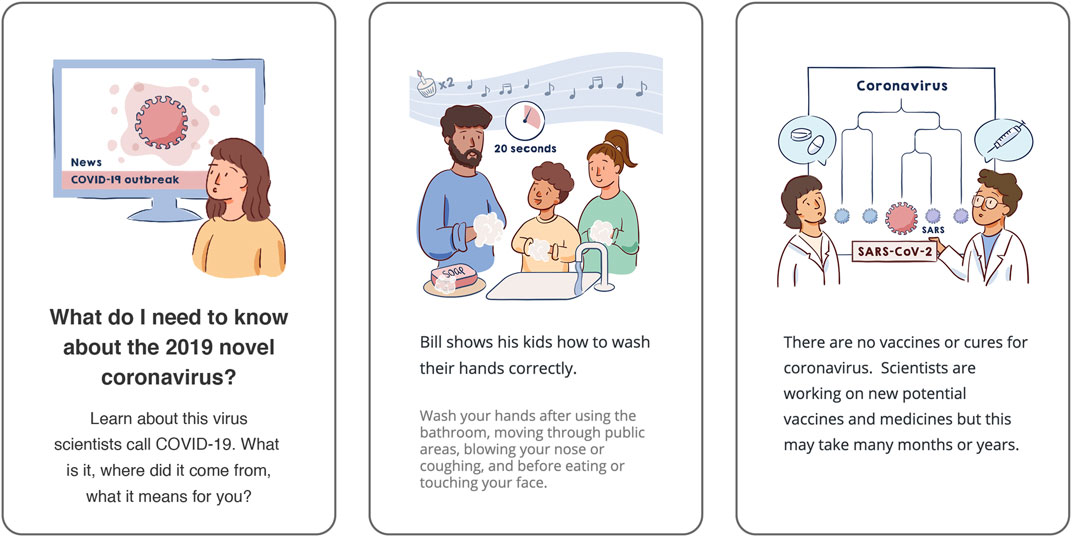
FIGURE 1. Above we’ve reproduced three of the “cards” contained within the COVID-19 Primer Prevention course, as they would be seen on a mobile device. The first is the title card of the course, while the others are example cards to demonstrate the visual style, informational content, and amount of text.
The COVID-19 Mechanism course7 titled “What does the coronavirus do in my body?” covered how the virus SARS-CoV-2 infects cells, infection mechanisms at the cellular level, how the body fights back, why some people are at risk for more severe illness and when they should seek care. This course followed a character from the Primer course but focused on providing a basic understanding of how viruses cause symptoms, how people recover from infection, and why there are differences in disease severity. This course used more interpretational (Haragi et al., 2019), metaphor-communicating visuals in a hand-drawn but digitized watercolor style to enhance understanding of the technical information about virology and the immune response (Figure 2). The course was illustrated by science artist Elfy Chiang.
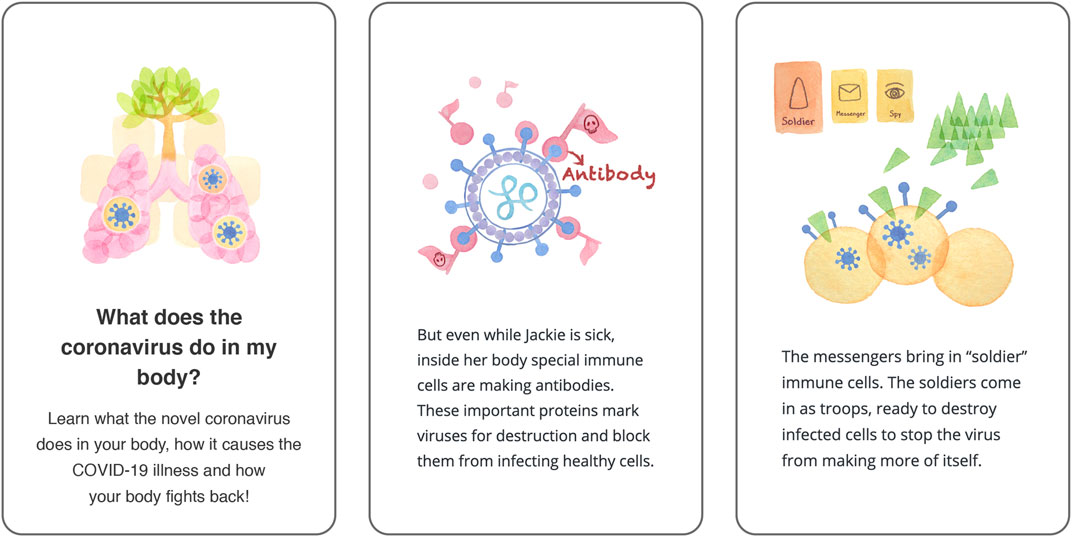
FIGURE 2. Above we’ve reproduced three of the “cards” contained within the COVID-19 Mechanism course, as they would be seen on a mobile device. The first is the title card of the course, while the others are example cards to demonstrate the visual style, informational content, and amount of text.
We assessed whether the courses were health literate based on validated external tools including the SMOG (McLaughlin, 1969) online calculator, a tool for assessing reading level, and the PEMAT for printable materials (Shoemaker et al., 2014)8.
The SMOG index was 9.2 for the Primer course and 9.3 for the Mechanism course, meaning they were both at a sixth grade reading level and “easy to read”.
We evaluated PEMAT understandability and actionability scores for our COVID-19 courses, and we also had an independent reviewer submit scores—the independently derived scores matched our own. We evaluated the Primer course to have a 95% Understandability Score (14 out of 15 points9) and an 80% Actionability Score (4 out of 5 points10). We deducted one point for not providing a “tangible tool” for taking action, although we linked to WHO and CDC guidance and resources on home care and prevention for COVID-19. We evaluated the Mechanism course to have an 87% Understandability Score (13 out of 15 points) and a 60% Actionability Score (3 out of 5 points). We took a point away on Understandability for the Mechanism course for some technical terms like cytokines and antibodies, even though we defined them. We also took a point away on Actionability for “steps to action”—this course was more focused on informing people about COVID-19 risk factors.
Variables and Scales
Following News About COVID-19
We measured (pre-stimulus) how closely participants were following news about COVID-19 on traditional news media outlets in print, on TV, or online, on a 5-point scale from not at all closely to very closely.
Perceived Knowledge About COVID-19
We Asked Participants “How informed would you say you are about COVID-19?”, measured (pre-stimulus) on a 5-point scale from not at all to very.
Understanding and Learning
We measured perceived learning or the degree to which people found courses informative (“I learned a lot”), and understanding (“It was easy for me to understand the information”), as single items on 5-point scales, based on level of agreement. We also explored how relatable the course was to people (“The mini-course was created with people like me in mind”) as a single item on a 5-point scale.
We assessed basic COVID-19 knowledge with a 4-item quiz (Sum of items, mean score = 3.87, SD = 0.38). Its usefulness was limited by a low Chronbach’s alpha of 0.21. Although Chronbach’s alpha is not always a useful characteristic of knowledge instruments (Taber, 2018), we’ve only used the sum of knowledge items related to information presented across the two COVID-19 courses as an informal check and context for our self-reported learning measure.
The quiz consisted of true/false statements for the following: Scientists are working on developing potential vaccines for COVID-19 (true); Coronaviruses are found only in humans (false); Some people with COVID-19 have no symptoms (true); When practicing social distancing, 3 feet is the recommended distance (false).
Attention and Absorption
We measured self-reported attention to the visuals and absorption in the content of the course based on items taken from Agarwal Karahanna (2000) and Oh et al. (2015). Participants were asked to indicate their level of agreement on a 5-point scale (strongly disagree to strongly agree) to statements “I paid close attention to the graphics and visuals in the mini-course” and “The mini-course held my attention all the way through to the end”. These two variables are moderately correlated (Correlation = 0.48, p < 0.001) and used separately.
Perceived Threat
We evaluated COVID-19 risk perceptions as a 4-item scale (Chronbach’s alpha = 0.67) based on level of agreement on a 5-point scale to statements reflecting participants’ belief that they could get COVID-19, that they could get very sick, and that COVID-19 is serious; personal feelings of risk because of COVID-19; belief that COVID-19 is serious. This measure and items represent threat in the EPPM and were taken from Witte et al. (1996) and Popova (2012).
Self-Efficacy
We evaluated self-efficacy for COVID-19 prevention and care as a 3-item scale (Cronbach’s Alpha = 0.68) based on level of agreement on a 5-point scale to the following statements: “I feel confident in my ability to protect myself from getting COVID-19”, “I know how to protect myself from getting COVID-19”, “I know what to do if I get COVID-19 and when to seek emergency care if necessary”. This measure incorporates both knowledge about COVID prevention and self-care and belief about one’s ability to act on that knowledge. This measure represents self-efficacy in the EPPM.
Behavioral Intentions
We evaluated behavioral intentions as an 8-item scale (Chronbach’s Alpha = 0.87). We measured participants’ likelihood to engage in the following behaviors during the COVID-19 pandemic, on a 5-point scale from extremely unlikely to extremely likely: Stay 6 feet from others in public spaces, wash hands often, limit visits to public places or crowds, wear a face mask/covering in public, avoid visits with people I don’t live with, follow government recommendations, stay at home as much as possible. All behavioral items were derived from official public health recommendations published by the CDC and other official sources.
Demographics
We measured demographic and other personal information including age, gender, formal education level, location (state), and existence of a stay-at-home order in the participant’s state. Participants represented all 50 states and DC.
Data Collection, Cleaning, and Analysis
We collected data via a Qualtrics online questionnaire, which linked participants out to the courses in a new window that automatically closed upon course completion. Participants were recruited from two mobile health tracking apps—the LIFE Fasting Tracker (185k users received a study email) and the LIFE Extend mobile health applications (4,616 received a study email). To avoid recruiting too many participants, we recruited only participants that had 1) used the app at least one time within the previous 30 days, 2) a valid email address linked to their mobile application account, and 3) country of residence was the United States. An invitation to participate was sent to the eligible participant pool using an industry-standard mobile application data and analytics platform (MixPanel). The email outlined the study with a button/link to participate, the estimated time to complete, and a random reward for completion. All participants who clicked to participate received a follow-up “thank you” email and reminder to complete the questionnaire.
By May 22, 2020 (first email sent on May 8), 1,890 users completed and submitted the questionnaire, while 1,670 users had responses in progress. The completion rate was 53%. Based on emails opened (n = 37,581), the response rate for partial completions was 9.5% (1.8% based on total emails sent), while the rate of study invite emails open to completion was 5% (0.97% based on total emails sent).
We processed and analyzed all anonymous survey responses in SPSS. For data analysis, we only included partial responses where respondents completed more than half of the questionnaire and answered at least some of the post-stimulus dependent variables (starting with risk perceptions) (n = 65). We also removed responses (n = 115) where participants didn’t correctly answer an attention filter question correctly or incorrectly answered what the course was about (responded “flu” as opposed to sleep or the novel coronavirus). We ended up with a total of 1,775 responses. The minimum time for questionnaire completion among these was 4.5 min.
To explore our research questions, we used ANOVA or ANCOVA tests to evaluate the impact of stimulus condition (categorical variable) as well as covariates that were not substantially correlated (typically age, gender and level of education) on interval data dependent variables. We assumed linearity, and normal distribution on dependent variables which we confirmed with histogram plots (understanding and behavioral intentions were most left skewed). We used conservative Bonferroni post hoc tests to adjust for multiple pairwise comparisons between stimulus conditions. Because Levene’s test was sometimes significant in our ANOVA tests, we report the Welch F statistic (does not assume equal variances) for these tests.
White test for heteroskedasticity was positive in univariate tests predicting learning, absorption, and quiz scores. However, parameter estimates with robust standard errors (HC3 method) revealed no differences in significant results or differences between standard errors and robust standard errors (Hayes and Cai, 2007). Therefore, we report the standard statistics for ANOVA, ANCOVA and linear regression tests below. For ANCOVA tests, we report effect size as R2.
We used linear regression to test our hypotheses with continuous interval outcome variables. In these regression tests, residuals for outcome variables (self-efficacy, threat, behavioral intentions) were normally distributed.
Results
Demographics and Descriptives
Our final data analysis included 1,775 participants: 637 participants (36%) saw the control course about sleep, 546 (31%) saw the COVID-19 Prevention Primer course, and 592 (33%) saw the COVID-19 Mechanism course. Randomization was successful - there were no significant differences in participant age, education level, stay at home order status, self-reported previous knowledge about COVID-19, or attention to COVID-19 in the news across stimulus conditions.
Participants’ age range was 18 to 90 years (Mean = 44.0, SD = 11.7). A majority of participants were female (80%, n = 1,423), reflecting the demographics of LIFE Apps users; 67% (n = 1,195) identified as White, 9% (n = 153) identified as Hispanic/Latino, 8% (n = 135) as Black; 4% (n = 68) as Asian. Participants were highly educated with 30% (n = 528) having a graduate degree, 33% (n = 587) having a Bachelor’s/4-year degree, 27% having some college education (n = 487) and only 6% (n = 108) having a high school GED or less. These demographics reflected the self-reported data we had for all LIFE Apps users, suggesting our survey respondents were representative of the eligible study population.
A majority of the participants (81%, n = 1,442) indicated that their state was under a stay at home order at the time of study participation. On 5-point scales, most participants reported feeling quite or very informed about COVID-19 (M = 3.99, SD = 0.91), and that they were following news about COVID-19 on traditional news outlets quite or very closely (M = 3.44, SD = 1.12).
Looking only at participants randomized to the control group (n = 637) as a baseline (these individuals had no exposure to COVID-19 information within this study), participants generally expressed moderate to high self-efficacy (M = 4.16, SD = 0.63), high behavioral intentions toward COVID-19 (M = 4.41, SD = 0.722), and moderate perceived threat (M = 3.67, SD = 0.81). According to their self-reports, a majority (> 70%) of participants said they were extremely likely to wash their hands often and practice social distancing. Fewer, but still many, were extremely likely to wear a face mask in public (68%) avoid visiting people they don’t live with (46%), clean and disinfect frequently touched surfaces (49%), or follow government recommendations such as stay-at-home orders (59%). (For all but handwashing, the “extremely likely” intentions for these behaviors went up four to five percentage points among participants who saw a COVID-19 course.) While most participants (53%) somewhat agreed that they feel confident in their ability to protect themselves from COVID-19, only 23% strongly agreed; 38% strongly agreed that they know how to protect themselves. (These percentages increased substantially in the Primer course group, where 29% strongly agreed they feel confident in their ability to protect themselves and 53% strongly agreed they know how to protect themselves.) While most participants in the control group strongly agreed that COVID-19 is serious (60%), only 11% strongly agreed and 35% somewhat agreed that they personally feel at risk because of COVID-19.
Content Experiences—Course Understanding, Learning, and Absorption
To address RQ1, we looked at participants’ experiences with the “flashcard” course content. We specifically looked at self-reported understanding of, learning from, and absorption in the courses. Participants generally reported that all the courses were very easy to understand (M = 4.59, SD = 0.67). See Mean results per course in Table 1. In an ANCOVA, course condition, age, gender, and level of education had no significant impacts on course understanding.
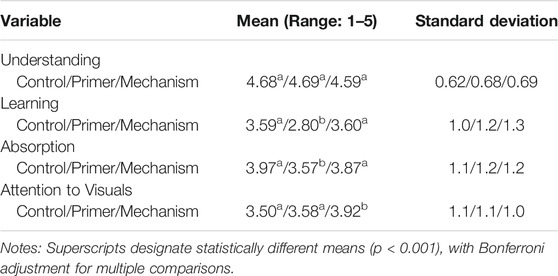
TABLE 1. Mean values of courses for Understanding, Learning, and Absorption.
Participants who saw the control or Mechanism courses indicated learning (“I learned a lot”) significantly more (Bonferroni post hoc test p < 0.001) than those who saw the Primer course (ANOVA, Welch F(2, 1,154.04) = 83.11, p < 0.001). See Mean results per course in Table 1. The Primer course was designed and written for broad audiences to learn the basics of COVID-19; it contained information that many participants observed in open-ended post-course reflections that they were already aware of through information sources such as the CDC. The Mechanism course was also written for broad audiences but covered more technical information related to COVID-19 and how it works in the body. However, participants with lower levels of education indicated learning more from both of the COVID-19 courses (ANCOVA for COVID-19 conditions only with covariates age, education and gender; R2 (effect size) = 0.14; Stimulus F(1, 1,083) = 137.18, p < 0.001; Education covariate F(1, 1,083) = 28.59, p < 0.001).
Although we focused on evaluating self-reported content experiences for RQ1, we did conduct a basic 4-item quiz of basic COVID-19 information following stimulus exposure. The quiz scores were generally very high, with over 90% of participants across all conditions answering correctly for each question. However, participants who viewed the Primer course scored slightly but significantly higher (M = 3.92, SD = 0.31; Bonferonni post hoc test p < 0.05) than did those who viewed the control (M = 2.84, SD = 0.44) or Mechanism (M = 3.87, SD = 0.38) courses (ANCOVA across all conditions with covariates age, education and gender; R2 (effect size) = 0.02; Stimulus F(2, 1,680) = 6.6; p < 01). This result was largely driven by scores for the question of whether coronaviruses are only found in humans or not (significant differences were found across stimulus conditions for this question alone, which was covered in the Primer course), as well as the question about COVID-19 symptoms. Higher education also predicted higher quiz scores (Education covariate F(1, 1,680) = 24.80, p < 0.001).
Participants indicated significantly (Bonferroni post hoc test p < 0.001) greater absorption in the control and Mechanism courses compared to the Primer course (ANOVA, Welch F (2, 1,154.25) = 17.72, p < 0.001). See Mean results per course in Table 1. Absorption in the course and perceived learning are significantly and moderately correlated (Pearson Correlation = 0.58, p < 0.001).
We also explored whether participants found the course they viewed to be relatable (“The mini-course was created with people like me in mind.”) (M = 3.53, SD = 1.21). Most people agreed (55%) or neither agreed nor disagreed (26%) that the course was created with people like them in mind. The Mechanism course was evaluated as more relatable (M = 3.73, SD = 1.17), significantly more so (Bonferroni host hoc test p < 0.001) than the Primer course (M = 3.26, SD = 1.30; ANOVA across all stimulus conditions, Welch F (2, 1,156.51) = 21.40, p < 0.001). However, as with perceived learning, lower levels of education were associated with greater evaluation of relatability (ANCOVA across all conditions with covariates age, education and gender; R2 (effect size) = 0.06; Education covariate F (1, 1,680) = 28.96, p < 0.001). Perceived relatability was significantly and strongly correlated with perceived learning (Pearson Correlation = 0.65, p < 0.001) and absorption (Pearson Correlation = 0.50, p < 0.001). It was weakly but negatively correlated with level of education (Pearson Correlation = −0.12, p < 0.001). The strongest correlation between relatability and level of education existed for those viewing the Primer course, suggesting that this course was particularly well suited to meet the informational needs of people with lower levels of education.
Based on these findings, the illustrated flashcard course format appears to make information about COVID-19 easy to understand for people with high and low levels of education alike. Individuals with lower levels of education indicated learning more from the course they viewed and perceiving it to be created with people like them in mind to a greater extent.
We relied on self-reported data of learning and absorption in the content, which limits robustness of the results. However, data on the time participants spent on the page that linked out to the Lifeology course can provide some context. Participants spent, on average, 3.3 min on the page linking to the sleep course (36 cards), 4 min on the page linking to the Primer course (49 cards), and 4.3 min on the page linking to the Mechanism course (47 cards). A minority (less than 1 out of 5) of participants spent less than a minute, and few spent more than 13 min. Based on previous user testing, a 30-card Lifeology courses takes around 4–6 min for a reader to read aloud. Most participants who completed the survey were engaged enough to spend a few minutes on the content, but didn’t spend so much time that distracted reading (e.g., browsing off) was likely. Time spent was weakly but positively correlated with absorption (Pearson Correlation = 0.10, p < 0.001).
Attention to Visuals
Participants indicated paying significantly closer attention (Bonferroni post hoc test p < 0.001) to the visuals in the Mechanism course compared to the control or Primer courses (ANOVA, Welch F (2, 1,168.41) = 27.89, p < 0.001).
We were also interested in exploring predictors of attention to visuals (RQ2), so we ran a linear regression test predicting this variable with stimulus condition dummy variables, demographic variables, previous knowledge, and following of COVID-19 news (R2 (effect size) = 0.06; F (8, 1,677) = 13.53, p < 0.001). See results in Table 2. People who viewed the Mechanism course, people with lower education levels, and people following COVID-19 news closely on traditional media paid closer attention to the course visuals.
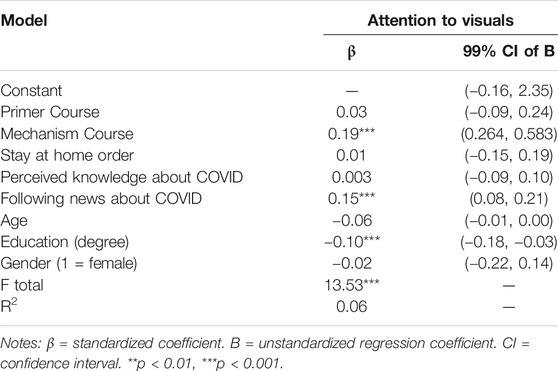
TABLE 2. Results of linear regression analysis predicting attention to visuals.
Attention to visuals is significantly correlated with absorption in the course content (Pearson Correlation = 0.48, p < 0.001), perceived learning (Pearson Correlation = 0.38, p < 0.001) and relatability (Pearson Correlation = 0.35, p < 0.001).
Means of Self-Efficacy, Perceived Threat and Behavioral Intentions Across Course Conditions
We conducted a series of simple ANOVA tests with Bonferonni post hoc tests for multiple comparisons, followed by a serial mediation analysis, to explore RQ3 and RQ4, and to test our hypotheses H1, H2, and H3. We hypothesized that people who view an illustrated flashcard course about COVID-19 will have increased self-efficacy and behavioral intentions than people who view a control course, and that self-efficacy and perceived threat will mediate course impacts on behavioral intentions. As a reminder, the self-efficacy measure was based on participants self-reported feelings of confidence in their ability to protect themselves from COVID-19, knowledge of how to do so, knowledge of what to do if they got COVID-19 and knowledge of when to seek emergency care. Perceived threat was based on participants’ belief that they could get COVID-19, that they could get very sick, and that COVID-19 is serious; personal feelings of risk because of COVID-19; belief that COVID-19 is serious.
Participants who saw the Primer course (M = 4.35, SD = 0.56) had significantly (p < 0.001) higher self-efficacy for personal COVID-19 prevention and care than did participants who saw either the Mechanism course (M = 4.21, SD = 0.63) or the control course (M = 4.14, SD = 0.63). The means were significantly different overall: Welch F(2, 1,177.80) = 15.62, p < 0.001.
Perceived threat was slightly lower for the Primer course (M = 3.57, SD = 0.79) than for the Mechanism course (M = 3.68, SD = 0.78) or the control course (M = 3.67, SD = 0.81). But the means were not significantly different overall.
Participants who saw the Primer course reported slightly greater behavioral intentions (M = 4.51, SD = 0.64), followed by those who saw the Mechanism course (M = 4.47, SD = 0.69) and those who saw the control course (M = 4.41, SD = 0.72). But the means were not significantly different overall.
Course Impacts on Behavioral Intentions
Analytical Approach
We used the PROCESS macro add-on (Hayes and Cai, 2007) to conduct a serial mediation analysis11 to test whether and how course viewing was causally linked (Hayes, 2012) to COVID-19 preventive behavioral intentions, both directly and indirectly through attention to visuals, self-efficacy, and perceived threat. Preventive behavioral intentions was the primary outcome variable, course condition was the primary predictor entered as a multi-categorical variable12, and self-efficacy and perceived threat were entered as serial mediators. We also included attention to course visuals as a mediator between course viewing and all other outcomes. Given the large sample size used in the present study, we opted for a more stringent level of significance (α = 0.01). The results are presented in Table 3.
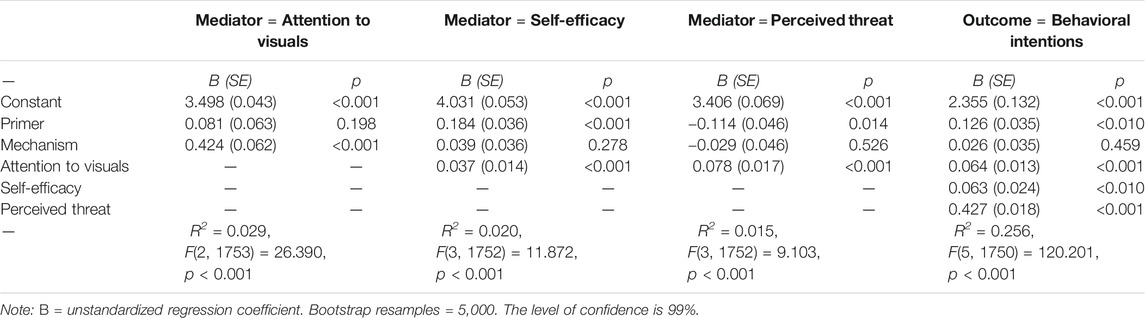
TABLE 3. The serial mediation model of the effects of course types on preventive behavioral intentions via attention to visuals, self-efficacy, and perceived threat.
Attention to Visuals
Attention to visuals was a significant predictor (p < 0.01) in a series of regression tests predicting all other mediators and outcomes—self-efficacy (B = 0.037, SE = 0.014), perceived threat (B = 0.078, SE = 0.017) and behavioral intentions (B = 0.064, SE = 0.013). (Effect sizes are generally small; R2 between 0.5% and 2%.) As we noted previously, people paid significantly closer attention to visuals embedded in the Mechanism course (B = 0.424, SE = 0.061, p < 0.001) compared to the control course (Model R = 0.17, F(2, 1753) = 26.39, p < 0.001). This addresses RQ3 and shows that greater attention to visuals in COVID-19 visual narratives predicts improved outcomes. See arrows connecting attention to visuals and outcomes in Figure 3.
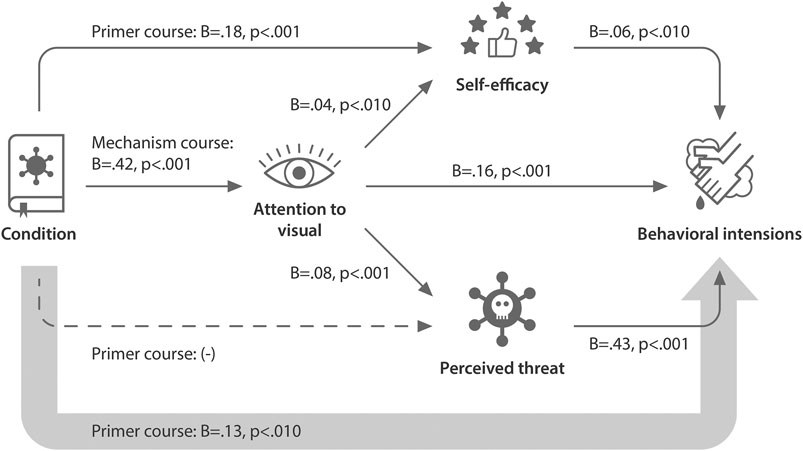
FIGURE 3. Path diagram illustrating the relative direct and indirect effects of illustrated flashcard course viewing on behavioral intentions toward COVID-19. This path diagram visually represents a serial mediation model of the effects of viewing three different courses on behavioral intentions via attention to the course visuals, self-efficacy, and perceived threat. Solid thin arrows represent significant links between variables (p < 0.01), dashed thin arrows represent marginally significant links (p < 0.05). B, unstandardized coefficients showing relationship between variables. The larger arrow connecting condition directly to behavioral intentions denotes the path from predictor to outcome controlling for all mediators. See Table 3 for full results of the regression analyses that this path diagram represents.
Self-Efficacy
We hypothesized in H1 that people who saw a course about COVID-19 would have a greater sense of self-efficacy. Course viewing did have a significant relative direct effect on self-efficacy. Specifically, people who saw the Primer (B = 0.184, SE = 0.036, p < 0.001) as compared to a control course about sleep had improved self-efficacy in terms of protecting themselves from COVID-19. We controlled for attention to visuals (Model R = 0.141, F(3, 1752) = 11.87, p < 0.001). Attention to visuals was also a significant predictor in this regression model (B = 0.036, SE = 0.0136, p < 0.01). We found partial support for H1, based on the relative impacts of a COVID-19 Prevention Primer course. See arrows connecting the course stimulus condition to self-efficacy in Figure 3.
Perceived Threat
Course viewing did not have a significant relative direct effect on perceived threat. However, attention to the course visuals was a significant predictor (Model R = 0.124, F(3, 1752) = 9.10, p < 0.001; B = 0.078, SE = 0.017, p < 0.001).
Behavioral Intentions
As hypothesized in H2, people who saw a COVID-19 course as compared to a control course about sleep had greater behavioral intentions toward COVID-19. There was a significant relative direct effect of Primer course viewing on behavioral intentions, controlling for attention to visuals, self-efficacy, and perceived threat (Model R = 0.51, R2 (effect size) = 0.26, F(5, 1750) = 120.20, p < 0.001). See the large arrow directly connecting course condition to behavioral intentions in Figure 3. People who viewed the Primer course had greater behavioral intentions toward protecting themselves from COVID-19 compared to those who viewed a control course (B = 0.126, SE = 0.035, p < 0.001, 99% bootstrap confidence interval: 0.035, 0.217). Attention to visuals (B = 0.064, p < 0.001), self-efficacy (B = 0.063, p < 0.01) and perceived threat (B = 0.427, p < 0.001) were all significant predictors in this regression model. We found partial support for H2, based on the relative impacts of a COVID-19 Prevention Primer course.
There was a significant indirect effect from Primer course → self-efficacy → behavioral intentions (B = 0.011, SE = 0.005, 99% bootstrap confidence interval: 0.000, 0.027). The bootstrap confidence intervals were based on 5,000 bootstrap samples.
There was a significant indirect effect from Mechanism course → attention to visuals → behavioral intentions (B = 0.027, SE = 0.007, 99% bootstrap confidence interval: 0.011, 0.047). The indirect effect from Mechanism course → attention to visuals → perceived threat → behaviors was also significant (B = 0.014, SE = 0.004, 99% bootstrap confidence interval: 0.005, 0.026).
As hypothesized in H3, both self-efficacy and perceived threat mediated the impact of course viewing on behavioral intentions. Self-efficacy was a key mediator of the impact of viewing a COVID-19 Prevention Primer course on behavioral intentions, while perceived threat was a key mediator of the impact of viewing a COVID-19 Mechanism course on behavioral intentions.
Discussion
Visual narratives are a useful tool for engaging broad audiences in risk messages and public health precautions for COVID-19. We found that illustrated flashcard courses (visual narratives) about COVID-19 were perceived as understandable and engaging for a relatively broad audience, regardless of level of education. The effect sizes for these relationships were typically small but robust, where stimulus condition and other key independent variables often explained 1–6% of the variance in outcome metrics.
We also found that viewing an illustrated flashcard course about COVID-19 resulted in improved perceptions of self-efficacy and behavioral intentions. The stimulus condition, attention to the visuals, self-efficacy and perceived threat explained a substantial amount of the variance in behavioral intentions (over 25%). Visual narratives may improve health literacy, or capacity to understand and act on health information.
Interestingly, the COVID-19 Primer course impacted self-efficacy and behavioral intentions even though, on average, people indicated not necessarily learning anything new from the content. Participants viewing our COVID-19 courses had most likely come across similar information in other formats based on their existing knowledge of COVID-19, but these formats may not have made the information as accessible and relatable to their daily lives. Our results also suggest that visual narratives may improve health outcomes and disease prevention.
While both of the courses about COVID-19 had positive outcomes compared to a control course, they impacted self-efficacy and perceived threat to different extents. The Prevention Primer course was particularly effective in improving self-efficacy and behavioral intentions directly. This course visually told a story of a family’s journey through a COVID-19 outbreak in their city and their experience when a younger family member got sick. The course visuals showed characters expressing concern but ultimately modeling preventative behaviors such as handwashing for at least 20 s, social distancing, and safely caring for a sick family member. It also provided actionable takeaways. All of these features likely contributed to the course’s impact on self-reported self-efficacy and behavioral intentions. On the other hand, the impact of the COVID-19 Mechanism course on behavioral intentions was primarily mediated by greater self-reported attention to the course visuals and perceived threat from COVID-19. This course explained how the coronavirus works in the body and why some people are at greater risk of severe illness, again with actionable takeaways.
Across both COVID-19 courses, greater self-reported attention to the visuals mediated the impacts of course viewing on self-efficacy, perceived threat, and behavioral intentions. We also found support for the idea that people with lower levels of formal education rely to a greater extent on visuals in these educational materials. This seems to be particularly true when the materials contain more technical science and health information. The more technical Mechanism course received slightly lower ease of understanding scores than the Primer and control courses. Participants who saw this course also reported paying significantly greater attention to the course visuals than did participants who saw the Primer course or the control course. Greater self-reported attention to the visuals in the Mechanism course in turn mediated a significant impact on perceived threat, and thus protective behavioral intentions.
Other factors beyond the level of technical content in the Mechanism course could also have contributed to the self-reported attention to the visuals in this course. The course contained more interpretational visuals, defined as representing information associated with as opposed to directly representing the textual referents (Haragi et al., 2019). These types of visuals have previously been found to invite interpretation and elaboration of content, and to improve self-reported understanding, memorability, and interest (Haragi et al., 2019). However, future research is needed to explore whether it was the greater level of difficulty of this course that truly drove greater attention to visuals, or some other aspect of the visuals in this course.
Implications
This study fills a gap in literature looking at the real-world, holistic impact of health education materials that combine text, narrative, and visuals. The lack of research in this area may stem from the lack of health education materials that make effective, data-driven use of stories and visuals. But why are these materials missing from the media landscape? One of the reasons may be a dearth of collaboration between scientific and art communities. There are a growing number but still few resources and spaces that make it easy for scientists, artists, and communication experts to work together on such materials. However, calls for collaboration between scientists and creatives are increasing (Khoury et al., 2019; Botsis et al., 2020; Murchie and Diomede, 2020). Art-science platforms including Art The Science, Lifeology, the SciArt Initiative, and others are facilitating this collaboration through nascent online spaces that bring people from STEM and art fields together.
It is difficult today to assess visual quality or exactly how “good” illustrations improve information processing (McGrath and Brown, 2005). Different people have different tastes in the aesthetics of artwork that may stem from their cultural or social background. For this reason, it is important that the public have diverse options in terms of illustrated educational content available to them, created by diverse artists in diverse styles and cultural contexts.
Limitations
Participants in this study represented U.S. users of popular health tracking apps (the LIFE Apps). These apps have a broad user base with over 2.5 million users. Users of these apps are likely to be motivated to improve their health and adopt positive health behaviors; however, many join the app because they are struggling to achieve their health and weight loss goals. Most of the participants were highly educated. This does not necessarily mean that they had high health literacy levels, as even highly educated people can struggle to understand and apply technical health information. However, the results of our study are limited by this sample and the fact that we did not directly assess the health literacy level of our participants. While we did confirm that our courses were broadly understandable and had positive outcomes for a subset of our participants who had less than a high school education, outcomes could be different for people facing more substantial language, reading level, and internet access barriers.
Creators of visual narrative educational materials for science and health communication should always design their messages and content with target audiences in mind and evaluate their materials early among those target audiences. Future studies could target evaluation of visual narratives and illustrated flashcard courses in different languages within low-literacy populations, non-English-speaking populations, rural populations, racial and ethnic minorities, etc.
This study is also limited by not comparing the flashcard courses to the same messages presented in non-visual and/or non-narrative formats. We don’t know how much the narrative elements of the courses (story, characters, emotions, etc.) distinctly contributed to the outcomes, separately from the visual elements and factual information presented. However, this would have been difficult to test in practice, as both the visuals and the text of the courses contained narrative as well as informational elements.
Another important limitation of this study is self-reported data. To measure learning outcomes, we would have needed to assess knowledge before and after viewing the courses (Jensen, 2014). However, we note that the COVID-19 courses had positive outcomes even though participants generally reported being quite informed beforehand. Self-reported behavioral intentions also do not fully predict behaviors (Sheeran and Webb, 2016). However, the self-reported data can still tell us a lot about people’s experiences of the content and how prepared and motivated it helped them feel to protect themselves and others from COVID-19. Measures of enjoyment and absorption in content often rely on self-reports related to how much people enjoyed the content, whether it held their attention or if they were distracted by other things while viewing the content. However, real-world measured data for these variables would provide greater insight.
There was the possibility of bias in people’s responses to experiences of the content. To try to prevent this, we assured survey respondents that their responses were anonymous, and we asked for honest evaluation to help us create better content for others. None of the content was branded by LifeOmic or LIFE Apps to avoid eliciting any identity with or loyalty to the LIFE Apps brand. LIFE Apps users also do not pay to use their apps and are often invited to join various other health research projects where strict privacy and HIPAA regulations apply. The risk that they joined this study because of any social pressure or experienced pressure to “like” the educational content displayed is no more likely than in other survey experiments, in our opinion.
Finally, we also acknowledge that we did not fully test or directly manipulate all factors of the EPPM in this study, particularly fear. We leveraged materials that had already been created and designed survey questions around the messages contained in these materials, with a focus on practical takeaways. While this approach has its strengths in terms of evaluating new educational resources at a high level in a real-world setting, it is limited when it comes to pinpointing effect mechanisms.
Takeaways and Recommendations
New visual narrative formats have the potential to substantially improve engagement on issues of pressing public health concern. These formats are also ripe for future research.
In the process of conducting this study, starting with the collaborative creation the “flashcard” courses evaluated herein, we learned a lot about how to create effective visual educational materials science and health. We’ve curated some of what we learned into actionable tips below. (We are also leveraging lessons learned into a series of Lifeology SciComm “flashcard” courses13 that help scientists and communicators learn evidence-based science and health communication practices.) This advice is based on our own process for and experiences in creating the materials evaluated in this study. It is based on factors that we think may have contributed to the impact of our materials. Future research should pin-point the role of these different strategies in making health education materials more effective.
1) Use plain language and non-clinical, narrative illustrations to improve understanding and relatability of science and health messages.
2) Assemble interdisciplinary teams in the creation of visual narrative materials. Collaborate with local professional artists and storytellers.
3) Use visuals that complement text. Avoid decorative visuals or ones that are either exact visual representations or conversely are unrelated to the text. Visuals might communicate helpful metaphors or help the viewer interpret or create accurate mental models of abstract concepts or hidden processes.
4) Include empowering stories of characters who face struggles, express relatable emotions, and achieve ultimately positive outcomes or a change in perspective through desired behaviors. Be compassionate when visualizing characters.
5) Be inclusive and illustrate a diversity of characters to engage a diverse audience.
Data Availability Statement
The raw data supporting the conclusion of this article will be made available by the authors, without undue reservation.
Ethics Statement
The studies involving human participants were reviewed and approved by the Alex Cohen, Louisiana State University. Written informed consent for participation was not required for this study in accordance with the national legislation and the institutional requirements.
Author Contributions
All authors listed have made a substantial, direct, and intellectual contribution to the work and approved it for publication.
Conflict of Interest
PJ, DA, and MF are full-time employees of LifeOmic, a private health software company that owns and operates Lifeology, the platform being used and evaluated in this study. PJ, DA, and MF have received management incentive units (a form of equity compensation) in LifeOmic. Survey participants were recruited from the LifeOmic LIFE health tracking apps and incentives (e.g., free LifeOmic t-shirts) were randomly provided for 5 participants.
The remaining authors declare that the research was conducted in the absence of any commercial or financial relationships that could be construed as a potential conflict of interest.
Publisher’s Note
All claims expressed in this article are solely those of the authors and do not necessarily represent those of their affiliated organizations, or those of the publisher, the editors and the reviewers. Any product that may be evaluated in this article, or claim that may be made by its manufacturer, is not guaranteed or endorsed by the publisher.
Supplementary Material
The Supplementary Material for this article can be found online at: https://www.frontiersin.org/articles/10.3389/fcomm.2021.712658/full#supplementary-material
Footnotes
1https://education.gsu.edu/research-outreach/alrc/adult-literacy-coronavirus-resource-links/
2https://www.oecd.org/skills/piaac/; https://nces.ed.gov/datapoints/2019179.asp
3https://www.talenthouse.com/i/united-nations-global-call-out-to-creatives-help-stop-the-spread-of-covid-19. The call has been controversial among artists on account of asking for free labor in exchange for “exposure”.
4https://app.us.lifeology.io/viewer/lifeology/default/how-is-a-lifeology-course-created
5https://app.us.lifeology.io/viewer/lifeology/default/why-do-we-sleep
6https://app.us.lifeology.io/viewer/lifeology/default/2019-novel-coronavirus
7https://app.us.lifeology.io/viewer/lifeology/default/what-does-the-coronavirus-do-in-my-body
8https://www.ahrq.gov/health-literacy/patient-education/pemat-p.html
9N/A scores given to items on headers and narration
10N/A scores given to calculations and charts
11The sample size for the PROCESS analysis was 1765, the custom seed was 20200617
12Entered as dummy variables relative to the control group
13https://lifeology.io/lifeology-univ-scicomm/
References
Abdel-Latif, M. M. M. (2020). The enigma of Health Literacy and COVID-19 Pandemic. Public Health 185, 95–96. doi:10.1016/j.puhe.2020.06.030
Agarwal, R., and Karahanna, E. (2000). Time Flies when You're Having Fun: Cognitive Absorption and Beliefs about Information Technology Usage. MIS Q. 24, 665–694. doi:10.2307/3250951
Aisami, R. S. (2015). Learning Styles and Visual Literacy for Learning and Performance. Procedia Soc. Behav. Sci. 176, 538–545.
Bailey, Meryl. (2020). COVID-19 in Translation: Making Patient Education Accessible. Boston: HealthCity. Available at: https://www.bmc.org/healthcity/policy-and-industry/covid-19-translation-making-patient-education-accessible (Accessed on June 22, 2020).
Beutel, T. F., Zwerenz, R., and Michal, M. (2018). Psychosocial Stress Impairs Health Behavior in Patients with Mental Disorders. BMC psychiatry 18 (1), 375. doi:10.1186/s12888-018-1956-8
Botsis, T., Fairman, J. E., Moran, M. B., and Anagnostou, V. (2020). Visual Storytelling Enhances Knowledge Dissemination in Biomedical Science. J. Biomed. Inform. 103458.
Caballero, A., Leath, K., and Watson, J. (2020). COVID-19 Consumer Health Information Needs Improvement to Be Readable and Actionable by High-Risk Populations. Front. Commun. 5, 56. doi:10.3389/fcomm.2020.00056
CDC (2020). COVID-19 in Racial and Ethnic Minority Groups. COVID-19. Available at: https://www.cdc.gov/coronavirus/2019-ncov/need-extra-precautions/racial-ethnic-minorities.html (Accessed on June 22, 2020).
CDC (2021). Understanding Health Literacy. Health Literacy. Available at: https://www.cdc.gov/healthliteracy/learn/Understanding.html (Accessed on June 22, 2021).
Chaiken, S. (1980). Heuristic versus Systematic Information Processing and the Use of Source versus Message Cues in Persuasion. J. Personal. Soc. Psychol. 39 (5), 752–766. doi:10.1037/0022-3514.39.5.752
Chan, C. S. R., and Park, H. D. (2015). How Images and Color in Business Plans Influence Venture Investment Screening Decisions. J. business Venturing 30 (5), 732–748. doi:10.1016/j.jbusvent.2014.12.002
Cvijikj, I. P., and Michahelles, F. (2013). Online Engagement Factors on Facebook Brand Pages. Social Netw. Anal. mining 3 (4), 843–861.
Day, V. (2009). Promoting Health Literacy through Storytelling. OJIN: Online J. Issues Nurs. 14 (3), 6.
Dayan, Z. (2018). Visual Content: The Future of Storytelling. Forbes. Available at: https://www.forbes.com/sites/forbestechcouncil/2018/04/02/visual-content-the-future-of-storytelling/?sh=288d4afd3a46 (Accessed on July 3, 2021). doi:10.33107/ubt-ic.2018.360
Delp, C., and Jones, J. (1996). Communicating Information to Patients: the Use of Cartoon Illustrations to Improve Comprehension of Instructions. Acad. Emerg. Med. 3 (3), 264–270. doi:10.1111/j.1553-2712.1996.tb03431.x
Demircelik, M. B., Cakmak, M., Nazli, Y., Şentepe, E., Yigit, D., Keklik, M., et al. (2016). Effects of Multimedia Nursing Education on Disease-Related Depression and Anxiety in Patients Staying in a Coronary Intensive Care Unit. Appl. Nurs. Res. 29, 5–8. doi:10.1016/j.apnr.2015.03.014
Eichler, K., Wieser, S., and Brügger, U. (2009). The Costs of Limited Health Literacy: a Systematic Review. Int. J. Public Health 54, 313–324. doi:10.1007/s00038-009-0058-2
Farinella, M., and Mbakile-Mahlanza, L. (2020). Making the Brain Accessible with Comics. World Neurosurg. 133, 426–430. doi:10.1016/j.wneu.2019.10.168
Farinella, M. (2018). The Potential of Comics in Science Communication. Jcom 17 (01), Y01. doi:10.22323/2.17010401
Frieden, Joyce. (2020). Lack of Health Literacy a Barrier to Grasping COVID-19. MedPage Today. Available at: https://www.medpagetoday.com/infectiousdisease/covid19/87002 (Accessed on June 22, 2020).
Green, M. C., and Brock, T. C. (2002). “In the Mind's Eye: Transportation-Imagery Model of Narrative Persuasion,” in Narrative Impact: Social and Cognitive Foundations. Editors M. C. Green, J. J. Strange, and T. C. Brock (Lawrence Erlbaum Associates Publishers), 315–341.
Haragi, M., Ishikawa, H., and Kiuchi, T. (2019). Investigation of Suitable Illustrations in Medical Care. J. Vis. Commun. Med. 42 (4), 158–168. doi:10.1080/17453054.2019.1633237
Hart, T. L., Blacker, S., Panjwani, A., Torbit, L., and Evans, M. (2015). Development of Multimedia Informational Tools for Breast Cancer Patients with Low Levels of Health Literacy. Patient Educ. Couns. 98 (3), 370–377. doi:10.1016/j.pec.2014.11.015
Hayes, A. F., and Cai, L. (2007). Using Heteroskedasticity-Consistent Standard Error Estimators in OLS Regression: An Introduction and Software Implementation. Behav. Res. Methods 39 (4), 709–722. doi:10.3758/bf03192961
Hayes, J. R., and Process, (2012). A Versatile Computational Tool for Observed Variable Mediation, Moderation, and Conditional Process Modeling. [White paper] 2012. Available at: http://www.afhayes.com/public/process2012.pdf (Accessed on June 22, 2020). doi:10.1037/e533652013-424
Houts, P. S., Doak, C. C., Doak, L. G., and Loscalzo, M. J. (2006). The Role of Pictures in Improving Health Communication: a Review of Research on Attention, Comprehension, Recall, and Adherence. Patient Educ. Couns. 61 (2), 173–190. doi:10.1016/j.pec.2005.05.004
Igarashi, Y., Mizushima, N., and Yokoyama, H. M. (2020). Manga-based Risk Communication for the COVID-19 Pandemic: a Case Study of Storytelling that Incorporates a Cultural Context. Jcom 19 (7), N02. doi:10.22323/2.19070802
Jensen, E. A., and Gerber, A. (2020). Evidence-based Science Communication. Front. Commun. 4, 78. doi:10.3389/fcomm.2019.00078
Jensen, E. (2014). The Problems with Science Communication Evaluation. Jcom 13 (1), C04. doi:10.22323/2.13010304
Jones, C. L., Jensen, J. D., Scherr, C. L., Brown, N. R., Christy, K., and Weaver, J. (2015). The Health Belief Model as an Explanatory Framework in Communication Research: Exploring Parallel, Serial, and Moderated Mediation. Health Commun. 30 (6), 566–576. doi:10.1080/10410236.2013.873363
Kagan, S. H. (2018). Using story and Art to Improve Education for Older Patients and Their Caregivers. Geriatr. Nurs. 39 (1), 119–121. doi:10.1016/j.gerinurse.2017.12.008
Kahneman, D. (2003). Maps of Bounded Rationality: Psychology for Behavioral Economics. Am. Econ. Rev. 93, 1449–1475. doi:10.1257/000282803322655392
Kamalakannan, S., Bhattacharjya, S., Bogdanova, Y., Papadimitriou, C., Arango-Lasprilla, J., Bentley, J., et al. (2021). Health Risks and Consequences of a COVID-19 Infection for People with Disabilities: Scoping Review and Descriptive Thematic Analysis. Ijerph 18 (8), 4348. doi:10.3390/ijerph18084348
Kassai, B., Rabilloud, M., Dantony, E., Grousson, S., Revol, O., Malik, S., et al. (2016). Introduction of a Paediatric Anaesthesia Comic Information Leaflet Reduced Preoperative Anxiety in Children. Br. J. Anaesth. 117 (1), 95–102. doi:10.1093/bja/aew154
Katz, S. J., Erkkinen, M., Lindgren, B., and Hatsukami, D. (2018). Assessing the Impact of Conflicting Health Warning Information on Intentions to Use E-Cigarettes-An Application of the Heuristic-Systematic Model. J. Health Commun. 23 (10-11), 874–885. doi:10.1080/10810730.2018.1533052
Khoury, C. K., Kisel, Y., Kantar, M., Barber, E., Ricciardi, V., Klirs, C., et al. (2019). Science–graphic Art Partnerships to Increase Research Impact. Commun. Biol. 2 (1), 1–5. doi:10.1038/s42003-019-0516-1
Kickbusch, I., Pelikan, J. M., and Apfel, F. (2013). Health Literacy: The Solid Facts. Editors A. D. Tsouros World Health Organization.
Kim, D. H., Spiller, L., and Hettche, M. (2015). Analyzing media Types and Content Orientations in Facebook for Global Brands. J. Res. Interactive Marketing. doi:10.14257/astl.2015.113.06
Kim, J. W. (2018). They Liked and Shared: Effects of Social media Virality Metrics on Perceptions of Message Influence and Behavioral Intentions. Comput. Hum. Behav. 84, 153–161. doi:10.1016/j.chb.2018.01.030
Kim, S., Trinidad, B., Mikesell, L., and Aakhus, M. (2020). Improving Prognosis Communication for Patients Facing Complex Medical Treatment: A User-Centered Design Approach. Int. J. Med. Inform., 104147. doi:10.1109/cbms49503.2020.00075
Kolb, D. A. (1984). Experiential Learning: Experience as the Source of Learning and Development. Englewood Cliffs, NJ: Prentice-Hall.
Lahuerta-Otero, E., Cordero-Gutiérrez, R., and De la Prieta-Pintado, F. (2018). Retweet or like? that Is the Question. Oir 42 (5), 562–578. doi:10.1108/oir-04-2017-0135
Lazard, A., and Atkinson, L. (2015). Putting Environmental Infographics Center Stage. Sci. Commun. 37 (1), 6–33. doi:10.1177/1075547014555997
Leung, M. M., Tripicchio, G., Agaronov, A., and Hou, N. (2014). Manga Comic Influences Snack Selection in Black and Hispanic New York City Youth. J. Nutr. Education Behav. 46 (2), 142–147. doi:10.1016/j.jneb.2013.11.004
Mayer, R. E. (1997). Multimedia Learning: Are We Asking the Right Questions? Educ. Psychol. 32 (1), 1–19. doi:10.1207/s15326985ep3201_1
Mayer, R. E. (2003). The Promise of Multimedia Learning: Using the Same Instructional Design Methods across Different media. Learn. instruction 13 (2), 125–139. doi:10.1016/s0959-4752(02)00016-6
McGrath, M. B., and Brown, J. R. (2005). Visual Learning for Science and Engineering. IEEE Comput. Grap. Appl. 25 (5), 56–63. doi:10.1109/mcg.2005.117
Metzger, M. J., Flanagin, A. J., and Medders, R. B. (2010). Social and Heuristic Approaches to Credibility Evaluation Online. J. Commun. 60 (3), 413–439. doi:10.1111/j.1460-2466.2010.01488.x
Middleton, K. R., Anton, S. D., and Perri, M. G. (2013). Long-term Adherence to Health Behavior Change. Am. J. lifestyle Med. 7 (6), 395–404. doi:10.1177/1559827613488867
Murchie, K. J., and Diomede, D. (2020). Fundamentals of Graphic Design-Essential Tools for Effective Visual Science Communication. FACETS 5, 409–422. doi:10.1139/facets-2018-0049
Muzumdar, J. M., and Pantaleo, N. L. (2017). Comics as a Medium for Providing Information on Adult Immunizations. J. Health Commun. 22 (10), 783–791. doi:10.1080/10810730.2017.1355418
Nova, F., Allenidekania, A., and Agustini, N. (2019). The Effect of Multimedia-Based Nutrition Education on Parents' Knowledge and Body Weight Change in Leukemia Children. Enfermería Clínica 29, 229–233. doi:10.1016/j.enfcli.2019.04.027
Oh, J., Bellur, S., and Sundar, S. S. (2015). Clicking, Assessing, Immersing, and Sharing: An Empirical Model of User Engagement with Interactive media. Commun. Res. 45 (5), 737–763. doi:10.1177/0093650215600493
Ohyama, S., Yokota, C., Miyashita, F., Amano, T., Inoue, Y., Shigehatake, Y., et al. (2015). Effective Education Materials to advance Stroke Awareness without Teacher Participation in Junior High School Students. J. Stroke Cerebrovasc. Dis. 24 (11), 2533–2538. doi:10.1016/j.jstrokecerebrovasdis.2015.07.001
Okan, O., Bollweg, T. M., Berens, E.-M., Hurrelmann, K., Bauer, U., and Schaeffer, D. (2020). Coronavirus-related Health Literacy: A Cross-Sectional Study in Adults during the COVID-19 Infodemic in Germany. Ijerph 17 (15), 5503. doi:10.3390/ijerph17155503
Osborne, M. E. (2012). Health Literacy from A to Z. Lake Placid: Jones & Bartlett Publishers. doi:10.30965/9783846752746
Paakkari, L., and Okan, O. (2020). COVID-19: Health Literacy Is an Underestimated Problem. The Lancet Public Health 5 (5), e249–e250. doi:10.1016/s2468-2667(20)30086-4
Paasche-Orlow, M. K., and Wolf, M. S. (2007). The Causal Pathways Linking Health Literacy to Health Outcomes. Am. J. Health Behav. 31 (Suppl. 1), 19–26. doi:10.5993/ajhb.31.s1.4
Paasche-Orlow, M. K., Parker, R. M., Gazmararian, J. A., Nielsen-Bohlman, L. T., and Rudd, R. R. (2005). The Prevalence of Limited Health Literacy. J. Gen. Intern. Med. 20 (2), 175–184. doi:10.1111/j.1525-1497.2005.40245.x
Park, C. L., Russell, B. S., Fendrich, M., Finkelstein-Fox, L., Hutchison, M., and Becker, J. (2020). Americans' COVID-19 Stress, Coping, and Adherence to CDC Guidelines. J. Gen. Intern. Med. 35 (8), 2296–2303. doi:10.1007/s11606-020-05898-9
Popova, L. (2012). The Extended Parallel Process Model. Health Educ. Behav. 39 (4), 455–473. doi:10.1177/1090198111418108
Schaeffer, K., and Rainie, L. (2020). Experiences with the COVID-19 Outbreak Can Vary for Americans of Different Ages. Pew Research Center. Available at: https://www.pewresearch.org/fact-tank/2020/06/16/experiences-with-the-covid-19-outbreak-can-vary-for-americans-of-different-ages/(Accessed on June 22, 2020).
Schnotz, W., and Bannert, M. (2003). Construction and Interference in Learning from Multiple Representation. Learn. Instruction 13 (2), 141–156. doi:10.1016/s0959-4752(02)00017-8
Sheeran, P., Maki, A., Montanaro, E., Avishai-Yitshak, A., Bryan, A., Klein, W. M. P., et al. (2016). The Impact of Changing Attitudes, Norms, and Self-Efficacy on Health-Related Intentions and Behavior: A Meta-Analysis. Health Psychol. 35 (11), 1178–1188. doi:10.1037/hea0000387
Sheeran, P., and Webb, T. L. (2016). The Intention-Behavior Gap. Social Personal. Psychol. Compass 10 (9), 503–518. doi:10.1111/spc3.12265
Shoemaker, S. J., Wolf, M. S., and Brach, C. (2014). Development of the Patient Education Materials Assessment Tool (PEMAT): a New Measure of Understandability and Actionability for Print and Audiovisual Patient Information. Patient Education Couns. 96 (3), 395–403. doi:10.1016/j.pec.2014.05.027
Simmons, R. A., Cosgrove, S. C., Romney, M. C., Plumb, J. D., Brawer, R. O., Gonzalez, E. T., et al. (2017). Health Literacy: Cancer Prevention Strategies for Early Adults. Am. J. Prev. Med. 53 (3), S73–S77. doi:10.1016/j.amepre.2017.03.016
Sørensen, K., Van den Broucke, S., Fullam, J., Doyle, G., Pelikan, J., Slonska, Z., et al. (2012). Health Literacy and Public Health: a Systematic Review and Integration of Definitions and Models. BMC public health 12 (1), 80–13. doi:10.1186/1471-2458-12-80
Taber, K. S. (2018). The Use of Cronbach’s Alpha When Developing and Reporting Research Instruments in Science Education. Res. Sci. Educ. 48 (6), 1273–1296.
Tekle-Haimanot, R., Preux, P. M., Gerard, D., Worku, D. K., Belay, H. D., and Gebrewold, M. A. (2016). Impact of an Educational Comic Book on Epilepsy-Related Knowledge, Awareness, and Attitudes Among School Children in Ethiopia. Epilepsy Behav. 61, 218–223. doi:10.1016/j.yebeh.2016.05.002
Townsend, M. S., Sylva, K., Martin, A., Metz, D., and Wooten-Swanson, P. (2008). Improving Readability of an Evaluation Tool for Low-Income Clients Using Visual Information Processing Theories. J. Nutr. Education Behav. 40 (3), 181–186. doi:10.1016/j.jneb.2007.06.011
Vagg, T., Balta, J. Y., Bolger, A., and Lone, M. (2020). Multimedia in Education: What Do the Students Think?. Health Prof. Educ. 6 (3), 325–333.
Wang, X., Chen, L., Shi, J., and Peng, T.-Q. (2019). What Makes Cancer Information Viral on Social media? Comput. Hum. Behav. 93, 149–156. doi:10.1016/j.chb.2018.12.024
Wang, Z., Wang, S., Farinella, M., Murray-Rust, D., Henry Riche, N., and Bach, B. (2019). Comparing Effectiveness and Engagement of Data Comics and Infographics. Proceedings of the 2019 CHI Conference on Human Factors in Computing Systems, 1–12.
Webster, J., and Ho, H. (1997). Audience Engagement in Multimedia Presentations. SIGMIS Database 28, 63–77. doi:10.1145/264701.264706
WHO, (2020a). Risk Communication and Community Engagement Readiness and Response to Coronavirus Disease (COVID-19): Interim Guidance. World Health Organization, 19. Available at: https://apps.who.int/iris/handle/10665/331513 (Accessed on June 22, 2020).
WHO, (2020b). Principle: Understandable. Available at: https://www.who.int/about/communications/understandable Accessed on June, 22, 2020.
Witte, K., Cameron, K. A., McKeon, J. K., and Berkowitz, J. M. (1996). Predicting Risk Behaviors: Development and Validation of a Diagnostic Scale. J. Health Commun. 1, 317–342. doi:10.1080/108107396127988
Witte, K. (1994). Fear Control and Danger Control: A Test of the Extended Parallel Process Model (EPPM). Commun. Monogr. 61 (2), 113–134. doi:10.1080/03637759409376328
Keywords: COVID-19, visual narratives, public engagement, visual communication, storytelling
Citation: Jarreau PB, Su LY-F, Chiang EC-L, Bennett SM, Zhang JS, Ferguson M and Algarra D (2021) COVID ISSUE: Visual Narratives About COVID-19 Improve Message Accessibility, Self-Efficacy, and Health Precautions. Front. Commun. 6:712658. doi: 10.3389/fcomm.2021.712658
Received: 20 May 2021; Accepted: 26 July 2021;
Published: 18 August 2021.
Edited by:
Eric A. Jensen, International Consortium of Research Staff Associations (ICoRSA), IrelandCopyright © 2021 Jarreau, Su, Chiang, Bennett, Zhang, Ferguson and Algarra. This is an open-access article distributed under the terms of the Creative Commons Attribution License (CC BY). The use, distribution or reproduction in other forums is permitted, provided the original author(s) and the copyright owner(s) are credited and that the original publication in this journal is cited, in accordance with accepted academic practice. No use, distribution or reproduction is permitted which does not comply with these terms.
*Correspondence: Paige Brown Jarreau, cGFpZ2ViamFycmVhdUBnbWFpbC5jb20=