 Bradley S. Gibson
 Jamie M. Trost
 Scott E. Maxwell
94% of researchers rate our articles as excellent or good
Learn more about the work of our research integrity team to safeguard the quality of each article we publish.
Find out more
ORIGINAL RESEARCH article
Front. Cognit., 07 July 2023
Sec. Attention
Volume 2 - 2023 | https://doi.org/10.3389/fcogn.2023.1203435
This article is part of the Research TopicInsights in Attention: 2022View all 15 articles
Previous research has suggested that standard manipulations of top-down information in the spatial cueing paradigm do not elicit voluntary attention control across all participants. Instead, this research showed that only about half of the individuals exhibited the expected pattern in which they reported feeling more agency when they performed visual search with the aid of an informative (arrow or onset) cue than when they performed this task with an uninformative cue or without any cue at all. The present study replicated these previous findings under conditions in which the standard manipulation of top-down information was conveyed by a number cue (as opposed to an arrow or onset cue). But more importantly, the present study also found that the proportion of individuals who aligned top-down and voluntary attention control could be increased to approximately 90% by combining the standard manipulation of top-down information with a novel manipulation of volition in a separate condition in which participants were given the opportunity to freely choose (or not) the direction of the spatial cue on each trial. Despite conceding experimental control of cued direction (but not cue validity) to participants in this latter condition, most participants (85%) nevertheless distributed their direction choices equally across the four directions. These findings suggest that providing participants active control of stimulus parameters may be required to elicit a strong sense of agency (and voluntary control) in the laboratory.
Top-down attention control occurs when individuals can guide their attention in accordance with internal sources of information such as knowledge, memories, intentions, expectations, and goals. Likewise, voluntary attention control occurs when individuals can guide their attention “at will” in accordance with their internal goals and intentions. At first glance, these two forms of attention control seem very similar. Indeed, many attention control researchers use the terms “top-down” and “voluntary” interchangeably (see Theeuwes, 2018 for a clear example). However, the extent to which top-down information about a task-relevant target gives rise to voluntary attention control has recently been questioned on several different fronts (Davis and Gibson, 2012; Pauszek and Gibson, 2016, 2018; Gaspelin and Luck, 2018; Wolfe, 2018; Gibson et al., 2023).
For instance, Gibson et al. (2023) recently argued that the similarity between top-down and voluntary attention control could not be adequately determined by previous attention control studies because: (i) the experience of volition is typically defined as a conscious feeling that prior intentions led to a subsequent action (Wegner et al., 2017); and, (ii) that aspect of an individual's conscious experience had not been assessed in previous studies of top-down attention control. Accordingly, Gibson et al. attempted to shed light on this relation by measuring individuals' self-reported sense of “agency” (using a seven-point scale) as they were offered different levels of top-down information in a spatial cueing task. Agency was measured because it has been posited as one of the defining features of voluntary behavior (Firth, 2013), and individuals tend to rate themselves as having a strong sense of agency when they consciously experience their intentions as being the primary cause of their actions (Synofzik et al., 2013; Tapal et al., 2017).
In addition, Gibson et al. (2023) also distinguished this “control felt” aspect of agency from the “control used” aspect of agency in their Experiment 2. This distinction is potentially important because these two aspects of agency have been shown to be inversely related to one another at the group level in any given task context (Potts and Carlson, 2019). That is, task contexts that elicit the use of only a small amount of control tend to elicit the feeling of a larger amount of control whereas task contexts that elicit the use of a larger amount of control tend to elicit the feeling of a smaller amount of control. For the purposes of this study, we will focus exclusively on the “control felt” aspect of agency (see also, Craig, 2015; for a broad discussion of how bodily feelings guide human actions), and we will simply use the term “agency” to refer to this aspect of agency.
In Gibson et al.'s (2023) study, top-down information about the location of a task-relevant target letter (E vs. U) was conveyed by arrow and onset cues that indicated one of four possible fixed directions (above vs. below vs. left vs. right) on each trial. Gibson et al. used the widest range of top-down information that was possible in this context. This range included 100%-valid cues at one extreme and 25%-valid cue (i.e., chance) at the other extreme. In addition, 70%-valid cues were also included as an intermediate value so that linear functions could be fit across the three levels of cue validity.
Although it is commonplace for attention control researchers to describe manipulations of top-down information in terms of cue validity (Jonides, 1980, 1983; Posner, 1980; Posner et al., 1980; Eriksen and Yeh, 1985; Madden, 1992; Riggio and Kirsner, 1997; Vossel et al., 2006; Chica et al., 2014), the cue-validity scale may not be the most appropriate scale upon which to quantify how much information has been conveyed by the cues in this paradigm (Gibson et al., 2021). Rather, information-theoretic quantities such as “mutual information” and “conditional target entropy” are more transparent about how much information has been conveyed because these terms explicitly reflect the entropy associated with locating and identifying the target in this spatial cueing paradigm. For instance, in Gibson et al.'s (2023) task context, there was a total of three bits of information associated with locating and identifying the target, where one bit is equal to the amount of information that is gained by resolving two equally likely outcomes. In particular, one bit was associated with resolving the orientation of the target (which was equally likely to appear on the horizontal or vertical axis); one bit was associated with resolving the direction of the target (which was equally likely to appear at one endpoint or the other of an axis); and one bit was associated resolving the identity of the target (which was equally likely to be the letter E or U).
Mutual information reflects the average reduction in uncertainty about the target's identity and location that is provided by the cue (or vice-versa), and conditional target entropy reflects the average uncertainty in target identity and location that remains after processing the spatial information conveyed by the cue. These two quantities are complementary in the sense that they must sum to the total entropy (i.e., 3.00 bits) associated with locating and identifying the target in this context. When the cue was 100% valid, mutual information was equal to 2.00 bits and conditional target entropy was equal to 1.00 bit because the cue provided perfectly accurate information about the target's location (orientation and direction) but no information about its identity. When the cue was 70% valid, mutual information was equal to 0.64 bits and conditional target entropy was equal to 2.36 bits because the cue provided partially accurate information about the target's location (orientation and direction) but no information about its identity. And, when the cue was 25% valid, mutual information was equal to 0.00 bits and conditional target entropy was equal to 3.00 bits because the cue provided no information about the target's location or identity. Although the magnitude of the agency-slope would be equivalent regardless of whether it was fit across the three levels of mutual information or across the three levels of conditional target entropy, Gibson et al. (2023) chose to analyze changes in agency ratings as function of conditional target entropy because that scale is unique to target entropy whereas mutual information equally reflects the reduction in entropy associated with knowing either the target or the cue.
If top-down and voluntary attention control are interchangeable forms of attention control, then Gibson et al. (2023) reasoned that the sense of agency should decrease in a linear fashion as conditional target entropy increased across the 1.00-bit (100%-valid), 2.36-bit (70%-valid), and 3.00-bit (25%-valid) cue conditions. In other words, they reasoned that individuals should feel most in control when they had the least uncertainty about the location of the target, and they should feel the least in control when they had the most uncertainty about the location of the target. Gibson et al. used a linear growth-curve model to analyze the results of their study which allowed them to distinguish between a fixed slope factor that reflected the average slope of all the participants, and random factors that allowed each participant to have a unique slope and intercept.
The results of two experiments consistently showed that the average (fixed) slope was only slightly negative and did not differ significantly from zero. On the face of it, this finding suggests that, on average, feelings of agency did not change as a function of how much top-down information was provided about the task-relevant target, even though the range of cue validity values used was maximal. However, a much different conclusion was warranted by the analysis of the random factors: namely, the variance associated with both the random slope and intercept factors was consistently found to be significant across the two experiments. Of critical importance, the variance associated with the random slope factor showed variation in both the magnitude and direction of the individual slopes values which shed light on the near-zero fixed slope factor (see Miller and Schwarz, 2018, for a more general discussion of how individual differences can lead to null average effects). Their findings suggested that only 59% of the area under the theoretical population distribution of random slope values corresponded to negative slope values whereas the remaining 41% of the area under this curve corresponded to positive slope values.
In addition, the results of these two experiments also consistently showed significant covariation between the random slope and intercept factors suggesting that the direction of the random slope values varied inversely with the random intercept values. Those individuals who generated a negatively sloped growth curve exhibited the expected trajectory in which the 1.00-bit (100%-valid) cues elicited the highest ratings, and the 3.00-bit (25%-valid) cues elicited the lowest ratings. However, those individuals who generated a positively sloped growth curve exhibited an unexpected trajectory in which the 1.00-bit (100%-valid) cues elicited the lowest ratings, and the 3.00-bit (25%-valid) cues elicited the highest ratings.
The findings reported by Gibson et al. (2023) suggested that individuals can differ dramatically in how much agency they feel in response to standard manipulations of top-down information in the spatial cueing paradigm. But, why did approximately 40% of the individuals fail to experience the expected pattern of agency in their study? As Gibson et al. noted, the spatial cues used in the spatial cueing paradigm are external to the individual and the top-down information that is conveyed by these cues about the target is delivered in a random fashion by the experimental software. As such, the shifts of attention that are elicited by those cues may not be experienced as voluntary by some individuals because their attention is being guided by an extrinsic source of spatial information that they played no role in choosing (see e.g., Bargh, 1994; Bargh and Ferguson, 2000). As a result, the sense of agency these individuals experience while searching for the target may have increased only when the cues became less informative because only then did these individuals feel that they were searching for the target on their own. Indeed, Gibson et al. (2023) also showed that the agency ratings of all participants were significantly higher in a “no-cue” condition relative to the 3.00-bit (25%-valid) cue condition, suggesting that individuals generally felt more agency when searching without a cue at all.
In the present study, we attempted to actively increase the sense of agency elicited by external spatial cues by allowing individuals in one condition to voluntarily choose the direction indicated by the spatial cue on each trial, though the actual validity of the cue (and resulting conditional target entropy) remained out of their control. We considered this “controllability” manipulation to be like other attention control studies that have recently attempted to manipulate agency more directly (Wen and Haggard, 2018; Huffman and Brockmole, 2020). For instance, Huffman and Brockmole manipulated the role of agency in attention control by varying the extent to which participants were able to voluntarily choose the direction of a visual search display of moving circles. Participants controlled the directional movement of one of four display circles by pressing the directional arrows keys on a computer keyboard. Participants were considered to have more voluntary control when they were allowed to press the arrow keys in whatever manner they chose whereas they were considered to have less voluntary control when they were required to press the arrow keys in accordance with a computer-generated pattern of key presses. Unfortunately, Huffman and Brockmole (2020) did not consistently obtain agency ratings across their three experiments, and thus they could not explicitly compare how agency ratings might have changed when participants were free to exercise volitional control over the direction of the controlled circle vs. when they were not free to do so. Furthermore, they focused on average performance and did not examine individual differences.
In the present study, we explicitly compared the agency ratings obtained across two separate volition conditions that were encountered by two independent samples of participants. In the “direction selected” condition, the cued direction was voluntarily selected by the participant on each trial whereas, in the “direction assigned” condition, the cued direction was randomly assigned by the experimental software on each trial (as in Gibson et al., 2023 original experiments). We expected that a greater proportion of individuals would generate the negatively sloped growth curves when cued direction was selected relative to when it was assigned randomly on each trial.
In addition to directly comparing the reports of agency across the direction selected and assigned conditions, the present study also included another potentially important modification. Namely, the use of arrow and onset cues may have been problematic for Gibson et al.'s (2023) purposes because others (Ristic and Kingstone, 2012; Ristic et al., 2012) have argued that both of these cues may routinely elicit involuntary (or automatized) shifts of attention which may in turn temper conclusions about the ability of these stimuli to elicit voluntary shifts of attention (see also, Hommel et al., 2001; Gibson and Bryant, 2005; Gibson and Kingstone, 2006). Accordingly, in the present study, we used the numbers “1,” “2,” “3,” and “4” as cues to arbitrarily refer to the above, right, below, and left directions, respectively. Our intention was to use cues that were not strongly associated a priori with these directions, and therefore would be less likely to elicit involuntary (or automatized) shifts of attention.
In summary, previous research reported by Gibson et al. (2023) has shown that top-down and voluntary attention control are aligned for only about half of the participants in the standard spatial cueing paradigm. The present study attempted to replicate these previous findings under conditions in which the standard manipulation of top-down information was conveyed by a number cue (as opposed to an arrow or onset cue). But more importantly, the present study was also designed to examine if the proportion of individuals who aligned top-down and voluntary attention control could be increased by combining the standard manipulation of top-down information with a novel manipulation of volition in a separate condition in which participants were given the opportunity to freely choose (or not) the direction of the spatial cue on each trial.
A total of 160 participants were recruited through Prolific (www.prolific.co) in exchange for monetary payment ($6.00 USD). The two volition conditions were run consecutively. The first group of 80 participants was run in the direction assigned condition, and the second group of 80 participants was run in the direction selected condition. These sample sizes were chosen to match the sample size used in Experiment 2 of Gibson et al. (2023) study. Note that power analyses are not well developed for mixed-effects models (Maxwell et al., 2018); this is especially true for estimating the power of random factors because the null value (population variance equal to zero) is also the minimum possible value of this parameter, and the sampling distributions of such “boundary values” are not well understood by statisticians (Verbeke and Molenberghs, 1997). To be included in the experiment, participants were required to (1) self-report that they were a fluent English speaker; (2) self-report normal or corrected-to-normal visual acuity; and, (3) finish the experiment with an overall percent error rate on the visual search task that was ≤ 30%. The Institutional Review Board at the University of Notre Dame approved all procedures reported in this manuscript. These data were collected in the fall of 2021.
Both volition conditions were programmed using PsychoPy Experiment Builder (Peirce et al., 2019), and virtual data collection was hosted through PsychoPy's open science website Pavlovia. The sizing of stimuli in PsychoPy are specified in 'height units' which are relative to the height of participants' computer screen while the ratio of the height to width of the stimuli remain absolute. The use of these units in PsychoPy ensure that stimuli are presented consistently without restricting participation based on screen-size or OS requirements. In the following description, we report the size of the stimuli in terms of height units, but for the sake of clarity, we also report their size in terms of centimeters (cm) based on a 13-inch widescreen display.
As shown in Figure 1 Top, each trial in the direction assigned condition consisted of three displays which were presented against the black background of the screen: a fixation display, a cue display, and a target display. The fixation display contained a small white fixation dot in the center of the display; the fixation dot measured 0.015 units (0.3 cm) in diameter. Four boxes were presented 0.16 units (2.80 cm) above, below, left of, or right of central fixation. Each box appeared as a square, 0.07 units (1.30 cm) tall and 0.07 units (1.30 cm) wide, and had a black fill and gray outline. The fixation dot was replaced by a white number between 1 and 4 that indicated the direction of one of the four peripheral boxes. The “1” cue referred to the above location; the “2” cue referred to the right location; the “3” cue referred to the below location; and the “4” cue referred to the left location. The number cues were 0.04 units (0.50 cm) at their widest point and 0.06 units (1.10 cm) tall. The target display contained a single white target letter (E or U) along with three non-target letters (A, P, and S). Each letter was 0.04 units (0.50 cm) tall and 0.04 units (0.50 cm) wide and appeared in one of the four gray boxes; the target was equally likely to appear in any of the four directions (above, below, left, or right).
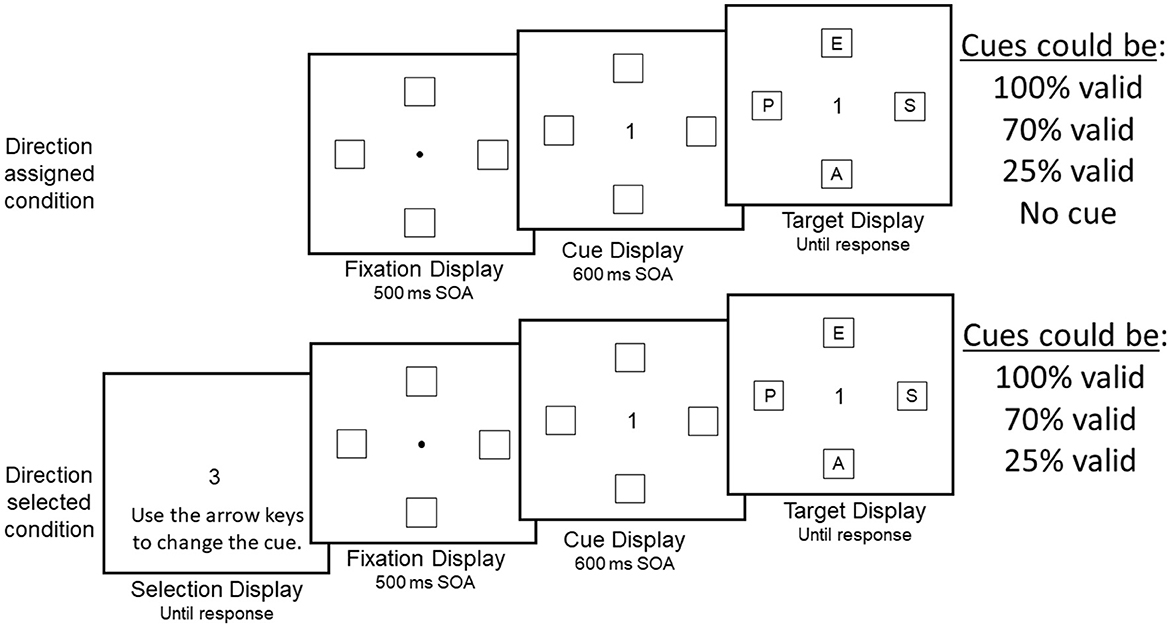
Figure 1. Example display sequences used in the direction assigned (Top) and direction selected (Bottom) conditions of the present experiment.
As shown in Figure 1 Bottom, the sequence of displays in the direction selected condition was identical to the sequence of displays in the direction assigned condition with the sole exception being the insertion of a selection display that appeared at the start of each trial. In the selection display, one of the four number cues was randomly assigned (as in the direction assigned condition); however, participants in the direction selected condition were allowed to change the direction of the cue on each trial by pressing the right arrow key on the keyboard. This arrow key advanced through a random sequence of the number cues, and the cycle could be repeated until a cue was selected. Participants locked in their choice by pressing the space bar which then triggered the appearance of the fixation display followed by the cue display (which contained the selected cue) and then the target display.
The design of the direction assigned condition was identical to the design of the two experiments reported in Gibson et al. (2023) with the sole exception being that number cues were used to convey direction in the present study. Four levels of a conditional target entropy (or cue validity) factor [1.00-bit (100% valid), 2.36-bit (70% valid), 3.00-bit (25% valid), and no cue] were presented within the context of a repeated measures design. Note that although the cue was absent from the display in the no cue context, we treated this context as a separate level of the conditional target entropy factor for the purposes of balancing the design. Each of the four conditional target entropy conditions was presented in a separate block of 40 trials, and this group of four blocks was repeated four times for a total of 16 blocks (640 total experimental trials). The order of the four conditional target entropy conditions was randomized separately within each repetition group for each participant.
The design of the direction selected condition was identical to the design of the direction assigned condition with the sole exception being the elimination of the no-cue condition, which was omitted out of necessity because there is no cue to be selected in the no-cue condition. Each of the remaining three conditional target entropy conditions was presented in a separate block of 40 trials, and this group of three blocks was repeated four times for a total of 12 blocks (480 total experimental trials). The order of the three conditional target entropy conditions was randomized separately within each repetition group for each participant.
At the beginning of each block in the direction assigned condition, participants were informed of the presence and validity of the cues; the direction of the cues was described as “always accurate” in the 1.00-bit (100%-valid) cue condition, “mostly accurate” in the 2.36-bit (70%-valid) cue condition, and “rarely accurate” in the 3.00-bit (25%-valid) cue condition. Note that when the cue was invalid, the target was equally likely to appear at each of the three uncued locations. In the 2.36-bit (70%-valid) cue condition, the target appeared at each of the uncued locations 10% of the time; and, in the 3.00-bit (25%-valid) cue condition, the target appeared at each of the uncued locations 25% of the time. On each trial within a block, a fixation display appeared first for 500 ms followed by the cue display. After 600 ms, the target display was added to the cue display and the two displays remained on screen until a response was made. On each trial, the target letter was equally likely to be an E or U. Observers always pressed the “E” key with their left hand to discriminate the identity of the E target and the “U” key with their right hand to discriminate the identity of the U target.
At the end of each block, participants were instructed to rate the level of agency they felt. Participants were told that individuals are thought to have a positive sense of agency when they consider themselves to be the initiator of their actions, along with the following instructions, provided at the beginning of the experiment:
“We are interested in how much agency you feel in these different visual search contexts. Please always use the cue to try to find the target, regardless of how useful or accurate it is. At the end of each block, a rating scale will appear on the screen, and you will be asked to rate the extent to which you considered yourself to be in control of finding the target. A rating of ‘1′ will correspond to ‘no control' whereas a rating of ‘7′ will correspond to ‘full control.' You will respond by using the corresponding number keys on your keyboard to report the magnitude of your positive sense of agency in each block.”
The procedure in the direction selected condition was identical to the procedure in the direction assigned condition with two exceptions. First, cues were always present in each block. Second, a selection display appeared first on each trial; the selection display remained on the screen until participants made their direction choice, at which point they were instructed to press the space bar and then the trial proceeded as in the direction assigned condition.
We began by examining valid and invalid response times (RTs) in each of the two volition conditions to ensure that standard spatial cueing effects were obtained in this study. The top panel of Figure 2 shows mean correct valid and invalid RTs as a function of conditional target entropy in each of the direction assigned and selected conditions; the bottom panel of Figure 2 shows the corresponding percent error rates. First, a 2 × 3 repeated measures analysis was conducted on mean correct valid RTs, with volition condition (direction assigned vs. direction selected) and conditional target entropy (1.00 bit vs. 2.36 bits vs. 3.00 bits) as the two within-subjects factors. These analyses were conducted using the multivariate approach to avoid violating the sphericity assumption. As can be seen in Figure 2, mean correct valid RTs were significantly slower overall (by 176 ms) in the direction selected condition than in the direction assigned condition, F(1, 158) = 28.26, p < 0.001, = 0.15, for the main effect of volition condition. Although this main effect of volition condition was not explicitly predicted, it may reflect a greater contribution of intentional processes, which are known to be slower (Wolfe et al., 2000), in the direction selected condition. In addition, as expected, mean correct valid RTs also increased significantly as a function of conditional target entropy, F(2, 78) = 213.86, p < 0.001, = 0.85, for the main effect of conditional target entropy. However, the effect of conditional target entropy was very similar across the two volition conditions resulting in a non-significant interaction between volition condition and conditional target entropy, F(2, 78) = 1.49, p = 0.23, = 0.04. Likewise, an identical analysis of percent error rates revealed no significant main effects or interaction (all p's > 0.26 or more).

Figure 2. Mean correct overall RTs and error rates obtained in each of the direction assigned and direction selected conditions as a function of conditional target entropy. Error bars reflect standard error of the mean.
Second, we also examined the relation between valid and invalid trials in the 2.36-bit (70%-valid) and 3.00-bit (25%-valid) cue conditions (recall that the 1.00-bit (100%-valid) cue condition did not include any invalid trials). A 2 × 2 × 2 Split-Plot ANOVA was conducted on mean correct RTs, with volition condition as the sole between-subjects factor, and with conditional target entropy (2.36 bit vs. 3.00 bit) and cued location (valid vs. invalid) as the two within-subjects factors. This analysis was conducted using the univariate approach because the sphericity assumption could not be violated with only two levels of each factor. Most importantly, as expected, there was a significant two-way interaction between conditional target entropy and cued location, F(1, 158) = 64.72, p < 0.001, = 0.29, indicating that the 113-ms spatial cueing effect observed in the 2.36-bit (70%-valid) cue condition was larger than the 40-ms spatial cueing effect observed in the 3.00-bit (25%-valid) cue condition. In addition, there was also a significant two-way interaction between volition condition and cued location, F(1, 158) = 3.86, p = 0.051, = 0.02, indicating that the 93-ms spatial cueing effect observed in the direction selected condition was larger than the 61-ms spatial cueing effect observed in the direction assigned condition. This interaction may reflect the manifestation of a greater effect of agency on RTs in the direction selected condition. The three-way interaction between volition condition, conditional target entropy and cued location did not attain significance, F(1, 158) = 0.31, p = 0.58, = 0.002. An identical analysis was also conducted on percent error rates. Although the pattern of error rates mirrored the pattern of RTs, the two-way interaction between conditional target entropy and cued location was only marginally significant, F(1, 158) = 2.92, p = 0.089, = 0.02. Furthermore, the interaction between volition condition and cued location did not attain significance, F(1, 158) = 0.42, p = 0.52, = 0.003.
A mixed-effects (growth-curve) modeling approach was used in the present study to examine potential individual differences in voluntary attention control. Mixed-effects models explicitly distinguish between fixed factors and random factors in the analysis of repeated measures designs (see Singer and Willett, 2003, for an introduction to these methods), where a fixed factor refers to an independent variable whose levels have been pre-selected by the researcher and a random factor refers to an independent variable whose levels have been chosen randomly. In this way, each participant in a repeated measures design is a random level of an independent variable labeled “subject;” in this context, a significant effect of the random “subject” factor is reflected by significant variation across the different levels of the subject factor (constituting individual differences). One of the main advantages to using mixed-effects models is that they afford greater flexibility in how the random subject factor is allowed to interact with the fixed factor (see, Kliegl et al., 2011; Barr et al., 2013; Matuschek et al., 2017; Oberaurer, 2022 for recent discussion).
To help understand the advantage of the mixed-effects model approach, consider the standard univariate ANOVA approach to analyzing repeated measures designs. In this standard approach, the fixed factor—conditional target entropy—must be treated as a categorical variable whereas it can be treated as a continuous variable in the mixed-effects model approach. Figures 3A, B show both the individual (light gray lines) and average (dark black symbols and lines) agency ratings plotted as a function of conditional target entropy in each of the direction assigned and direction selected conditions, respectively. In these designs, the subject X conditional target entropy interaction serves as the error term (i.e., the denominator) in the F-test that evaluates the main effect of conditional target entropy within each volition condition. However, this interaction is assumed to be zero in the population within the context of the univariate ANOVA approach; this assumption is called the “sphericity assumption.”
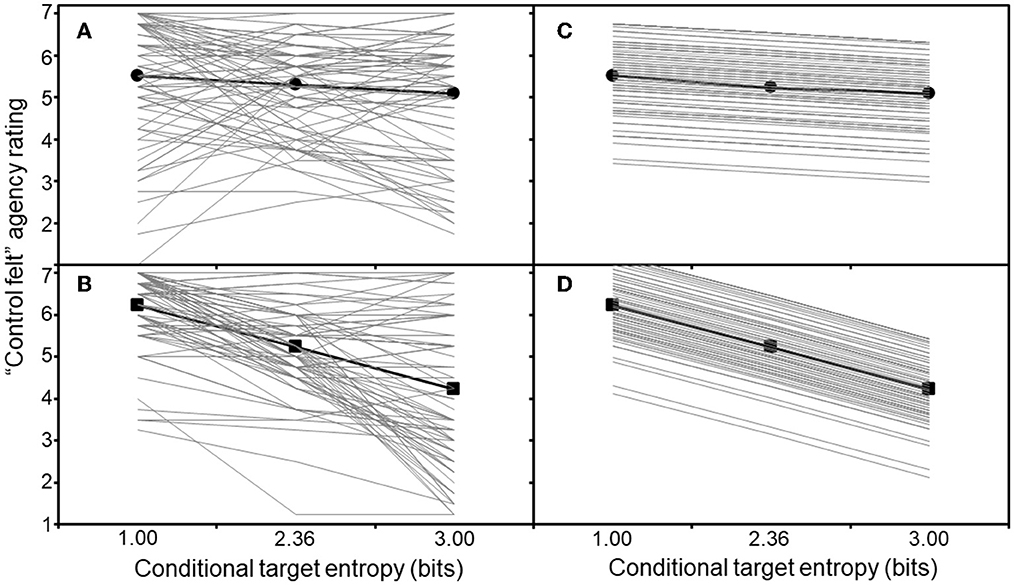
Figure 3. The univariate approach to analyzing “control felt” agency ratings as a function of conditional target entropy. Note the three levels of conditional target entropy are treated as a categorical variable in the univariate approach. (A) Actual individual (light gray lines) and average (dark black symbols and lines) “control felt” agency ratings depicted as function of conditional target entropy in the direction assigned condition. (B) Actual individual (light gray lines) and average (dark black symbols and lines) “control felt” agency ratings depicted as function of conditional target entropy in the direction selected condition. (C) Predicted individual (light gray lines) and average (dark black symbols and lines) “control felt” agency ratings depicted as function of conditional target entropy in the direction assigned condition when sphericity is assumed. (D) Predicted individual (light gray lines) and average (dark black symbols and lines) “control felt” agency ratings depicted as function of conditional target entropy in the direction selected condition when sphericity is assumed.
From the perspective of mixed-effects models, sphericity corresponds to a model that includes conditional target entropy as the fixed factor along with a random intercept factor that allows each participant to have a unique intercept. However, this model assumes that the individual difference in intercepts is the only difference between individuals' true trajectories which are all assumed to be parallel. For instance, Figures 3C, D show the individual trajectories that would be predicted by a random intercept model in each of the direction assigned and direction selected conditions. The discrepancy that is apparent between the actual and predicted individual trajectories reflects nothing more than error according to the univariate approach.
However, if the actual individual trajectories depicted on the left-hand side of Figure 3 reflect the existence of slopes (and intercepts) that are truly different for each participant, then this would represent a violation of the sphericity assumption, and the univariate approach to analyzing repeated measures designs would no longer be statistically appropriate because the type I error rate could be drastically higher than the nominal alpha value (see Maxwell et al., 2018). Fortunately, there are three potential solutions to a violation of the sphericity assumption: (1) use various correction factors (such as Greenhouse-Geisser) that adjust the degrees of freedom and thus the critical values associated with the univariate F-tests; (2) use the multivariate approach to analyzing repeated measures designs; and (3) use the mixed-effects approach to analyzing repeated measure designs. Options 2 and 3 have been deemed the most appropriate because they take into consideration all the error that results when the subject X fixed factor interaction is non-zero (Maxwell et al., 2018). The main difference between options 2 and 3 is that the multivariate approach does not attempt to explicitly model the random factors whereas the mixed-effects model does.
Accordingly, we used a growth-curve modeling approach in the present study that treated the two levels of volition condition (direction assigned vs. direction selected) as a categorical variable and the three levels of conditional target entropy as a continuous variable. The statistical model included fixed main effects of volition condition and conditional target entropy as well as the interaction between these two fixed factors. In addition, the statistical model also included both random slope and intercept factors that were fit across the three levels of conditional target entropy. Note that the conditional target entropy scale was shifted by −1.00 bit in the analysis so that the value of the intercept estimate corresponded with the value predicted in the 1.00-bit (100%-valid) cue condition. These analyses were conducted using SAS PROC MIXED. Model parameters were estimated using restricted maximum likelihood (REML), and accompanying p-values were calculated based on a Wald test, both of which are the default setting in SAS PROC MIXED.
Figure 4 depicts the individual (light gray lines) and average (dark black symbols and lines) agency slopes (and intercepts) that were fit across the three levels of conditional target entropy in each of the direction assigned (panel A) and direction selected (panel B) conditions. There were significant fixed main effects of volition condition, F(1, 158) = 15.04, p = 0.0002, η2 = 0.09, and conditional target entropy, F(1, 158) = 64.19, p < 0.0001, η2 = 0.29. More importantly, as expected, there was also a significant volition condition X conditional target entropy interaction, F(1, 158) = 26.23, p < 0.0001, η2 = 0.14, suggesting that conditional target entropy had a larger effect on agency ratings in the direction selected condition than in the direction assigned condition.
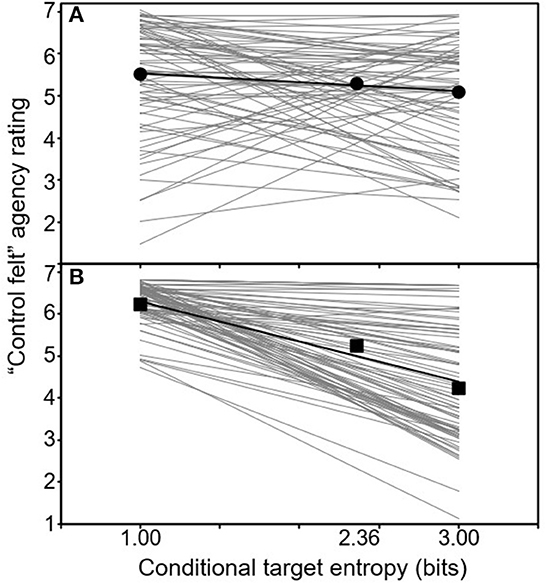
Figure 4. The linear growth curve model approach to analyzing “control felt” agency ratings as a function of conditional target entropy. Note the three levels of conditional target entropy are treated as a continuous variable in the linear growth curve approach. (A) Predicted individual (light gray lines) and average (dark black symbols and lines) “control felt” agency ratings depicted as function of conditional target entropy in the direction assigned condition when both random slope and intercept factors are included in the growth curve model. (B) Predicted individual (light gray lines) and average (dark black symbols and lines) “control felt” agency ratings depicted as function of conditional target entropy in the direction selected condition when both random slope and intercept factors are included in the growth curve model.
The two-way interaction between volition condition and conditional target entropy was examined further by analyzing the fixed effect of conditional target entropy, along with the random intercept and slope factors, within each volition condition separately. With respect to the direction assigned condition, we expected to replicate the main findings reported by Gibson et al. (2023). Consistent with their findings, the average slope was found to be slightly negative (-0.21 units of agency/bit), and it was also found to be significant in this experiment, F(1, 79) = 3.98, p = 0.049, η2 = 0.05, 95% CI [−0.42, −0.0006]. In addition, the variance associated with the random slope factor was found to be significant, Var = 0.79, z = 5.55, p < 0.0001, 95% CI [0.57, 1.16], as was the variance associated with the random intercept factor, Var = 1.96, z = 5.70, p < 0.0001, 95% CI [1.43, 2.86]. The fact that the variance associated with the random slope factor was significant suggests that the individual differences in the slope estimates represented true slope differences; therefore, contrary to the sphericity assumption underlying the standard univariate ANOVA approach to analyzing repeated measures designs, these findings suggest that a statistical model which only allows individuals to differ in their intercepts should be rejected. In addition, there was also significant covariation between these two random factors, Cov = −0.79, z = −4.22, p < 0.0001, 95% CI [−1.15, −0.42], which corresponds to a correlation (r) of −0.632. This finding suggests that the slope estimates tended to vary inversely with the intercept estimates.
With respect to the direction selected condition, the average slope was strongly negative (-0.95 units of agency/bit), and it was also found to be significant in this experiment, F(1, 79) = 90.65, p < 0.0001, η2 = 0.53, 95% CI [−1.15, −0.76]. In addition, the variance associated with the random slope factor was found to be significant, Var = 0.55, z = 4.10, p < 0.0001, 95% CI [0.36, 0.95], as was the variance associated with the random intercept factor, Var = 0.47, z = 2.72, p =0.003, 95% CI [0.26, 1.13]. As in the direction assigned condition, the fact that the variance associated with the random slope factor was significant suggests that a statistical model which only allows individuals to differ in their intercepts should be rejected. However, the covariation between these two random factors did not attain significance, Cov = −0.10, z = −0.86, p = 0.39, 95% CI [−0.40, 0.13], which corresponds to a correlation (r) of −0.198.
One way to help visualize the treatment effects associated with the random slope and intercept factors is to depict the corresponding theoretical population distributions that were extracted by the growth-curve models in this experiment. The distributions associated with the direction assigned and direction selected conditions are depicted in Figure 5; as required by the mixed-effects modeling approach, these distributions are assumed to have a normal shape.

Figure 5. Theoretical population distributions of agency ratings that were extracted by the growth-curve models in the direction assigned (solid line) and direction selected (dotted line) conditions. The distribution of slopes is shown in the Left and the distribution of intercepts is shown in the Right.
With respect to the direction assigned condition (solid lines), the mean value of the slope distribution was −0.21 units of agency/bit, and it had a standard deviation of 0.89 units of agency/bit (see Figure 5, Left); the mean value of the intercept distribution was 5.53 units of agency, and it had a standard deviation of 1.40 units of agency (see Figure 5, Right). Based on the random slope distribution, it was estimated that a slight majority (60%) of individuals would be expected to exhibit the expected pattern in which they felt the greatest agency in the 1.00-bit (100%-value) cue context and the least agency in the 3.00-bit (25%-valid) cue context—i.e., a slope < 0, though this also means that a substantial percentage of individuals (40%) would also be expected to exhibit the opposite pattern. These findings corroborate the findings reported by Gibson et al. (2023) using a number cue that should not have elicited involuntary (or automatized) shifts of attention.
With respect to the direction selected condition (dotted lines), the mean value of the slope distribution was −0.95 units of agency/bit, and it had a standard deviation of 0.74 units of agency/bit (see Figure 5, Left); the mean value of the intercept distribution was 6.30 units of agency, and it had a standard deviation of 0.68 units of agency (see Figure 5, Right). Based on the random slope distribution, it was estimated that a substantial majority (90%) of individuals would be expected to exhibit the expected pattern in which they felt the greatest agency in the 1.00-bit (100%-value) cue context and the least agency in the 3.00-bit (25%-valid) cue context—i.e., a slope < 0. These findings support the conclusion that allowing participants to voluntarily choose (or not) the direction of the number cue on each trial increased the proportion of participants who generated negatively sloped growth curves.
The percentage of positive and negative slopes estimated by the mixed-effects modeling approach requires an assumption of normality, which can be difficult to prove, especially when relatively small samples are used. To allay these concerns, we also used the Ordinary Least Squares (OLS) method to estimate the observed agency slopes for each participant in order to count the relative number of positive and negative slopes observed in our sample, as well as to help visualize how the direction of the slope estimates varied inversely with the intercept estimates, at least in the direction assigned condition.
With respect to the direction assigned condition, there were 48 individuals (60%) with negative slopes, and 24 individuals (30%) with positive slopes; eight individuals (10%) provided the same rating across all three conditional target entropy conditions and were assigned a slope of zero. These percentages are very similar to the percentages estimated by the corresponding growth curve model. Likewise, with respect to the direction selected condition, there were 65 individuals (81.25%) with negative slopes, and 10 individuals (12.5%) with positive slopes; five individuals (6.25%) provided the same rating across all three conditional target entropy conditions and were assigned a slope of zero. These percentages were also very similar to the percentages estimated by the corresponding growth curve model. Thus, the percentage of positive and negative slopes observed in the empirical frequency distribution of OLS slopes was similar to the percentage inferred from the theoretical distributions suggesting that the assumption of normality was justified.
It is also worth pointing out that, within the context of classical test theory, reliability is conceptualized as the ratio of true variance to observed variance. In the present study, the estimated variance of the random slope and intercept factors can be interpreted as the true variance and the estimated variance of the individual OLS slopes and intercepts can be interpreted as the observed variance. In the direction assigned condition, the ratio of these two variances was found to be 0.89 for slopes and 0.91 for intercepts; in the direction selected condition, the ratio of these two variances was found to be 0.68 for slopes and 0.49 for intercepts.
Figures 6A, B show the relation between the direction of the OLS slope estimates and the magnitude of the OLS intercept estimates in the direction assigned and direction selected conditions, respectively. With respect to the direction assigned condition (see Figure 6A), in the 1.00-bit (100%-valid) cue condition, the agency ratings reported by the group of individuals with negatively sloped growth curve estimates (M = 5.97, SE = 0.18) were significantly higher than the agency ratings reported by the group with positively sloped growth curve estimates (M = 4.19, SE = 0.25), F(1, 70) = 33.85, p < 0.001, η2 = 0.33. In contrast, in the 3.00-bit (25%-valid) cue condition, the agency ratings reported by the group of individuals with negatively sloped growth curve estimates (M = 4.40, SE = 0.19) were now significantly lower than the agency ratings reported by the group with positively sloped growth curve estimates (M = 5.86, SE = 0.27), F(1, 70) = 20.08, p < 0.001, η2 = 0.22. In the 2.36-bit (70%-valid) cue condition, the agency ratings reported by the group of individuals with negatively sloped growth curve estimates (M = 4.99, SE = 0.16) were more similar to the agency ratings reported by the group with positively sloped growth curve estimates (M = 5.41, SE = 0.22) and the two groups did not differ significantly in this condition, F(1, 70) = 2.41, p = 0.12, η2 = 0.03.

Figure 6. Average “control felt” agency ratings depicted as function of conditional target entropy. (A) Average agency ratings shown separately for those individuals who generated negatively sloped and positively sloped growth curves in the direction assigned condition. (B) Average agency ratings shown separately for those individuals who generated negatively sloped and positively sloped growth curves in the direction selected condition. (C) Average agency ratings shown separately for those individuals who generated negatively sloped growth curves in the direction assigned and direction selected conditions. (D) Average agency ratings shown separately for those individuals who generated positively sloped growth curves in the direction assigned and direction selected conditions. Error bars reflect standard error of the mean.
In addition, we also conducted a repeated measures analysis on agency ratings in the direction assigned condition with cue presence (no cue vs. 3.00 bits) as the sole within-subjects factor in both the negatively sloped and positively sloped growth curve groups separately (see the black and white triangles in Figure 6A, respectively). This analysis was conducted using the univariate approach because the sphericity assumption could not be violated with only two levels of the factor. As expected, agency ratings were significantly higher in the no cue condition (M = 5.30, SE = 0.21) than in the 3.00-bit (25%-valid) cue condition (M = 4.40, SE = 0.21), for those individuals with negatively sloped growth curve estimates, F(1, 47) = 20.33, p < 0.001, d = 0.92. Likewise, agency ratings were also significantly higher in the no cue condition (M = 6.55, SE = 0.11) than in the 3.00-bit (25%-valid) cue condition (M = 5.86, SE = 0.18), for those individuals with positively sloped growth curve estimates, F(1,23) = 12.33, p = 0.002, d = 1.01. Thus, these findings also replicate the findings reported by Gibson et al. (2023), and suggest that individuals had a stronger sense of agency when they searched for the target without a cue, even though neither context provided any top-down information about the location (or identity) of the target.
Turning now to the direction selected condition (see Figure 6B), in the 1.00-bit (100%-valid) cue condition, the agency ratings reported by the group of individuals with negatively sloped growth curve estimates (M = 6.22, SE = 0.11) were now similar to the agency ratings reported by the group with positively sloped growth curve estimates (M = 5.88, SE = 0.29), and the two groups did not differ significantly in this condition, F(1, 73) = 1.82, p = 0.18, η2 = 0.02. In contrast, in the 2.36-bit (70%-valid) cue condition, the agency ratings reported by the group of individuals with negatively sloped growth curve estimates (M = 4.97, SE = 0.12) were now significantly lower than the agency ratings reported by the group with positively sloped growth curve estimates (M = 5.98, SE = 0.31), F(1, 73) = 8.71, p = 0.004, η2 = 0.11. Likewise, in the 3.00-bit (25%-valid) cue condition, the agency ratings reported by the group of individuals with negatively sloped growth curve estimates (M = 3.69, SE = 0.16 units of agency/bit) were also significantly lower than the agency ratings reported by the group with positively sloped growth curve estimates (M = 6.30, SE = 0.48), F(1, 73) = 25.54, p < 0.001, η2 = 0.26.
For the sake of comparison, Figure 6C shows the growth curves of those individuals who generated negatively sloped growth curves from each of the two volition conditions, and Figure 6D shows the growth curves of those individuals who generated positively sloped growth curves from each of the two volition conditions. As can be seen, those who generated negatively sloped growth curves were very similar across the two volition conditions whereas those who generated positively sloped growth curves tended to have higher agency ratings in the direction selected condition than in the direction assigned condition across the three levels of conditional target entropy, and especially in the 1.00-bit (100%-valid) cue conditions.
We also examined the extent to which participants exercised their freedom to choose the direction of the cue in the direction selected condition. Figure 7 shows the proportion of trials that participants chose the randomly assigned direction in the direction selected condition as function of conditional target entropy. The results of the linear growth curve analysis revealed that the average slope was close to zero (0.007 units of agency/bit), and non-significant, F(1, 79) = 1.26, p = 0.27, η2 = 0.02. In addition, only the variance associated with the random intercept factor was found to be significant, Var = 0.10, z = 5.99, p < 0.0001, 95% CI [0.08, 0.15]. The variance associated with the random slope factor was found to be non-significant, Var = 0.0004, z = 0.71, p =0.24, 95% CI [0.00009, 0.40], as was the covariation between these two random factors, Cov = −0.001, z = −0.53, p =0.60, 95% CI [-0.005, 0.003], which corresponds to a correlation (r) of −0.17.
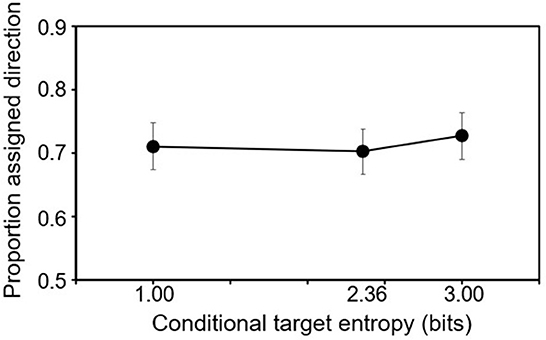
Figure 7. Average proportion of trials that participants chose not to change the randomly assigned direction cue in the direction selected condition as a function of conditional target entropy. Error bars reflect standard error of the mean.
Given that the average slope did not differ from zero and given that individual slopes did not differ significantly around this average, we averaged the proportion of trials that participants chose the randomly assigned direction across the three levels of conditional target entropy. The modal proportion was 1.00 (N = 18) and a total of 41 participants (51.25%) had proportions that were 0.90 or above. Thus, a substantial number of participants chose not to choose the direction of the cue in the direction selected condition. Of course, this finding may not be completely unexpected given that a similar number (48) of individuals were able to align their experience of agency with the top-down information that was conveyed by the cues in the direction assigned condition. However, upon closer inspection, those participants who chose not to choose the direction of the cue in the direction selected condition did not always align their experience of agency with the top-down information conveyed by the cues. Specifically, seven of these participants generated positively sloped growth curves and three of these participants generated a zero slope. Thus, a small number of participants seemed to resist exercising their freedom to select the direction of the cues as well as the opportunity to align their agency with the top-down information conveyed by the cues.
In addition, we also examined how participants distributed their choices across the four possible directions in the direction selected condition. We measured the distribution of direction choices by comparing the observed proportion of times each participant chose each direction with a model that predicted an equal distribution (0.25) of choices across the four directions. The magnitude of the deviation of the observed proportion from the predicted proportion was then squared, and we summed these squared deviations across the four directions to get a measure of error.
Figure 8 is a scatterplot that relates this error to the average proportion of trials that each participant chose the randomly assigned direction. As expected, the error was essentially zero on y-axis when the average proportion of accepting the randomly assigned direction was near 1.00 on the x-axis because these participants chose not to change the cued direction, and the experiment was programmed to randomly assign the cued direction across the four directions. However, most individuals (N = 68) managed to distribute their choices equally across the four directions even when they exercised their freedom to choose the cued direction on nearly all the trials. We identified this large group of participants as the “small bias” group (see the circle symbols clustered on or near the x-axis) in Figure 8. However, we also identified two smaller groups of participants who exercised their freedom to choose the cued direction on nearly all the trials, but who also seemed to consistently chose only one or two directions throughout the duration of the experiment. For instance, we identified one group of four participants as the “medium bias” group (see the triangle symbols), and another group of eight participants as the “large bias” group (see the diamond symbols) in Figure 8 based on the magnitude of their error from the random distribution model.
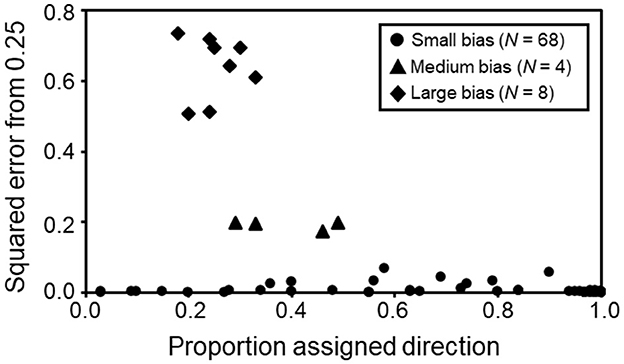
Figure 8. Scatterplot showing the average proportion of trials that each participant chose not to change the randomly assigned direction of the cue in the direction selected condition on the x-axis and the sum of squared error from a model that predicted equal distribution of cue choice across the four directions on the y-axis.
Figure 9 shows more clearly how these three groups of participants distributed their direction choices (or not) across the four cued directions. As can be seen in Figure 9, when there was a direction bias (as in the “medium bias” and “large bias” groups), participants tended to prefer the above direction. Note that there is nothing inherently wrong with this pattern of choices, as participants in the direction selected condition were allowed to choose any direction they desired. In fact, it is perhaps surprising that only a total of 12 participants (15%) opted to cue the same direction on every (or nearly every) trial.
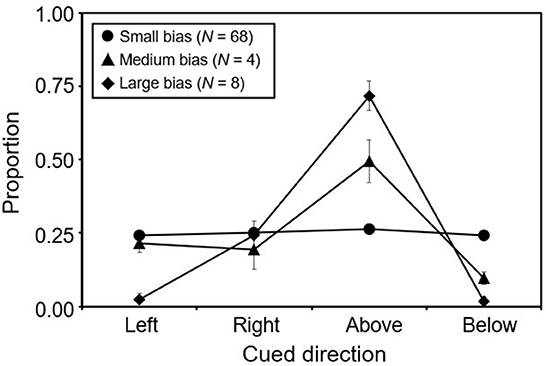
Figure 9. Average proportion that each of the four directions was chosen in the direction selected condition for each of the small, medium, and large bias groups identified in Figure 8. Error bars reflect the standard error of the mean.
The present study attempted to bring top-down attention control into alignment with voluntary attention control by combining a standard manipulation of top-down information with a novel manipulation of volition within the context of the spatial cueing paradigm. In the present study, top-down information about the location of a task-relevant target letter was conveyed by number cues that indicated one of four possible fixed directions (above vs. below vs. left vs. right) on each trial. The amount of top-down information was manipulated in the standard way by varying the accuracy (or validity) of the cue from 100% (perfect accuracy) to 25% (chance accuracy); 70%-valid cues were also included as an intermediate value so that linear functions could be fit across the three levels of cue validity. The amount of volition was manipulated in a novel way by manipulating the extent to which participants could choose the direction of the number cue. Participants were considered to have more voluntary control when they were allowed to freely choose (or not) the direction conveyed by the number cue on each trial (i.e., the direction selected condition); whereas participants were considered to have less voluntary control when they were not allowed to change the direction conveyed by the number cue (i.e., the direction assigned condition).
Although experimental manipulations of top-down information are usually reported in terms of the accuracy (or validity) of the cue, here we translated cue validity into conditional target entropy values—expressed in terms of bits of uncertainty—to improve the linear fit of our statistical model (see also, Gibson et al., 2021). In general, we considered top-down and voluntary attention control to be in alignment when the “control felt” sense of agency decreased in a linear fashion across the 1.00-bit (100%-valid), 2.36-bit (70%-valid), and 3.00-bit (25%-valid) cue conditions. In other words, we expected that individuals should feel most in control when they had the greatest amount of top-down information (or the least amount of uncertainty) about the location of the target; whereas individuals should feel the least in control when they had the least amount of top-down information (or the greatest amount of uncertainty) about the location of the target. However, based on previous findings (Gibson et al., 2023), we also expected that the effect of top-down information on agency would interact with the volition manipulation in that we expected that the fixed effect of conditional target entropy on agency would be weaker in the direction assigned condition than in the direction selected condition due to the fact that a smaller proportion of individuals would have negative slopes in the former condition than in the latter condition.
The main results of our study were consistent with these expectations. As expected, there was a significant two-way interaction between volition condition and conditional target entropy indicating that the average (fixed) slope was less negative in the direction assigned condition (−0.21 units of agency/bit) than in the direction selected condition (-0.95 units of agency/bit), though both slopes were found to be significantly < 0. Furthermore, an analysis of random factors indicated that the variance associated with both the random slope and intercept factors was consistently found to be significant across the two volition conditions. Of critical importance, as can be seen in Figure 5, the present findings suggested that only 60% of the area under the theoretical population distribution of random slope values corresponded to negative slope values in the direction assigned condition; whereas 90% of the area under the theoretical population distribution of random slope values corresponded to negative slope values in the direction selected condition.
In addition, the results also showed significant covariation between the random slope and intercept factors in the direction assigned condition, suggesting that the direction of the random slope values varied inversely with the random intercept values in the direction assigned condition, but this covariation was not found to be significant in the direction selected condition. For instance, Figure 6A shows agency ratings plotted separately for those individuals who generated negatively sloped growth curves vs. those who generated positively sloped growth curves in the direction assigned condition. The most striking aspect of these two groups is that those individuals who generated negatively sloped growth curves exhibited the expected trajectory in which the 1.00-bit (100%-valid) cues elicited the highest ratings, and the 3.00-bit (25%-valid) cues elicited the lowest ratings. However, those individuals who generated positively sloped growth curves exhibited an unexpected trajectory in which the 1.00-bit (100%-valid) cues elicited the lowest ratings, and the 3.00-bit (25%-valid) cues elicited the highest ratings. Thus, the findings obtained in the direction assigned condition corroborate the main findings reported by Gibson et al. (2023), and they suggest that individuals can differ dramatically in how much agency they feel in response to standard manipulations of top-down information in the spatial cueing paradigm, even when that information is conveyed by arbitrary number cues.
In contrast, Figure 6B shows agency ratings plotted separately for those individuals who generated negatively sloped growth curves vs. those who generated positively sloped growth curves in the direction selected condition. Unlike in the direction assigned condition, both groups reported high levels of agency in response to the 1.00-bit (100%-valid) cues in the direction selected condition. However, those individuals who generated negatively sloped growth curves tended to report the lowest ratings in response to the 3.00-bit (25%-valid) cues; whereas those individuals who generated positively sloped growth curves tended to report slightly higher ratings in response to the 3.00-bit (25%-valid) cues than in response to the 1.00-bit (100%-valid) cues. Thus, the findings obtained in the direction selected condition are important because they suggest that top-down attention control can be brought into greater alignment with voluntary attention control when standard manipulations of top-down information are combined with novel manipulations of volition.
In the present study, volition and corresponding feelings of agency were manipulated by allowing participants to change the direction of the number cue on each trial. Of course, by relinquishing the choice of cue direction to the participants, the experimenter has conceded loss of experimental control over cued direction; consequently, some directions might have been cued more than others. However, somewhat surprisingly, our analysis of how participants distributed their choices over the four directions suggested that the vast majority (85%) of participants continued to distribute their choices more or less equally across the four directions even when they made a voluntary choice on most trials (see Figures 7–9). Thus, the significant gain in voluntary attention control that was observed in the direction selected condition appears to come with relatively little cost to experimental control (though see the discussion on selection history below).
The present study has focused on the extent to which self-reported ratings of agency can be influenced by combining the standard manipulation of top-down information with a novel manipulation of volition. As has been discussed, the present study has found that the proportion of negatively sloped growth curves can be increased when participants are allowed to freely choose (or not) the direction of the spatial cue (i.e., the direction selected condition) relative to the standard paradigm in which participants are only given top-down information without the option of controlling the direction of the spatial cue (i.e., the direction assigned condition). One issue that has not been addressed in the present study concerns the extent to which other manipulations of volition might decrease the proportion of negatively sloped growth curves when combined with top-down information relative to the standard paradigm. Although Gibson et al. (2023) noted that those individuals who generated positively sloped growth curves in the standard paradigm might have been reacting to the extrinsic nature of the spatial cues, this interpretation was only adopted by approximately 40% of the participants. One manipulation of volition that might emphasize the lack of intrinsic control more strongly is to provide participants with a direction selection display at the start of each trial, but unlike the direction selected condition in the present study, this volition manipulation would require participants to change the direction of the cue in compliance with an externally controlled instruction (see e.g., Experiment 3 in Huffman and Brockmole, 2020). Demonstrating the ability to increase as well as decrease the sense of agency in this task would strengthen our understanding of voluntary attention control in this task.
Existing theories of attention control have typically assumed that top-down and voluntary forms of attention control are largely synonymous, and they have not considered the possibility that voluntary control processes might have consequences for behavior that are distinct from top-down control processes. We believe that such consequences could be explored by examining the relation between agency ratings and performance measures such as RT. Notice that in such an analysis agency has gone from being an outcome variable (as in the present study) to being a predictor variable. In addition, agency would be a “time-varying” predictor variable because each participant has contributed four agency ratings—one rating after each of four blocks—for each of the three levels of conditional target entropy. As discussed below, each individual's average agency rating, as well as the block-by-block fluctuations around this average, can be useful for predicting different aspects of the RT effect.
In one preliminary analysis, Gibson et al. (2023) showed that the agency growth curves were not significantly related to the corresponding RT growth curves across individuals. However, there are other, potentially more sensitive analytical techniques that might be better able to reveal the nature of this relation. We have decided to treat this issue in a separate article because we believe that successful adjudication of this issue will require the introduction of analytical techniques, such as those that enable the disaggregation of between-person (BP) and within-person (WP) effects (Curran and Bauer, 2011; Wang and Maxwell, 2015), that are well established in developmental psychology, but which are still unfamiliar to those researchers working in the cognitive sciences (Note: BP and WP effects should not be confused with between-subjects and within-subjects experimental designs).
The distinction between BP and WP effects reflects a potentially important distinction because these effects often vary not only in magnitude, but also in direction. In fact, these two effects have been shown to be equivalent only under very restricted conditions that are rarely met in psychology (Molenaar, 2004; Molenaar and Campbell, 2009). Moreover, both of these BP and WP effects could be different from group-level effects. Indeed, group-level RTs in the direction selected condition were found to be significantly slower than group-level RTs in the direction assigned condition (see Figure 2), suggesting that increases in agency might slow RTs. However, contrary to this conclusion, it is likely that increases in agency would actually result in faster RTs.
For example, consider the 1.00-bit (100%-valid) cue condition. In general, BP effects would reflect the extent to which persons who report higher average agency ratings in this conditional target entropy condition also have faster RTs than persons who report lower average agency ratings; whereas WP effects would reflect the extent to which any given person has faster RTs when they report higher levels of agency than when they report lower levels of agency. Moreover, we also expect greater alignment between top-down information and the sense of agency to have a greater influence on BP effects than on WP effects. That is, when top-down information is aligned with the sense of agency (as in the direction selected condition), then most participants will also report their strongest sense of agency in the 1.00-bit (100%-valid) cue condition. However, when top-down information is not aligned with the sense of agency (as in the direction assigned condition), then only approximately half the participants will report their strongest sense of agency in this condition whereas the other half will report their weakest sense of agency in this condition. Thus, although participants in the direction selected condition might have overall slower RTs than participants in the direction assigned condition, we expect larger decreases in RT as a function of increasing average agency ratings in the direction selected condition than in the direction assigned condition as a result of this greater between person alignment. In contrast, because WP effects are relative to fluctuations in agency around each individual's average rating, such effects may not vary across the two volition conditions.
The extent to which voluntary attention control processes might have unique effects on performance will require isolating this form of control from other forms of control such as top-down and experience-dependent attention control processes. Fortunately, isolating voluntary attention control from top-down attention control can be easily accomplished by examining the BP and WP effects of agency across the two volition conditions for each level of conditional target entropy (cue validity) separately. As such, any observed BP and/or WP effects could be uniquely attributed to voluntary attention control processes because the amount of top-down attention control would be equated across the two volition conditions.
In addition, isolating voluntary attention control processes from experience-dependent attention control processes should also be easily accomplished so long as selection-based experiences can be equated across the two volition conditions. For instance, one type of selection-based experience that is known to “prime” or speed RTs in various attention tasks is the repetition of target location on successive trials (for reviews, see Awh et al., 2012; Anderson et al., 2021). As was noted above, a small number of individuals (N = 12) in the direction selected condition did tend to choose the same cued direction across trials, which could facilitate the selection of information from that location and thus lead to faster RTs for these individuals. Indeed, a preliminary analysis indicated that overall mean correct RTs were approximately 120 ms faster for those 12 individuals in the direction selected condition who tended to choose the same cued direction across trials relative to the majority of participants who tended to distribute cued direction (either by choice or by default) across the four directions more equally, though it should be noted that this RT difference did not attain significance (p = 0.19) in the present study. Thus, examination of the BP and WP effects of agency on RTs must be confined to trials in which the location of the target is not repeated on successive trials to ensure that those effects are distinct from experience-based control processes. In addition, the design of the direction selection condition could also be easily modified to prohibit participants from choosing the same cued direction on successive trials.
In conclusion, previous research reported by Gibson et al. (2023) has suggested that top-down and voluntary attention control are aligned for only about half of the participants in the standard spatial cueing paradigm. The present study replicated the previous findings reported by Gibson et al. (2023) under conditions in which the standard manipulation of top-down information was conveyed by a number cue (as opposed to an arrow or onset cue). But more importantly, the present study also showed that the proportion of individuals who aligned top-down and voluntary attention control could be increased (up to approximately 90%) by combining the standard manipulation of top-down information with a novel manipulation of volition in a separate condition in which participants were given the opportunity to freely choose (or not) the direction of the spatial cue on each trial. Moreover, despite conceding control of cued direction (but not cue validity) to participants in this latter condition, most participants (85%) nevertheless distributed their direction choices equally across the four directions. These findings suggest that providing participants active control of stimulus parameters may be required to elicit a strong sense of agency (and voluntary control) in the laboratory.
The datasets presented in this study can be found in online repositories. The names of the repository/repositories and accession number(s) can be found below: https://osf.io/rvd32/.
The studies involving human participants were reviewed and approved by University of Notre Dame Institutional Review Board. The patients/participants provided their written informed consent to participate in this study.
BG conceived of and designed the study, performed the statistical analyses, interpreted the data, and wrote the manuscript. JT wrote the experimental software, acquired and organized the database, and read and approved of the submitted manuscript. SM contributed to the conception and interpretation of the statistical analyses, including how to communicate the relation between newer and older forms of statistical analyses. All authors made substantial contributions to the conception or design of the work, or the acquisition, analysis, or interpretation of data for the work, drafting the work or revising it critically for important intellectual content, provide approval for publication of the content, and agree to be accountable for all aspects of the work in ensuring that questions related to the accuracy or integrity of any part of the work are appropriately investigated and resolved.
The authors declare that the research was conducted in the absence of any commercial or financial relationships that could be construed as a potential conflict of interest.
All claims expressed in this article are solely those of the authors and do not necessarily represent those of their affiliated organizations, or those of the publisher, the editors and the reviewers. Any product that may be evaluated in this article, or claim that may be made by its manufacturer, is not guaranteed or endorsed by the publisher.
Anderson, B. A., Kim, H., Kim, A. J., Liao, M. R., Mrkonja, L., Clement, A., et al. (2021). The past, present, and future of selection history. Neurosci. Biobehav. Rev. 130, 326–350. doi: 10.1016/j.neubiorev.2021.09.004
Awh, E., Belopolsky, A., and Theeuwes, J. (2012). Top-down versus bottom-up attentional control: a failed theoretical dichotomy. Trends Cogn. Sci. 16, 437–443. doi: 10.1016/j.tics.2012.06.010
Bargh, J. A. (1994). “The four horsemen of automaticity: Awareness, efficiency, intention, and control in social cognition,” in Handbook of social cognition, eds. R. S. Wyer Jr. and T. K. Srull (Hillsdale, NJ: Erlbaum) 1–40.
Bargh, J. A., and Ferguson, M. J. (2000). Beyond behaviorism: On the automaticity of higher mental processes. Psychol. Bull. 126, 925–945. doi: 10.1037/0033-2909.126.6.925
Barr, D. J., Levy, R., Scheepers, C., and Tily, H. J. (2013). Random effects structure of confirmatory hypothesis testing: Keep it maximal. J. Memory Lang. 68, 255–278. doi: 10.1016/j.jml.2012.11.001
Chica, A. B., Martín-Arévalo, E., Botta, F., and Lupiáñez, J. (2014). The spatial orienting paradigm: How to design and interpret spatial attention experiments. Neurosci. Biobehav. Rev. 40, 35–51. doi: 10.1016/j.neubiorev.2014.01.002
Craig, A. D. (2015). How do you Feel? An Interoceptive Moment with Your Neurobiological Self. Princeton, NJ: Princeton University Press. doi: 10.1515/9781400852727
Curran, P. J., and Bauer, D. J. (2011). The disaggregation of within-person and between-person effects in longitudinal models of change. Ann. Rev. Psychol. 62, 583–619. doi: 10.1146/annurev.psych.093008.100356
Davis, G. J., and Gibson, B. S. (2012). Going rogue in the spatial cuing paradigm: High spatial validity is insufficient to elicit voluntary shifts of attention. J. Exper. Psychol. 38, 1192–1201. doi: 10.1037/a0027595
Eriksen, C. W., and Yeh, Y.-Y. (1985). Allocation of attention in the visual field. J. Exper. Psychol. 11, 583–597. doi: 10.1037/0096-1523.11.5.583
Firth, C. (2013). The psychology of volition. Exper. Brain Res. 229, 289–299. doi: 10.1007/s00221-013-3407-6
Gaspelin, N., and Luck, S. J. (2018). “Top-down” does not mean “voluntary.” J. Cogn. 1, 1–4. doi: 10.5334/joc.28
Gibson, B. S., and Bryant, T. A. (2005). Variation in cue duration reveals top-down modulation of involuntary orienting to uninformative symbolic cues. Percept. Psychophys. 67, 749–758. doi: 10.3758/BF03193530
Gibson, B. S., and Kingstone, A. F. (2006). Visual attention and the semantics of space: Beyond central and peripheral cues. Psychol. Sci. 17, 622–627. doi: 10.1111/j.1467-9280.2006.01754.x
Gibson, B. S., Pauszek, J. R., Trost, J. M., and Wenger, M. J. (2021). The misrepresentation of spatial uncertainty in visual search: Single- vs. joint-distribution probability cues. Attent. Percept. Psychophys. 83, 603–623. doi: 10.3758/s13414-020-02145-5
Gibson, B. S., Trost, J. M., and Maxwell, S. E. (2023). Top-down attention control does not imply voluntary attention control for all individuals. J. Exper. Psychol. 49, 87–107. doi: 10.1037/xhp0001068
Hommel, B., Pratt, J., Colzato, L., and Godijn, R. (2001). Symbolic control of visual attention. Psychological Science 12, 360–365. doi: 10.1111/1467-9280.00367
Huffman, G., and Brockmole, J. R. (2020). Attentional selection is biased towards controllable stimuli. Attent. Percept. Psychophys. 82, 2558–2569. doi: 10.3758/s13414-020-02004-3
Jonides, J. (1980). Towards a model of the mind's eye's movement. Canad. J. Psychol. 34, 103–112. doi: 10.1037/h0081031
Jonides, J. (1983). Further toward a model of the mind's eye's movement. Bull. Psychon. Soc. 21, 247–250. doi: 10.3758/BF03334699
Kliegl, R., Wei, P., Dambacher, M., Yan, M., and Zhou, X. (2011). Experimental effects and individual differences in linear mixed models: Estimating the relationship between spatial, object, and attraction effects in visual attention. Front. Psychol. 1, 238. doi: 10.3389/fpsyg.2010.00238
Madden, D. J. (1992). Selective attention and visual search: Revision of an allocation model and application to age differences. J. Exper. Psychol. 18, 821–836. doi: 10.1037/0096-1523.18.3.821
Matuschek, H., Kliegl, R., Vasishth, S., Baaven, H., and Bates, D. (2017). Balancing type I error and power in linear mixed models. J. Memory Lang. 94, 305–315. doi: 10.1016/j.jml.2017.01.001
Maxwell, S. E., Delaney, H. D., and Kelley, K. (2018). Designing Experiments and Analyzing Data: A Model Comparison Perspective (3rd Edition). New York, NY: Routledge Taylor and Francis Group. doi: 10.4324/9781315642956
Miller, J., and Schwarz, W. (2018). Implications of individual differences in on-average null effects. J. Exper. Psychol. 147, 377–397. doi: 10.1037/xge0000367
Molenaar, P. C. M. (2004). A manifesto on psychology as idiographic science: Bringing the person back into scientific psychology, this time forever. Measurement 2, 201–218. doi: 10.1207/s15366359mea0204_1
Molenaar, P. C. M., and Campbell, C. G. (2009). The new person-specific paradigm in psychology. Curr. Direct. Psychol. Sci. 18, 112–117. doi: 10.1111/j.1467-8721.2009.01619.x
Oberaurer, K. (2022). The importance of random slopes in mixed models for Bayesian hypothesis testing. Psychol. Sci. 33, 648–665. doi: 10.1177/09567976211046884
Pauszek, J. R., and Gibson, B. S. (2016). High spatial validity is not sufficient to elicit voluntary shifts of attention. Attent. Percept. Psychophys. 78, 2110–2123. doi: 10.3758/s13414-016-1097-4
Pauszek, J. R., and Gibson, B. S. (2018). The least costs hypothesis: A rational analysis approach to the voluntary symbolic control of attention. J. Exper. Psychol. 44, 1199–1215. doi: 10.1037/xhp0000527
Peirce, J., Gray, J. R., Simpson, S., MacAskill, M., Höchenberger, R., Sogo, H., et al. (2019). PsychoPy2: Experiments in behavior made easy. Behav. Res. Methods 51, 195–203. doi: 10.3758/s13428-018-01193-y
Posner, M. I. (1980). Orienting of attention. Quart. J. Exper. Psychol. 32, 3–25. doi: 10.1080/00335558008248231
Posner, M. I., Snyder, C. R., and Davidson, B. J. (1980). Attention and the detection of signals. J. Exper. Psychol. 109, 160–174. doi: 10.1037/0096-3445.109.2.160
Potts, C. A., and Carlson, R. A. (2019). Control used and control felt: Two sides of the agency coin. Attent. Percept. Psychophys. 81, 2304–2319. doi: 10.3758/s13414-019-01771-y
Riggio, L., and Kirsner, K. (1997). The relationship between central cues and peripheral cues in covert visual orientation. Percept. Psychophys. 59, 885–899. doi: 10.3758/BF03205506
Ristic, J., and Kingstone, A. (2012). Automated symbolic orienting: A unique form of human spatial attention. Visual Cognition. 20, 244–264.
Ristic, J., Landry, M., and Kingstone, A. (2012). Automated symbolic orienting: The missing link. Front. Psychol. 3, 1–7.
Singer, J. D., and Willett, J. B. (2003). Applied Longitudinal Data Analysis: Modeling Change and Event Occurrence. New York: Oxford University Press. doi: 10.1093/acprof:oso/9780195152968.001.0001
Synofzik, M., Vosgerau, G., and Voss, M. (2013). The experience of agency: An interplay between prediction and postdiction. Front. Psychol. 4, 127. doi: 10.3389/fpsyg.2013.00127
Tapal, A., Oren, E., Dar, R., and Eitam, B. (2017). The sense of agency scale: A measure of consciously perceived control over one's mind, body, and the immediate environment. Front. Psychol. 8, 1–11. doi: 10.3389/fpsyg.2017.01552
Theeuwes, J. (2018). Visual selection: Usually fast and automatic; seldom slow and volitional. J. Cognition 1, 1–15. doi: 10.5334/joc.13
Verbeke, G., and Molenberghs, G. (1997). “Case studies,” in Linear mixed models in practice: A SAS-oriented approach, eds. G. Verebeke and G. Molenberghs (New York: Springer) 155–189. doi: 10.1007/978-1-4612-2294-1
Vossel, S., Thiel, C. M., and Fink, G. R. (2006). Cue validity modulates the neural correlates of covert endogenous orienting of attention in parietal and frontal cortex. Neuroimage 32, 1257–1264. doi: 10.1016/j.neuroimage.2006.05.019
Wang, L. P., and Maxwell, S. E. (2015). On disaggregating between-person and within-person effects with longitudinal data using multilevel model. Psycholo meth, 20, 63.
Wegner, D. M., Gilbert, D., and Wheatley, T. (2017). The Illusion of Conscious Will. Second edition. Cambridge, MA: The MIT Press. doi: 10.7551/mitpress/11151.001.0001
Wen, W., and Haggard, P. (2018). Control changes the way we look at the world. J. Cogn. Neurosci. 30, 603–619. doi: 10.1162/jocn_a_01226
Wolfe, J. M. (2018). Everything is foreseen, yet free will is given (Mishna Avot 3:15). J. Cogn. 1, 1–3. doi: 10.5334/joc.27
Keywords: visual search, top-down attention control, voluntary attention control, agency, individual differences, agency during visual search
Citation: Gibson BS, Trost JM and Maxwell SE (2023) Aligning top-down and voluntary attention control across individuals. Front. Cognit. 2:1203435. doi: 10.3389/fcogn.2023.1203435
Received: 10 April 2023; Accepted: 15 June 2023;
Published: 07 July 2023.
Edited by:
Juan Lupiáñez, University of Granada, SpainReviewed by:
Anna Marzecová, Heinrich Heine University of Düsseldorf, GermanyCopyright © 2023 Gibson, Trost and Maxwell. This is an open-access article distributed under the terms of the Creative Commons Attribution License (CC BY). The use, distribution or reproduction in other forums is permitted, provided the original author(s) and the copyright owner(s) are credited and that the original publication in this journal is cited, in accordance with accepted academic practice. No use, distribution or reproduction is permitted which does not comply with these terms.
*Correspondence: Bradley S. Gibson, YmdpYnNvbkBuZC5lZHU=
Disclaimer: All claims expressed in this article are solely those of the authors and do not necessarily represent those of their affiliated organizations, or those of the publisher, the editors and the reviewers. Any product that may be evaluated in this article or claim that may be made by its manufacturer is not guaranteed or endorsed by the publisher.
Research integrity at Frontiers
Learn more about the work of our research integrity team to safeguard the quality of each article we publish.