- Korea University of Technology and Education, Cheonan, Republic of Korea
The interdependence of adhesion, friction, and elasticity of elastomers is relevant for various engineering applications. However, its investigation has been limited to smooth glass surfaces. We apply atomic force microscopy (AFM)-based methods to quantify PDMS’s elastic and tribological properties in single asperity contacts (quasi-static and sliding) with a nanometer-scale SiOx asperity under dry conditions. The selected experimental approach allows us to model the contact initiation with PDMS and its degradation. Combining quasi-static and reciprocal sliding experiments, we identify several contributions to adhesion and friction: junction formation, elastic deformation, rupture, and adhesive material transfer. Furthermore, we find correlations between the elastic deformation of PDMS/SiO2 junctions and their adhesion hysteresis on the one hand and the shear strength and the work of adhesion on the other.
Introduction
The phenomena of adhesion and friction, which have been the object of intensive research in the past century, are not just theoretical concepts. They are crucial in the design and operation of mechanical systems involving moving parts, such as in the fields of manufacturing and mobility, and more recently in the field of nano-/microelectromechanical systems (N/MEMS). Our research on the importance of interfacial phenomena becomes more crucial as the surface-to-volume ratio of such devices and systems increases, and it has practical implications for improving the performance and durability of these systems. Adhesion, friction, and the usually ensuing wear have been investigated in various environments, vacuum, vapors, and liquids, and across length scales for a wide range of contacting materials ranging from metals, ionically and covalently bounded solids, as well as polymers and elastomers (Bowden and Tabor, 1950; Rabinowicz, 1985; Israelachvili, 2011; Zeng and Zeng, 2013; Gnecco and Meyer, 2015).
The understanding of adhesion, friction, and wear of stiff materials has benefited from a larger body of knowledge of their structural, thermodynamic, and mechanical properties. For metals, for example, it is accepted that adhesion and friction phenomena arise from forming cold-welded junctions at their surface asperities and from their mechanical strength. During adhesion, a junction is loaded along the normal direction to its interface, while during sliding friction, a junction is loaded along the transversal direction to the same interface. In Ref. (McFarlane and Tabor, 1950), McFarlane and Tabor demonstrated a direct correlation between the friction coefficient and the adhesion coefficient for the case of steel on indium. The interrelation of adhesion and friction between metals can be schematically explained based on increased interatomic potential energy upon loading a junction since it results in the stretching of interatomic bonds (Landheer and de Gee, 1991). In the case of adhesion, the potential energy per unit area continues to increase until it is enough to overcome the formation of two new free surfaces. This critical amount of potential energy per unit area is equivalent to the work of adhesion,
Elastomers stand out from metals and other stiff materials due to their high compliance or low modulus of elasticity, large elastic strain, and stickiness. The molecular structure of an elastomer can be visualized as an amorphous arrangement of random macromolecular coils cross-linked by randomly distributed molecular segments. The characteristic mechanical behavior of elastomers arises from their cooperative structural reconfiguration upon application of stresses. This reorganization or motion of molecular segments requires a free volume into which segments can move and may require time. The time required for such a structural reorganization vanishes at temperatures well above the glass transition temperature. Then, upon applying stress, macromolecular coils reconfigure by cooperative pairs of bond rotations to align themselves along the stress direction. Thereby, translational motion is hindered by the cross-links. Owing to their large density of cross-links, the deformation of elastomers is reversible. However, their strain-stress curves exhibit a hysteretic behavior (Shanks et al., 2013). Polydimethylsiloxane (PDMS) is a widely used silicon-based organic elastomer. Owing to its ability to be molded and to replicate structures down to the nanometer scale, PDMS has found applications in the process of soft lithography as material for microfluidic or lab-on-chip devices, in the field of biomedicine and cosmetics, or as a protective coating material for electrodes, MEMS, electrical and optical parts (See Refs (Lee et al., 2008; Chen et al., 2013; Lee et al., 2007; Schneider et al., 2009; Penskiy et al., 2011; Camou et al., 2003; Hassler et al., 2011; Wang et al., 2018)). PDMS has also been used for sealants and packaging or to manufacture dry adhesive hierarchical structures, such as brushes or gecko-inspired structures (Landherr et al., 2011; Yu et al., 2012; Klittich et al., 2017; Lee et al., 2018; Xue et al., 2017); for several of these applications, elasticity, adhesion, and friction of PDMS are crucial.
Unlike metallic surfaces, the interfacial forces with polymer surfaces are of van der Waals’ nature, and their character does not depend on whether two polymer surfaces are approached toward each other or whether the formed interface is being pulled out. Their surface energy and adhesion force can be deduced from the separation-dependent magnitude of the attractive van der Waals force (Briscoe and Tabor, 1972). The adhesion force at play is often large enough to induce material transfer from one polymer surface to another.
The adhesion and friction of smooth rubber surfaces in contact with glass or steel counter bodies have been investigated for various loading scenarios in Ref. (Roberts and Thomas, 1975). Emphasis was paid to adhesion hysteresis, how it is affected by the time of contact, and its contribution to friction. By monitoring the time evolution of the contact radius between a rubber hemisphere and a glass coverslip with negligible weight, the authors determined the time evolution of the apparent surface energy by applying the JKR model for the case of zero applied load on the contact (Briscoe and Tabor, 1972). Thereby, the authors distinguished two scenarios: in one case, overloading, the coverslip had been pressed under the action of a weight several orders of magnitudes larger than itself onto a rubber hemisphere. The contact area decreased with time, and correspondingly, the apparent surface energy decreased towards its equilibrium value. In the opposite case of underloading, the glass and rubber surfaces were brought together until they just touched each other; the contact radius and corresponding surface energy were then observed to increase toward an equilibrium value. This difference between the contact areas under overloading and underloading conditions thus gives rise to an adhesion hysteresis. This hysteretic behavior is reflected in the velocity dependence of the friction of rubber, where leading and trail edges form out-of-equilibrium interfaces that correspond to the underloading and overloading conditions, respectively.
The tribological properties of PDMS have been investigated under different lubricated conditions. The friction coefficient of a PDMS/PDMS sliding contact strongly depends on the sliding velocity and the lubricant viscosity (Bongaerts et al., 2007). In Ref. (He et al., 2008), the dry macroscale friction coefficient of PDMS vs steel was found to be significantly affected by micro-texturing the surface of PDMS. In contrast, micro-friction measurements indicated a vanishing effect when the counter-sliding body becomes smaller than the length scale of the surface texture. The texture effect was thus attributed to the reduced contact area for textured surfaces. Generally, the dry friction of PDMS has been reported to follow the Johnson-Kendall-Roberts adhesive contact mechanical model for elastic solids (See Refs (Johnson et al., 1971)). This highlights the intertwined character of adhesion and friction of PDMS. Also, in line with this, the friction and adhesion of PDMS surfaces have been altered by surface modifications, highlighting the role of surface and interfacial energies (Chaudhury and Owen, 1993). Moreover, the elastic deformation of PDMS plays a non-negligible role in the rupture of adhesive PDMS junctions. The relative sliding of macroscopic interfaces with elastomers has been observed to proceed by waves of detachment across the contact area, referred to as Schallamach waves. The nucleation of such waves and their propagation across the interface between PDMS and a glass surface has been experimentally investigated in Refs. (Viswanathan et al., 2015; Zhibo et al., 2021). The authors identified elastic instabilities, e.g., wrinkles, immediately after an initial detachment event that corresponds to the nucleation of a single detachment wave, the critical force associated with it being dependent on the work of adhesion. Upon further sliding, the surfaces adhere anew ahead of the glass counter body, initiating the propagation of a Schallamach wave across the contact area. It is worth noting that the wavelength and amplitude of the wrinkles increase with the tangential force. Thereby, the initial wavelength of the wrinkle pattern can be determined from the elastic properties of PDMS. Furthermore, their relative angle to the sliding direction and the generation frequency of Schallamach waves increases with the sliding velocity. The wavelength of a Schallamach wave is typically in the order of magnitude of several hundreds of micrometers, and its propagation velocity is about 100 mm/s, regardless of the sliding velocity. There is, however, a critical sliding velocity for the generation of Schallamach waves that, under their experimental conditions, was reported by the authors in Ref (Viswanathan et al., 2015). to be
Thus, elastomer adhesion, friction, and elasticity are interdependent. The observations referred to above were limited to optically smooth surfaces. However, engineering surfaces have some roughness due to their manufacturing process, and their contact is initiated at asperities with typical dimensions in the nanometer range. Recently, the authors investigated the reciprocal sliding contact of a single asperity of SiOx with a PDMS surface by atomic force microscopy (AFM) (Caron, 2023). There, we distinguished between two frictional regimes concerning the applied normal force. We observed that friction increases linearly with the normal force in the range of attractive forces. In contrast, in the range of repulsive forces, friction follows a
In this work, we use atomic force microscopy (AFM)-based methods to extend our observations to the measurements of PDMS’ elastic and adhesive performances in single asperity contacts with a nanometer-scale SiOx asperity under dry conditions. The selected experimental approach allows us to model the contact initiation and degradation between PDMS and an oxidized silicon surface. Such a modeled system is particularly relevant for MEMS applications relying on both materials investigated in this work. Combining quasi-static and reciprocal sliding experiments, we identify several correlations between the elasticity of PDMS, its apparent adhesion, and friction with a nanoscopic single asperity of SiO2.
Materials preparation and characterization
We prepared a PDMS sample with a two-part liquid component kit (Sylgard 184 silicone elastomer manufactured and distributed by Dow Corning, United States). We ensured a precise ratio of 10:1 for the pre-polymer base and cross-linking curing agent. The mixture was then poured into a flask dish and cured for 30 min at 120°C. The results presented in this work were all obtained by AFM measurements of the airside of the PDMS sample. Before atomic force spectroscopy and friction force microscopy measurements, we conducted a thorough characterization of the surface morphology of the as-prepared sample by tapping mode (TM)-AFM using a stiff single-crystalline Si-cantilever (type NCHR, manufactured by NanoSensors, Switzerland).
Figure 1 showcases TM-AFM topography images of the PDMS sample recorded on scan areas of 2.5 μm × 2.5 μm and 1 μm × 1 μm and a typical height line profile indicating the position of topography peaks. The topography data in Figure 1 were summarized in one-dimensional height and peak-to-peak distance distributions (see Figure 2). We determined the roughness parameter Rq by fitting the height distribution with a Gaussian function and using the identity of the standard deviation with Rq. We found Rq ≈ 1 nm. Similarly, the distribution of lateral distances was fitted with a log-normal distribution to determine the mean lateral distance value,

Figure 1. TM-AFM topography images of PDMS recorded on scan areas of (A) 2.5 μm × 2.5 μm and (B) 1 μm × 1 μm and (C) a typical height line profile.
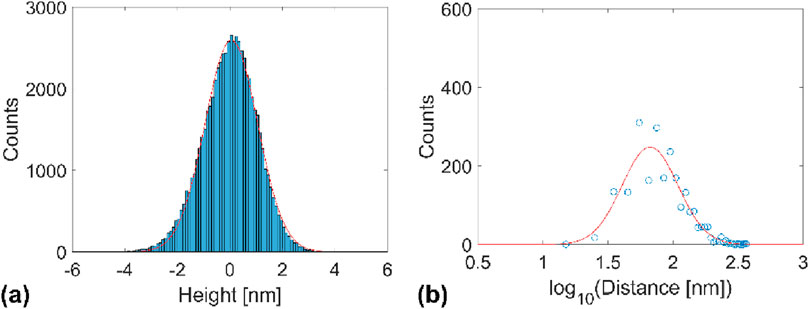
Figure 2. (A) One-dimensional height distribution and its Gaussian fit. (B) One-dimensional peak-to-peak distance distribution and its log-normal fit.
Experimental method
We conducted atomic force spectroscopy (AFS) and friction force microscopy (FFM) measurements in ambient conditions (T = 293 K, RH = 50%) with a Core AFM, using a soft single-crystalline silicon cantilever (type CONTR, manufactured by NanoSensors, Switzerland). Before AFS and FFM measurements, we analyzed the thermal noise of the cantilever to determine its bending stiffness Cn and the sensitivity of the position-sensitive photodiode (PSPD) of the AFM. Specifically, the bending stiffness was determined by Sader’s method (Sader et al., 1999), while we determined the PSPD sensitivity S using the equipartition theorem (Butt and Jaschke, 1995). The torsion stiffness of the cantilever was calculated according to
We characterized PDMS’s elastic and adhesive behavior by AFS measurements. AFS measurements consisted of recording the normal force upon approach and retraction of the cantilever toward the sample surface for eight different approach and retraction velocities between 0.2 μm/s and 40 μm/s. For each velocity, measurements were repeated 15 times at the same location. Figure 3 shows a typical AFM force-distance (Fn-Z) curve recorded on PDMS with a single crystalline silicon tip. To determine the contact’s reduced elastic modulus, the approach part of the displayed Fn-Z curve was converted into a δ-Fn curve by considering that once contact has been established, the z-piezo extension corresponds to the sum of the cantilever deflection and the tip penetration into the sample, i.e.,
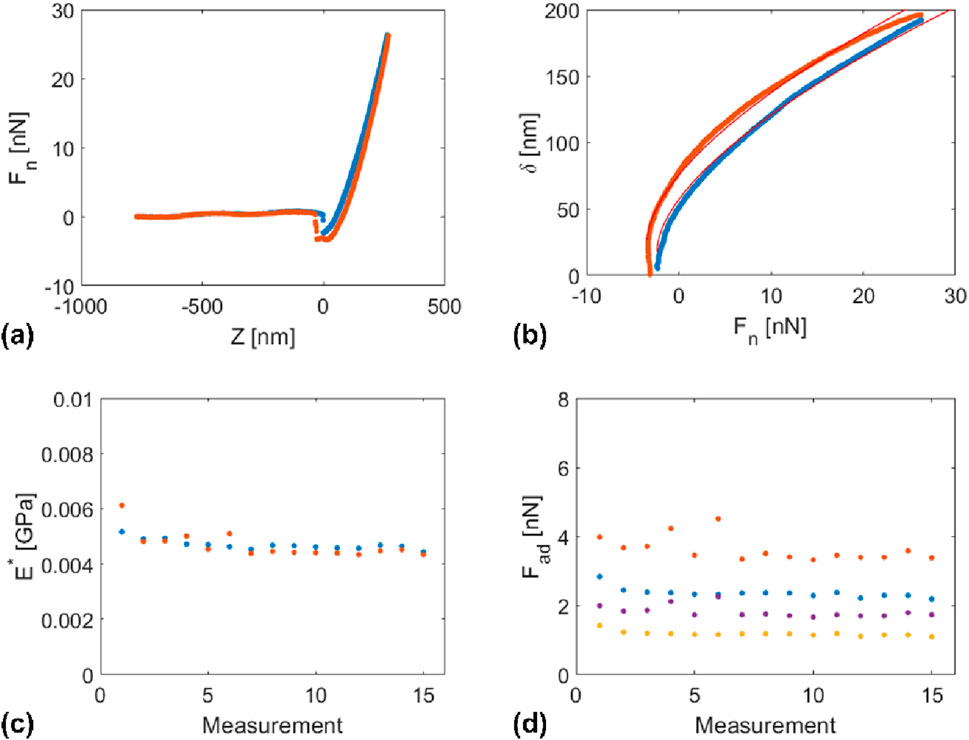
Figure 3. (A) Typical AFM force-distance (Fn-Z) curve recorded on PDMS, showing the approach part in blue (•) and the retraction part in orange (•). (B) Penetration-force (δ-Fn)-curves calculated from the approach and retraction parts of the experimental results in (A)) and fitting curve corresponding to the JKR model (red solid line). (C) Reduced elasticity modulus determined by fitting 15 δ-Fn (•) approach and (•) retraction curves with the JKR model, and (D) adhesion force evaluated from (•) the minimum force values of 15 Fn-Z approach curves (snap-in force), (•) the minimum force values of 15 Fn-Z retraction curves (snap-in force), (•) by fitting 15 approach δ-Fn curves with the JKR model, (•) by fitting 15 retraction δ-Fn curves with the JKR model.
Hertz’s theory of contact expresses the penetration depth in the case of an elastic sphere and contacting a half-infinite elastic solid by
Furthermore, we analyzed the friction behavior of PDMS during reciprocal sliding contact by FFM. Thereby, an AFM-tip was scanned on PDMS perpendicular to the length axis of the cantilever over a scanning area As = 10 × 10 μm2; the sliding velocity along the fast scanning distance was vs = 80 μm/s. Friction measurements were recorded over the same scanning area under increasing normal force values from Fn =
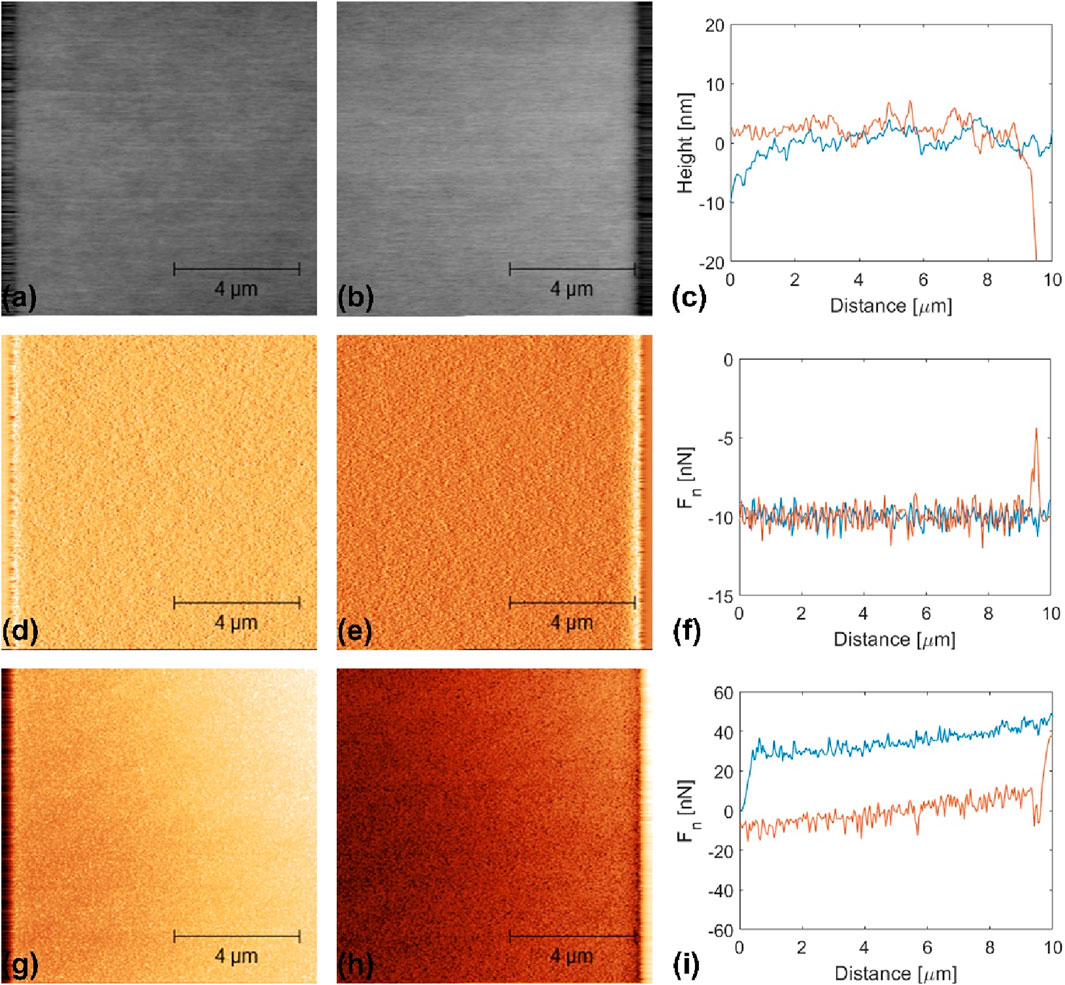
Figure 4. FFM results recorded on PDSM with Fn = −10 nN. (A–C) Height images recorded in (A) the forward and (B) backward scanning direction and (C) corresponding line profiles; (D–F) normal force recorded in (D) the forward and (E) backward scanning direction and (F) corresponding line profiles; (G–I) lateral force recorded in (G) the forward and (H) backward scanning direction and (I) corresponding line profiles. In (C–I), the line signals recorded in the forward scanning direction are plotted in blue, while those recorded in the backward scanning direction are plotted in orange.
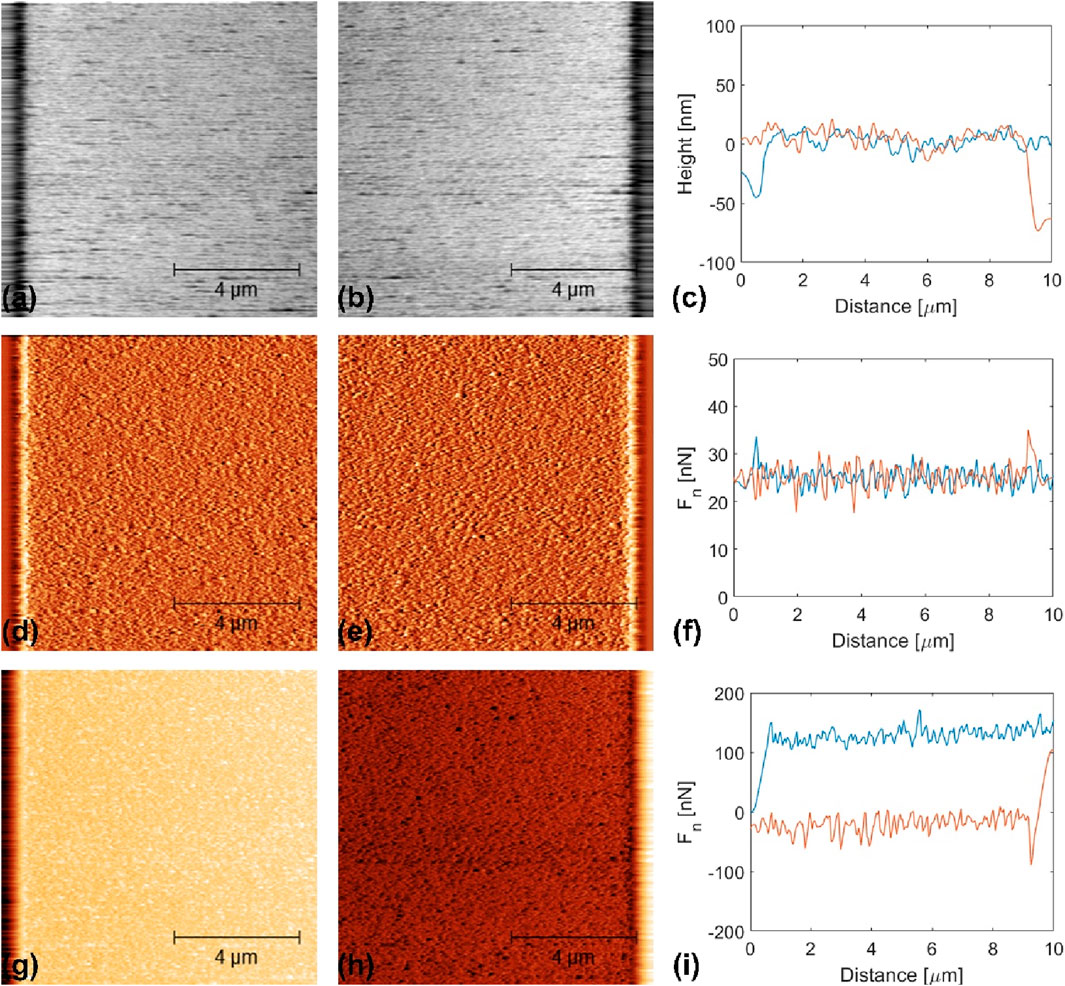
Figure 5. FFM results recorded on PDSM with Fn = 25 nN. (A–C) Height images recorded in (A) the forward and (B) backward scanning direction and (C) corresponding line profiles; (D–F) normal force recorded in (D) the forward and (E) backward scanning direction and (F) corresponding line profiles; (G–I) lateral force recorded in (G) the forward and (H) backward scanning direction and (I) corresponding line profiles. In (C–I), the line signals recorded in the forward scanning direction are plotted in blue, while those recorded in the backward scanning direction are plotted in orange.
We analyzed our experimental friction results, as showcased in Figures 4, 5, to determine the evolution of the interface roughness parameter Rq, the standard deviation of the normal force around its mean value
The topography images shown in Figure 1 significantly differ from those in Figures 4, 5. The images in Figure 1 were recorded by TM-AFM with a large set point amplitude value to minimize the kinetic energy of the tip in the vicinity of the PDMS surface and, hence, their mechanical interactions. The topography images in Figure 1 are representative of the free PDMS surface. In contrast, the images in Figures 4, 5 were recorded in contact with a SiOx tip and represent their interfacial interactions.
The images in Figures 4, 5 also differ from each other. The images shown in Figure 4 were recorded in the adhesive regime (Fn =
Results and discussion
Figure 6 displays the dependence of the snap-in and pull-off forces between a SiOx nano-asperity and PDMS on the approach and retraction velocity. In neither case do we observe a clear trend on the velocity of approach or retraction. However, the pull-out force values are slightly larger than the snap-in force values.
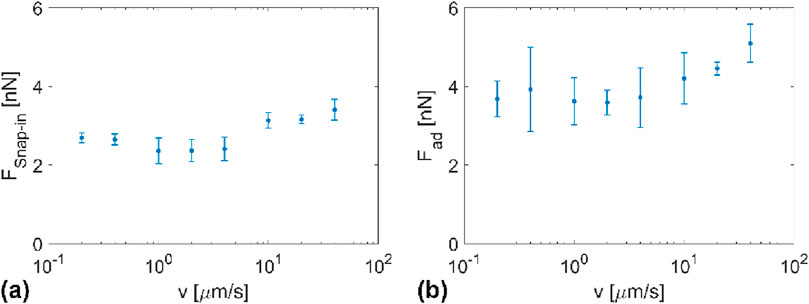
Figure 6. (A) Snap-in force and (B) pull-off force between a nanometer scale SiOx asperity and PDMS as a function of the approach or retraction velocity.
The pull-off force has been widely used to determine the interfacial energy between two contacting bodies (Dos Santos Ferreira et al., 2010). In the case of the JKR model for adhesive contact between elastic solids, the adhesion force or pull-off force, i.e., the force necessary to separate the two contacting bodies, relates to the work of adhesion
In principle, the snap-in and pull-off forces are equivalent. In practice, the snap-in event might be too fast to measure accurately. Also, the contact time (aging effects), the preloading force, or deformation effects can affect the pull-off force. In Ref. (Toikka et al., 2000), retracting a glass sphere from a PDMS surface was accompanied by pulling a PDMS neck until rupture. To avoid overestimating the work of adhesion under overloading conditions, we first estimate wa from the average snap-in force value and find, according to the JKR model, wa = 90 mJ/m2.
Furthermore, we suggest that the difference between snap-in and pull-off forces corresponds to the deformation of the neck. The difference between our experimental values for the pull-off and the snap-in forces is almost constant over the approach/retraction velocity domain used in this work: ΔFad = Fpull-off–Fsnap-in ≈ 1 nN. Applying Hooke’s law, ΔFad = kΔδ, where k is the stiffness of the junction and Δδ is the elongation of the neck, and assuming
In this work, we also evaluated the adhesion force and the elasticity modulus E* by fitting our experimental δ-Fn curves with a function from the JKR theory. We used both the approach and retraction parts of the curves (See section Experimental method and Figure 2). Figure 7 shows the velocity dependence of Fad and E* determined by fitting the approach and retraction parts of our penetration curves with the JKR model. As for the snap-in and pull-off forces, no clear dependence of the adhesion force on the velocity is observed in Figure 7. The adhesion force values determined from the approach parts of δ-Fn curves (
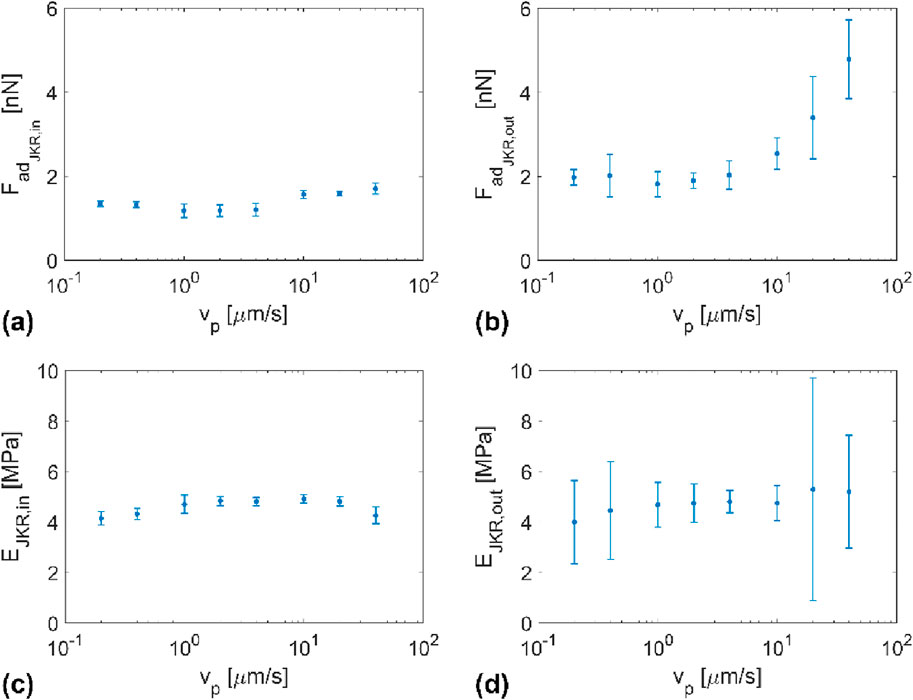
Figure 7. Velocity dependence of (A,B) the adhesion force and (C,D) the elasticity modulus of PDMS as determined by fitting the JKR model equation on experimental (δ-Fn) curves upon (A,C) approach and (B,D) retraction of the AFM tip.
The work of adhesion can be decomposed into the surface energies of both contacting materials and their interfacial energy, i.e.,
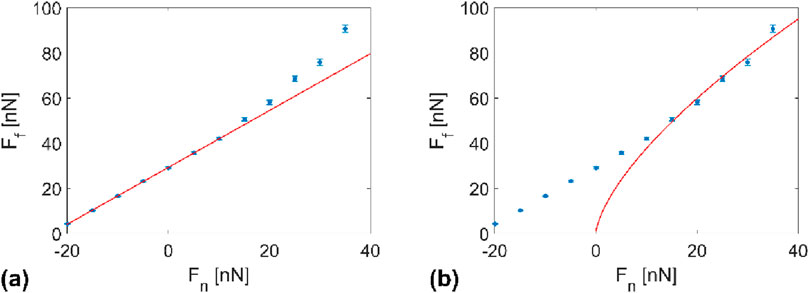
Figure 8 shows the normal force dependence of the friction force between PDMS and a nanometer scale SiO2 asperity. As in Ref. (Caron, 2023), one observes that in the domain of negative normal force values, the friction force increases linearly with the applied force, while in the domain of repulsive contact force values, the Ff-Fn plot is best fitted by a function of the form
It is important to note that the contact between the tip and sample surface was maintained for negative normal forces as low as
At a normal value of ∼10 nN, we observe a transition from a Fn-to a
Similar to the suggestion in Ref. (Yoshizawa et al., 1993), we equate the energy dissipated during the sliding of a SiO2 asperity on PDMS needs with the energy required to peel off the same asperity from PDMS:
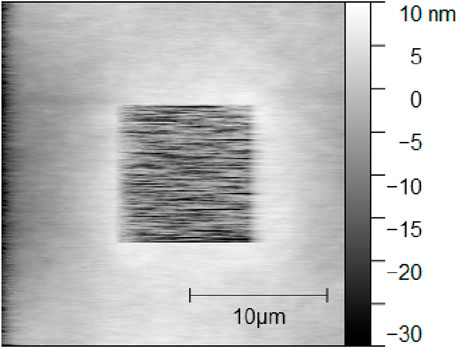
After friction experiments, we imaged the tested area (see Figure 9). As in Ref. (Caron, 2023), we observe material removal. It is worth noting that no pileup was observed around the scanned area. This indicates that wear occurred by adhesive transfer. In this work, though, we did not image the tip after the completion of our measurements. The depth of wear is δw = 16.8 nm, corresponding to a wear coefficient
Conclusion
PDMS’s friction and adhesion mechanisms are intertwined and are affected by the elastic deformation of PDMS junctions. In this work, we show that the difference between the pull-off force and snap-in force of a nanometer-scale asperity corresponds to elastic deformation. Stretching along the PDMS junction axis is rather limited. Under sliding conditions, contact is maintained far beyond the adhesion force, implying further stretching of the junction. In this regime of tensile loading, friction increases linearly with the normal force. In contrast, friction follows a shearing model in the regime of repulsive force and is accompanied by adhesive wear. In this case, calculating the shear strength from the work of adhesion results in a slight underestimation.
Data availability statement
The original contributions presented in the study are included in the article/supplementary material, further inquiries can be directed to the corresponding author.
Author contributions
WL: Formal Analysis, Investigation, Validation, Visualization, Writing–original draft, Writing–review and editing. JH: Data curation, Formal Analysis, Validation, Visualization, Writing–original draft, Writing–review and editing. JK: Formal Analysis, Investigation, Validation, Writing–original draft, Writing–review and editing. AC: Conceptualization, Methodology, Supervision, Visualization, Writing–original draft, Writing–review and editing.
Funding
The author(s) declare that no financial support was received for the research, authorship, and/or publication of this article.
Acknowledgments
The authors used the Grammarly software (www.grammarly.com) to verify the quality of the manuscript language.
Conflict of interest
The authors declare that the research was conducted in the absence of any commercial or financial relationships that could be construed as a potential conflict of interest.
Publisher’s note
All claims expressed in this article are solely those of the authors and do not necessarily represent those of their affiliated organizations, or those of the publisher, the editors and the reviewers. Any product that may be evaluated in this article, or claim that may be made by its manufacturer, is not guaranteed or endorsed by the publisher.
References
Anupama, S., Parameshwara, S., Prashanth, G. R., Renukappa, N. M., and Sundara Rajan, J. (2019). Study of surface energy of SiO2 and TiO2 on charge carrier mobility of rubrene organic field effect transistor. Proc. 3rd Intern. Conf. Theo. Appl. Nanosci. Nanotechnol. doi:10.11159/tann19.135
Bongaerts, J. H. H., Foutouni, K., and Stokes, J. R. (2007). Soft-tribology: lubrication in a compliant PDMS-PDMS contact. Tribo. Inter. 40, 1531–1542. doi:10.1016/j.triboint.2007.01.007
Bowden, F. P., and Tabor, D. (1950). The friction and lubrication of solids. Oxford, U.K: Clarendon Press.
Briscoe, B. J., and Tabor, D. (1972). Friction and adhesion. Surface forces in friction and adhesion. Faraday Spec. Discuss. Chem. Soc. 2 (7), 17. doi:10.1039/s19720200007
Butt, H. J., and Jaschke, M. (1995). Calculation of thermal noise in atomic force microscopy. Nanotechnology 6, 1–7. doi:10.1088/0957-4484/6/1/001
Camou, S., Fujita, H., and Fuji, T. (2003). PDSM 2D optical lens integrated microfluidic channels: principle and characterization. Lab. Chip 3, 40–45. doi:10.1039/B211280A
Caron, A. (2023). Deformation- and rupture-controlled friction between PDMS and a nanometer-scale SiOx single-asperity. Friction 11, 1755–1770. doi:10.1007/s40544-023-0742-1
Chaudhury, M. K., and Owen, M. J. (1993). Adhesion hysteresis and friction. Langmuir 9, 29–31. doi:10.1021/la00025a009
Chen, C. Y., Chang, C. L., Chien, T. F., and Luo, C. H. (2013). Flexible PDMS electrode for one-point wearable wireless bio-potential acquisition. Sensors Actuators A Phys. 203, 20–28. doi:10.1016/j.sna.2013.08.010
Derjaguin, B. V., Muller, V. M., and Toporov, Y. P. (1975). Effect of contact deformations on the adhesion of particles. J. Colloid Interface Sci. 53, 314–326. doi:10.1016/0021-9797(75)90018-1
Dos Santos Ferreira, O., Gelinck, E., de Graaf, D., and Fischer, H. (2010). Adhesion experiments using an AFM – parameters of influence. Appl. Surf. Sci. 257, 48–55. doi:10.1016/j.apsusc.2010.06.031
E. Gnecco, and E. Meyer (2015). Fundamentals of friction and wear on the nanoscale. second edition (Springer).
Greenwood, J. A. (1997). Adhesion of elastic spheres. Proc. R. Soc. Lond. A 453, 1277–1297. doi:10.1098/rspa.1997.0070
Hassler, C., Boretius, T., and Stieglitz, T. (2011). Polymers for neural implants. J. Polym. Sci. Part B Polym. Phys. 49, 18–33. doi:10.1002/polb.22169
He, G., Chen, W., and Wang, Q. J. (2008). Surface texture effect on friction of a microtextured poly(dimethylsiloxane) (PDMS). Tribo Lett. 31, 187–197. doi:10.1007/s11249-008-9351-0
Israelachvili, J. N. (2011). Intermolecular and surface forces. third edition. Burlington, Massachusetts, U.S.A.: Academic Press.
Johnson, K. L., Kendall, K., and Roberts, A. D. (1971). Surface energy and the contact of elastic solids. Proc. R. Soc. Lond. A 324, 301–313. doi:10.1098/rspa.1971.0141
Kim, Y. G., Lim, N., Kim, J., Kim, C., Lee, J., and Kwon, K.-H. (2019). Study on the surface energy characteristics of polydimethylsiloxane (PDMS) films modified by C4F8/O2/Ar plasma treatment. Appl. Surf. Sci. 477, 198–203. doi:10.1016/j.apsusc.2017.11.009
Klittich, M. R., Wilson, M. C., Bernard, C., Rodrigo, R. M., Keith, A. J., Niewiarowski, P. H., et al. (2017). Influence of substrate modulus on gecko adhesion. Sci. Rep. 7, 43647. doi:10.1038/srep43647
Landheer, D., and de Gee, A. W. J. (1991). Adhesion, friction, and wear. MRS Bull. 16, 36–40. doi:10.1557/s0883769400055810
Landherr, L. J. T., Cohen, C., Agarwal, P., and Archer, L. A. (2011). Interfacial friction and adhesion of polymer brushes. Langmuir 27, 9387–9395. doi:10.1021/la201396m
Lee, J., Park, S., Choi, K., and Kim, G. (2008). Nano-scale patterning using the roll-type UV-nanoimprint lithography tool. Microelectron. Eng. 85 (861), 865. doi:10.1016/j.mee.2007.12.059
Lee, J. H., Lee, H. S., Lee, B. K., Choi, W. S., Choi, H. Y., and Yoon, J. B. (2007). Simple liquid crystal display backlight unit comprising only a single-sheet micropatterned polydimethylsiloxane (PDMS) light-guide plate. Opt. Lett. 32, 2665–2667. doi:10.1364/ol.32.002665
Lee, S. H., Kim, S. W., Kang, B. S., Chang, P.-S., and Kwak, M. K. (2018). Scalable and continuous fabrication of bio-inspired dry adhesives with a thermosetting polymer. Soft Matter 14, 2586–2593. doi:10.1039/c7sm02354e
Lee, S.-J., Kim, G.-M., and Kim, C.-L. (2021). Effect of glass bubbles on friction and wear characteristics of PDMS-based composites. Coatings 11, 603. doi:10.3390/coatings11050603
Liu, J.-L., and Xia, R. (2013). A unified analysis of a micro-beam, droplet and CNT ring adhered on a substrate: calculation of variation with movable boundaries. Acta Mech. Sin. 29, 62–72. doi:10.1007/s10409-012-0202-8
McFarlane, J. S., and Tabor, D. (1950). Relation between friction and adhesion. Proc. R. Soc. Lond. A 202, 244–253. doi:10.1098/rspa.1950.0097
Nonnenmacher, M., Greschner, J., Wolter, O., and Kassing, R. (1991). Scanning force microscopy with micromachined silicon sensors. J. Vac. Sci. and Technol. B Microelectron. Nanom. Struct. Process. Meas. Phenom. 9, 1358–1362. doi:10.1116/1.585196
Penskiy, I., Gerratt, A., and Bergbreiter, S. (2011). Friction, adhesion and wear properties of PDMS films on silicon sidewalls. J. Micromech. Microeng. 21, 105013. doi:10.1088/0960-1317/21/10/105013
Rabinowicz, E. (1985). Friction and wear of materials. Hoboken, New Jersey, U.S.A.: John Wiley and Sons.
Roberts, A. D., and Thomas, A. G. (1975). The adhesion and friction of smooth rubber surfaces. Wear 33, 45–64. doi:10.1016/0043-1648(75)90223-9
Sader, J. E., Chon, J. W. M., and Mulvaney, P. (1999). Calibration of rectangular atomic force microscope cantilevers. Rev. Sci. Instrum. 70, 3967–3969. doi:10.1063/1.1150021
Schneider, F., Draheim, J., Kamberger, R., and Wallrabe, U. (2009). Process and material properties of polydimethylsiloxane (PDMS) for Optical MEMS. Sensors Actuators A Phys. 151, 95–99. doi:10.1016/j.sna.2009.01.026
Shanks, R. A., and Kongs, I. (2013). “General purpose elastomers: structure, chemistry, physics and performance,” in Advances in elastomers I, Advanced structured materials 11. Editor P. M. Visakh, (Berlin Heidelberg, Germany: Springer), 11–45.
Toikka, G., Spinks, G. M., and Brown, H. R. (2000). Interactions between micron-sized glass particles and poly(dimethylsiloxane) in the absence and presence of applied load. J. Adhesion 74, 317–340. doi:10.1080/00218460008034534
Viswanathan, K., Mahato, A., and Chandrasekar, S. (2015). Nucleation and propagation of solitary Schallamach waves. Phys. Rev. E 91, 012408–012410. doi:10.1103/physreve.91.012408
Wang, Y., Huang, Q., Zhu, W., Yang, M., and Lewis, E. (2018). Novel optical fiber SPR temperature sensor based on MMF-PCF-MMF structure and gold-PDMS film. Opt. Express 26, 1910–1917. doi:10.1364/oe.26.001910
Xue, L., Sanz, B., Luo, A., Turner, K. T., Wang, X., Tan, D., et al. (2017). Hybrid surface patterns mimicking the design of the adhesive toe pad of tree frog. ACS Nano 11, 9711–9719. doi:10.1021/acsnano.7b04994
Yoshizawa, H., Chen, Y. L., and Israelachvili, J. (1993). Fundamental mechanisms of interfacial friction. 1. Relation between adhesion and friction. J. Phys. Chem. 97, 4128–4140. doi:10.1021/j100118a033
Yu, J., Chary, S., Das, S., Tamelier, J., Turner, K. L., and Israelachvili, J. N. (2012). Friction and adhesion of gecko-inspired PDMS flaps on rough surfaces. Langmuir 28, 11527–11534. doi:10.1021/la301783q
Zeng, H. (2013). “Adhesion and friction mechanisms of polymer surfaces and thin films,” in Polymer adhesion, friction, and lubrication. Editor H. Zeng (Hoboken, New Jersey, U.S.A.: John Wiley and Sons), 391–442.
Keywords: PDMS, adhesion, friction, elasticity, AFM
Citation: Lee WJ, Ha JW, Kim JM and Caron A (2024) On the elasticity, adhesion, and friction of PDMS at the nanometer scale. Front. Coat. Dye In. 2:1428841. doi: 10.3389/frcdi.2024.1428841
Received: 07 May 2024; Accepted: 04 October 2024;
Published: 07 November 2024.
Edited by:
K. R. Justin Thomas, Indian Institute of Technology Roorkee, IndiaReviewed by:
Justin Zoppe, Universitat Politecnica de Catalunya, SpainJianlin Liu, China University of Petroleum (East China), China
Copyright © 2024 Lee, Ha, Kim and Caron. This is an open-access article distributed under the terms of the Creative Commons Attribution License (CC BY). The use, distribution or reproduction in other forums is permitted, provided the original author(s) and the copyright owner(s) are credited and that the original publication in this journal is cited, in accordance with accepted academic practice. No use, distribution or reproduction is permitted which does not comply with these terms.
*Correspondence: A. Caron, YXJuYXVkLmNhcm9uQGxhbS5sbi5jbg==
†Present address: A. Caron, Department of Surface and Interfacial Phenomena, Herbert Gleiter International Institute | Liaoning Academy of Materials, Shenyang, China
 W. J. Lee
 J. W. Ha
 J. M. Kim
 A. Caron