 Robin Koch
 Roland Dittmeyer
- 1Mercedes-Benz AG, Stuttgart, Germany
- 2Institute for Micro Process Engineering, Karlsruhe Institute of Technology, Karlsruhe, Germany
This study deals with the question which direct air capture technologies currently have the biggest potential for reaching a gigaton scale of capture capacity. Technologies that were examined are alkaline gas washing, temperature-vacuum swing adsorption, electro-swing adsorption, and accelerated weathering carbon capture. A multi-criteria decision-making model (PROMETHEE II) and cost predictions based on learning by doing were used to determine which technology has the highest potential. The results show that electro-swing adsorption has the highest potential but comes with a lot of uncertainties that need to be cleared in the future, such as costs and supply for adsorbents. In addition, it was not tested under ambient conditions, and therefore, it is unclear how this technology will perform at atmospheric CO2 levels. Next best would be accelerated weathering carbon capture, which needs no fresh water and has lower energy demand compared to temperature-vacuum swing adsorption. A major disadvantage might be the land requirements and the high temperatures to regenerate the carbonates. Temperature-vacuum swing adsorption follows shortly after, mainly profiting from a great cost reduction potential from learning by doing and a comparably small land footprint. Alkaline gas washing showed the lowest potential, but through improving the process, it will also have the possibility to be applied at gigaton scale.
1 Introduction
Climate change is one of the most pressing challenges humanity will face in this century and probably has to deal with the consequences for centuries to come. Currently, the world is far from being on track to achieve the Paris agreement goals as a rapid acceleration of climate protection efforts is needed to stay below 2.0°C (Boehm et al., 2022). To still reach set goals, options such as Carbon Capture Storage (CCS), which were hardly discussed 30 years ago and were seen to be one of many options 20 years ago, Herzog (2001) have become an inevitable building block for solid climate action strategies (Masson-Delmotte et al., 2019). Climate protection plans commonly include a massive ramp-up of renewable energy production in combination with a phase-out of fossil fuels. This change in the composition of energy production infrastructure is in favor of Direct Air Capture Carbon Storage (DACCS) over conventional CCS as some major CO2 point sources will phase out. Both technologies are at the upper end of costs for CO2 capture methods, but a major advantage of DACCS over standard CCS is its ability to deal with emissions from non-point sources, which will be a main contributor to residual emissions in the future, additionally to removing legacy emissions from the atmosphere (International Energy Agency, 2021; Nemet G. F. et al., 2023).
Currently, a variety of different DAC technologies are under development, with some already being marketed, while others are still on a laboratory scale (Ozkan, 2021; International Energy Agency, 2022). As the DAC industry is still in its infancy and estimations for installed CO2 capture capacity reach into the range of gigatons for the middle of the century, a fast and sustainable industrialization seems to be necessary to provide enough removal capacity (Nemet G. et al., 2023; Powis et al., 2023).
Therefore, the aim of this study is to assess different DAC technologies in terms of potential for industrialization, as necessary for accelerated climate action.
2 Materials and methods
2.1 Methods
As there are a variety of different technological approaches on DAC, four are selected to be closely examined to determine how suitable they are for sustainable industrialization. It is in this context defined as reaching a significant number of capture units produced and installed per year, while also being easy to operate and being as sustainable as possible. Technologies chosen are alkaline gas washing (AGW) as developed by Carbon Engineering (Keith et al., 2018), temperature-vacuum swing adsorption (TVSA) as developed by Climeworks (Beuttler et al., 2019; Deutz and Bardow, 2021), electro-swing adsorption (ESA) reported by Voskian and Hatton (2019), and ambient weathering carbon capture (AWCC) as reported by McQueen et al. (2020) and developed by Heirloom.
The aforementioned technologies are chosen as they share some advantages that might be beneficial for being deployed. While TVSA and ESA capture units commonly come in smaller sizes, comparable to shipping containers, AGW and AWCC are substantially bigger. These four technologies stand in contrast to approaches such as enhanced weathering of minerals or ocean alkalinity enhancement (OAE) where capture cycles are much longer and measurement, reporting, and verification for carbon credits can be more complicated (McQueen et al., 2020). Adding to this, environmental impacts of OAE can be broad and unpredictable (National Academies of Sciences, Engineering, and Medicine, 2022).
To assess industrialization potentials for previously chosen technologies, a variety of different analyses are performed which include assessing the effects of learning by doing on CO2 removal costs and energy consumption in their current state of development. The core of this study is the determination of industrialization potentials for different DAC technologies. Capture technologies that are difficult to operate regarding their varying needs for electric and thermal energy, used capture materials, and produced waste are less likely to be applied at industrial scale if other options are easier to operate and less polluting. In addition, a high water demand or land requirements can be hindering to apply the technology. To give an additional perspective, Technology Readiness Levels are provided as data on technologies with a lower TRL come with higher uncertainties on their future development.
2.2 Economic estimations for electro-swing adsorption
ESA was not tested under atmospheric conditions and estimations on costs only refer to operating costs for the electro-chemical cell. To give a better picture for comparison between different DAC methods, some estimations for ESA have to be made.
For capital expenditure (CAPEX) for a scaled capture unit with an output of 1,000 tons per year, the costs are assumed to be 350 $/ton*a. This is somewhat higher than 288 $/ton*a suggested by National Academies of Sciences, Engineering, and Medicine (2019) for a scaled TVSA capture unit. As CAPEX for solid sorbent is dominated by the cost for the adsorbent and ESA is employing a pricier adsorbent than TVSA, it is reasonable to assume a higher overall CAPEX for ESA (National Academies of Sciences, Engineering, and Medicine, 2019). Operational expenditure (OPEX) for ESA capture units is mainly influenced by energy demand as this technology solely operates with electricity. Costs were set to 0.15 $/kWh.
2.3 Approach on future CO2 removal costs based on learning by doing
It is empirically established that costs for a technology are influenced by learning curves. In the case of DAC, this means that every doubling of installed capture units, which in this case is measured by cumulative carbon capture capacity, results in a reduction of costs by a constant learning rate (LR). This output capacity is called the functional unit. For TVSA and ESA, this unit is assumed to be 1,000 tons of removal capacity per year and functional unit, while for AGW and AWCC, it is 250,000 tons. Two different functional units are chosen to better reflect how those technologies are applied. TVSA and ESA are developed as small modular units the size of a 20-foot shipping container or even smaller. Every container, coupled with some external process technology, can be operated as a single capture facility. Capture plants with greater capacity are built by just using more identical containers. Hence, the smallest functional unit is one container. In contrast, AGW and AWCC require an industrial-scale approach, with the combination of different sub-systems. Especially the calciner, which operates at temperatures up to 900°C, requires a sufficient mass flow of carbonates to be economically viable. Thus, the functional unit has to be larger compared to TVSA and ESA to better reflect how those technologies will be deployed in reality. In addition, the results are rather insensitive to size of the functional unit as long as x measures how much capacity is added (Lackner and Azarabadi, 2021).
Technologies that are more established are generally subject to lower LR than others. Hence, a learning rate of 0.2 is assigned in this study to reflect the relative recency of DAC technologies. The learning by doing effects on DAC can be compared to the development of photovoltaic or wind power.
Cr Reducible costs
Cnr Non-reducible costs
x Number of doubling based on functional unit
C Final costs after cost reduction
Costs are divided into Cr, which is the reducible part influenced by learning rates. These costs mainly contain costs for production and operation that can be lowered by improving production principles and better operation schemes. Cnr, which is the non-reducible part, mainly describes the absolute bottom line of costs, which cannot be reduced in any way. While x is the number of doublings based on the functional unit, C is the final cost that includes the reduced costs and the non-reducible costs (Lackner and Azarabadi, 2021).
Industrialized production commonly results in higher production capacity over time compared to manual production. Hence, one can expect that cost reduction effects, which are directly dependent on the number of functional units produced, such as learning by doing, play a more important role for industrialized production processes. Consequently, looking at the impact of learning by doing might give a deeper insight into how much potential technologies have for industrialization.
It should be noted that overall cost reductions are not only subject to learning by doing but are also influenced by a variety of other factors. Therefore, this cost projection is a simplification of reality and results in rather conservative estimations. For comparison, the impact of different cost reduction factors in a related field was investigated by Rubin et al. (2015).
2.4 Energy demand
Energy demands presented in this study are solely literature-based. If more than one source was available, an arithmetic averaging was used to include all obtainable data.
As mentioned before, testing conditions for ESA were not in the typical range for DAC application. Tests were performed with CO2 levels ranging between 6,000 and 100,000 ppm. Adsorption capacity was reported to be constant over all CO2 levels with an energy demand in the range of 40–90 kJ/mol depending on the loading. Reported energy consumption only refers to the electro-chemical cell itself; peripheral consumers such as ventilation and controllers were not included (Voskian and Hatton, 2019; Wilcox, 2020). Hence, it can be assumed that the energy demand for ESA is higher than reported due to lower CO2 concentration and additional peripheral consumers. Based on comparable setups, an additional energy consumption of 235 kWh/ton was assumed (National Academies of Sciences, Engineering, and Medicine, 2019).
To increase the understanding of the overall landscape of DAC technologies, Table 1 shows an overview of the operating temperatures of different technologies coupled with their respective energy demands (Keith et al., 2018; National Academies of Sciences, Engineering, and Medicine, 2019; Beuttler et al., 2019; Voskian and Hatton, 2019; McQueen et al., 2020; Deutz and Bardow, 2021; McQueen et al., 2021; Sabatino et al., 2021; Sendi et al., 2024).
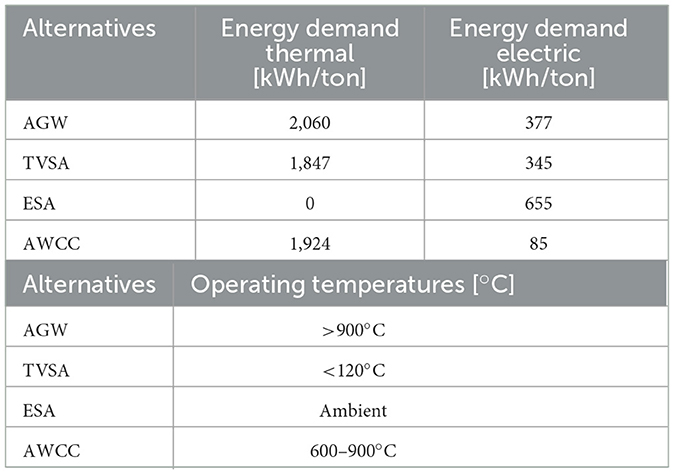
Table 1. Overview energy demand and operating temperatures.
2.5 Potential for industrialization
The scale at which DAC has to be deployed in the future prompts that capture units will not only be operated by their respective developers but also by a broad spectrum of independent operators. Generally speaking, this calls for user-friendly products which are easy to operate. In this study, specific costs today and at scale, energy demand, used materials, waste production, composition of energy supply, water demand, and land requirements are considered as factors for industrialization potential.
A multi-criteria decision-making (MCDM) analysis, more specifically the PROMETHEE II method, was applied to assess which of the aforementioned alternatives are more preferable for independent operators. Table 2 shows an overview of quantitative and qualitative values used for the MCDM analysis. For an MCDM analysis, every quantitative and qualitative input for a parameter can be matched with a respective linguistic term and a crisp score. Every parameter is additionally assigned a weighting to reflect overall importance. Next, crisp scores for every parameter and every alternative are compared to each other. By adding and normalizing the crisp scores, a final value can be determined. This value ranks each alternative on a cardinal scale and makes comparison easier (Thakkar, 2021).
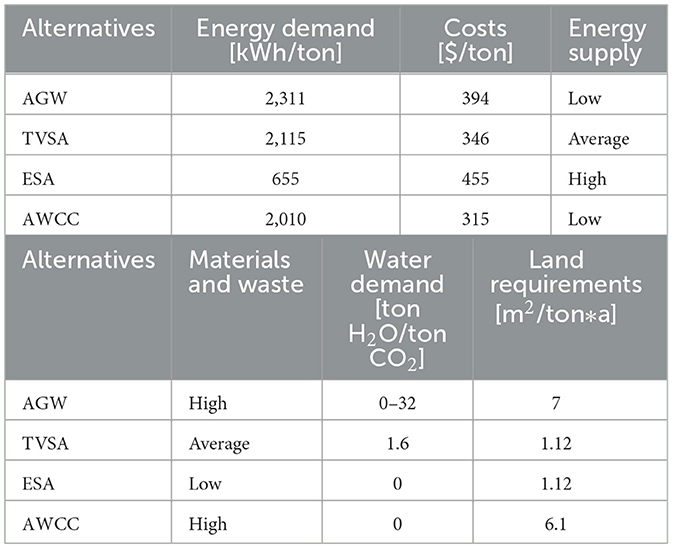
Table 2. Overview of technologies and average values used for MCDM.
Table 3 is adopted from Thakkar (2021) and shows the linguistic terms for rating in different categories with their corresponding crisp score and the normalized values for each linguistic term. This scale was used for rating the different alternatives in the respective categories for PROMETHEE II.
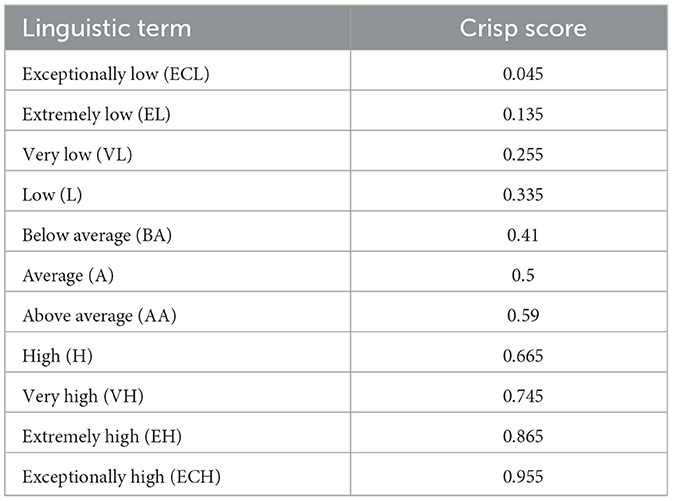
Table 3. Point 11 fuzzy scale.
2.5.1 Energy demand
It is the main driver for the OPEX of a DAC plant. A sustainable energy supply is one of the most important factors for the operation of a DAC plant. Lower energy demands paired with an energy supply with a small carbon footprint increase the amount of net-negative emissions per functional unit. This is expected to be a major driver for operators. Hence, lower energy demand is desirable and is assigned a weighting of 0.2 to reflect that.
2.5.2 Costs
As manufacturers and operators need to have a viable business case for them to run DAC plants, lower costs are more preferable. This will be a major decision marker for companies and is therefore assigned a weighting of 0.2 to represent the importance of this criterion.
2.5.3 Materials and waste
If a capture unit uses materials that are more difficult to handle or to operate as they are expensive or hazardous, operators will choose alternatives which are easier to handle. The same counts for potential wastes produced by the process; the less waste and the less hazardous for humans and the environment, the better. This category is assigned a weighting of 0.15.
2.5.4 Energy supply
Composition of energy supply can also be an important factor for operators. Some processes need thermal energy for desorption; this heat can be sourced from waste heat or generated specifically for the process. This heat production or sourcing might not be available or possible at every location. Therefore, processes that can be run on electricity only are preferable for operators. It is assigned a weighting of 0.1.
2.5.5 Water demand
Fresh water is an important resource that various DAC technologies need for operation. Especially processes that rely on the absorption of CO2 in aqueous solution such as AGW, other technologies might also need water in drier climates. The importance of conserving fresh water for agriculture and other uses will increase in the future due to a potentially reduced supply through climate change. Therefore, it was assigned a weighting of 0.15. Note that a lower water demand was rated with a higher value for the MCDM.
2.5.6 Land requirement
A main advantage of DAC over other CDR methods is its independence from arable land. As a technical removal method, it can theoretically be placed anywhere where the necessary infrastructure is provided. That does not mean land requirements to build the capture plants are not important. Comparing different DAC technologies helps to identify which methods use land more efficiently and thereby reduce costs and effort to establish a facility. It was assigned a weighting of 0.1. Similar to water demand, small land requirements correspond with a high rating in the MCDM.
2.6 TRL
NASA has been working on TRL for decades to assess how far a technology is in its development. It ranges from an observed principle (TRL 1) to a proven system implemented in its intended working environment (TRL 9) (Mankins, 1995). Originally referring to space flight technologies, today it provides a suitable way to measure the maturity of different technologies. The scale can be expanded by TRL 10, referring to technologies that have been operational for a set amount of time and provided no or acceptably low failure rates (Straub, 2015). Determination of TRL in this study is based on U.S. Department of Energy (2010).
TRLs in this study are assessed based on mentioned literature and business activities if there are any. In addition, TRLs taken from literature by Bui et al. (2018) are presented for comparison. It should be noted that the lower the TRL, the more uncertainties for the future development of a technology can be expected.
3 Results and discussion
3.1 Economic estimations for electro-swing adsorption
Data on ESA were generated under testing conditions that differ from atmospheric DAC application; the lowest CO2 concentration used by Voskian and Hatton (2019) was 6000 ppm, which is approximately 15 times higher than in the atmosphere. Assumptions were necessary to calculate costs under DAC conditions with an output capacity of 1,000 tons of CO2 per year as mentioned in the methods.
Calculation of total costs results in approximately 455 $/ton, divided into 365 $/ton for reducible costs and approximately 90 $/ton for non-reducible costs.
The results for OPEX are between 76 and 120 $/ton, which are in line with reported costs in the literature, which are between 80 and 100 $/ton, but CAPEX of 350 $/ton hints at how high total costs could be. Nevertheless, a detailed economic analysis is needed to show if the assumptions are correct. It also has to be considered that investment costs will be subject to cost reductions from various factors in the future.
3.2 Cost of CO2 removal
Figure 1 shows how costs in $/ton develop if doubling of capacity causes a learning by doing effect (Fasihi et al., 2019; Voskian and Hatton, 2019; McQueen et al., 2020; Erans et al., 2022). The upscaling is based on International Energy Agency (2021), where a removal capacity of 1 Gt per year is projected for DAC to reach carbon neutrality. After 22 doublings, a capacity of approximately 1 Gt is reached for TVSA and ESA. Note that it is assumed that after 5 doublings, the first capture units reach their end of life and have to be shut down. Therefore, the growth of capacity is slowed down. AGW and AWCC exceed the threshold value of 1 Gt after 14 doublings as the functional unit for these capture technologies is 250,000 tons, as small-scale modular capture units based on those technological approaches are currently not developed.
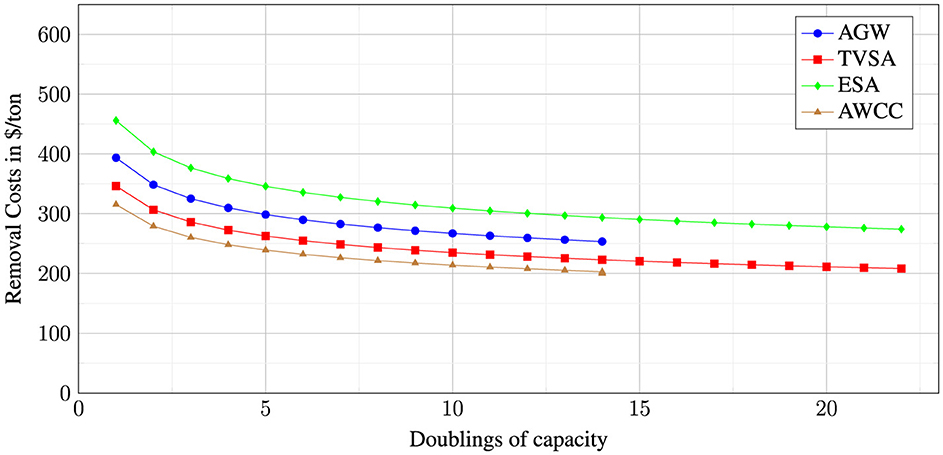
Figure 1. Cost reduction through learning by doing from doubling of capacity for different DAC technologies, starting at 1,000 tons of CO2 capacity per year for every technology except AGW and AWCC which starts at 250,000 tons of CO2.
Figure 1 shows that TVSA reaches about the same capture costs as AWCC for a similar capacity, although the initial removal costs are higher. This can be explained by the greater influence of learning by doing for technologies with smaller functional units as they have to go through more doublings of capacity and therefore experience higher cost reductions. Comparing all examined options, ESA is the most expensive one, but this should be taken with caution as economic estimations for CAPEX are assumption-based and need to be compared to measured data when available. AGW is somewhat in the middle between ESA and TVSA, also suffering from fewer doublings, resulting in a lower cost reduction when reaching the threshold value of 1 Gt removal capacity. In addition, AGW plants are currently a composition of of-the shelf available components. That means each component is subjected to a lower learning rate. Nevertheless, economies of scale still apply to this technology and are comparable to the used learning rate (Lieberman, 1987; Koellner et al., 2004; Yeh and Rubin, 2012; Dahlgren et al., 2013).
In addition, the graph shows that the effect of learning by doing is by far not big enough to reach removal costs that make DAC a viable technology compared to other carbon removal technologies (Sachs, 2021). Significant cost reductions can be achieved through improved energy consumption, cheaper chemical components, and an improved process and adsorber design. Adding to this, learning by research should not be neglected as a factor for cost reduction.
Similar to the findings by Lackner and Azarabadi (2021), it is clear that learning by doing as a single cost reduction mechanism will not cause a sufficient enough effect on CO2 capture prices. It is also complicated to predict learning rates for technologies that are still under development in an industry that might see disruptive changes in the future. Researchers should be advised against comparing different technologies only based on learning rates as these might change significantly over time and under varying circumstances.
Overall, the cost estimations based on learning by doing are in line with costs provided by Young et al. (2023) and Sievert et al. (2024). Our estimations reach the lower end of what the recent literature projected. This may be due to a static and comparably high learning rate. Even though the results fall in line with literature, it still needs to be proven against data on real costs for a scaled capture facility when they are available.
3.3 Energy demand
ESA has the lowest energy demand, but it is unclear if this demand can be reached with atmospheric CO2 levels. A great advantage of ESA is that it is solely based on electric energy, which is easily available and makes it independent of thermal energy sources (Voskian and Hatton, 2019).
AGW has the highest demand and has a high percentage of thermal energy, which has to be at approximately 900°C. Supplying thermal energy at such a high level can be problematic if there is no heat source available at this level. For AGW as presented by Keith et al. (2018), thermal energy is produced via combustion of natural gas, which produces CO2 to supply heat and electricity. The process currently averages at needing 7.4 MJ/kg thermal and 1.36 MJ/kg electric energy (National Academies of Sciences, Engineering, and Medicine, 2019; Keith et al., 2018; Realmonte et al., 2019; McQueen et al., 2021; Sabatino et al., 2021).
TVSA and AWCC have comparable energy demands. While TVSA is slightly higher, it needs more electrical energy, and even though it needs thermal energy for desorption, this energy can be produced with electric energy as the level is at approximately 100°C. Therefore, TVSA is more flexible in its operation and independent of heat sources (Beuttler et al., 2019; Sabatino et al., 2021).
AWCC needs less electric energy compared to AGW as there is no need for fluid management and no liquid components that need to be handled. In terms of thermal energy, it is comparable as both technologies rely on carbonation of mineral oxides (Keith et al., 2018; McQueen et al., 2020).
ESA and AWCC do not have values for standard deviation in Figure 2 because there were not enough data available to calculate it.
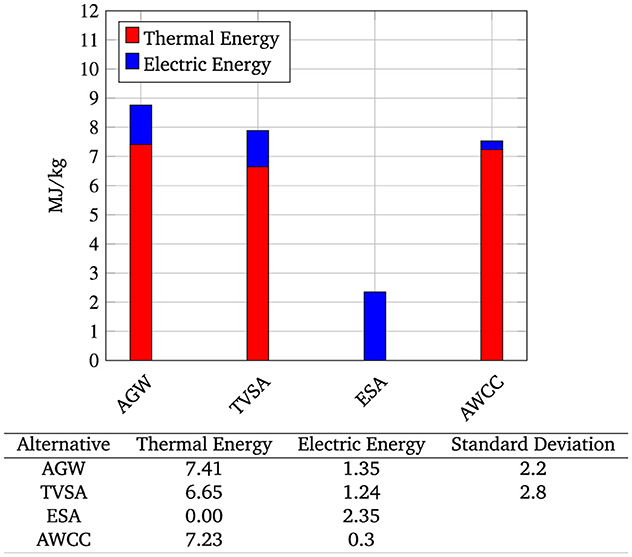
Figure 2. Current energy demand in MJ/kg of different DAC Technologies for sequestration of CO2 with standard deviation.
It should be noted that the energy demand presented for ESA is based on Voskian and Hatton (2019) where the technology was applied to higher CO2 concentrations than typically found in the atmosphere and neglected peripheral energy consumers. We added the additional assumed energy consumption by these consumers.
3.4 Potential for industrialization
As described in Methods, a multi-criteria decision-making analysis with PROMETHEE II was performed to determine which DAC method is most suitable for a fast and sustainable industrialization. The different categories reflect on how user-friendly the technology is. This was considered an important factor as it is not likely that DAC companies will be in control of the whole vertical value chain from process design to manufacturing and operation of DAC plants in the future. It is more likely that at least operation will be carried out by independent operators who buy capture units from respective companies. Therefore, the results can be understood as a scale for user-friendliness.
Table 4 shows normalized values used for the PROMETHEE II analysis. If concrete values were available, they were normalized and paired with the corresponding linguistic term. If the rating was a qualitative one, the linguistic term was chosen and normalized accordingly.
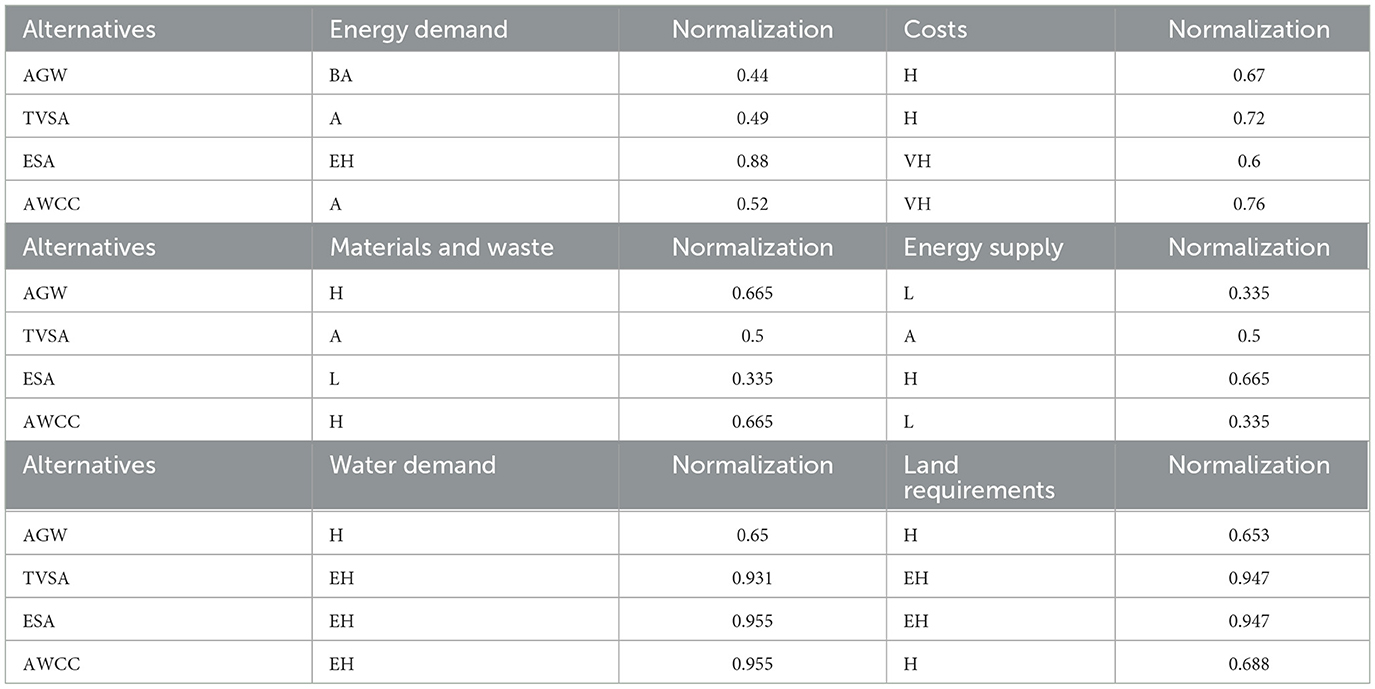
Table 4. Rating of the four alternatives according to the chosen criteria with a point 11 fuzzy scale.
3.4.1 Energy demand
In this category, ESA received the best rating for its exceptionally low demand compared to the other options. The others, from highest to lowest rating, were AWCC, TVSA, and AGW. It can be expected that especially TVSA will see a reduction of energy consumption in the future from better and more specialized sorbent materials.
3.4.2 Cost
Only values that could be obtained from literature were used for this rating, plus the economic estimations for ESA. Here, from best to worst rating, are AWCC, TVSA, AGW, and ESA. It is yet to be proven if ESA can reach the estimated CAPEX and OPEX for DAC conditions. All of the mentioned technologies are likely to see a decrease in costs through improvements in production and operation. This is also reflected in the cost prognosis in Figure 1.
3.4.3 Materials and waste
This category was rated qualitatively according to which materials were used and what products from the process can be expected. For AGW, according to Keith et al. (2018), potassium hydroxide, calcium hydroxide, and water are used. Deposits for raw materials for hydroxide production are numerous, and a shortage is not expected. Apart from water, the consumption of input materials is rather low, and disposal is not problematic. This resulted in a rating of High. For TVSA, it is state of the art to use an amine-based sorbent and water (Deutz and Bardow, 2021). The production of amines would have to be scaled up to the size of current standard polymers for a global roll-out. Detailed analyses are necessary to determine whether this is possible, but it is not seen as a fundamental problem. The amines and filter materials have to be disposed of after a few years of operation, but this should not be problematic as different disposal options are available. Accordingly, it was rated Average.
The ESA process, as described by Voskian and Hatton (2019), uses ferrocene and anthraquinones. Ferrocene is rather easy to produce and should be available for a broad roll-out. Production of anthraquinones is more complex and could become a problem in the future. Adding to this, both substances are toxic and in parts carcinogenic. This has to be considered when dealing with the handling and disposal of both materials. Therefore, ESA was rated Low.
Finally, for AWCC, as described by McQueen et al. (2020), the process needs magnesium oxide, which is obtained from magnesite. The consumption during the capture is low, and no shortage of supply can be expected. Apart from that, the process can also use other mineral oxides. Disposal is not problematic. The process is rated High.
3.4.4 Energy composition
AGW and AWCC predominantly use thermal energy at a high temperature of approximately 900°C. This temperature level can be problematic to source. Heat at this level usually is not available as waste heat and has to be produced specifically for this process, which might not be possible at some locations. Therefore, both technologies were rated Low. TVSA also relies heavily on thermal energy but at a significantly lower level. At approximately 100°C, heat can be sourced from waste energy if available or can be produced with resistance heaters or high-temperature heat pumps. Thus, TVSA can be run completely on electric energy with some minor adjustments to the system. It was rated Average.
Conclusively, ESA runs on electric energy only, is therefore highly flexible, and is easy to apply at any given location. It was rated High.
3.4.5 Water demand
Water demand for AGW is reported between 0 and 32 tons of H2O per ton of CO2. This large margin is on the one hand dependent on air humidity but also process design (National Academies of Sciences, Engineering, and Medicine, 2019). Keith et al. (2018) estimate a consumption between 0 and 9 tons of H2O based on their process design, which will be applied at the Stratos facility developed by 1PointFive. Nevertheless, this demand was found to be the largest of all investigated technologies. Third was TVSA with an estimated demand of 1.6 tons. This is, of course, dependent on climate conditions, but in some cases, the method is able to produce water instead of consuming it (National Academies of Sciences, Engineering, and Medicine, 2019).
For both ESA and AWCC, there was no evidence in the literature to be found that those methods consume a significant amount of water and were consequently rated exceptionally high in terms of water demand.
3.4.6 Land requirement
Land use was found to be larger for methods that rely on carbonation of alkaline and earth alkaline minerals such as AGW and AWCC, while AGW was reported to have the highest demand with 7 m2 per ton per year, followed by AWCC with 6.2 m2 per ton per year (National Academies of Sciences, Engineering, and Medicine, 2019; McQueen et al., 2020). Both technologies necessitate the construction of large-scale facilities, and both were rated Low. In contrast, TVSA and ESA are smaller in size and much more modular. Literature provided a land requirement of 1.12 m2 per ton per year for TVSA (National Academies of Sciences, Engineering, and Medicine, 2019). Comparable figures for ESA were not available; therefore, we assumed it to be somewhat similar to the demand of TVSA. Thus, both were rated exceptionally High.
Table 5 shows the final results of the MCDM-analysis. The higher the value, the more preferable the alternative is. At first glance, ESA seems to have the highest industrialization potential as it has very promising energy consumption paired with solely relying on electric energy and no water demand. However, this result should be taken with caution as this technology has a weaker database compared to the others in this study. In addition, the materials used for ESA are currently expensive, and it is unclear if they can be supplied in larger quantities in case of a global roll-out. It currently comes with a TRL of 4, which is considerably lower than the TRL of TVSA, AGW, and AWCC. It should be clear that there are high uncertainties for this technology in the future. Nevertheless, if it can keep its promises, it has high potential. The next best option would be AWCC, which performs well in materials and waste but lacks especially in energy composition and land requirement. Third would be TVSA, which has the advantage of being electric-only but also has higher energy consumption and costs compared to AWCC. Finally, AGW has the lowest rating; it suffers from higher thermal energy demand, heavy reliance on thermal energy at a high level, and a high demand for water, especially in dry climates.
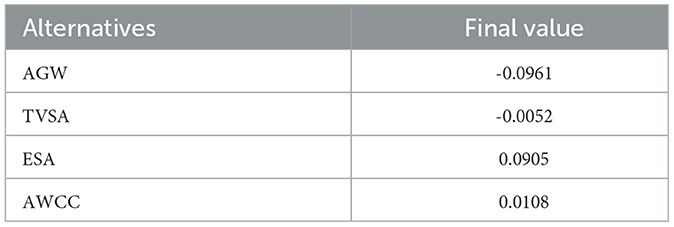
Table 5. Final values for MCDM based on PROMETHEE II for four DAC technologies.
4 Conclusion
Based on the presented data, ESA was identified to be the one with the highest potential for industrialization but also with the highest uncertainties for its future development. Capture units at scale have to show if this technology can keep its promises. A major hurdle could be the hazardous and expensive chemicals it needs. It is not clear if they can be produced at scale. In favor of this technology is the low energy demand. The energy system, shifting from a fossil-based to a more sustainable one, is under pressure from ever-increasing energy demands. Thus, avoiding more pressure from energy-intensive DAC systems is preferable. With some distance but not far apart from each other follow AWCC and TVSA. Both technologies have their specific pros and cons. While AWCC needs thermal energy at a high level, which makes it less flexible, TVSA needs amines, which can be hazardous, and their production capacity has to be greatly expanded to be scalable to gigatons of capture capacity. Both are already or will be producing negative emissions at scale in the next few years; therefore, a high reliability of the data can be expected. At last, AGW has received the lowest rating. It has the same deficits as AWCC but combined with a higher energy demand and costs.
Concluding, all technologies have their specific use cases, and it is likely that all of them will find one or another area where they will be applied. However, this study shows that with some uncertainties, ESA has the highest potential. With more certainty, it was shown that AWCC and TVSA also have great potential. They also complement each other as TVSA offers small and modular solutions that fit where waste heat is available or space is scarce, while AWCC are big-scale projects applied where huge volumes of removal capacity are needed. AGW has a lower potential, but with further improvement of this technology, it can be relevant and will deliver sufficient removal capacity.
Data availability statement
The original contributions presented in the study are included in the article/supplementary material, further inquiries can be directed to the corresponding author.
Author contributions
RK: Conceptualization, Data curation, Formal analysis, Funding acquisition, Investigation, Methodology, Project administration, Resources, Software, Supervision, Validation, Visualization, Writing – original draft, Writing – review & editing. RD: Supervision, Writing – review & editing.
Funding
The author(s) declare that financial support was received for the research and/or publication of this article. This project did not receive any additional funding. The main author of this study was employed by Mercedes-Benz AG during the research and writing of this study.
Conflict of interest
RK was employed by Mercedes-Benz AG.
The remaining author declares that the research was conducted in the absence of any commercial or financial relationships that could be construed as a potential conflict of interest.
Generative AI statement
The author(s) declare that no Gen AI was used in the creation of this manuscript.
Publisher's note
All claims expressed in this article are solely those of the authors and do not necessarily represent those of their affiliated organizations, or those of the publisher, the editors and the reviewers. Any product that may be evaluated in this article, or claim that may be made by its manufacturer, is not guaranteed or endorsed by the publisher.
References
Beuttler, C., Charles, L., and Wurzbacher, J. (2019). The role of direct air capture in mitigation of anthropogenic greenhouse gas emissions. Front. Climate 1:10. doi: 10.3389/fclim.2019.00010
Boehm, S., Jeffery, L., Levin, K., Hecke, J., Schumer, C., Fyson, C., et al. (2022). State of Climate Action 2022. Washington, D.C.: World Resources Institute.
Bui, M., Adjiman, C. S., Bardow, A., Anthony, E. J., Boston, A., Brown, S., et al. (2018). Carbon capture and storage (CCS): the way forward. Energy Environ. Sci. 11, 1062–1176. doi: 10.1039/C7EE02342A
Dahlgren, E., Göçmen, C., Lackner, K., and Ryzin, G. V. (2013). Small modular infrastructure. Eng. Econom. 58, 231–264. doi: 10.1080/0013791X.2013.825038
Deutz, S., and Bardow, A. (2021). Life-cycle assessment of an industrial direct air capture process based on temperature?vacuum swing adsorption. Nat. Energy 6, 203–213. doi: 10.1038/s41560-020-00771-9
Erans, M., Sanz-Pérez, E. S., Hanak, D. P., Clulow, Z., Reiner, D. M., and Mutch, G. A. (2022). Direct air Capture: Process Technology, Techno-Economic and Socio-Political Challenges. London: Royal Society of Chemistry.
Fasihi, M., Efimova, O., and Breyer, C. (2019). Techno-economic assessment of co 2 direct air capture plants. J. Clean. Prod. 224, 957–980. doi: 10.1016/j.jclepro.2019.03.086
Herzog, H. J. (2001). What future for carbon capture and sequestration? Environ. Sci. Technol. 35, 148A–153A. doi: 10.1021/es012307j
International Energy Agency (2021). “Net zero by 2050 a roadmap for the global energy sector,” in Technical Report, International Energy Agency (Paris: International Energy Agency).
International Energy Agency (2022). “Direct air capture: A key technology for net zero,” in Technical Report, International Energy Agency (Paris: International Energy Agency).
Keith, D. W., Holmes, G., Angelo, D. S., and Heidel, K. (2018). A process for capturing CO2 from the atmosphere. Joule 2, 1573–1594. doi: 10.1016/j.joule.2018.05.006
Koellner, W. G., Brown, G. M., Rodríguez, J., Pontt, J., Cortés, P., and Miranda, H. (2004). Recent advances in mining haul trucks. IEEE Trans. Indust. Elect. 51, 321–329. doi: 10.1109/TIE.2004.825263
Lackner, K. S., and Azarabadi, H. (2021). Buying down the cost of direct air capture. Industrial and Engineering Chemistry Research 60:8196–8208. doi: 10.1021/acs.iecr.0c04839
Lieberman, M. B. (1987). Market growth, economies of scale, and plant size in the chemical processing industries market growth, economies of scale, and plant size in the chemical processing industries*. J. Ind. Econ. 36, 175–191. doi: 10.2307/2098411
Mankins, J. C. (1995). “Technology readiness levels a white paper,” in Technical Report, National Aeronautics and Space Administration.
Masson-Delmotte, V., Zhai, P., Pörtner, H.-O., Roberts, D., Skea, J., Shukla, P. R., et al. (2019). “Global warming of 1.5°C an IPCC special report on the impacts of global warming of 1.5°C above pre-industrial levels and related global greenhouse gas emission pathways, in the context of strengthening the global response to the threat of climate change, sustainable development, and efforts to eradicate poverty,” in Technical report, Intergovernmental Panel on Climate Change (Geneva: IPCC).
McQueen, N., Gomes, K. V., McCormick, C., Blumanthal, K., Pisciotta, M., and Wilcox, J. (2021). A Review of Direct Air Capture (DAC): Scaling up Commercial Technologies and Innovating for the Future. Bristol: IOP Publishing.
McQueen, N., Kelemen, P., Dipple, G., Renforth, P., and Wilcox, J. (2020). Ambient weathering of magnesium oxide for CO2 removal from air. Nat. Commun. 11:3. doi: 10.1038/s41467-020-16510-3
National Academies of Sciences Engineering, and Medicine. (2019). “Negative emissions technologies and reliable sequestration: A research agenda,” in Technical Report, National Academies of Science and Medicine.
National Academies of Sciences Engineering, and Medicine. (2022). A Research Strategy for Ocean-based Carbon Dioxide Removal and Sequestration. Washington, D.C.: National Academies Press.
Nemet, G., Greene, J., Müller-Hansen, F., and Minx, J. C. (2023). Dataset on the adoption of historical technologies informs the scale-up of emerging carbon dioxide removal measures. Commun. Earth Environm.4:397. doi: 10.1038/s43247-023-01056-1
Nemet, G. F., Gidden, M. J., Greene, J., Roberts, C., Lamb, W. F., Minx, J. C., et al. (2023). Near-Term Deployment of Novel Carbon Removal to Facilitate Longer-Term Deployment. Amsterdam: Elsevier.
Ozkan, M. (2021). Direct Air Capture of CO2: A Response to Meet the Global Climate Targets. Berlin: Springer Nature.
Powis, C. M., Smith, S. M., Minx, J. C., and Gasser, T. (2023). Quantifying global carbon dioxide removal deployment. Environm. Res. Letters 18:acb450. doi: 10.1088/1748-9326/acb450
Realmonte, G., Drouet, L., Gambhir, A., Glynn, J., Hawkes, A., K?berle, A. C., et al. (2019). An inter-model assessment of the role of direct air capture in deep mitigation pathways. Nat. Commun. 10:3277. doi: 10.1038/s41467-019-10842-5
Rubin, E. S., Azevedo, I. M., Jaramillo, P., and Yeh, S. (2015). A Review of Learning Rates for Electricity Supply Technologies. Amsterdam: Elsevier.
Sabatino, F., Grimm, A., Gallucci, F., van Sint Annaland, M., Kramer, G. J., and Gazzani, M. (2021). A comparative energy and costs assessment and optimization for direct air capture technologies. Joule 5, 2047–2076. doi: 10.1016/j.joule.2021.05.023
Sachs, G. (2021). Carbonomics: Introducing the GS Net Zero Carbon Models and Sector Frameworks. Boston, MA: Goldman Sachs.
Sendi, M., Bui, M., Dowell, N. M., and Fennell, P. (2024). Geospatial techno-economic and environmental assessment of different energy options for solid sorbent direct air capture. Cell Reports Sustainab. 1:100151. doi: 10.1016/j.crsus.2024.100151
Sievert, K., Schmidt, T. S., and Steffen, B. (2024). Considering technology characteristics to project future costs of direct air capture. Joule 8, 979–999. doi: 10.1016/j.joule.2024.02.005
Straub, J. (2015). In search of technology readiness level (trl) 10. Aerospace Sci. Technol. 46, 312–320. doi: 10.1016/j.ast.2015.07.007
U.S. Department of Energy (2010). “Technology readiness assessment guide,” in Technical Report, Department of Energy (Washington DC: U.S. Department of Energy).
Voskian, S., and Hatton, T. A. (2019). Faradaic electro-swing reactive adsorption for co2 capture. Energy Environm. Sci. 12, 3530–3547. doi: 10.1039/C9EE02412C
Yeh, S., and Rubin, E. S. (2012). A review of uncertainties in technology experience curves. Energy Econ. 34, 762–771. doi: 10.1016/j.eneco.2011.11.006
Keywords: direct air capture, temperature-vacuum swing adsorption, alkaline gas washing, electro-swing adsorption, industrialization, multi-criteria decision-making, prognosis, PROMETHEE II
Citation: Koch R and Dittmeyer R (2025) Comparative analysis of industrialization potentials of direct air capture technologies. Front. Clim. 7:1558396. doi: 10.3389/fclim.2025.1558396
Received: 10 January 2025; Accepted: 26 March 2025;
Published: 11 April 2025.
Edited by:
Ben W. Kolosz, University of Hull, United KingdomReviewed by:
Florian Kraxner, International Institute for Applied Systems Analysis (IIASA), AustriaVolker Sick, University of Michigan, United States
Copyright © 2025 Koch and Dittmeyer. This is an open-access article distributed under the terms of the Creative Commons Attribution License (CC BY). The use, distribution or reproduction in other forums is permitted, provided the original author(s) and the copyright owner(s) are credited and that the original publication in this journal is cited, in accordance with accepted academic practice. No use, distribution or reproduction is permitted which does not comply with these terms.
*Correspondence: Robin Koch, cm9iaW4ua29jaEBzdHVkZW50LmtpdC5lZHU=