 Andrew Dowdy1,2,3*
 Andrew Brown1,4
- 1School of Geography, Earth and Atmospheric Sciences, University of Melbourne, Melbourne, VIC, Australia
- 2ARC Centre of Excellence for Climate Extremes, Melbourne, VIC, Australia
- 3Melbourne Energy Institute, University of Melbourne, Melbourne, VIC, Australia
- 4ARC Centre of Excellence for 21st Century Weather, Parkville, VIC, Australia
1 Introduction
This report describes a dataset designed for thunderstorm analysis, produced using a diagnostic method based on parameters related to convection. The dataset is intended to be used for broadscale climatological analyses, as was done for a previous dataset version based on the ERA-Interim reanalysis. The previous dataset version has been updated as described here including using the more recent ERA5 reanalysis. This update also expands the region from Australia, as used in the previous dataset, to now covering all tropical and mid-latitude regions globally. The method uses environmental parameters comprising of convective available potential energy (CAPE) and vertical wind shear. A novel aspect of this dataset is being calibrated at each location based on lightning observations as a proxy for thunderstorm occurrence. This calibration means that, for each individual grid location, the average occurrence frequency of thunderstorm environments in the dataset is consistent with the average occurrence frequency of thunderstorms based on observations. It is referred to as the Broadscale Thunderstorm Environment (BTE) dataset, with some analysis presented here for the diagnostic method and the resultant average climatology of thunderstorm environments based on applying the method from 1979 to 2023. Examples are also considered for building on this approach, such as applying the diagnostic method to global climate model data.
Long-term consistent data for thunderstorm occurrences are not widely available throughout the world, as well as noting the resolution of climate models currently available is not able to accurately simulate fine-scale processes that cause thunderstorms (Droegemeier and Wilhelmson, 1987; Tippett et al., 2015; Hoogewind et al., 2017; Gutowski et al., 2020). This makes it challenging for climatological analyses using a relatively limited period of available homogenous thunderstorm observations or using climate models that are not ideal for simulating thunderstorms.
Due to those challenges, studies in recent years have used environmental diagnostic methods for indicating the occurrence of thunderstorms. Several of these studies have used CAPE in combination with vertical wind shear from the surface to 6 km above ground level (i.e., the shear from 0 to 6 km: S06), similar to approaches such as Brooks et al. (2003) developed for North America. In Australia, Allen and Karoly (2014) applied this type of approach to examine severe thunderstorm environments from a climatological perspective, based on ERA-Interim reanalysis (Dee et al., 2011).
Building on this type of approach, Dowdy (2020) examined thunderstorm environments based on CAPE and S06 from ERA-Interim reanalysis, but with novel methodological differences in contrast to previous studies. These differences included using spatially varying thresholds of the diagnostic, with the threshold at each location defined to give the same occurrence frequency of diagnostic events to the number of observed events (i.e., a form of quantile-quantile matching for calibrating the results), and using lightning data as an observations-based proxy for thunderstorm occurrence at a given location and time (noting that thunder is the acoustic result of lightning occurrence). The thunderstorm environment dataset based on applying that method to ERA-Interim reanalysis for Australia was documented in Dowdy (2020) and subsequently used for various broad-scale climatological studies. Those studies include several that examined combinations of weather systems for insight on rainfall climatology (Pepler et al., 2020, 2021; Fiddes et al., 2021; van Rensch et al., 2023; Fu et al., 2024) and studies examining wildfire ignition potential based on lightning that occurs with little rainfall on the ground known as “dry lightning” (Dowdy, 2020; Canadell et al., 2021).
The European Centre for Medium-Range Weather Forecasts (ECMWF) recently released a new reanalysis dataset called ERA5 (Hersbach et al., 2020), with the ERA-Interim reanalysis no longer being updated since 2019. As such, the thunderstorm environment dataset described in this report is based on the ERA5 reanalysis (in contrast to the previous thunderstorm environment dataset that was based on ERA-Interim reanalysis), including so the data can be available for recent years since 2019.
This dataset described here based on ERA5 reanalysis is referred to as the Broadscale Thunderstorm Environment (BTE) dataset, given its intended applications for broadscale climate analysis purposes similar to studies that used the previous dataset version (Dowdy, 2020; Pepler et al., 2020, 2021; Canadell et al., 2021; Fiddes et al., 2021; van Rensch et al., 2023; Fu et al., 2024). Those previous studies have done analysis typically at scales coarser than about 5 km (e.g., about 0.05 degrees) in latitude and longitude, noting that below these scale convection starts to be partially resolved in models (Bryan et al., 2003).
2 Methods and input data
2.1 Lightning data
Global lightning data from World Wide Lightning Location Network (WWLLN: Virts et al., 2013) were used to determine the threshold of the environmental diagnostic method, based on the period of suitable WWLLN data available for this research from 2012 to 2023. The WWLLN data comprise lightning observations based on the time of arrival of the electromagnetic disturbance propagating away from the lightning. These data are recorded by a global network of ground-based radio receivers and contain information about the time and location of individual lightning strokes.
The observed thunderstorm environments were defined for the purposes of this diagnostic method based on 2 or more lightning strokes being recorded within ± 3 grid cells of a given location during a 6-h time period. This was done individually for each 6-hourly time period (centered on 0000, 0600, 1200, and 1800 UTC) and each grid cell (using the same grid as provided in the ERA5 reanalysis at 0.25° latitude and longitude). This method of aggregating the lightning observations data within 0.75° around each ERA5 grid cell and in 6-hourly time periods helps allow for broadscale climate applications that might use a range of data sets, including relatively coarse-scale data (such as global model data intended for climate analysis purposes, etc.), similar to how the previous version of the dataset was used for broadscale analyses including of climatological features (Dowdy, 2020; Pepler et al., 2020, 2021; Canadell et al., 2021; Fiddes et al., 2021; van Rensch et al., 2023; Fu et al., 2024). Additionally, this approach of using relatively coarse spatio-temporal data aggregation for defining observed lightning events also helps allow for variations that may occur between different convective systems such as in their movement speed over a region.
2.2 ERA5 reanalysis data
The method is based on calculating a diagnostic of environmental conditions, using CAPE and S06 from reanalysis data. Environments conducive to thunderstorms are indicated at a given location and time when the diagnostic exceeds a threshold value. The method uses spatially varying thresholds of the diagnostic, with the threshold at each location defined to give the same occurrence frequency of diagnostic events to the number of observed events (with lightning data as an observations-based proxy for thunderstorm occurrence at a given location and time). This is the same type of approach used in Dowdy (2020) for the previous dataset.
The ERA5 reanalysis data for CAPE and S06 are on a grid of 0.25° in longitude and latitude, with this grid being used for the BTE dataset as described here. The CAPE and S06 data were smoothed with a ± 3 grid cell moving average applied in both latitude and longitude (i.e., a simple 'boxcar' moving average spanning 1.75°) consistent with the spatial aggregation of lightning observations as described above. The BTE dataset is global in longitude using data from 70°N to 70°S in latitude (noting lightning rarely occur outside of this range), such that it spans all tropical and midlatitude regions globally. This is a larger region than was used for the previous dataset of Dowdy (2020) which was only for Australia. The BTE dataset uses ERA5 data for the period 1979–2023 at 6-h time steps of 0000, 0600, 1200, and 1800 UTC.
2.3 Environmental diagnostic method
Application of this diagnostic method to ERA5 reanalysis was documented in Dowdy and Brown (2023) showing the product of CAPE and S06 was useful for indicating the occurrence of thunderstorm environments. The diagnostic method also includes lower limits of CAPE (10 J.kg−1) and S06 (10 m.s−1), as to not exclude thunderstorms occurring in zero or very low CAPE environments, or in very low wind shear environments, as have been documented by observational studies (King et al., 2017; Miller and Mote, 2018). The diagnostic based on ERA5 reanalysis CAPE and S06 (with lower limits applied for both of those input components) is referred to here as Broadscale Thunderstorm Environment, BTE, calculated as shown in Equation 1.
where CAPE ≥ 10 J.kg−1 and S06 ≥ 10 m.s−1 (i.e., all values lower than those limits are set equal to 10).
Thunderstorm environments are estimated to have occurred when BTE exceeds a threshold. The threshold values are defined by the value of BTE that is exceeded as frequently as the occurrence of the observations-based thunderstorms (i.e., using lightning observations to indicate thunderstorm occurrence as detailed in the section above). This means that the threshold value at each grid point in the reanalysis dataset is set such that the number of thunderstorm environments indicated (i.e., by BTE exceeding the threshold value) is equal to the number of observed thunderstorms (based on lightning observations). Consequently, the method is a form of quantile-quantile matching for calibrating the diagnostic thunderstorm data to be consistent in occurrence frequency with observations-based thunderstorm data at individual locations.
The analysis of the BTE dataset presented in Section 3 is focussed on Probability of Detection (POD; Equation 2). As the threshold used for the diagnostic is that which gives the same number of events as observed at a given location, the number of missed events equals the number of false alarms. Consequently, for this method the False Alarm Ratio (FAR; Equation 3) is equal to 1 – POD (i.e., higher POD corresponds to lower FAR).
Although thunderstorm-related hazards such as lightning can sometimes occur at the same time as the diagnostic exceeds its threshold values, hazards can also occur at other times such as during subsequent hours. This relates to CAPE typically maximizing around the early stages of the lifecycle of a thunderstorm whereas severe weather and hazards such as lightning may be more likely to occur during subsequent stages when the convective system is more mature. As such, for a given location, a time step for which a diagnostic is above its threshold value is considered indicative of the potential for thunderstorm occurrence, with the BTE dataset having a value of 1 for that time step (or a zero value if not), while noting potential for hazards to also occur at other times around this.
The method will result in the same threshold value of a diagnostic regardless of the timing difference between the environmental conditions and the observations-based thunderstorm data. This is because the diagnostic threshold is based on the ranking of its values, with the threshold set to give the same number of indicative lightning events to equal the number of observed lightning events. For example of a single grid cell, the frequency of observed lightning events is the same regardless of the time lag used for the diagnostic, such that the diagnostic threshold is not dependent on the time lag. However, the time lag influences the matching of the diagnostic events to the observed events such as shown by the POD values. See Section 3.1 for further details.
3 Analysis
3.1 Diagnostic thresholds calibrated to observations 2012–2023
Figure 1 shows analysis based on applying the diagnostic method to ERA5 data from 2012 to 2023 (representing the time period of available lightning data for this). Maps are presented for the observed occurrence frequency of thunderstorm environments (Figure 1A) calculated using the method described in section 2.1, the thresholds of the diagnostic (Figure 1B) calculated using the method described in section 2.3, as well as the resultant POD values that indicate how well the thunderstorm environments (as represented by a value of 1 in the BTE dataset) match the observed thunderstorm occurrences (Figure 1C) calculated using Equation 2.
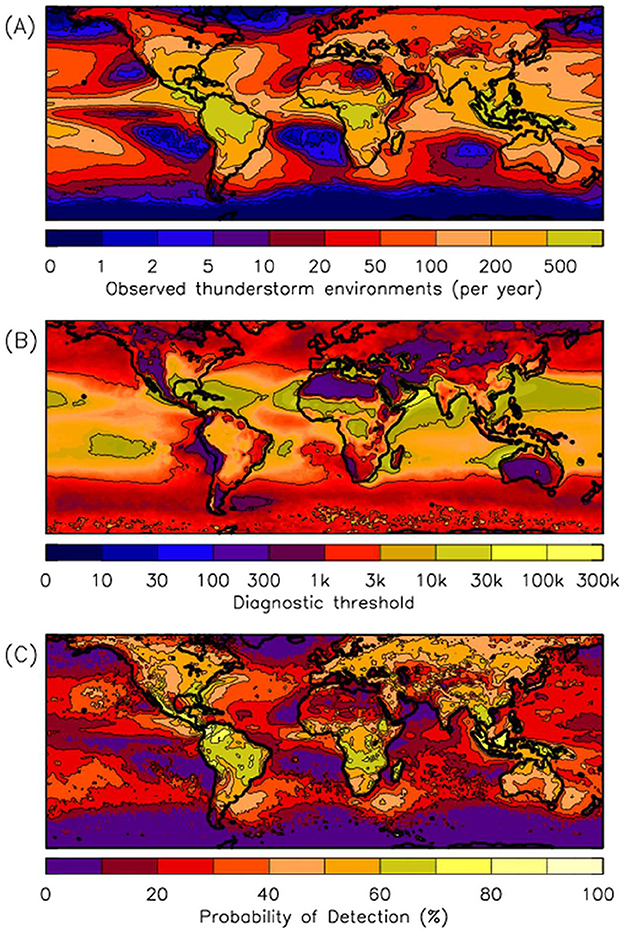
Figure 1. Analysis of the thunderstorm environmental diagnostic. The average annual number of thunderstorm environments is shown (A), using lightning observations aggregated on 6-hourly time steps during the period 2012–2023, calculated following the method as detailed in section 2.1. Threshold values of the diagnostic are presented (B) calculated following the method as detailed in section 2.3. The Probability of Detection (POD) is shown based on using the diagnostic to estimate the observed thunderstorm environment occurrences (C) calculated using Equation 2.
The spatial distribution of observed thunderstorm environments is broadly similar to previous global studies such as Virts et al. (2013) in terms of regions that tend to have the higher numbers of thunderstorm environments occurring, such as around the tropical land regions and the southeast Asia “maritime continent” region (Figure 1A). Regions where very few lightning events occur include the Southern Ocean, some eastern regions of ocean basins, regions of the Arctic Ocean, and small parts of northern Africa around Egypt.
The threshold values of the diagnostic tend to be larger in the tropics, with lower values in the higher latitudes in general (Figure 1B). This diagnostic method correctly indicates the occurrence of thunderstorm environments at a given location about 30–70% of the time throughout the land regions, based on systematically testing this for each 6-hourly time step from 2012 to 2023, as shown by the POD values (Figure 1C). Lower POD values generally occur in maritime regions and regions where the lightning occurren-ce frequency is relatively low (such as northeast Africa as discussed from Figure 1A). The POD values are 45% on average for the entire region shown, including 56% on average for land regions and 36% on average for ocean regions.
As noted previously, there are various fine-scale physical processes associated with thunderstorm formation (such as relating to turbulence and microphysics) that are not able to be accurately simulated by currently available modeling approaches, including for reanalysis data as used here (Droegemeier and Wilhelmson, 1987; Tippett et al., 2015; Hoogewind et al., 2017; Gutowski et al., 2020). Additionally, environmental diagnostic methods are also not intended to provide complete and precise representation of all processes contributing to thunderstorm formation (Brooks et al., 2003; Allen and Karoly, 2014; King et al., 2017; Miller and Mote, 2018; Dowdy, 2020), with POD values in Figure 1C reflecting these limitations in reanalysis data and in environmental diagnostic approaches. Therefore, results should be interpreted accordingly, as an estimate of the occurrence of environmental conditions conducive to thunderstorm formation, with awareness of the uncertainties mentioned above.
The imperfection in data and methods is the reason why the calibration is applied here at each individual grid cell location. As was detailed in Section 2.3, the calibration results in the occurrence frequency of thunderstorm environments indicated by the diagnostic method being equal to the occurrence frequency of the observed thunderstorms based on lightning data. The thunderstorm environments indicated by the diagnostic comprise of correctly identified events (as used to calculate POD from Equation 2) as well as false alarms (as used to calculate FAR from Equation 3), noting that FAR = 1 – POD for the method used here. For example, land regions have a POD of 56% on average for the entire region shown (Figure 1C) such that the FAR is 44%. The BTE dataset therefore comprises both correctly identified events as well as false alarms, noting that the sum of those occurrence frequencies during the period 2008–2023 is equal to the occurrence frequency of observed thunderstorm based on the lightning data (as demonstrated in the following section). False alarms are cases where the product of CAPE and wind shear (as calculated from Equation 1) exceeded the threshold value for a given location, thereby providing an estimated occurrence of an environment conducive to thunderstorm formation, even though lightning was not recorded for that case. There are various reasons why lightning might not be recorded including potential for environments conducive to thunderstorm formation to not always result in lightning occurrence as well as imperfect detection efficiencies of the sensors in the ground-based network used for WWLNN lightning observations (Virts et al., 2013).
The correctly identified thunderstorms using this method account for 65% of all lightning strokes based on the WWLLN data throughout the region, which is higher than the 45% POD value as the method is more successful in indicating thunderstorms with lots of lightning strokes rather than those with relatively few lightning strokes. Various different time lags between the lightning and the diagnostic were checked in this study here. Some improvements were indicated when the diagnostic is lagged earlier than the lightning data, such as for lightning aggregated in the 6-h period after the timing of the diagnostic data (i.e., lightning aggregated from 0000–0559, 0600–1159, 1200–1759 and 1800–2359 UTC) which accounts for 67% of all lightning strokes but still only 45% POD. However, as these differences are found here to be relatively small, a time step for which a diagnostic is above its threshold value is considered indicative of the potential for thunderstorm occurrence, while noting potential for hazards to occur at other times around this including during subsequent hours.
3.2 Application of diagnostic to ERA5 reanalysis 1979–2023
In the previous section, the diagnostic was applied to ERA5 reanalysis data for 2012–2023, as that was the period of available lightning data used to indicate the observed thunderstorm environments. As an example of climate analysis using this dataset, this section examines the average number of thunderstorm environments per year based on applying the diagnostic method to a longer period of ERA5 reanalysis data back to 1979.
Figure 2 presents the average annual number of diagnostic thunderstorm environments for the period 1979–2023, mapped throughout the region covered by the dataset (i.e., all tropical and midlatitude regions globally). The values shown in Figure 2 were calculated by counting at each individual grid cell the total number of thunderstorm environments indicated by the diagnostic method, then dividing that total count value by the number of years (i.e., 44 years from 1979 to 2023), thereby providing the average annual number of diagnostic thunderstorm environments during that time period. This map shows similar features to those seen in the observations-based results for thunderstorm environments (based on lightning occurrence 2012–2023) as was presented in Figure 1A. Similar to what was noted in relation to Figure 1A, the features in Figure 2 are broadly consistent with previous studies (Virts et al., 2013; Dowdy, 2020; Dowdy and Brown, 2023). This includes regions with higher amounts of thunderstorms particularly around tropical land regions and southeast Asia maritime regions, as well as regions having very few thunderstorms in the Southern Ocean, some eastern regions of ocean basins, regions of the Arctic Ocean and small parts of northern Africa around Egypt.
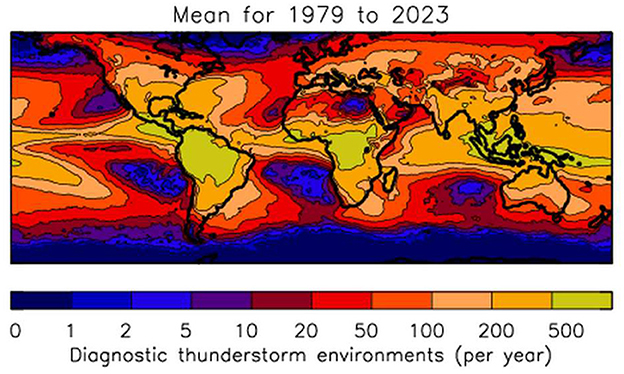
Figure 2. The average annual number of thunderstorm environments indicated by the diagnostic method applied to ERA5 reanalysis data for the period 1979–2023.
The previous dataset of thunderstorm environments (Dowdy, 2020) was only for the Australian region as it used lightning observations from an Australian sensor network, whereas this update uses the WWLLN network of lightning sensors that provide global coverage. This means that comparisons between the previous dataset and the updated dataset can be done for the Australian region. Although some differences are expected, including due to using different data for the lightning and for the reanalysis, the results show general similarities of features. For example, as shown in Figure 1 here, as well as Figure 1 of Dowdy (2020) for the previous dataset, the occurrence frequencies of events based on lightning observations show higher values typically in the northern and eastern parts of Australia (ranging from about 200 to 500 events per year in most locations), with the lower values in the southern and southwest regions (ranging from about 50 to 100 events per year in most locations), based on the 6-hourly time steps used. The diagnostic threshold values for Australia range from about 300 to 10,000 here (Figure 1B) which is somewhat lower than for the previous version of the dataset where the threshold values for Australian locations ranged from about 1,000 to 50,000, with differences in threshold value expected due to the use of different reanalysis datasets. The POD values over Australia range from about 30% to 70% in most locations and tend to be somewhat higher in northern regions with lower values in parts of inland Australia. The resultant occurrence frequencies of thunderstorm environments based on the diagnostic method is similar in both cases, associated with the calibration method applied to match the occurrence frequency of observed events based on lightning data. For example, this is shown in Figure 2 here for the updated dataset and in Figure 1D of Dowdy (2020) for the previous dataset, both of which show occurrence frequencies consistent with the observations-based occurrence frequencies (i.e., about 200–500 events per year in northern and eastern Australia, as well as about 50–100 events per year in southern and southwest regions based on the 6-hourly time steps used).
As detailed in Dowdy and Brown (2023), the diagnostic method was designed to be suitable for application to coarse-resolution gridded data including reanalyses as well as global climate model (GCM) data. An example of applying the diagnostic method to data from a relatively old set of GCMs [known as CMIP5: Taylor et al. (2012)] is presented in Supplementary material. This is mentioned here in relation to potential future steps that could build on this approach including to also apply the diagnostic method to data based on the current set of GCMs known as CMIP6 (O'Neill et al., 2016).
The BTE dataset described in this report, based on applying the diagnostic method to ERA5 reanalysis, was designed to be useful for broadscale climate analysis similar to how the previous dataset version was used. It is intended that this updated dataset will be useful for subsequent research, such as potentially for results on long-term climate trend as well as for results on how modes of atmospheric and oceanic climate variability such as the El Nino-Southern Oscillation (ENSO) may influence thunderstorm conditions (Dowdy, 2020; Pepler et al., 2020, 2021; Canadell et al., 2021; Fiddes et al., 2021; van Rensch et al., 2023; Fu et al., 2024). Further research could potentially examine other diagnostics, noting a wide range that have previously been considered relating to thermodynamics and dynamics of thunderstorm formation such as various metrics relating to humidity (e.g., profiles of dewpoint or relative humidity), convective inhibition (CIN), thunderstorm initiation mechanisms for triggering initial updrafts, lifted condensation level (LCL), level of free convection (LFC), (Droegemeier and Wilhelmson, 1987; Doswell III, 2001; Brooks et al., 2003; Allen and Karoly, 2014; Tippett et al., 2015; Hoogewind et al., 2017; King et al., 2017; Miller and Mote, 2018; Luhar et al., 2021; Dowdy and Brown, 2023). Some studies such as those mentioned here show that the more severe types of storms such as mesoscale convective systems and supercells other have favorable conditions that include dynamic wind aspects (e.g., as indicated from storm relative helicity and associated hodograph analysis results), however, such analysis of severe storm types is not intended in the scope of this report. This BTE dataset is not designed to specifically represent severe thunderstorms in contrast to some other studies [e.g., Allen and Karoly (2014)], as it is designed to provide estimates of environments conducive to thunderstorm formation as represented by CAPE and vertical wind shear through the world using the new ERA5 reanalysis dataset. This BTE dataset could also potentially be updated further in the future, such as with more data from subsequent years as they become available.
Data availability statement
Data can be obtained from Zenodo via doi: 10.5281/zenodo.14241957. Data are also available on request from the corresponding author. Code used for data processing is publicly available at: https://github.com/andrewbrown31/SCW-analysis/tree/master.
Author contributions
AD: Conceptualization, Data curation, Formal analysis, Funding acquisition, Investigation, Methodology, Project administration, Resources, Software, Supervision, Validation, Visualization, Writing – original draft, Writing – review & editing. AB: Data curation, Resources, Software, Writing – review & editing.
Funding
The author(s) declare financial support was received for the research, authorship, and/or publication of this article. Funding for this research was provided through the University of Melbourne including with support from the Centre of Excellence for Climate Extremes (CLEX), the Melbourne Energy Institute (MEI) and the Zee Lab in collaboration with the Victorian Government.
Conflict of interest
The authors declare that the research was conducted in the absence of any commercial or financial relationships that could be construed as a potential conflict of interest.
Generative AI statement
The author(s) declare that no Gen AI was used in the creation of this manuscript.
Publisher's note
All claims expressed in this article are solely those of the authors and do not necessarily represent those of their affiliated organizations, or those of the publisher, the editors and the reviewers. Any product that may be evaluated in this article, or claim that may be made by its manufacturer, is not guaranteed or endorsed by the publisher.
Supplementary material
The Supplementary Material for this article can be found online at: https://www.frontiersin.org/articles/10.3389/fclim.2025.1539873/full#supplementary-material
References
Allen, J. T., and Karoly, D. J. (2014). A climatology of Australian severe thunderstorm environments 1979-2011: inter-annual variability and ENSO influence. Int. J. Climatol. 34:3667. doi: 10.1002/joc.3667
Brooks, H. E., Lee, J. W., and Craven, J. P. (2003). The spatial distribution of severe thunderstorm and tornado environments from global reanalysis data. Atmos. Res. 67, 73–94. doi: 10.1016/S0169-8095(03)00045-0
Bryan, G. H., Wyngaard, J. C., and Fritsch, J. M. (2003). Resolution requirements for the simulation of deep moist convection. Month. Wea. Rev. 131, 2394–2416. doi: 10.1175/1520-0493(2003)131<2394:RRFTSO>2.0.CO;2
Canadell, J. G., Meyer, C. P., Cook, G. D., Dowdy, A., Briggs, P. R., Knauer, J., et al. (2021). Multi-decadal increase of forest burned area in Australia is linked to climate change. Nat. Commun. 12:6921. doi: 10.1038/s41467-021-27225-4
Dee, D. P., Uppala, S. M., Simmons, A. J., Berrisford, P., Poli, P., Kobayashi, S., et al. (2011). The ERA-Interim reanalysis: configuration and performance of the data assimilation system. Q. J. R. Meteorol. Soc. 137, 553–597. doi: 10.1002/qj.828
Doswell III, C. A. (2001). Severe convective storms—an overview. Severe convective storms. Am. Meteorol. Soc. 2001, 1–26. doi: 10.1007/978-1-935704-06-5_1
Dowdy, A., and Brown, A. (2023). Environmental Indicators for Thunderstorms, Lightning and Convective Rainfall. Australian Government Bureau of Meteorology. Bureau of Meteorology, Melbourne, VIC, Australia.
Dowdy, A. J. (2020). Climatology of thunderstorms, convective rainfall and dry lightning environments in Australia. Clim. Dyn. 54, 3041–3052. doi: 10.1007/s00382-020-05167-9
Droegemeier, K., and Wilhelmson, R. (1987). Numerical simulation of thunderstorm outflow dynamics. Part I: outflow sensitivity experiments and turbulence dynamics. J. Atmos. Sci. 44, 1180–1210. doi: 10.1175/1520-0469(1987)044<1180:NSOTOD>2.0.CO;2
Fiddes, S., Pepler, A., Saunders, K., and Hope, P. (2021). Redefining southern Australia's climatic regions and seasons. J. South. Hemisph. Earth Syst. Sci. 71, 92–109. doi: 10.1071/ES20003
Fu, G., Chiew, F. H., Post, D. A., Pepler, A., and Rudeva, I. (2024). Attributions of rainfall anomalies to weather systems and their spatial and temporal variabilities: a case study of Victoria in Southeast Australia. Int. J. Climatol. 39, 18–30. doi: 10.1002/joc.8644
Gutowski, W. J., Ullrich, P. A., Hall, A., Leung, L. R., O'Brien, T. A., Patricola, C. M., et al. (2020). The ongoing need for high-resolution regional climate models: process understanding and stakeholder information. Bull. Am. Meteorol. Soc. 101, E664–E683. doi: 10.1175/BAMS-D-19-0113.A
Hersbach, H., Bell, B., Berrisford, P., Hirahara, S., Horanyl, A., Nicolas, J., et al. (2020). The ERA5 global reanalysis. Q. J. R. Meteorol. Soc. 146, 1999–2049. doi: 10.1002/qj.3803
Hoogewind, K. A., Baldwin, M. E., and Trapp, R. J. (2017). The impact of climate change on hazardous convective weather in the United States: insight from high-resolution dynamical downscaling. J. Clim. 30, 10081–10100. doi: 10.1175/JCLI-D-16-0885.1
King, J. R., Parker, M. D., Sherburn, K. D., and Lackmann, G. M. (2017). Rapid evolution of cool season, low-CAPE severe thunderstorm environments. Wea. Forecast. 32. 763–779. doi: 10.1175/WAF-D-16-0141.1
Luhar, A. K., Galbally, I. E., Woodhouse, M. T., and Abraham, N. L. (2021). Assessing and improving cloud-height-based parameterisations of global lightning flash rate, and their impact on lightning-produced NO x and tropospheric composition in a chemistry–climate model. Atmosph. Chem. Phys. 21, 7053–7082. doi: 10.5194/acp-21-7053-2021
Miller, P. W., and Mote, T. L. (2018). Characterizing severe weather potential in synoptically weakly forced thunderstorm environments. Nat. Hazards Earth Syst. Sci. 18, 1261–1277. doi: 10.5194/nhess-18-1261-2018
O'Neill, B. C., Tabaldi, C., van Vuuren, D. P., Eyring, V., Friedlingstein, P., Hurtt, G., et al. (2016). The scenario model intercomparison project (ScenarioMIP) for CMIP6. Geosci. Model Dev. 9, 3461–3482. doi: 10.5194/gmd-9-3461-2016
Pepler, A. S., Dowdy, A. J., and Hope, P. (2021). The differing role of weather systems in southern Australian rainfall between 1979–1996 and 1997–2015. Clim. Dyn. 56, 2289–2302. doi: 10.1007/s00382-020-05588-6
Pepler, A. S., Dowdy, A. J., van Rensch, P., Rudeva, I., Catto, J. L., and Hope, P. (2020). The contributions of fronts, lows and thunderstorms to southern Australian rainfall. Clim. Dyn. 55, 1489–1505. doi: 10.1007/s00382-020-05338-8
Taylor, K. E., Stouffer, R. J., and Meehl, G. A. (2012). An overview of CMIP5 and the experiment design. Bull. Amer. Met. Soc. 93, 485–498. doi: 10.1175/BAMS-D-11-00094.1
Tippett, M. K., Allen, J. T., Gensini, V. A., and Brooks, H. E. (2015). Climate and hazardous convective weather. Curr. Clim. Change Rep. 1, 60–73. doi: 10.1007/s40641-015-0006-6
van Rensch, P., Turner, M., Saft, M., Peel, M. C., Peterson, T. J., Hope, P., et al. (2023). The role of weather system changes and catchment characteristics in the rainfall-runoff relationship shift in Victoria, Australia. Water Resourc. Res. 59:e2022WR033692. doi: 10.1029/2022WR033692
Keywords: climate, modeling, hazards, storms, environment, convection, extremes
Citation: Dowdy A and Brown A (2025) Broadscale thunderstorm environment dataset intended for climate analysis. Front. Clim. 7:1539873. doi: 10.3389/fclim.2025.1539873
Received: 05 December 2024; Accepted: 23 January 2025;
Published: 18 February 2025.
Edited by:
Jung-Eun Chu, City University of Hong Kong, Hong Kong SAR, ChinaReviewed by:
Xuguang Sun, Nanjing University, ChinaN. Umakanth, Indian Institute of Tropical Meteorology (IITM), India
Copyright © 2025 Dowdy and Brown. This is an open-access article distributed under the terms of the Creative Commons Attribution License (CC BY). The use, distribution or reproduction in other forums is permitted, provided the original author(s) and the copyright owner(s) are credited and that the original publication in this journal is cited, in accordance with accepted academic practice. No use, distribution or reproduction is permitted which does not comply with these terms.
*Correspondence: Andrew Dowdy, YW5kcmV3LmRvd2R5QHVuaW1lbGIuZWR1LmF1