
94% of researchers rate our articles as excellent or good
Learn more about the work of our research integrity team to safeguard the quality of each article we publish.
Find out more
ORIGINAL RESEARCH article
Front. Clim., 13 February 2025
Sec. Climate Services
Volume 7 - 2025 | https://doi.org/10.3389/fclim.2025.1529082
 Jose A. Marengo1,2,3*
 Mabel Calim Costa1
 Ana Paula Cunha1,2
 Jhan-Carlo Espinoza4,5Juan C. Jimenez6
 Renata Libonati7,8Vitor Miranda6,9
 Isabel F. Trigo7,9Juan Pablo Sierra10Joao L. Geirinhas8Andrea M. Ramos11Milagros Skansi12Jorge Molina-Carpio13Roberto Salinas14
In the last 40 years, trends in heat wave frequency, intensity, and duration have increased steadily around the world. These intense heat waves were characterized persistent atmospheric blocking episode, with a continuous presence of a warm air mass and lack of rain for several consecutive days, that contributed to pronounced positive temperature anomalies, reinforced by extremely low soil moisture, and warm and drought conditions. The year 2023 was the warmest year on record, and the global average temperature was +1.45°C above pre-industrial (1850–1900) values worldwide. In South America 2023 was the warmest since 1900, with 0.81°C above the 1991–2020 reference period. Central South America experienced a sequence of heatwaves series being the most intense during the autumn and spring of 2023. From August to December 2023, the meteorological services of Brazil, Argentina, Paraguay and Bolivia reported record-high maximum temperatures in this period in several stations east of the Andes and identified 7 heat waves episodes that affected all these countries. The large-scale circulation patterns show that heatwaves were characterized by an anomalously high-pressure system that facilitated the formation of a heat dome through dry, hot air columns over a warm and dry soil. Several locations experienced temperature of about 10°C above normal, and some locations reported maximum temperatures above 40°C for several days in a row. These heat waves aggravated the drought over Amazonia during the second half of 2023, during an El Niño year. Compound drought-heat favored hydrological drought, while the increased dryness amplified the risk of fires.
Human-induced global warming has already caused multiple changes in the climate system, including increased intensity, duration, and frequency of extreme heat events (Seneviratne et al., 2014, 2023). Heatwaves (HWs), defined as a period where local excess heat persists over a sequence of consecutive sweltering days and nights, have spread rapidly into new regions of the globe at unseasonable times of the year (Perkins-Kirkpatrick and Lewis, 2020; Chitsaz et al., 2023). With continuous further global warming, it is expected an increased HW intensity, frequency, and duration (IPCC, 2021, 2023; Barriopedro et al., 2023). HWs may span several days to several weeks and are significant causes of weather-related mortality, affecting developed and developing countries alike. A HW is not as destructive as other natural hazards, such as hurricanes and flash floods. However, they amplify many risks, such as health-related or economic risks, including increased human mortality (Zhao et al., 2019; Vicedo-Cabrera et al., 2021; Hartinger et al., 2023; Monteiro dos Santos et al., 2024a, 2024b; Wang et al., 2023), premature births (Libonati et al., 2022), drought (Geirinhas et al., 2021), water quality deterioration (Larbey and Weitkamp, 2020), wildfire (Ruffault et al., 2020; Libonati et al., 2022), smoke (Hertig et al., 2020; Monteiro dos Santos et al., 2024b), power shortages (McEvoy et al., 2012), and agricultural losses (Brás et al., 2021), as well as impacts in professions particularly exposed to heat, such as agricultural or construction workers (Orlov et al., 2020). Between 2000 and 2019, there was an average of 36,695 heat-related excess deaths per year worldwide (WMO, 2024). Globally, population exposure to HW will continue to increase with additional warming, with geographical solid differences in heat-related mortality affecting those with the least resources. It is estimated that HWs will account for nearly 1.6 million deaths by 2050—mainly in the highest-risk areas, including the US, Central America, southern and western Africa, the Middle East, India, Southeast Asia, Pakistan, China and northern Australia (Ballester et al., 2023; World Economic Forum, 2024; Ullah et al., 2019, 2022, 2023).
The frequency, intensity and duration of HWs have, as well as air temperatures have increased significantly during the recent decades in various regions of South America, mainly during summer and spring seasons (Skansi et al., 2013; Donat et al., 2013, Simões dos Reis et al., 2019; Bitencourt et al., 2016, 2020; Geirinhas et al., 2019; Xu et al., 2019; Geirinhas et al., 2017; Regoto et al., 2021; Araujo et al., 2022; Miranda et al., 2024; WMO, 2024). Dunn et al. (2024) show that HW amplitude and duration increased in tropical and subtropical South America from 1901 to 2018. Monteiro dos Santos et al. (2024b) showed a two-fold increment in the frequency and severity of HW events from the 1970s to the 2010s over the major metropolitan regions of Brazil, mainly in São Paulo, Manaus, Recife, and Rio de Janeiro. Geirinhas et al. (2021, 2022) highlighted that HWs are becoming increasingly linked with drought episodes in Southeast Brazil, a pattern also observed in the Amazon, Cerrado, and Pantanal as demonstrated by Libonati et al. (2021, 2022).
South America has been witnessing several intense heat events in recent years. Zhang and Xie (2023) explored the forcing mechanisms of a long-duration and high-intensity HW event that occurred in northeastern Argentina, Uruguay, Paraguay, and southern Brazil from 9 to 16 January 2022, during a La Niña year. Marengo et al. (2021) and Libonati et al. (2022) and references therein investigated the intensity and geographical extension of an HW that affected, from 23 September to 15 October 2020, central South America and particularly the region extending from southern Peruvian Amazon to southeastern Brazil. Some meteorological stations in those countries recorded maximum temperatures up to 12°C above the 1981–2010 climatology, establishing new long-term record values since the beginning of data collection. Geirinhas et al. (2023) and Marengo et al. (2024) demonstrated that these hot spells co-occurred with exceptional soil dryness. Record-breaking soil desiccation covered a large area within central South America and resulted from flash drought episodes that were triggered over already established conditions of long-term soil dry-out. According to observations, Costa and Rodrigues (2021) showed that the frequency, duration and intensity of HWs in Amazonia has increased. Moreover, co-occurring conditions of severe heat and dryness in the region have become more common, paving the way for a mutual re-amplification of both extremes through enhanced land-atmosphere feedback (Geirinhas et al., 2021; Libonati et al., 2022). In line with these results, a record of drought and warmth in the Amazon basin was reported in 2023 (Espinoza et al., 2024). Rivera et al. (2023) show that a large area, including the central-northern part of Argentina, southern Bolivia, central Chile, and most of Paraguay and Uruguay, experienced record-breaking temperatures during two consecutive HWs in late November and early December 2022.
The year 2023, characterized by the presence of an El Niño event, global temperatures reached a new peak, with the average being 1.45°C above pre-industrial levels (1850–1900), beating the previous record set in 2016 by +0.16°C. The past 9 years, 2015–2023, are the nine warmest years on record. In Latin America and the Caribbean, 2023 was the warmest year on record and was characterized by the presence of an El Niño event. Warming was about 0.82°C above the 1991–2020 average. On numerous occasions during the year, the region experienced extreme heat followed by exceptional drought conditions and severe wildfires, which were responsible for excessive heat-related mortality (WMO, 2024). In fact, throughout 2023, a series of HWs worldwide (Perkins-Kirkpatrick et al., 2024) impacted human health (WMO, 2024; Zachariah et al., 2023; Barcellos, 2024). Perkins-Kirkpatrick et al. (2024) estimated that most of the world experienced at least 20 more HW days in 2023 than the 1991–2020 average. Considering the above-described HW conditions that severely affected Latin America during 2023—the warmest year on record, this paper provides a detailed analysis of observed features of HWs that affected Brazil, Bolivia, Paraguay, and Argentina during August–December 2023. In a collaborative effort with the meteorological services of these countries, we use station data and global data sets from maximum and minimum temperature and atmospheric circulation.
The driving mechanisms of HW depend on the region where they occur. In extratropics, HWs are typically forced by anomalously long-lived quasi-stationary anticyclonic flow anomalies (Domeisen et al., 2022), associated with high amplitude upper tropospheric ridges or atmospheric blocking systems (Sousa et al., 2021). These persistent circulation anomalies lead to a strong temperature escalation through enhanced radiative heating, horizontal warm advection, adiabatic heating due to strong subsidence, heat accumulation in the atmospheric boundary layer and enhanced sensible heat fluxes promoted by co-occurring conditions of soil dry-out (Miralles et al., 2014; Schumacher et al., 2019; Sousa et al., 2021; Geirinhas et al., 2022; Zhang and Xie, 2023). In summer heat waves and droughts form below the blocking anticyclone primarily via large-scale subsidence that leads to cloud-free skies and, thus, persistent shortwave radiative warming of the ground (Kautz et al., 2022).
This study is intended to investigate the characteristics of the 2023 HWs and the day-to-day variability of maximum temperatures (reaching the 90th percentile) in central South America, identify their duration and intensity, and study the circulation patterns of these HWs. In addition, we investigate trends in HW characteristics in the continent over the last 4 decades. Since some of these HWs co-occurred with a drought in Amazonia, we investigate some of these events as drought-heat compound. The novelty of this work is to provide new insights about the genesis and evolution of these HWs in the warmest year in history, considering circulation changes leading to extreme heat (atmospheric forcing) in a situation of extreme drought (land surface forcing) in the region. This information can help authorities understand the characteristics and impacts of HWs that may be useful for improving the prediction and mitigation of HW and their impacts in a warmer climate.
This study used daily minimum and maximum surface air temperatures from 54 meteorological stations in Brazil, Bolivia, Paraguay, and Argentina. The datasets were obtained from the National Institute of Meteorology in Brazil (INMET),1 the National Meteorological and Hydrological Service of Bolivia (SENAMHI-senamhi.gob.bo), the National Meteorological Service of Argentina (SMN),2 and the Department of Meteorology and Hydrology of Paraguay (DMH).3 As detected by these meteorological services, seven HW episodes occurred during this period in the region. New historical records of maximum temperatures were established during these HW events in 2023, some of which were the warmest in decades. The meteorological services of the region’s countries issued heat stress alerts for HW in cities, which were also reported by local media (newspapers, websites). This data allowed for identification of warm spells and HWs daily across the region of central South America from August 1 to December 31, 2023. The baseline to calculate anomalies is the 1991–2020 long-term mean (LTM) adopted by the WMO. The respective meteorological services that provided the data have their own systems for quality control and data homogenization. The10 representative stations were selected because they do not show missing data.
The Climate Prediction Center CPC Global Unified Temperature data were used to obtain daily global gridded maximum and minimum temperature at 0.5 × 0.5° resolution from 1 January 1979 to the present. CPC data is provided by the NOAA PSL, Boulder, Colorado, USA.4 As shown by Satgé et al. (2023) and Kew et al. (2023), while there is a high level of confidence in the NOAA-CPC Global Unified Temperature data used to carry out the analysis, these do not capture very local records, many of which were broken during the heat episodes.
Composites of atmospheric circulation anomalies, used to characterize the dynamical forcing mechanisms responsible for the HWs that affected South America during 2023, were computed using reanalysis data from the European Centre for Medium-Range Weather Forecasts ECMWF Reanalysis Version 5 (ERA5). ERA5 reanalysis provides land/sea and atmospheric fields at hourly time-steps and spatial grids of 0.25° from 1950 to the present (Hersbach et al., 2018, 2020, 2023). We calculated the horizontal wind anomalies at 850 hPa concerning the climatology for each case study to analyze the synoptic-scale circulation during HW events and their precursor conditions. For each identified HW, we averaged the circulation for the days of the event and the 3 days before each event (hereafter “pre-event”). For this purpose, the information of the zonal and meridional wind components at 850 hPa at 0 h GMT from the ERA5 reanalysis was used. ERA5 is a state-of-the-art reanalysis with a spatial resolution of ~30 km and an hourly temporal resolution (Hersbach et al., 2020). Geopotential height data at 500 hPa and air temperature at 850 hPa were used for each case study to complement the view of the atmospheric dynamics. The same methodology was applied to selected surface variables, specifically sensible heat flux, soil moisture in the top 7 cm, and 2 m temperature. Data for these variables were downloaded every 3 h, then averaged daily, with the maximum daily temperature at 2 m also calculated. As additional data we use monthly anomalies for 2023 of 2-meter maximum temperature (°K) and volumetric soil water layer 1 (m3/m3).
In this study, we adopt the definition established by WMO (2024), a definition that has practical applications and has been used widely in several studies worldwide, including those in Brazil (Perkins et al., 2012; Geirinhas et al., 2018; Lavaysse et al., 2018; Marengo et al., 2021; Coronato et al., 2024; Firpo et al., 2012; Feron et al., 2019; Lipfert et al., 2024; Valverde and Barbio, 2023). A HW, as per this definition, is a period of unusually hot weather that persists for at least three consecutive days during the warm period of the year, considering the local climatological conditions. Accordingly, HWs were defined as periods characterized by daily maximum and minimum air temperatures above the corresponding climatological 90th percentile for the month for three or more consecutive days (Marengo et al., 2021). Based on the standard base period 1991–2020, the climatological percentile thresholds are used throughout this study. It is worth noting that the meteorological services of Brazil, Paraguay, Bolivia, and Argentina also use similar definitions for HWs for their operational activities, highlighting our research immediate relevance and usefulness of our research.
Figure 1 shows periods with a sequence of warm spells (<3 days where the maximum and minimum temperature reached the 90th percentile) and HWs (at least three or more consecutive days where the maximum and minimum temperature reached the 90th percentile) for the four countries. This was done using data from 54 stations in Brazil, Paraguay, Bolivia, and Argentina. We applied the criteria explained in Section 2.2 to define an HW. Based on that, we chose a sequence of days when 7 extended HWs affected all countries: Event 1: August 1–12, Event 2: August 19–September 1, Event 3: September 16–30, Event 4: October 3–8, Event 5: October 15–25, Event 6: November 6–21, and Event 7: December 6–19, 2023.

Figure 1. Simultaneous occurrence of HWs shown in red squares. Warm spell events shown in grey box in isolated or non-consecutive days exceed the corresponding climatological 90th are also presented. Hatched boxes mean no data is available. Data comes from stations in the region provided by INMET (Brazil), SMN (Argentina), SENAMHI (Bolivia), and DMH (Paraguay). The detection of an HW depends partially on the maximum length in days of the time gap between HWs, so we consider a 3-day gap. The selected HW case studies are shown in the figure in green frames.
The HW indices used in this study are shown in Table 1 and were defined by Frich et al. (2002) and Dunn et al. (2024). They were computed using daily maximum and minimum temperatures applied in 10 representative locations in central South America, using the CPC NOAA temperature data set extrapolated for the latitude-longitude nearest point of each station.
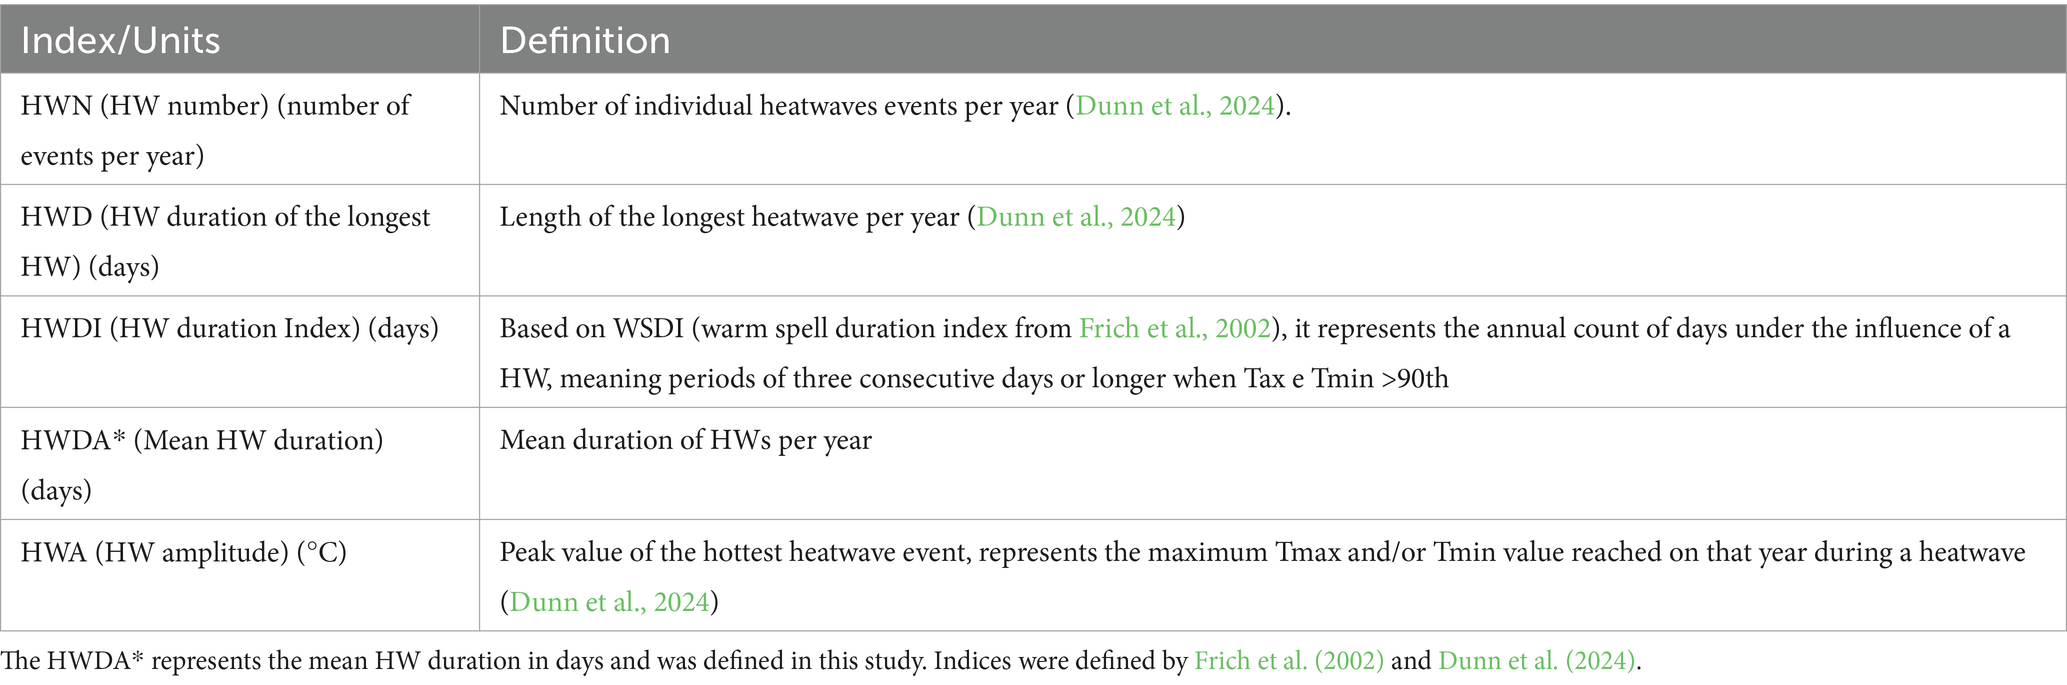
Table 1. HW indices used in this study.
The calculation for the base period (1991–2020) requires a bootstrap procedure to avoid possible inhomogeneity across the in-base and out-base periods, as described in Zhang et al. (2005). These indices are calculated using the CPC Global Unified Temperature data NOAA data for a grid box nearest to each meteorological station’s location provided by the four countries’ meteorological services. The Theil-Sen estimator is a trend based on the median of slopes of all pairs of lines (Theil, 1950; Sen, 1968) from 1 January 1979 to 31 December 2023 at each location. The Theil-Sen trend is more robust and less sensitive to outliers compared to a simple linear regression (Fernandes and Leblanc, 2005). The Mann-Kendall MK test (Mann, 1945) was used to test the existence of a significant trend (significance level of p < 0.05). The MK test is a non-parametric test appropriate for non-normal distributions.
The HWMId index is defined by Russo et al. (2014) as the maximum magnitude of the HW in a year. The identification of HWs over our region of interest, together with the respective magnitude is based on ERA5 2 m maximum temperature. Following previous works (Perkins et al., 2012; Russo et al., 2014; Xie et al., 2020): first, the 90th percentile of maximum air temperature (CTX90pct) of each day of the year is estimated over a 15-day window centered on the respective calendar day; these daily 90th percentiles are estimated over the 1991–2020 period; HWs occur whenever the daily maximum 2 m temperature exceeds the respective CTX90pct for at least 3 consecutive days. In short, for a given day d, the CTX90pct threshold is the 90th percentile of the set of data Ad defined by Equation 1:
Where ⋃ denotes the union of sets and Ty, i is the daily Tmax of the da I in the year y.
The HWMId magnitude is then defined in Equation 2 as the sum of the magnitude of the consecutive days composing a HW, with daily magnitude calculated as follow:
Where Td is the maximum daily temperature on day d of the HW, T30y25p and T30y75p are the 25th and 75th percentile values, respectively, of the time series composed of 30-year annual Tmax within the reference period 1991–2020, estimated as the respective percentiles over dataset Ad (Equation 1). The slope of the Md (Td) is defined at each specific location depending on T30y75p and T30y25p which are different in places with different climates.
A compound weather or climate event results from the combination of multiple drivers and/or hazards that contribute to societal or environmental risk (Seneviratne et al., 2014; Zscheischler et al., 2018; Catto and Dowdy, 2021). Here, a compound drought-heat event was defined as a HW episode that occurs under a month with drought conditions [i.e., a month with an associated Standardized Precipitation Index (SPI < −1)] (Seneviratne et al., 2014; Geirinhas et al., 2021; Zhang et al., 2022). The key to determining occurrences of compound drought-heat events relies on precipitation trends since, in a warmer climate, local warming will be large enough that droughts will always coincide with at least moderately hot extremes (Bevacqua et al., 2022).
We define drought-heat compound events considering drought conditions, as defined by Standardized Precipitation Index SPI < −1 (McKee et al., 1993), and HW events, as identified using the Heatwave Duration Index (HWDI) defined in Table 1. SPI < −1 includes categories extremely dry, severely dry and moderately dry categories. To quantify the precipitation deficit, we used the SPI defined from the rainfall dataset from CPC NOAA. A selected parametric distribution determines its accuracy and is designed to quantify the precipitation deficit for multiple scales, reflecting drought’s impact on the availability of different water resources (WMO, 2024). Drought categories derived from SPI (abnormally, moderate, severe, extreme, and exceptional drought) are selected to be evaluated under HW conditions over time and space.
The compound events here coincide with the drought categories and HW conditions (Calim Costa et al., 2024). The compound is built with SPI-3, which compares the precipitation over a specific 3-month period with the precipitation totals from the same 3-month period for all the years included in the historical record. This was chosen to reflect the short and medium-term moisture conditions and the sum of days with HW (HWDI). The area of the compound is the match between extreme categories of SPI-3 and HW duration above 2 weeks. The 3 months drought memory described by SPI-3 show a greater extent in the area combined with the HW duration, which means a greater extent of combined effect. The seasonal scale of drought reflects better the surface conditions that enable and favor the HW events.
Most northern and central South America were affected by heatwaves, with areas impacted by high temperatures A recently published report from the World Meteorological Organization (WMO, 2024) showed that the annual mean temperature anomalies during 2023 in central South America varied from +1.0°C to +2.5°C relative to 1991–2000. In Marengo et al. (2024), the observed mean warming in 2023 for Paraguay, Peru, Bolivia, and Brazil reached +1.63°C (relative to 1991–2020). In 2023, Brazil, Peru, Bolivia, Paraguay, and Argentina recorded their highest September temperatures after hot winter months. Temperatures have been above 40°C in parts of Brazil during the first week of September (INMET, 2023). From the total of 54 stations, we selected a subgroup of 10 stations representative of each country for the trend analysis. Figure 2 shows a time series of Tmax and Tmin from these 10 stations during August–December 2023. There is good agreement between observed and CPC-NOAA derived maximum and minimum temperatures, except for the Bolivian stations that show slight underestimation. Overall, the CPC-NOAA data captures relatively well the daily temperature variability in those and all stations relatively well. In addition, Table 2 shows the observed highest daily Tmax from August to December 2023 in some stations in Bolivia, Argentina, Paraguay and Brazil, as well as the date of the highest temperature and the respective 1991–2020 LTM.
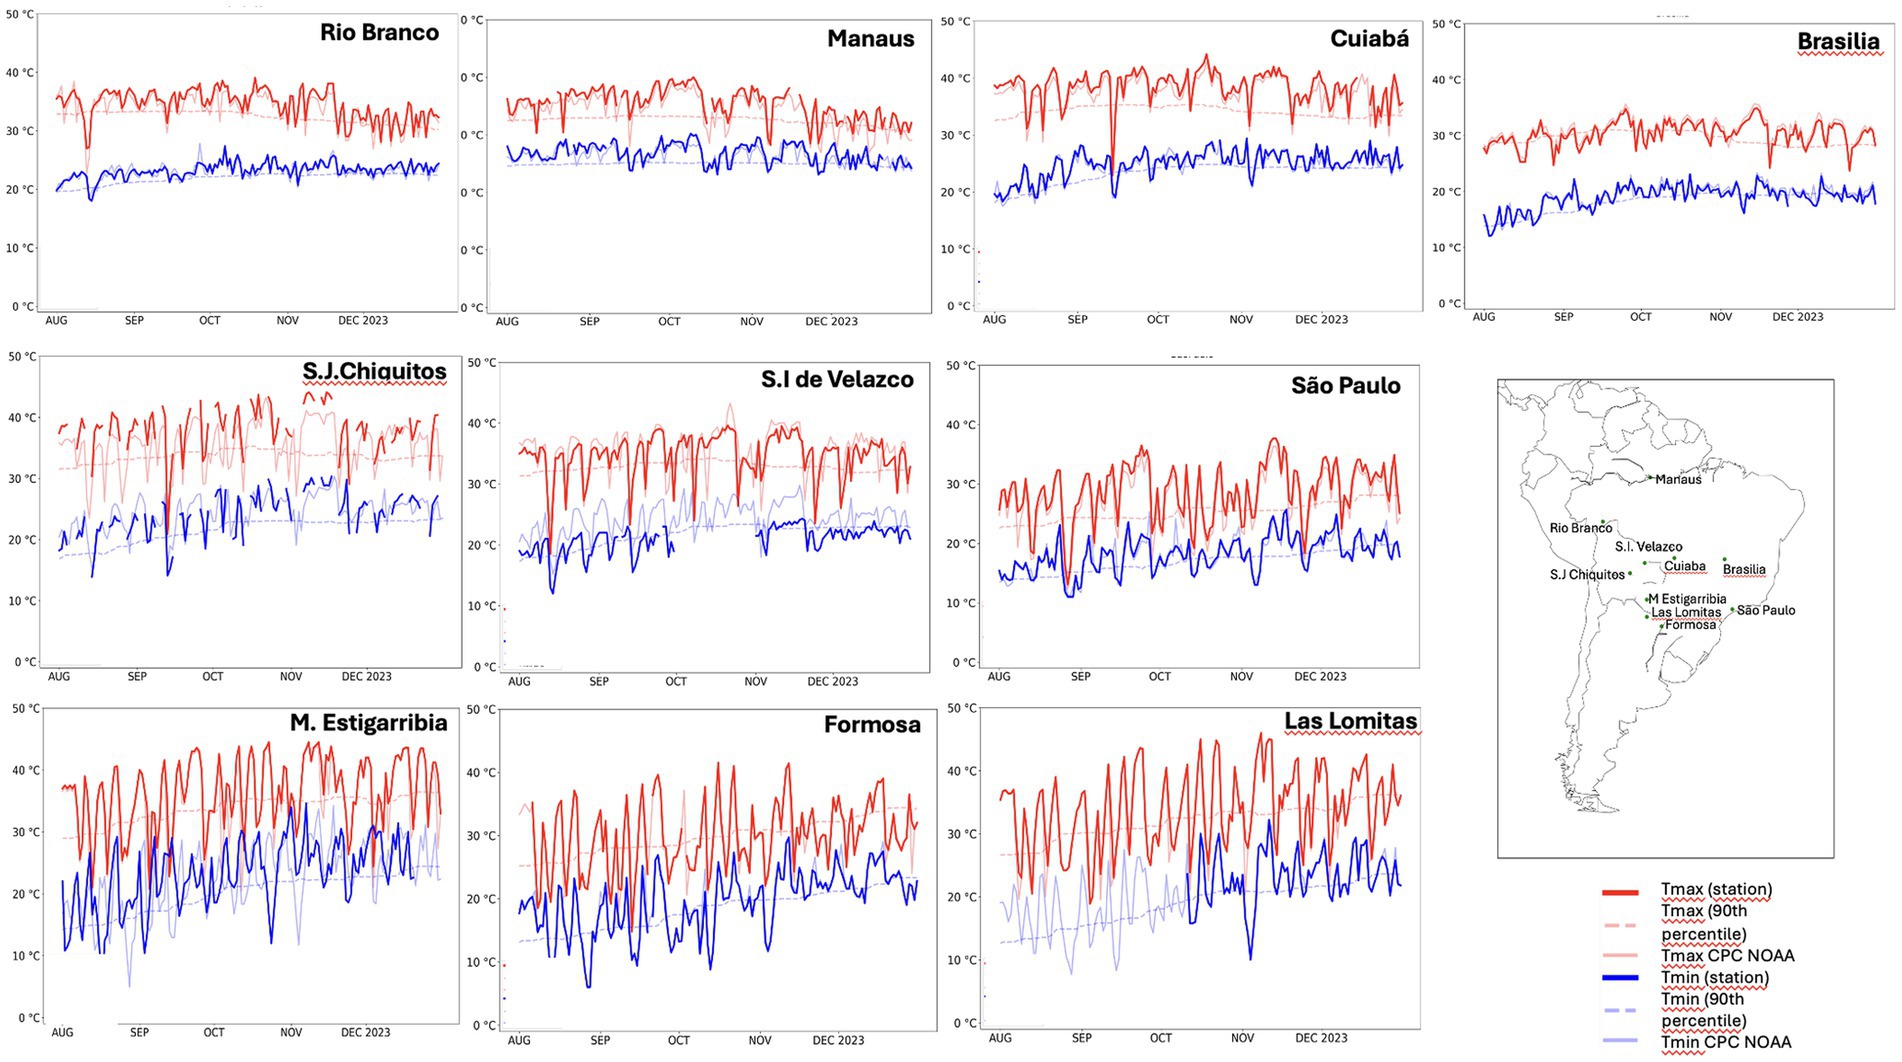
Figure 2. Day-to-day variability of maximum and minimum temperatures between August 1 and December 31, 2023, for selected stations in South America. Data comes from station data provided by the meteorological services from Brazil, Argentina, Bolivia, and Paraguay (red line shows maximum temperatures and blue line minimum temperatures) and from the CPC-NOAA data set (gray thin lines) interpolated for the location of the stations. The 90th percentile 15-day window maximum and minimum temperatures derived from the CPC-NOAA are also shown. Units are in (°C). Sources of data: INMET (Brazil), SMN (Argentina), SENAMHI (Bolivia), and DMH (Paraguay).
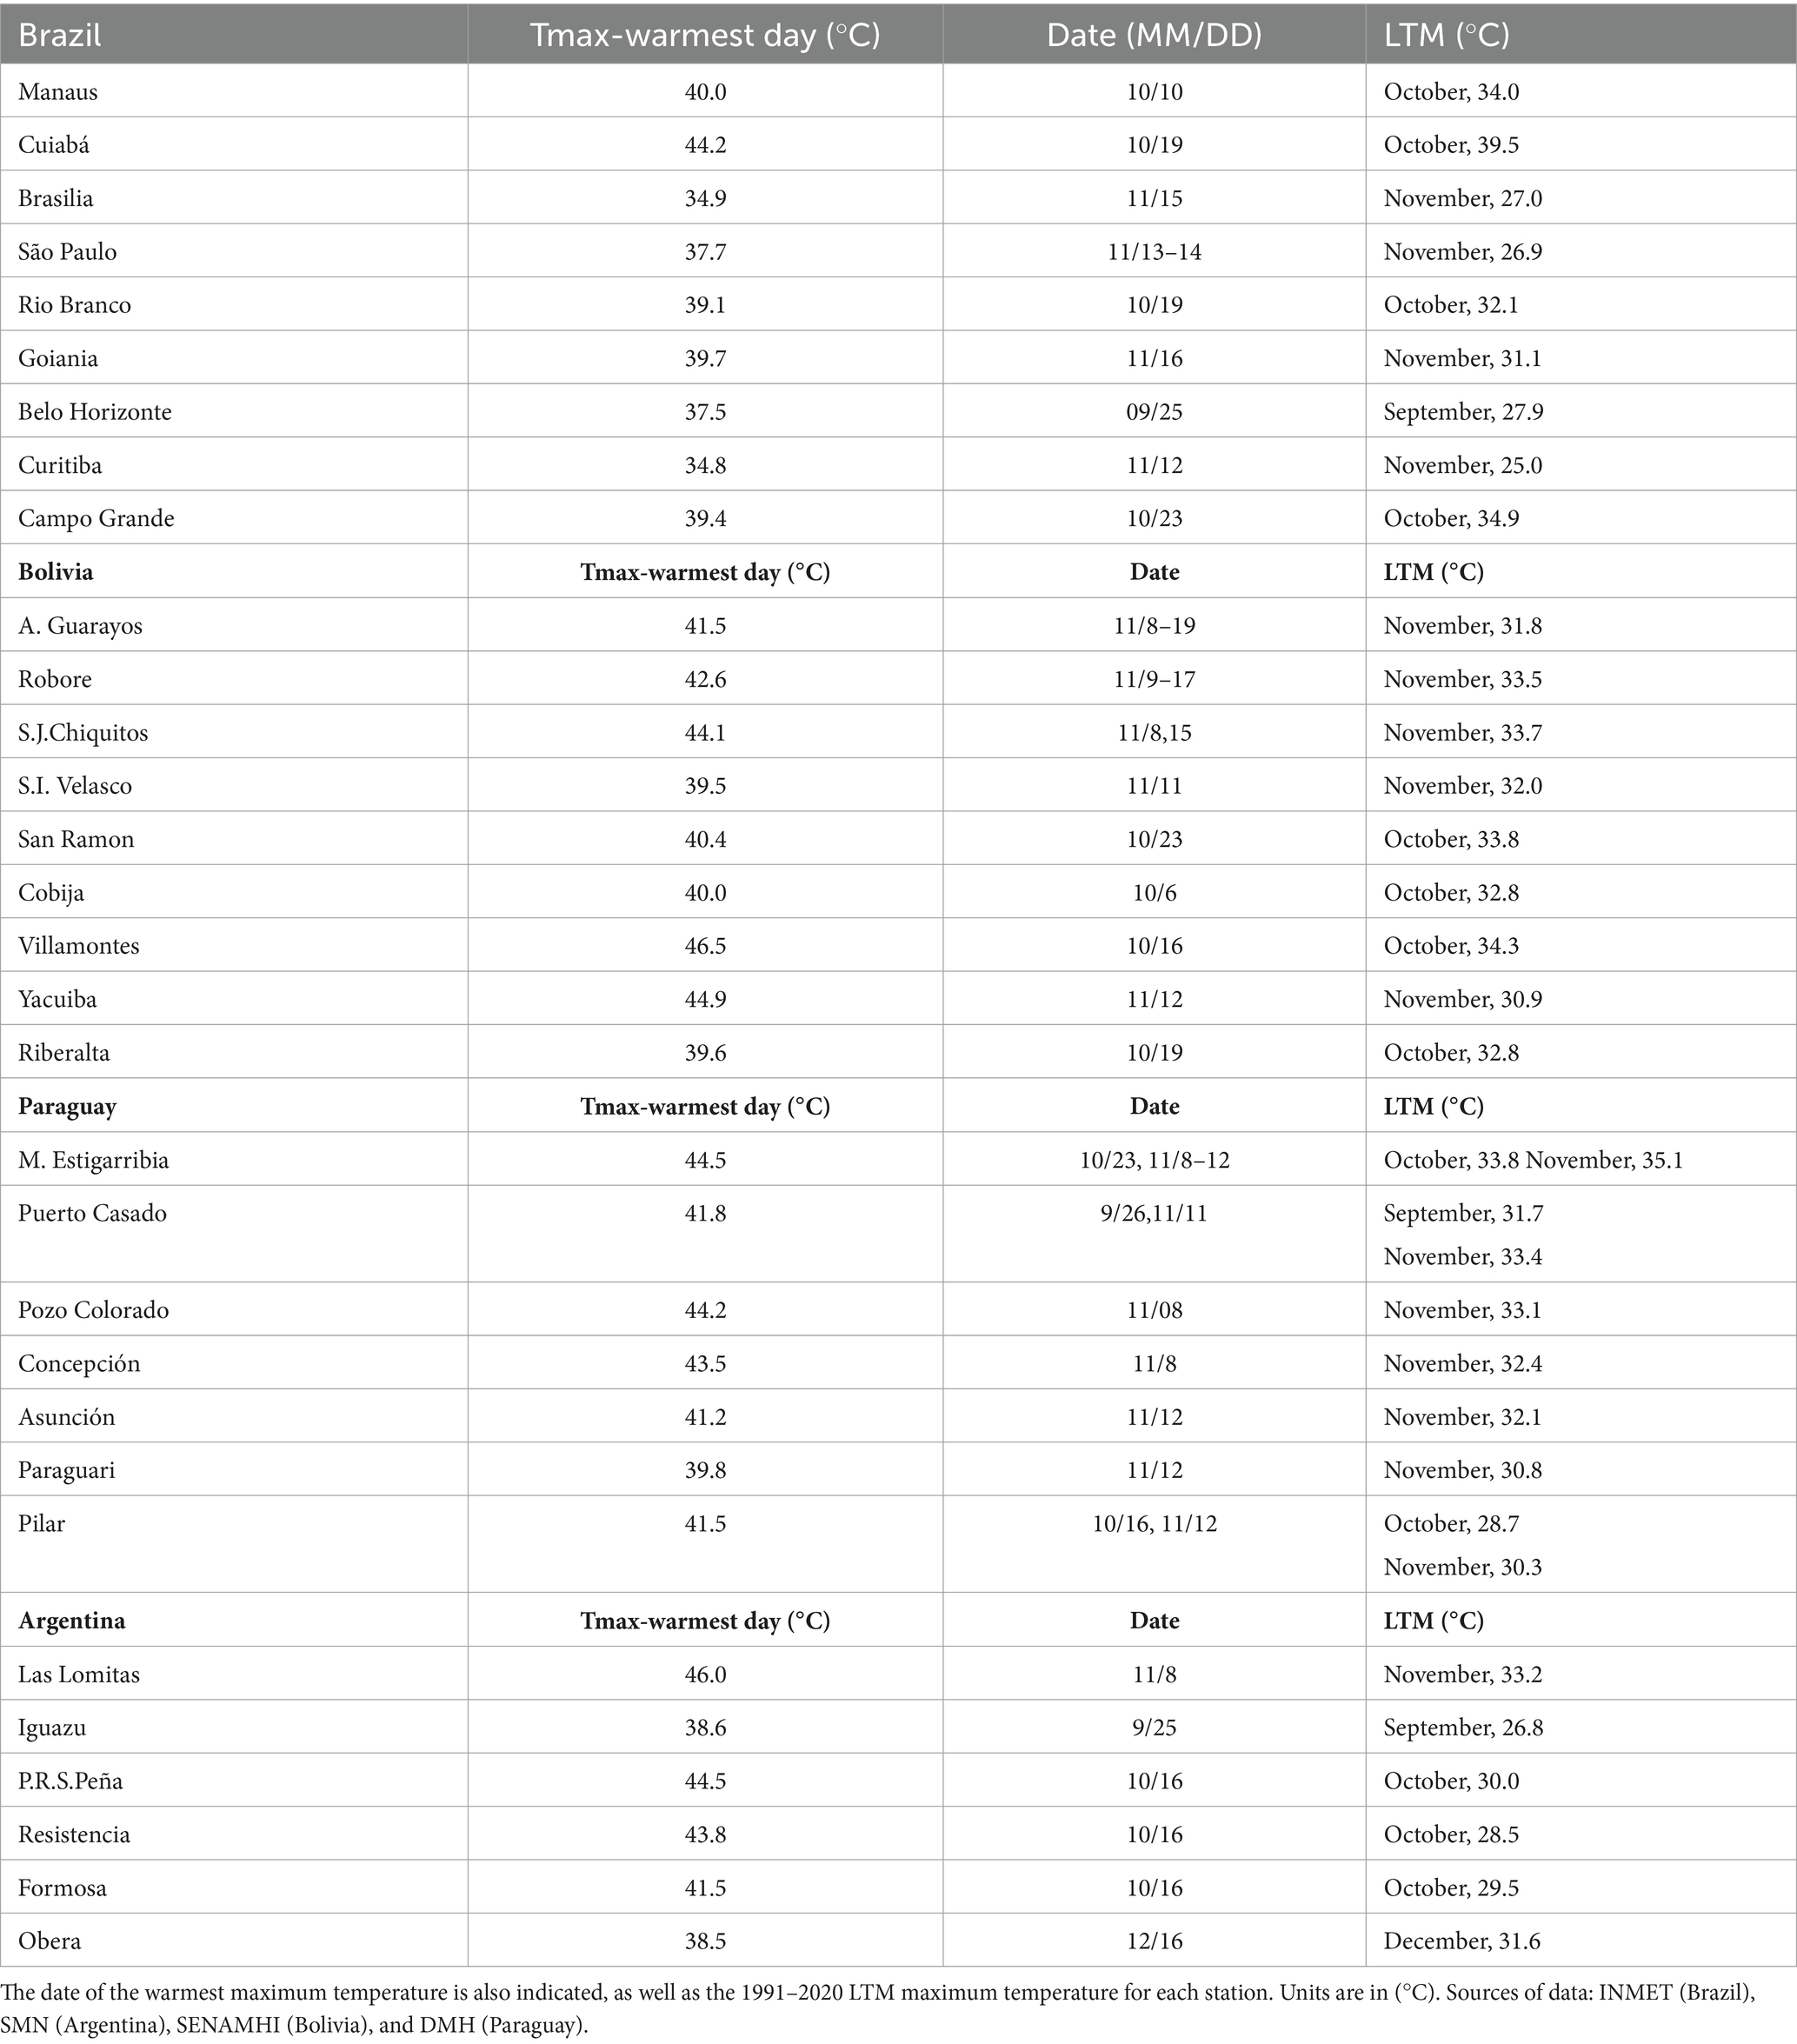
Table 2. Maximum temperature for the warmest day detected between August and December, 2023 for some stations in Brazil, Argentina, Paraguay, and Bolivia.
Information from reports of the meteorological services, press agencies and websites were used together with Figure 2 and Table 2, to identify some episodes of hot spells and HWs in the region. We selected HW episodes from August to December 2023 in the four countries mentioned above. Additional background information comes from the State of the Climate in Latin America and the Caribbean 2023 (WMO, 2024), the work of Perkins-Kirkpatrick et al. (2024). The winter and spring 2023 periods were chosen to capture the HWs dynamics during an El Niño/warm Tropical North Atlantic and because a record drought affected the Amazon basin during that period (Espinoza et al., 2024). In Brazil, the year 2023 oversaw 10 HW. In Brazil and Bolivia, 7 HWs occurred between August and December when El Niño’s warming was more intense (Perkins-Kirkpatrick et al., 2024).
According to WMO (2024) and the meteorological services of Argentina, Brazil, Bolivia, and Paraguay, during the second half of September, countries including Brazil, Peru, Bolivia, Paraguay, and Argentina recorded in 2023 their highest September temperatures. Temperatures in parts of wet central Brazil exceeded 41°C as South America was hit by scorching weather in the middle of the winter, and near-all-time high temperatures were recorded (Cuiabá, in Supplementary Table S1). Spring HWs are relatively common in Brazil (Geirinhas et al., 2017; Monteiro dos Santos et al., 2024b). Before 2023, the most recent and intense HW occurred in the spring of 2020 (Marengo et al., 2021; Libonati et al., 2022). In September 2023, it went closer to 44°C, and west central Brazil recorded the highest temperature in more than 100 years of measurements by the INMET.
Analyzing Table 2 and Figure 2, one can observe that the highest maximum temperatures were recorded in October and November, corresponding to anomalies of 6–8°C above average in some stations, reaching almost 10°C warmer in Belo Horizonte during September 2023. Espinoza et al. (2024) and Marengo et al. (2024) demonstrated that various HWs accentuated the warm conditions that affected central South America, including southwest Amazonia, in August and September 2023, amplifying the effect of the drought affecting the region at that time.
Table 2 shows the maximum temperatures of the warmest days (highest Tmax) between August and December 2023 observed in some stations in the four countries during HW episodes. Tmax in the warmest days in Brazil and Bolivia reached 9°C higher than the 1991–2020 LTM, while in Paraguay and northern Argentina, the hottest temperatures were 10–14°C warmer than the 1991–2020 LTM. It is noticed that the highest maximum temperatures were reached in October and November 2023.
South American countries also reported some other HW even before August 2023. The HW in Argentina from February 28 to March 20 was the most widespread event experienced since the HW observed in 2013 (WMO, 2024). It affected the country’s central and northern coastal zones (SMN). On March 11, Buenos Aires in Argentina recorded its highest-ever temperature for March at 38.6°C, while Mercedes in Uruguay saw the temperature reach a record value of 40.5°C.5 One HW event was observed between the 21st and 28 of July 2023, but it was restricted to areas west of Central-West and South Brazil. In July, Brazil was hit by record temperatures of almost 42°C, despite still being in winter.6
Figure 3 presents the spatial pattern of the heatwave Magnitude Index (HWMI), which reflects the accumulated magnitude (Md) of the seven selected heatwave (HW) events during 2023 (Section 2.4). The map highlights the spatial distribution and intensity of HWs across South America. Northern and western South America consistently exhibit the most pronounced HWMI values across the seven events. The late August period (Event 2, 19 August–1 September) exhibits the most intense HW activity, with significant HWMI values. HW Event 6 (06–21 of November) stands out for the most widespread extent of HW events (From 5°N to 30°S), with almost all South American countries affected by HWs. Ecuador (positioned near the equator line and the most western country) and Northeast of Brazil (latitude from 0° to 10°S and longitude below 50°W) display consistent Md values across all the selected HW events. Regions with latitudes higher than 40°S do not exhibit any HW occurrence in the selected periods.
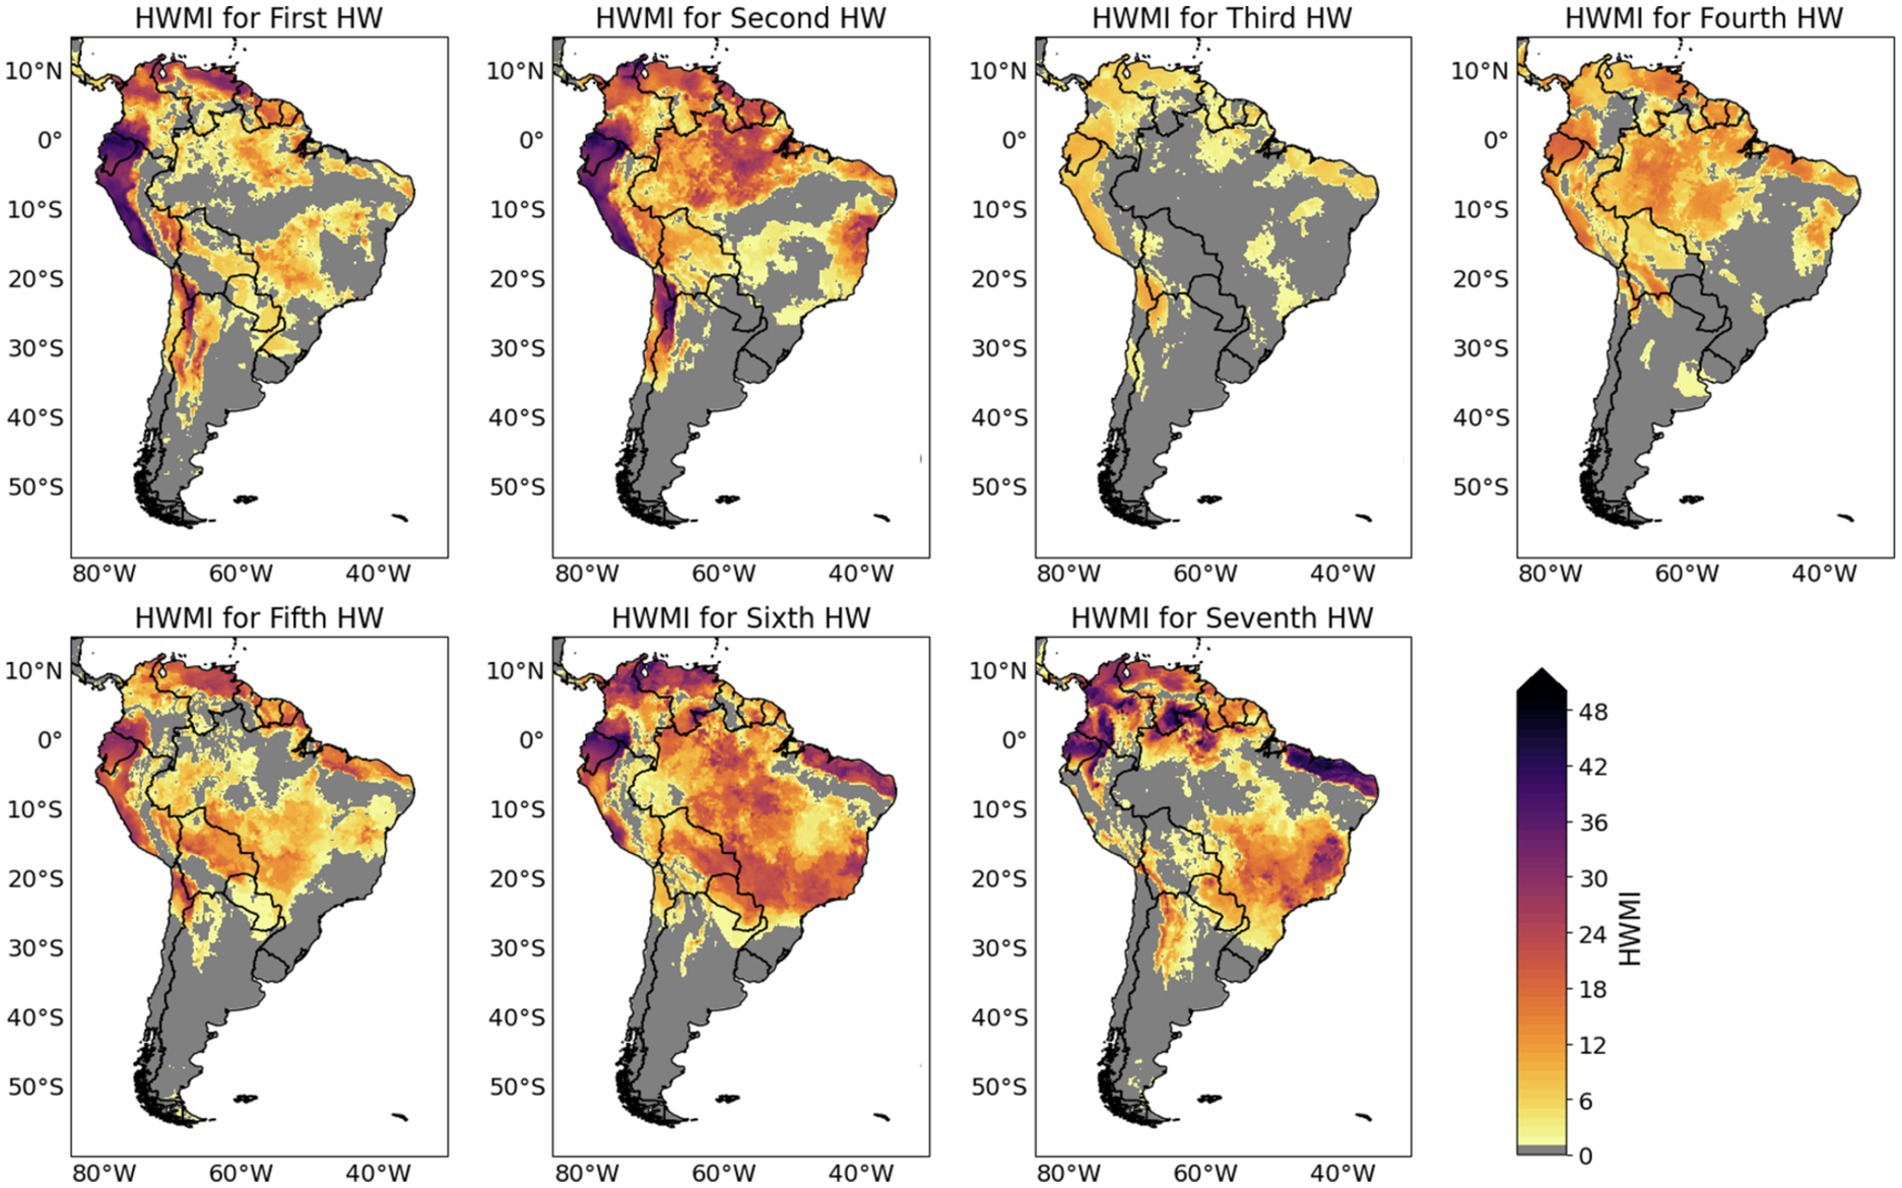
Figure 3. Geographic extent of the heatwave Magnitude Index (HWMI) for the seven selected HWs events between August and December, 2023. Source data: ERA5.
Figure 4 presents the daily evolution of the magnitude of the HWMI for 10 selected cities during the HW events between August and December 2023. Most peak Md values across these cities are near 3, indicating that the temperature anomaly with respect to the 25th percentile on a specific day is three times the inter-quartile range (IQR). Notably, Cuiabá, Brazil, recorded the highest Md values, exceeding 3, during the Event 7. San Ignacio de Velasco, Bolivia, is the only city where positive Md values were observed during all HW events, with the highest magnitudes during Events 5 and 6. The Event 6 event impacted all 10 cities, with Md values between 2 and 3 for most locations, except Formosa, Argentina, which remained below 2. Brasilia, Brazil, and Formosa, Argentina, were the cities that have experienced only 3 of the HW events and Las Lomitas, Argentina, showed the minimum number of days with HW events.
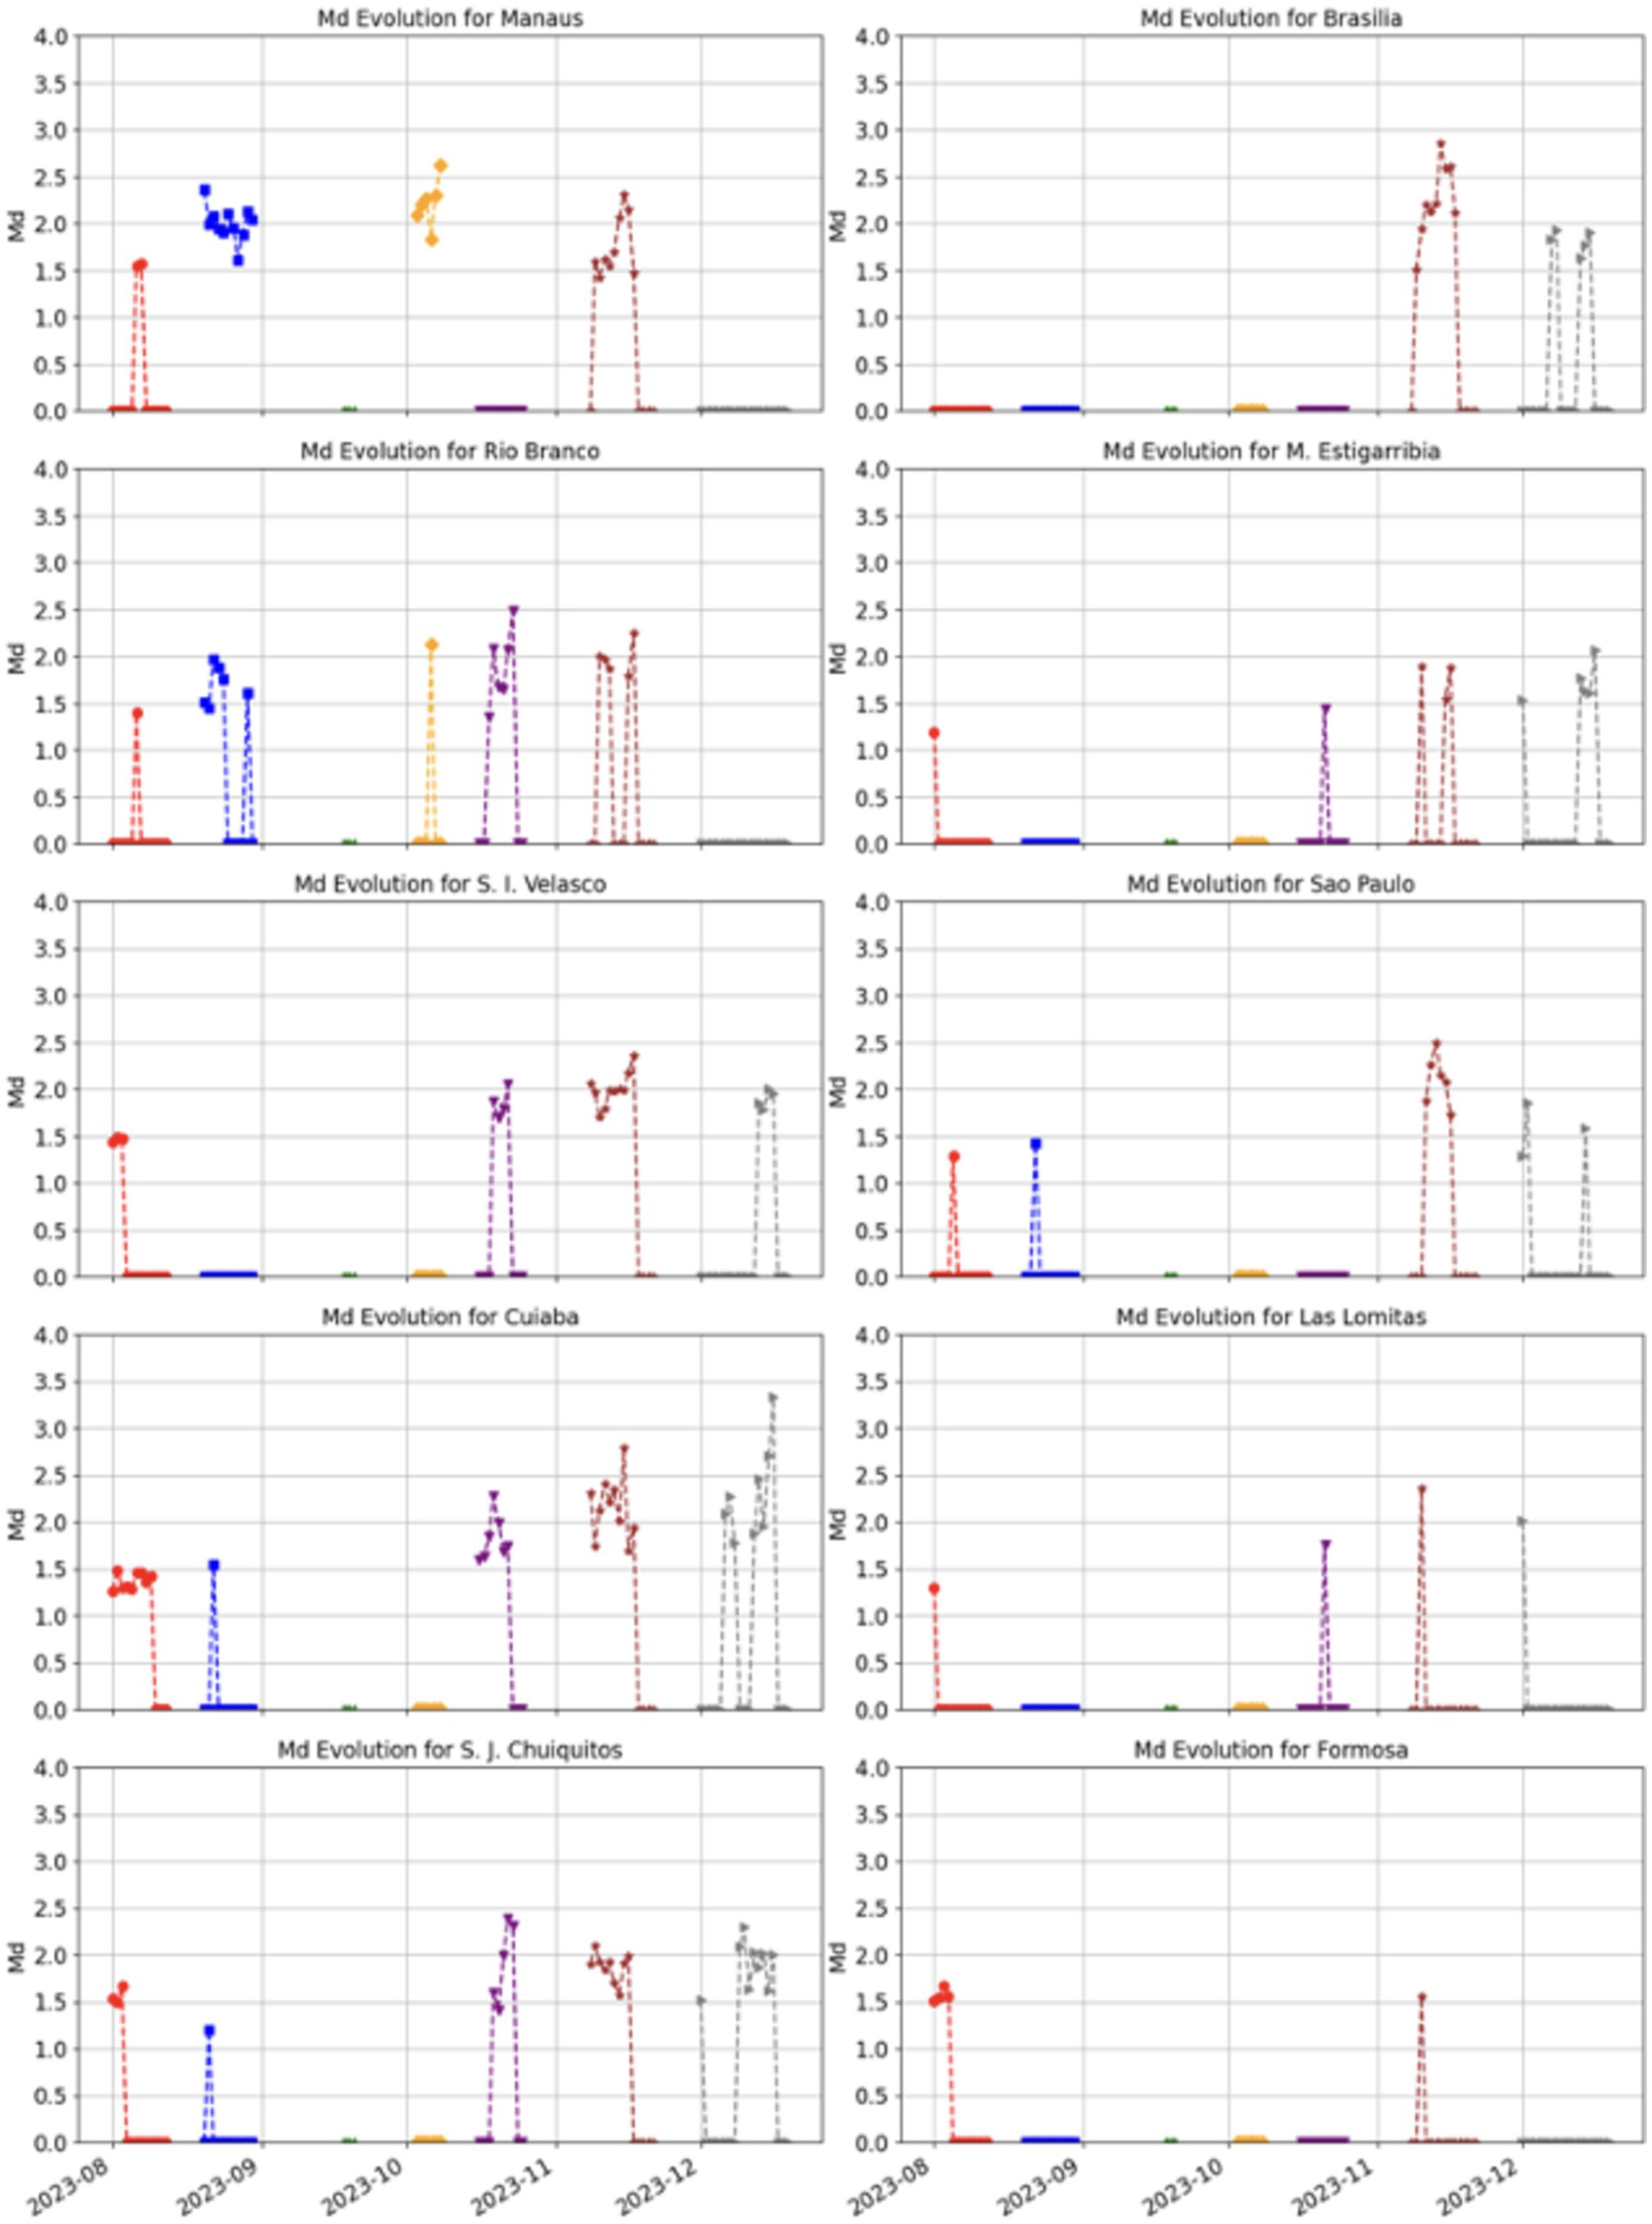
Figure 4. Daily evolution of the magnitude of a Heatwave (Md) for 10 selected stations during the HWs events between August and December, 2023. Source data: ERA5.
Considering the events individually: the Event 1 reached all cities except Brasilia; the Event 2 only five cities (i.e., Manaus, Rio Branco, San Ignacio de Velasco, Cuiabá and São Paulo); the Event 3 did not reach any of the selected cities; the Event 4 reached only the selected cities in the North of South America (i.e., Manaus and Rio Branco); the Event 5 most of the central of South America, corresponding to five cities (i.e., Rio Branco, San Ignacio de Velasco, Cuiabá, S. J. Chiquitos and M. Estigarribia); the Event 6 reached all cities and the seventh only did not impact the selected cities in the North of South America and Formosa (the selected city most far south).
Figures 3, 4 show that the 2 most important HW events were Event 2 (August 19 to September 1) and Event 6 (November 6–21). The former showed the most intense activity and occurred in wintertime, while the latter (Event 6) covered almost all South American countries east of the Andes. According to the meteorological services of Brazil, Argentina, Bolivia and Paraguay the HW Event 2 affected most of tropical South America, leading to temperatures in many areas above 35°C in midwinter with some locations setting all-time heat records (Washington Post, 2023), with maximum temperatures above 35°C in Bolivia, Argentina, and Central Brazil. 12 August saw Rio de Janeiro break a 117-year heat record. Chile saw highs toward 40°C and Bolivia saw temperatures rise badly Asunción saw 33°C (The Guardian, 2023). Monthly records were broken in Villamontes (45°C) and Yacuiba (41.8°C) on August 22, Guajaramirim (39.0°C on August 24), Ascension de Guarayos (39.7°C) and Cobija (38.6°C) on August 31 in Bolivia. Between 22 and 28 August, in Cuiabá, in central-western Brazil, the temperature reached 41.8°C on August 23. The HW also hit Rio de Janeiro and São Paulo, Brazil’s two most populous cities. Rio de Janeiro’s temperature reached 38.7°C on August 22, and in Cuiabá, in central-western Brazil, the highs reached 41.8°C (the year’s highest temperature) on August 23. In São Paulo, thermometers hit a high of 32.3°C on August 23, very close to the highest temperatures registered for August of the order of 33.1°C on August 31, 1952, and 1955. The temperatures above average and rainfall below average favored a raised risk of forest fires (INMET, 2023).
Event 6 was more intense in southwestern Brazil, Paraguay, and Bolivia, with maximum temperatures of 40°C and above. A HW in Brazil started in central and western regions on November 7, when temperatures reached 42°C in Mato Grosso do Sul, and on November 8, 2023, Brazil was hit by another heat wave. Rio de Janeiro had the warmest day of the year, with temperatures reaching 42.5°C on November 12 (INMET, 2023). The record established in Ascension de Guarayos in October was equaled on November 8. Puerto Suarez (43.5°C on November 16). San Borja (41.2°C on November 10), San Jose de Chiquitos (44.1°C on November 8, breaking the record of October) and Yacuiba (44.9°C on November 12) recorded the historical highest temperatures, with several other Bolivian stations recording November highest temperatures. Argentina experienced the hottest summer in 60 years between November 2022 and March 2023, with 10 HW (Collazo et al., 2023). In western Paraguay, on October 23 and 8 and 12 November, the temperature reached 44.5°C in Mariscal Estigarribia and 41.8°C in Puerto Casado (the average monthly maximum is 35.1°C and 33.4°C, respectively) on September 26 and November 11. In Asunción, it measured 41.2°C on November 12. This same HW affected central and southern Brazil, and according to the Brazilian Meteorological Service (INMET, 2023), about 120 stations recorded their highest maximum temperatures on November 12, a record for November. The highest maximum was recorded in Rio de Janeiro, which registered 42.5°C on November 12, followed by Cuiabá with 39.6°C and Teresina with 38.9°C. São Paulo had the highest maximum in the last 9 years, with 37.1°C on November 12 and 37.7°C on November 15. In Rio de Janeiro, temperatures reached 42.5°C on November 12, which became the hottest day of the year. On November 15, INMET thermometers repeatedly registered temperatures above 40°C across the central-west and southeast, with a peak of 43.3°C in Corumbá on the border with Bolivia on that day. With temperatures hitting 37.7°C and 42.6°C on November 15, respectively, São Paulo and Rio de Janeiro broke yearly records. On November 8, maximum temperatures reached 46.0°C in Las Lomitas in Argentina. On November 17, 2023, around a thousand people fainted during a show of American country singer Taylor Swift, held at the Nilton Santos Olympic Stadium, in Rio de Janeiro (Metropolis, 2023), when a person suffered a cardiorespiratory arrest and died during the concert (BBC, 2023). On that day INMET registered maximum temperatures of 39.1°C. On November 18, 11 meteorological stations recorded a maximum temperature ≥40°C. Such extremely high temperatures occurred in a prefrontal situation and at the end of a heatwave that lasted 10 days.
The seven HWs occurring in the second half of 2023 in South America were experienced throughout the continent, as shown in Figure 4. These correspond to events that occurred on August 1–12, August 19–September 1, September 16–30, October 15–25, November 6–21 and December 6–19. Analysis of the atmospheric circulation anomalies allows us to identify that five HWs presented similar conditions on the days before and concurrently with each event. Only Event 2 (on August 19, 2023) presented a different pattern in the synoptic circulation before and during the event.
Figure 5 shows anomalies of the 850 hPa air temperature (shades) and of the 500 hPa geopotential height (contours). Letter H marks positive or high-level pressure anomalies, while L marks negative or low-level ones. The “Pre-event” period considers the 3 days preceding the HW episodes, while “event” considers the HW participating days. Vectors represent 850 hPa wind anomalies. For events 1, 3, 5, 6, and 7, at lower levels of the atmosphere, during the “pre-event” shows positive geopotential anomalies centered over central Chile and Argentina (light green contours in Figure 5). The anomalies are negative in areas of the adjacent Pacific and Atlantic and southernmost Argentina and Chile. However, a broad positive anomaly in the Pacific can be seen at 100°W.
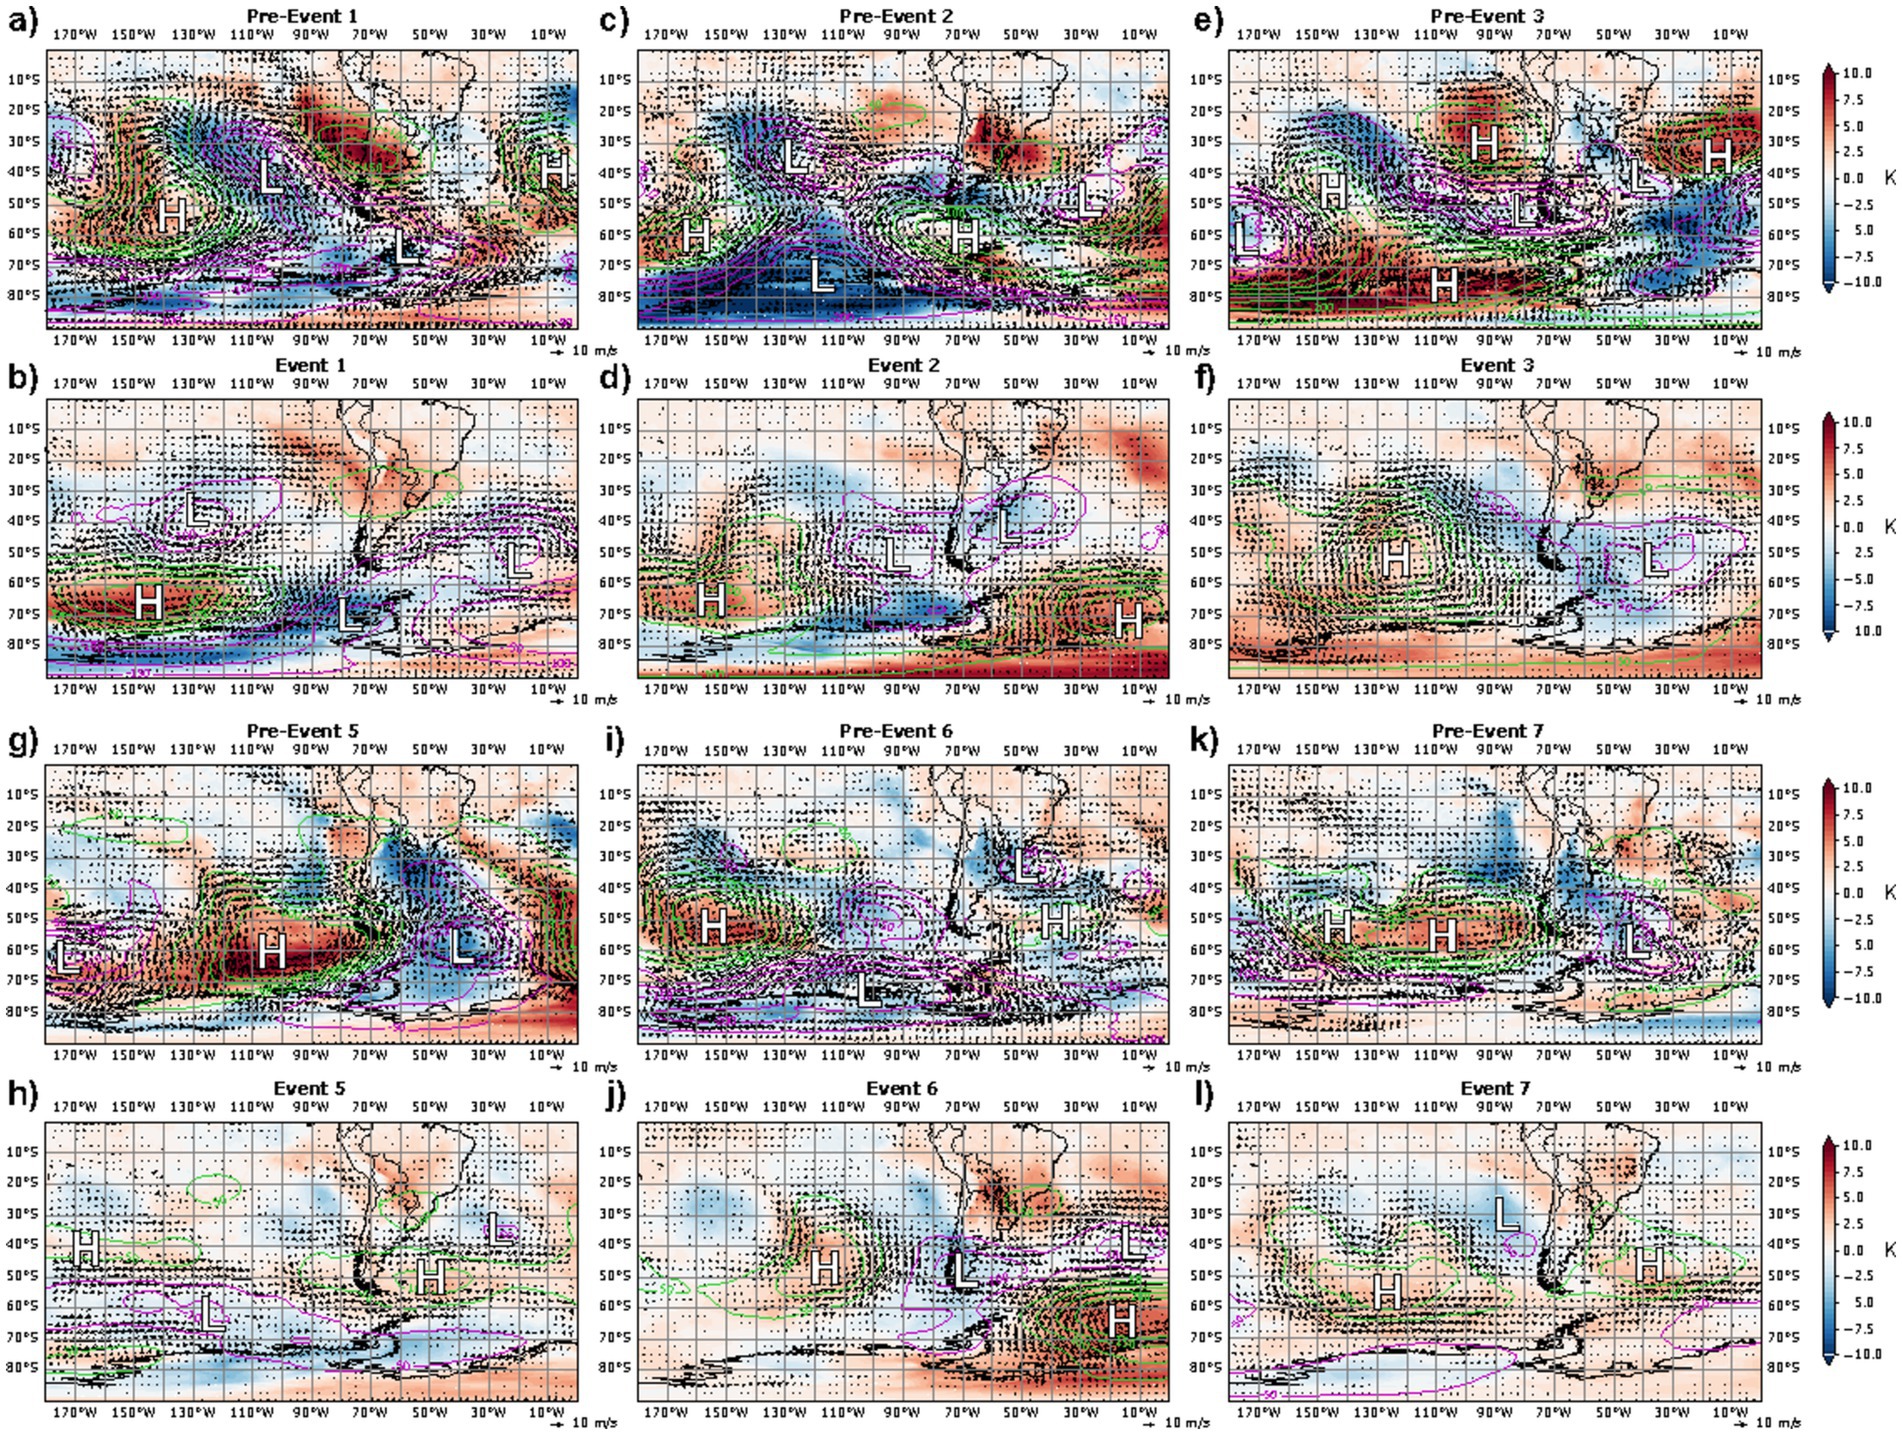
Figure 5. 850 hPa air temperature anomalies (shaded, units in K) and geopotential height anomalies (contours, green and magenta lines represent high- and low-pressure anomalies respectively; units in m), for (A,C,E,G,I,K), the average 3 previous days of the event and (B,D,F,H,J,L), the average for the days of the event. Vectors show wind anomalies at 850 hPa in m s−1. White letters H and L show anticyclonic and cyclonic anomalies, respectively.
During pre-event 1, a spatial correspondence between the 850 hPa temperature and maximum temperature at 2 m anomalies was evident over the region around 35°S and 70°W (Figure 5 and Supplementary Figure S1). In addition to other mechanisms such as the radiative heating this signature reflects the contribution of subsidence and adiabatic heating processes to the near surface temperature escalation. When analyzing the soil moisture anomalies (Supplementary Figure S2) one can easily note that the areas covered by the highest temperatures were associated to soil moisture values within the expected levels. Accordingly, the sensible heat anomalies were negligible. During event 1, although positive anomalies of 2 m Tmax were witnessed around the same location, they were less intense. An enhanced anticyclonic circulation pattern remained stationary over this area from pre-event 1 to event 1, triggering high evaporation rates. This resulted in a steady and prolonged soil moisture decrease, paving the way for the pronounced negative anomalies observed during event 1 (Supplementary Figure S2). Despite this soil drying, the sensible heat anomalies were still residual indicating that soil moisture was sufficient to meet the atmosphere demand for water.
Overall, the atmospheric and land surface conditions recorded during pre-event 2 were very similar to those observed for pre-event 1. Again, the areas with strong positive anomalies of 2 m Tmax were also characterized by above normal values of 850 hPa temperature. The sensible heat anomalies remained negligible pointing. During event 2, as the high-pressure anomalies moved eastwards, temperature anomalies approached lower positive values with any significant change in the soil moisture and sensible heat anomalies.
The days before events 3, 5, 6, and 7 were characterized by an anomalous low-pressure system located over the southeastern section of the continent that was responsible for cooler near surface temperatures in the region (Supplementary Figure S1). Later, during the HW participating days, this low-pressure system was replaced by an anticlyclonic circulation pattern associated to positive anomalies in the 850 hPa temperature and 2 m Tmax. All the region spanning from north to central South America, covering the Amazon basin and the northeast Brazil, witnessed extremely warm conditions at surface because of this synoptic pattern. The land-atmosphere interactions observed for these four events were quite different from the ones previously described for events 1 and 2. These HW episodes occurred in a later stage of the year, after a long sequence of days marked by large precipitation deficits and evaporation rates after the wintertime dry season. Together, these conditions led to an amplification of the soil desiccation firstly noted during events 1 and 2, resulting in a severe drying during HW events 3, 5, 6, and 7 (Supplementary Figure S2). The co-occurring conditions of soil dry-out and high income of shortwave radiation at surface, promoted by the anomalous anticyclonic circulation patterns, fueled large sensible heat fluxes from surface to the atmosphere (Supplementary Figure S3). This is a clear signature of a strong soil moisture-temperature coupling that contributed for the re-amplification and self-propagation of the pre-established HW and drought conditions in the region.
Regarding the average position of the extratropical high-pressure anomalies, positive temperature anomalies (red colors in Figure 5) are detected in the blocking anticyclone (blocking highs) region, particularly from the north of the Chilean coast to the Ecuadorian region. During the next few days, the “event” situation shows an eastward propagation of the positive geopotential anomalies, reaching the southwest of Brazil and the adjacent Atlantic Ocean (light green contours in Figure 5).
The type of blocking observed in Figure 5 seems to fit the High-over-Low (Diffluent Block) type with a closed high-pressure center to the north of a closed low-pressure center in the south (Detring et al., 2021). A high-pressure anomaly in southeastern South America and southward low-level wind anomalies are detected east of the Andes from Bolivia. Positive temperature anomalies at 850 hPa are found over southeastern South America because of adiabatic warming and subsidence. The persistence of north–south wind conditions at the eastern flank of the Andes for several days during the HW implies that there were no cold winds from the high latitudes to the continent. In addition, the positive temperature and geopotential height anomalies suggest the effect of subsidence anomalies that are commonly associated with the absence of clouds and rain, higher radiation reaching the surface and favoring dry conditions (Geirinhas et al., 2018).
The circulation described during the “pre-events” and “event” situations resembles the South Atlantic Convergence Zone (SACZ) or the South America Low-level jet east of the Andes (SALLJ) episodes (Lanfredi, 2018). The SCAZ and SALLJ play important role on surface warming, and an active SACZ leads to subsidence and anticyclonic circulation over central South America (Alvarez et al., 2019). Previous studies showed that during HWs in central South America in the spring of 2020, southeastern South America in January 2022, and Argentina during the 2022–2023 summertime, the atmospheric circulation pattern had the presence of quasi-stationary extratropical high-pressure anomalies and persistent atmospheric blocking of westerly flow (Marengo et al., 2021; Zhang and Xie, 2023; Suli et al., 2023; Collazo et al., 2023; Perkins-Kirkpatrick et al., 2024). Persistent anticyclones or blocking in the midlevel atmosphere over South America are necessary for summertime continental HWs. These atmospheric systems lead to clear skies and subsidence, facilitating warming together.
Domeisen et al. (2022) and Baldwin et al. (2019) identify various local and remote drivers and feedback influencing HW development. Extratropical atmospheric blocking and global land-atmosphere coupling are the most pertinent. During spring of 2023, while the Amazon region was experiencing a record drought, HWs in this season in central and southern Amazonia were favored by negative anomalies in evapotranspiration and soil moisture, with clear skies and increased temperatures due to the blocking anticyclonic anomalies in central South America. This occurred during the dry-to-wet transition season September–October–November 2023, with warm SSTs in the equatorial Pacific and tropical Atlantic (Marengo et al., 2024; Rodrigues and Woolings, 2017).
At the seasonal level, the SPI-3 better represents the extension of the drought (Figure 6). The extent of drought-stressed areas started to increase in June (above 20%), with maximum values (above 50% of South America) in November. The highest extension of the compound event is detected for SPI-3 values along the September–November season, with more than 40%. For SPI-6, November and December show the largest area. Figure 7 shows the drought-heat compound area in South America during 2023.
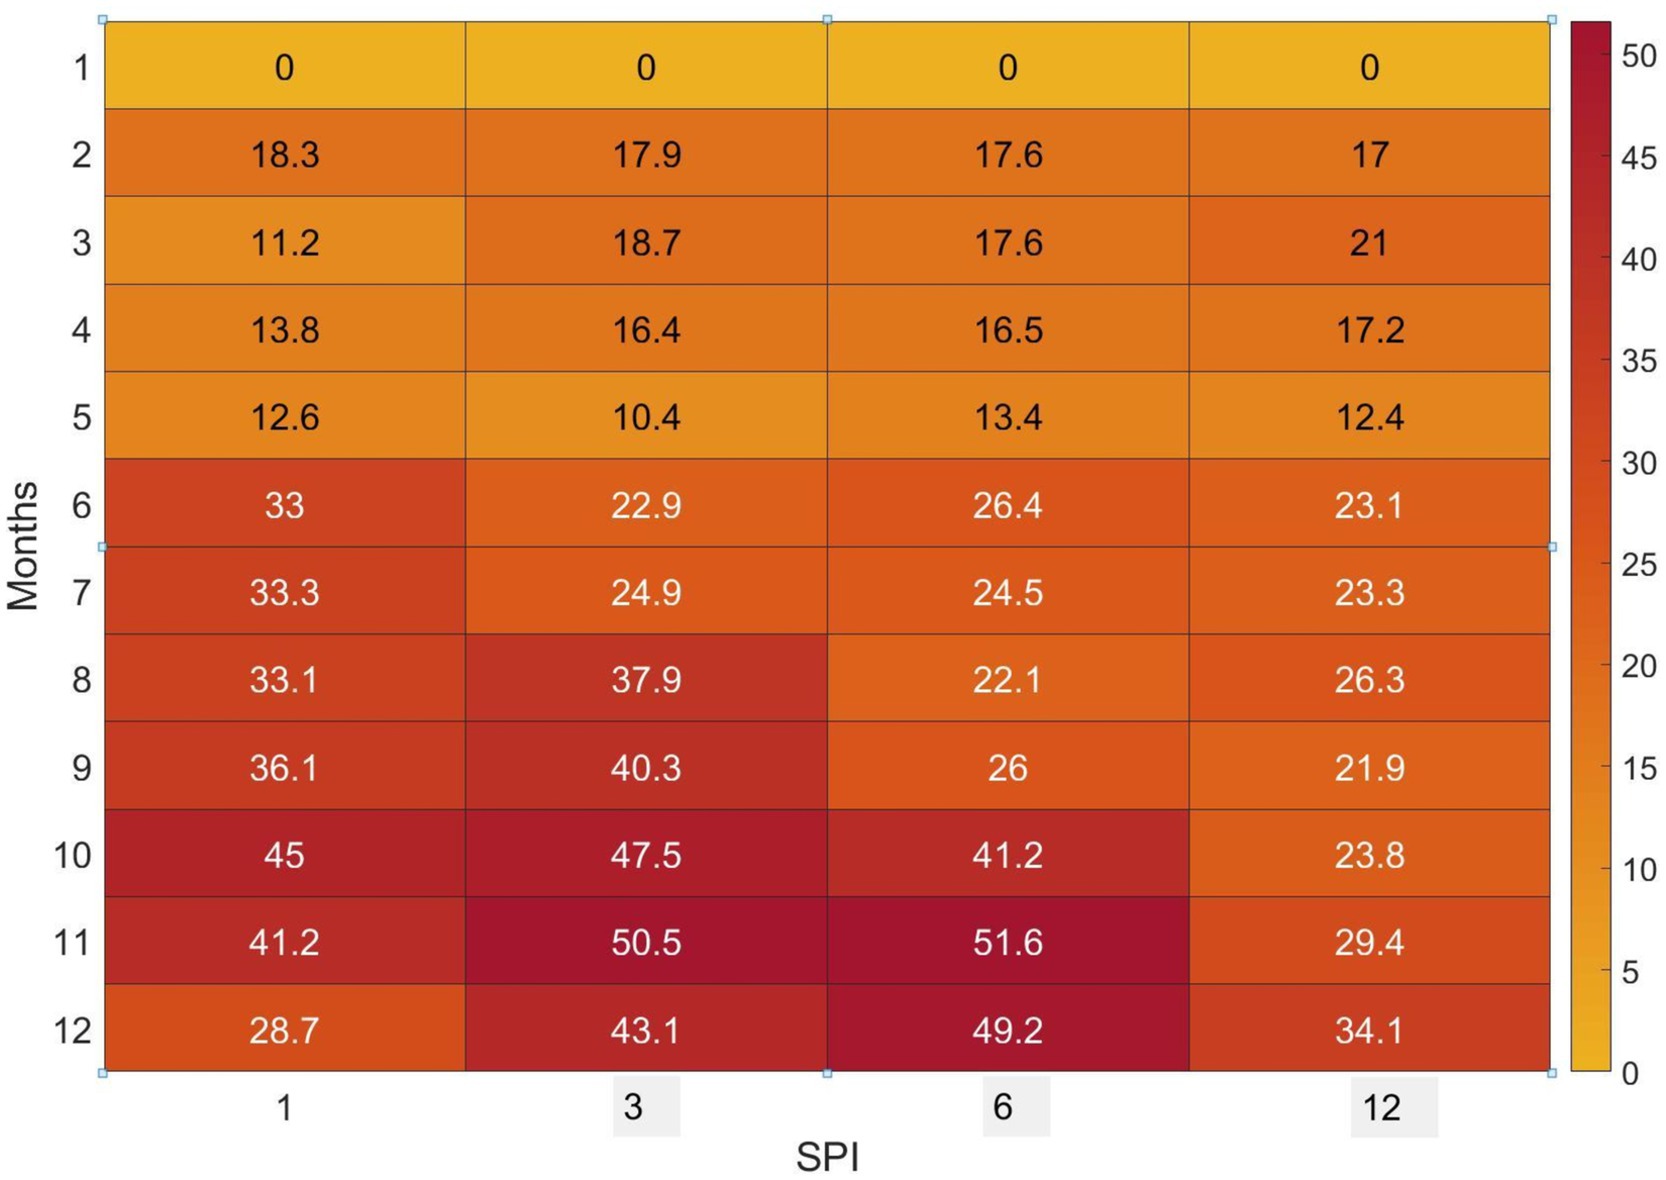
Figure 6. Monthly Drought-heat compound area (%) in South America using various SPI time scales (1, 3, 6 and 12 months).
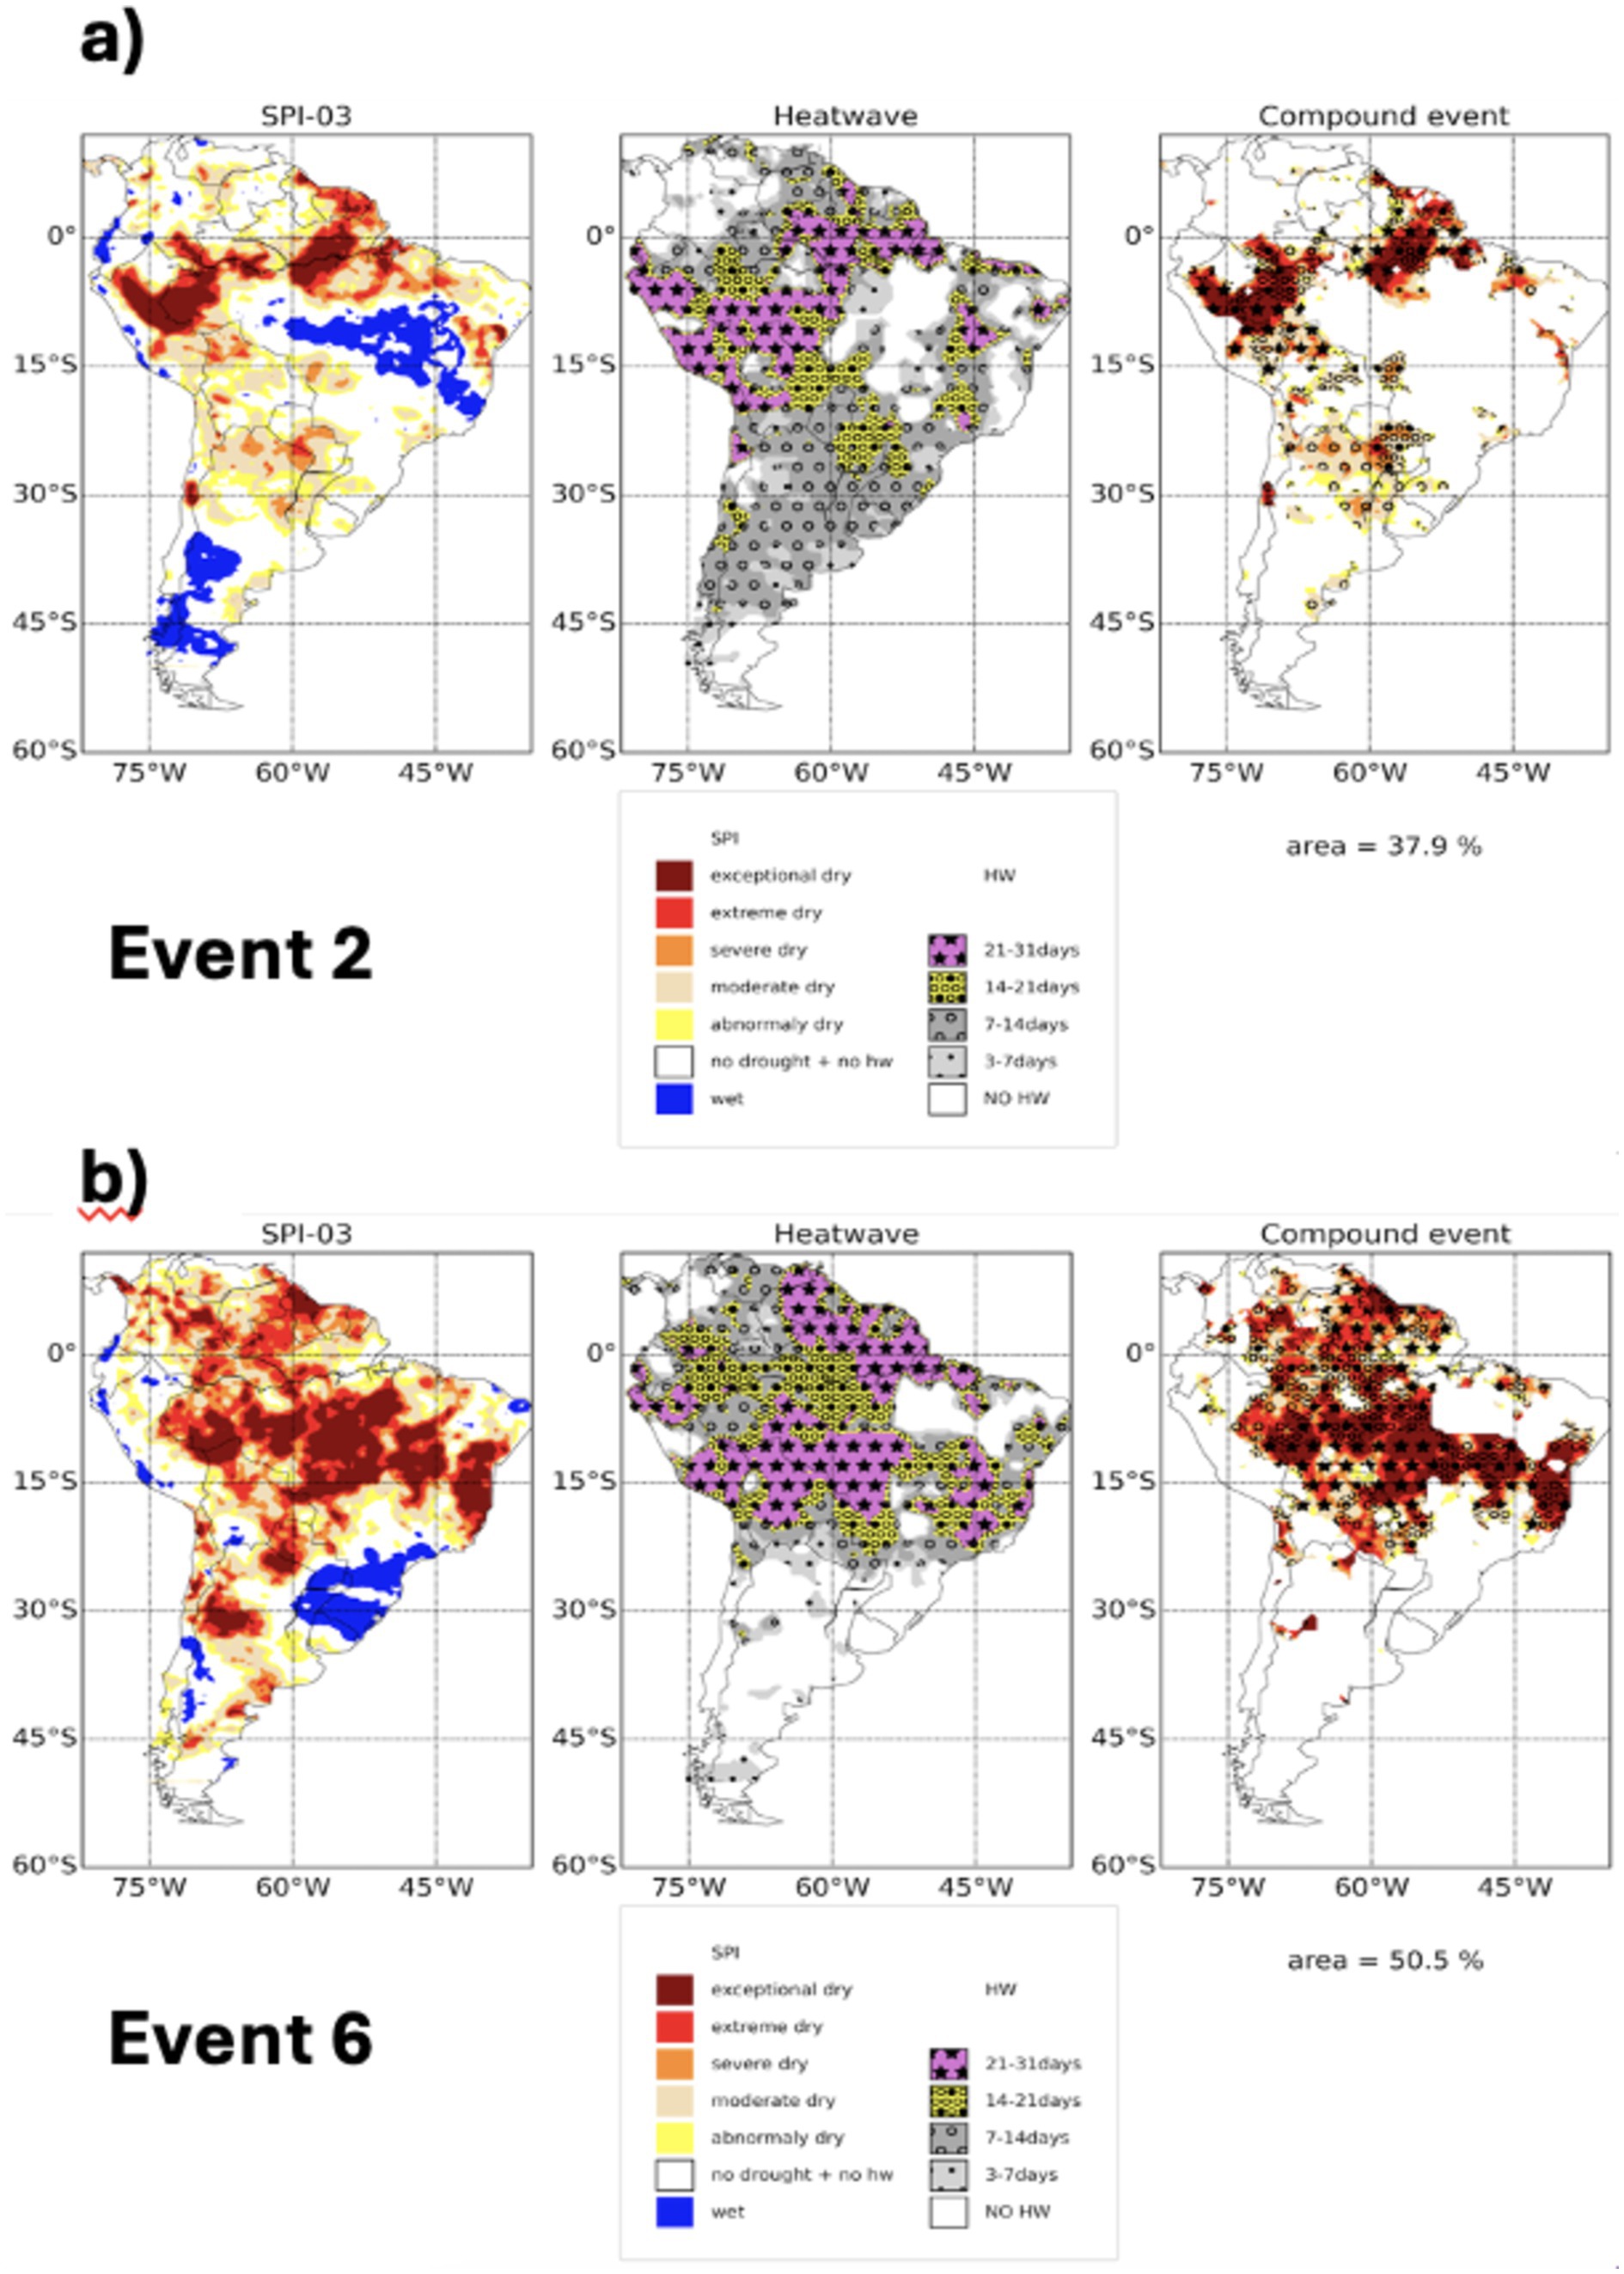
Figure 7. Drought-heat compound Events 2 and (A) and 6 (B). The compound event area expressed in the combined drought categories (SPI-3) and heatwave monthly averaged duration. The heatwave categories represent the sum of the days under heatwave condition per month. See color scale in the lower part of each panel.
We now focus our analysis on Events 2 (August 19–September 1) and 6 (November 6–21) due to their circulation features during winter season and during the driest month in 2023, respectively. In the case of Event 2, drought-heat compound events were identified over northern South America. The SPI-3 shows regions with extreme and exceptionally dry conditions with HW lasting 2–4 weeks over northern and western Amazonia and severe to moderate dry conditions and HW lasting 2–3 weeks in parts of Bolivia, northern Argentina and Paraguay (Figure 7A). The area affected by HWs with a duration of 3 days or more was 82.8%, covering regions with and without drought. The extent of the drought-heat compound during event 2 was 37.9% of South America area.
In November for the Event 6, the extent of the drought-heat compound event was 50.5% of South America (Figure 7B). Extreme and exceptional dry categories occurred mainly over tropical and subtropical South America east of the Andes covering most of tropical Brazil, Bolivia, Paraguay and northern Argentina, associated with HWs duration of 2 or more weeks. From both events, the Event 6 shows the highest intensity, with extreme drought and longer HWs on a larger area when compared to Event 2. The extent of the area with HW duration of 3 days or more is 76.4%, mainly in areas under some level drought condition.
To investigate changes in surface conditions during HW episodes, Supplementary Figure S1 shows 850 hPa Tmax anomalies between 2 and 3°C above normal in central and western Amazonia and in Bolivia, Paraguay and Northern Argentina in August 2023 (Event 2). In Event 6 (November 2023), tropical South America between 10 oS and 30 oS east of the Andes shows warming between 2 and 3°C, with 3–4°C warner than normal in southern Amazonia and Bolivia. Supplementary Figure S2 shows negative soil moisture anomalies in northern Amazonia from July 2023 onwards, and in Paraguay and northern Argentina in October and November 2023. In November 2023 (Event 6), the entire Amazon region presents negative soil moisture anomalies. This is consistent with Marengo et al. (2024), where the negative latent heat flux anomalies are in line with the detected negative soil moisture shown here as well as with the intense warming in Amazonia during the drought of 2023 in austral spring September–November (Supplementary Figure S4).
Supplementary Figures S5, S6 show the SPI-3 and HWs duration respectively, from January to December 2023. Supplementary Figure S7 shows compound drought-heat events in South America, where the most active season occurs from August to December 2023, coinciding with intense HWs. The largest areas with compound events are November during the Event 6.
The positive trends in HWN reach statistical significance in stations in Bolivia and Brasilia, with an increase rate of 3–5 HWs per decade from 1979 to 2023. The rate of increase varied between 0.3 and 4.8 HWs/decade. From all stations, a mean of 10–12 HWs per year is noticed, with a relatively higher number of HWs after 2000, reaching 20–30 HWs per year in the Amazonia and Bolivia from 2000 to 2023 (Figure 8). Some years show more events, particularly in tropical regions and during El Niño years. In Bolivia, the number of events varies between 0 and 10 before 2000 and 7–32 between 2000 and 2023.
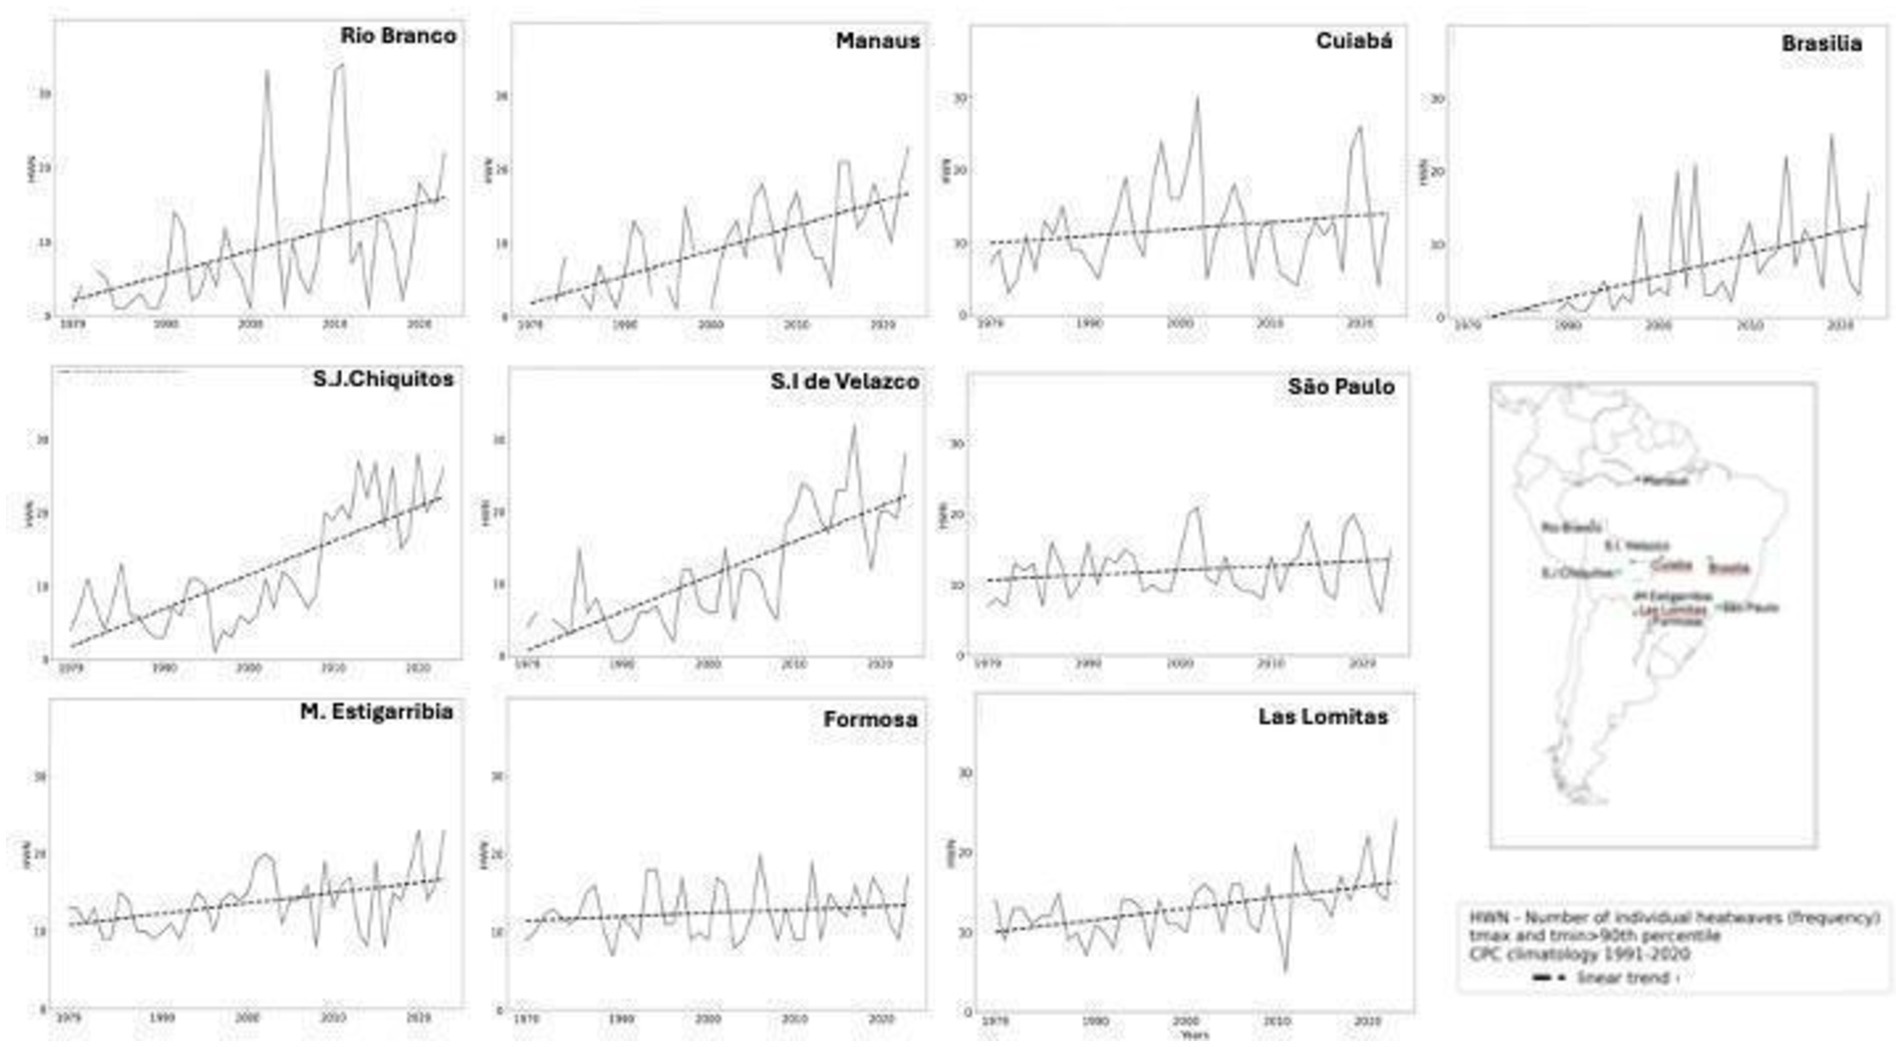
Figure 8. Trends in HW frequency HWN (number) from 1979 to 2023. Tmax and Tmin data from CPC NOAA temperature data set.
The positive trends in the number of HWs have also been detected in South America in various regions, using different periods and different criteria. Ceccherini et al. (2016) found that between 2005 and 2014, extreme HWs increased to 40 HWs/year, compared to 8.5 HWs/year from 1980 to 2004. In Brazil, Monteiro dos Santos et al. (2024b) identified an increase in the frequency of HWs from the 1970s (0–3 HWs/year) to the 2010s (3–11 HWs/year), in the northern, northeastern, and central-western regions. Suli et al. (2023) described the climatological characteristics of regional HWs over southern South America for the warm seasons of 1979–2018 and found a mean frequency of 4 HWs/year. Bitencourt et al. (2016) identified 11 HWs in Amazonia and west central Brazil (from August to October) and 31 HWs in southern and southeastern Brazil (from September to February) from 1961 to 2014. Libonati et al. (2022) identified an increase in HW events over the Pantanal since 2000 compared to the previous two decades. Bitencourt et al. (2020a, 2020b) identified between 4.5 and 7.8 HWs/year during 1961–2016 for central and southern Brazil.
The mean duration of HWs (HWDA) is shown for the 10 stations in Figure 9. It is noticed that there is a positive weak trend in tropical latitudes, while in subtropical regions, there is no trend. The positive trend varied between 0 and 0.4 days/decade. The mean duration of HW varies between 4 and 5 in the region, with interannual variability linked to El Niño, reaching 7 to 10 days in some years in tropical latitudes, while in Argentina, the mean duration reaches 4–5 days.
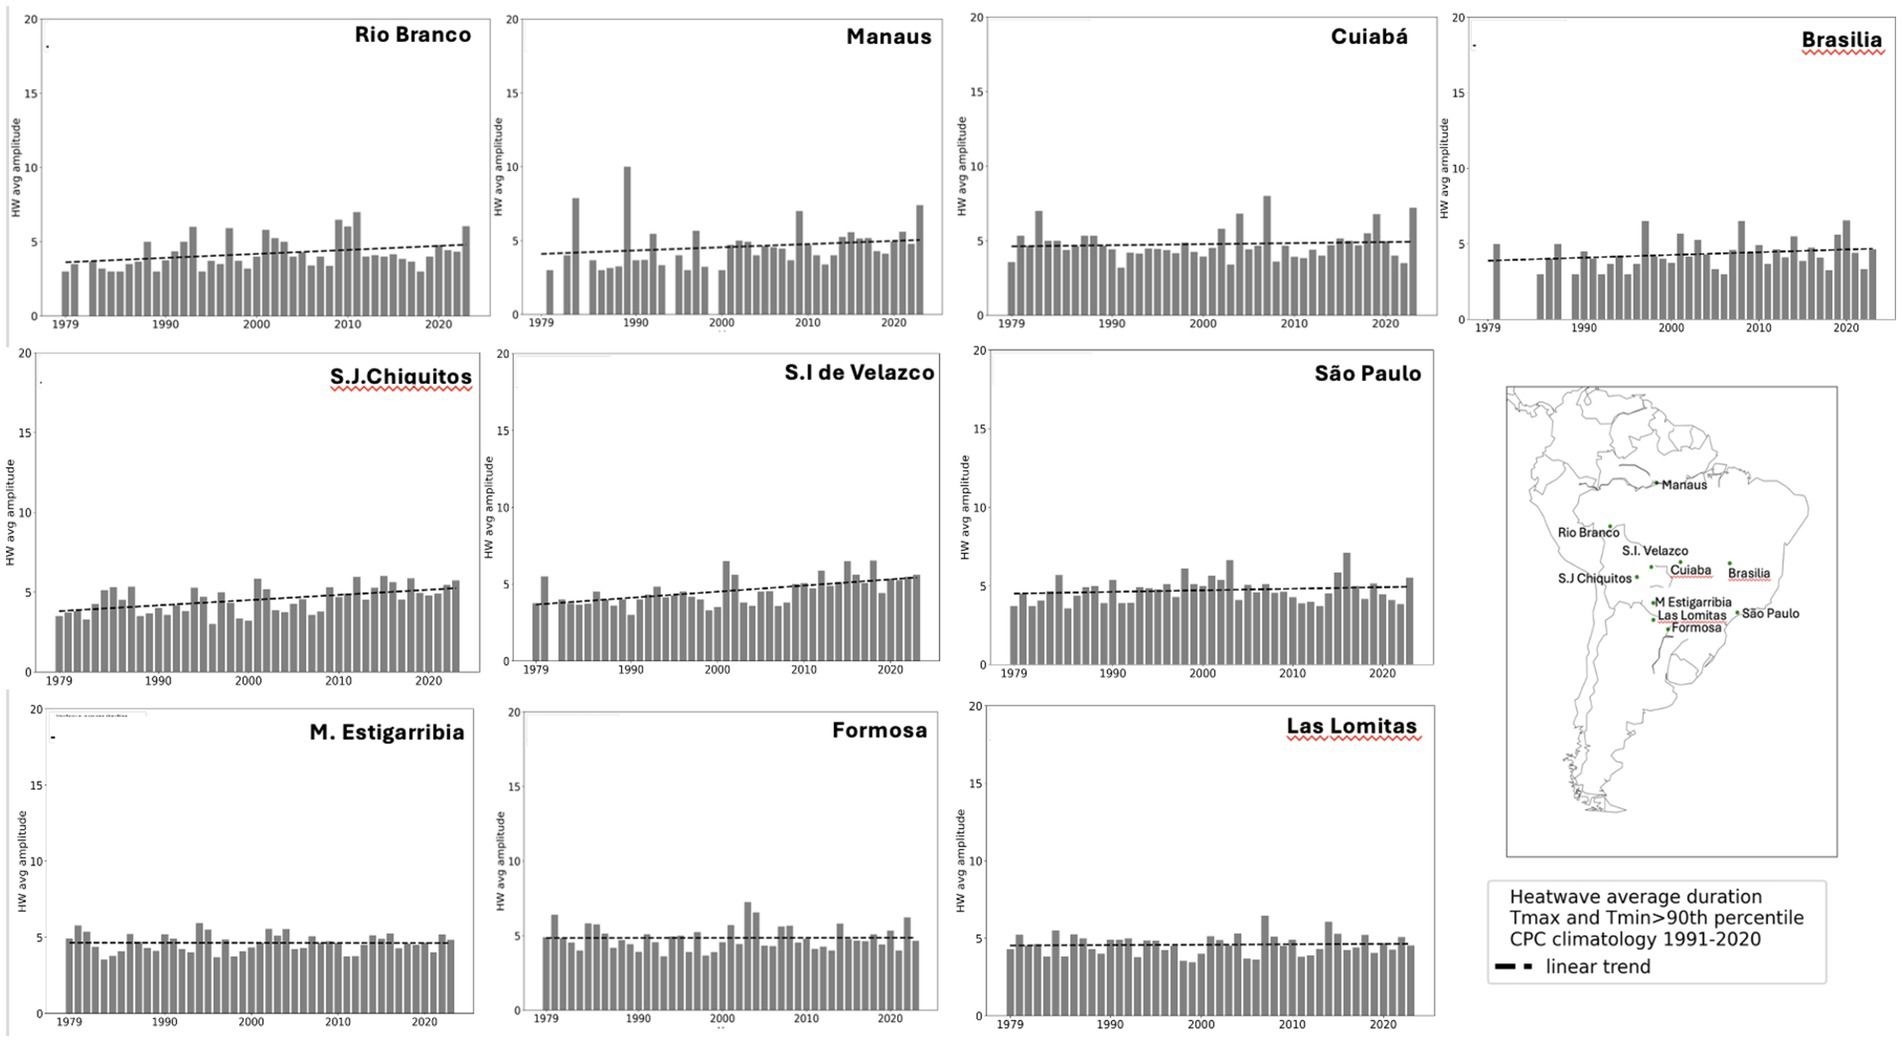
Figure 9. Trends in HW total duration Index HWDA (number of days) from 1979 to 2023. Tmax and Tmin data from CPC NOAA temperature data set.
For comparisons, using data from 265 stations in Brazil, Bitencourt et al. (2016) determined the duration of HWs in Amazonia and Southern-South Brazil, with mean values of 4.5 and 4.7 in those two regions, respectively, from 1961 to 2014. The most extended duration of HWs was 8 and 10 days for the same regions. Suli et al. (2023) determined the mean duration of HWs in Paraguay, northern Argentina, and Southern Brazil at 4.6 days (+1.2 days) in warm seasons between 1977 and 2018. Those values are like the HW mean duration obtained in this work (4–5 days).
The rate of increase in HWD varies between 0.2 and 2.5 days/decade. As observed in Figure 10, in tropical latitudes (Bolivia and Brazilian Amazon), there is an increase in the duration of the longest HW after 2000, varying from 5 days before 2000 to 15–20 days after 2000. In stations in Argentina, the mean duration is about 5–10 days, reaching 15 days in some years but with a slight non-significant positive trend, while in other locations in Paraguay, the positive trend is higher and statistically significant. The longest HWs in tropical latitudes occurred during El Nino years 1982–83, 1997–98, 2015–16, 2020, and 2023; this relationship is not observed in subtropical latitudes.
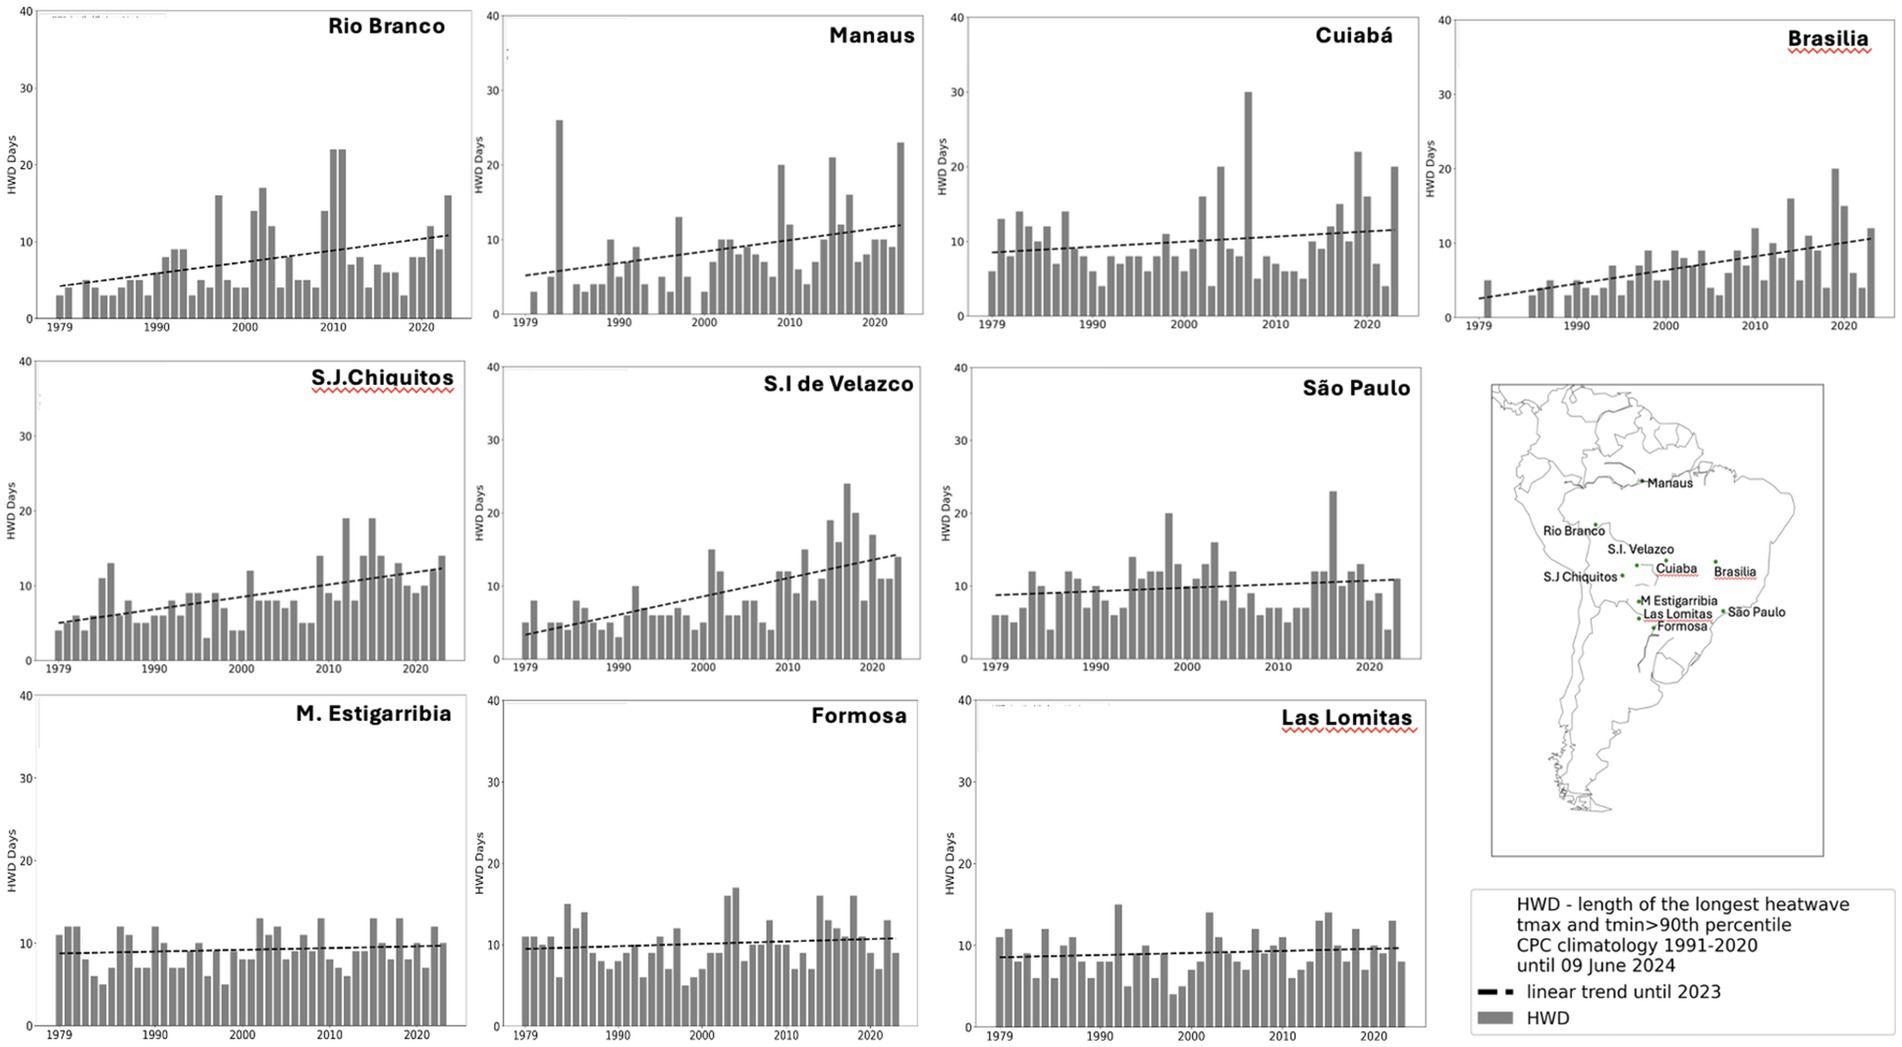
Figure 10. Trends in duration of the longest HW HWD (number of days) from 1979 to 2023. Tmax and Tmin data from CPC NOAA temperature data set.
The HW amplitude (HWA) for minimum and maximum temperatures shows positive long-term trends, that are steeper for maximum temperatures (Figure 11). This means that the amplitude of the hottest HW is higher for maximum compared to minimum temperatures. This is mainly observed during some El Nino or drought years in Amazonia and subtropical latitudes as in 2005, 2010, 2016, and in 2023. The highest amplitude for maximum temperatures in Bolivia varied from 0.5 to 1.1°C/decade. While the minimum temperature is 0.3–0.7°C/decade for the same stations. Barriopedro et al. (2023) determined a trend of 3.2–6.4°C/decade in the magnitude of the HW for Tmax during 1950–2021 in central South America.

Figure 11. Trends in the duration of the peak value of the hottest heatwave HWA considering Tmax (red line) and Tmin (blue line) from 1979 to 2023. Tmax and Tmin data are from the CPC NOAA temperature data set.
HWs indices in 2023 exhibit index values well above normal (Table 3). The HW amplitude for minimum temperatures was above normal in 2023, being the highest in Manaus, S.I. Velasco, S.J. Chiquitos, São Paulo, Mariscal Estigarribia and Las Lomitas, while it was mostly below average for maximum temperatures. In sum, all the indices of HWs exhibit positive trends during 1979–2013, with some of those trends statistically significant in some stations. There is a tendency for prolonged periods of high temperatures, with more frequent, longer and intense HW in the region, from Amazonia to mid-latitudes. As seen in 2023, intense HWs and severe drought, can lead to potential impacts on ecosystems and agriculture, with an increased risk of fire in some biomes of central South America, and with health impacts for the population. The trend analysis and Table 2 show that the 2023 heatwaves in South America set new records for surface air temperature anomalies and heatwave characteristics.

Table 3. Mean values of HW index for 2023: HWN (number/decade), HWD (days/decade) and HWA (oC/decade, for Tmax and Tmin) in a subgroup of stations in Central South America for 1979–2023 (in the nominator).
As shown in Sections 3.1–3.5, HWs represent a significant hazard in Latin America (WMO, 2024). In 2023, episodes of intense HWs occurred in South America, with record-breaking events including exceptional wintertime and spring heat in South America. During 2023, much of South America experienced temperature anomalies of 1–3°C warmer than normal over Bolivia, Paraguay, and Argentina (Copernicus Climate Change Service, 2023; NCEI-NOAA, 2023; Perkins-Kirkpatrick et al., 2024). Because of the HWs in August and September, after a hot July, the winter of 2023 was considered one of the warmest in Brazil since 1961. On November 20, 2023, Brazil recorded its hottest-ever temperature of 44.8°C in Araçuaí, in Brazil’s southeastern state of Minas Gerais, beating the country’s previous record of 44.7°C, measured in 2005 (INMET, 2023; BBC, 2023).
From our analysis covering the 1979 to 2023 period, HWs in parts of Central South America have become longer, warmer, and more frequent. It was observed that the longest and the most intense events occurred in the last 20 years. All HW indices show positive trends, and in some cases, the trends are statistically significant. The number of HWs has increased between 0.7 and 4.6 events/decade. The mean duration of the HWs has increased between 0.1 and 0.4 days/decade, and the length of the days with HWs varied between 0.2 and 1.7 days/decade. Regarding the duration of the peak value of the hottest HW, the index based on minimum temperature increased between 0.2 and 1°C, and the one based on maximum temperature varied between 0.2 and 1.8°C. The HW indices show high values in some El Niño or drought years. For instance, in Manaus and Rio Branco, the years with the highest HW indices were 2002, 2020, and 2023, while 2002, 2019, and 2023 were in Cuiaba and Brasilia. In São Paulo, the warmest years were 2001–2002 (El Nino year) and 2013–2014, when an intense drought occurred in the region with maximum temperatures about 4°C above normal (Nobre et al., 2016). The warmest years in Paraguay, Bolivia and Argentina stations were 2002 and 2023 (El Niño years). 2023 was an El Niño and drought year in Amazonia and Central South America, with anomalously warm tropical Atlantic (Espinoza et al., 2024; Marengo et al., 2024). From 2022 to 2023, a very intense HW affected northern Argentina (Collazo et al., 2023). The influence of El Niño and the tropical Atlantic on HW activity in South America has also been discussed by Barriopedro et al. (2023).
From the 7 HW events considered in this study, the second event showed the most intense activity over most of South America. In contrast, the sixth event covered almost all tropical countries east of the Andes. For the same events, drought-heat compound events were detected over northern and western Amazonia and in parts of Bolivia, Paraguay and northern Argentina. In contrast, the sixth event, the drought-heat compound situation, covered most of tropical region Southeast of the Andes, where extreme-exceptional drought conditions and HWs longer than 2 weeks were observed. This sixth event is consistent with an extreme drought situation and warming detected in September–November 2023 over the Amazon region, with rainfall about 150 mm/month lower than normal, air temperature up to 4o C warmer than normal, and reduced evapotranspiration and soil moisture (Marengo et al., 2024; Espinoza et al., 2024; Souza et al., 2024). Recent work by Feron et al. (2024) shows that the drought-heat compounds with concurring warm, dry, and high fire risk conditions have surged in key South American regions, including the northern Amazon, showing an increase in the number of days per year with extreme fire weather conditions (including high temperatures, dryness, and low humidity). Alves et al. (2024) emphasize the prevalence of drought-heat compound events during the austral summer season, and future projections show a significant increase in both extreme heat and drought events in the coming decades. This work and Marengo et al. (2021) show that compound events can also occur in the transition season (Spring). Although ENSO may have influenced the large-scale weather patterns during the early spring HW of 2023 (Jiang et al., 2024), its direct contribution to the extreme heat is small compared to the climate change signal (Kew et al., 2023).
This study characterizes the climatic and large-scale meteorological features and patterns of the HWs that affected central South America during the austral spring and beginning of summer seasons of 2023. Our trend analysis shows that from 1979 to 2023, there was an increase in the number and intensity of HWs in all stations studied in Central South America. This tendency is significant in subtropical latitudes. This is consistent with the observed warming in South America. In some stations, maximum temperatures up to 14°C above the 1991–2020 LTM have become long-term records since the beginning of data collection at those stations. Air temperatures reached above 40 ° C across large parts of Brazil, Paraguay, Bolivia, and Argentina in late winter.
The HWs of 2023 were characterized by the large-scale circulation patterns associated with developing a quasi-stationary Rossby wave train embedded in the westerly flow from the Indian Ocean region. This pattern showed an anticyclonic anomaly over central South America that was formed and matured during the HW episodes. This facilitated descending air motion in its central area and the anticyclonic interactions and adiabatic heating lead to atmospheric warming and resulted in the formation of a heat dome. This system persisted for several days, mainly during August–December, and weakened after that. This anticyclonic anomaly over the region leads to clear-sky and dry soils associated with droughts, therefore favoring above normal solar radiation at the surface leading to warmer temperatures. Over regions where soil dryness is more severe, evaporation becomes limited by water availability, i.e., a larger fraction of available energy at the surface is converted into sensible heat flux, further warming the atmosphere. From all 7 case studies, the Event 2 of August 19–September 1 (in winter) showed the most intense activity, and the Event 6 of November 8–21 covered almost all tropical South American countries east of the Andes. The second event reached Manaus, Rio Branco, San Ignacio de Velasco, Cuiabá and São Paulo (tropical and subtropical latitudes), and Event 6 reached all cities.
The drought-heat compounds for two of the selected HW episodes show that the regions affected by these events exhibited impacts on human, natural, and social systems, increasing the risk of wildfires and population’s exposure to extreme heat stress. In the August 2023 event the regions most affected were the northern and western Amazonia and Bolivia and Paraguay while in the November 2023 event it affected all tropical South America east of the Andes. During the November event some maximum temperature records were broken in the countries in the region. According to government sources in the countries included in this study, the relatively warm winter and spring seasons of 2023 generated economic disruption. Farmers in Brazil reported losses in coffee and soybean production, and the heat has also put people at higher risk of strokes and heart attacks, health authorities warned. Furthermore, whereas in 2023, 10 HW episodes were observed in Brazil, in 2024 (until November), 9 HW episodes have already occurred. The combination of drought and HW in 2024 has generated what can be considered the worst fire season in Brazil, affecting almost all the country. Studies are underway to characterize the drought-heat situation in 2024.
The knowledge of the impacts of past HW highlights the need for urgent measures promoting adaptation and for conservation policies to cope with the impacts of more intense and frequent weather and climate extremes on health, water and food security, and on the risk of wildfires. Better predictions and projections for their future occurrence will be helpful to mitigate these impacts. This study helps to better understand the physical mechanisms connecting the occurrence of intense HWs based on seven case studies in 2023, the warmest year on record. Better knowledge of HWs will support the strategies to reduce their impacts on human populations, from local to national levels. Extreme heat is among the deadliest weather-related hazards globally, but under-reporting in many regions’ limits understanding of the full scale of heat-related health impacts.
Future changes in blocking dynamics might lead to changes in heat waves beyond their thermodynamic intensification thus remains an important question for future research. Therefore, further studies are needed to understand and estimate the relation between blocking and heat waves under climate change. This will also help to develop strategies to cope and combat wildfires, which are more intense when fire is accompanied by heat waves and drought, as in 2020 (Libonati et al., 2022) and now in 2023 and 2024. One of the limitations of this work is related to observational data sets with quality control and homogenized maximum and minimum temperatures, which are available from meteorological services. They can provide an important data basis, and new modeling strategies can provide a possible perspective to improve this understanding as well as the predictability and risk assessment of extreme weather events, such as heat waves. Potential changes in weather extremes due to global climate warming also increase the need for better forecasting and risk assessment (Copernicus Climate Change Service, 2023), as suggested by Kautz et al. (2022).
Publicly available datasets were analyzed in this study. This data can be found at: www.inmet.br.
JM: Conceptualization, Investigation, Resources, Supervision, Writing – original draft, Writing – review & editing. MC: Data curation, Formal analysis, Methodology, Software, Visualization, Writing – review & editing. AC: Data curation, Formal analysis, Methodology, Software, Writing – review & editing. J-CE: Conceptualization, Formal analysis, Supervision, Visualization, Writing – original draft, Writing – review & editing. JJ: Conceptualization, Formal analysis, Methodology, Visualization, Writing – original draft, Writing – review & editing. RL: Conceptualization, Formal analysis, Methodology, Supervision, Validation, Writing – original draft, Writing – review & editing. VM: Data curation, Formal analysis, Methodology, Software, Writing – original draft. IT: Data curation, Formal analysis, Methodology, Software, Writing – review & editing. JS: Data curation, Formal analysis, Methodology, Software, Validation, Writing – review & editing. JG: Formal analysis, Investigation, Methodology, Software, Visualization, Writing – review & editing. AR: Data curation, Validation, Methodology, Visualization, Writing – review & editing. MS: Data curation, Formal analysis, Methodology, Visualization, Software, Writing – review & editing. JM-C: Data curation, Formal analysis, Investigation, Validation, Visualization, Writing – original draft. RS: Data curation, Formal analysis, Methodology, Software, Validation, Writing – review & editing.
The author(s) declare that financial support was received for the research, authorship, and/or publication of this article. This research was funded by the National Institute of Science and Technology for Climate Change Phase 2 under CNPq (grant no. 465501/2014-1), Fundação de Amparo à Pesquisa do Estado de São Paulo (FAPESP) (grant nos. 2014/50848-9 and 2017/09659-6), the National Coordination for High Level Education and Training (CAPES) (grant no. 88887.136402/2017-00 and CNPq grant 301397/2019-8) for JM. RL was supported by CNPq (grants 745311487/2021-1 and 443285/2023-3) and FAPERJ (grants E-26/200.329/2023 and E 26/210.078/2023).
We thank the meteorological services of Brazil, Argentina, Paraguay, and Bolivia for providing daily climatic data.
The authors declare that the research was conducted in the absence of any commercial or financial relationships that could be construed as a potential conflict of interest.
The author(s) declared that they were an editorial board member of Frontiers, at the time of submission. This had no impact on the peer review process and the final decision.
The author(s) declare that no Gen AI was used in the creation of this manuscript.
All claims expressed in this article are solely those of the authors and do not necessarily represent those of their affiliated organizations, or those of the publisher, the editors and the reviewers. Any product that may be evaluated in this article, or claim that may be made by its manufacturer, is not guaranteed or endorsed by the publisher.
The Supplementary material for this article can be found online at: https://www.frontiersin.org/articles/10.3389/fclim.2025.1529082/full#supplementary-material
4. ^psl.noaa.gov/data/gridded/data.cpc.globaltemp.html
5. ^https://www.copernicus.eu/en/media/image-day-gallery/severe-heatwave-south-america
6. ^https://www.euronews.com/green/2023/08/25/winter-heatwave-another-south-american-country-is-sweltering-in-record-temperatures
Alvarez, M. S., Cerne, B., Osman, M., and Vera, C. S. (2019). Intraseasonal and low frequency processes contributing to the December 2013 heat wave in southern South America. Clim. Dyn. 53, 4977–4988. doi: 10.1007/s00382-019-04838-6
Alves, L. M., Firpo, M. A. F., Bettolli, M. L., Hasson, S., Chimborazo Guerron, O. V., Añazco, A. A., et al. (2024). Projected changes in the frequency of compound hot and dry events over tropical Brazil in CORDEX-CORE simulations. Clim. Dyn. 62, 10203–10216. doi: 10.1007/s00382-024-07446-1
Araujo, G. R. C., Frassoni, A., Sapucci, L. F., Binmtencourt, D., and Brito Neto, F. (2022). Climatology of heatwaves in South America identified through ERA5 reanalysis data. Int. J. Climatol. 42, 9430–9448. doi: 10.1002/joc.7831
Baldwin, J. W., Dessy, J. B., Vecchi, G. A., and Oppenheimer, M. (2019). Temporally compound heatwave events and global warming: an emerging Hazard. Earth’s Future 7, 411–427. doi: 10.1029/2018ef000989
Ballester, J., Quijal-Zamorano, M., Méndez Turrubiates, R. F., Pegenaute, F., Herrmann, F., Robine, J. M., et al. (2023). Heat-related mortality in Europe during the summer of 2022. Nat. Med. 29, 1857–1866. doi: 10.1038/s41591-023-02419-z
Barcellos, C. (2024). Heatwaves, climate crisis and adaptation challenges in the global south metropolises. PLOS Clim. 3:e0000367. doi: 10.1371/journal.pclm.0000367
Barriopedro, D., Garcia-Herrera, R., Ordoñez, C., Miralles, D. G., and Salcedo-Sanz, S. (2023). Heatwaves: physical understanding and scientific challenges. Rev. Geophys. 61:e2022RG000780. doi: 10.1029/2022RG000780
BBC (2023). Available at: https://www.bbc.com/news/world-latin-america-67482423 (Accessed October 2, 2024).
Bevacqua, E., Zappa, G., Lehner, F., and Zscheischler, J. (2022). Precipitation trends determine future occurrences of compound hot–dry events. Nat. Clim. Chang. 12, 350–355. doi: 10.1038/s41558-022-01309-5
Bitencourt, D. P., Alves, L. M., Shibuya, E. K., da Cunha, I. A., and de Souza, J. P. E. (2020b). Climate change impacts on heat stress in Brazil—past, present, and future implications for occupational heat exposure. Int. J. Climatol. 41, E2741–E2756. doi: 10.1002/joc.6877
Bitencourt, D. P., Fuentes, M. V., Franke, A. E., Silveira, R. B., and Alves, A. (2020a). The climatology of cold and heatwaves in Brazil from 1961 to 2016. Int. J. Climatol. 40, 2464–2478. doi: 10.1002/joc.6345
Bitencourt, D. P., Fuentes, M., Maia, P., and Amorim, F. T. (2016). Frequência, Duração, Abrangência Espacial e Intensidade das Ondas de Calor no Brasil Rev. Bras. Meteorol 31:77. doi: 10.1590/0102-778631231420150077
Brás, T. A., Seixas, J., Carvalhais, N., and Jägermeyr, J. (2021). Severity of drought and heatwave crop losses tripled over the last five decades in Europe. Environ. Res. Lett. 16:065012. doi: 10.1088/1748-9326/abf004
Calim Costa, M., Marengo, J. A., Alves, L. M., and Cunha, A. P. (2024). Multiscale analysis of drought, heatwaves, and compound events in the Brazilian Pantanal in 2019–2021. Theor. Appl. Climatol. 155, 661–677. doi: 10.1007/s00704-023-04655-2
Catto, J. L., and Dowdy, A. (2021). Understanding compound hazards from a weather system perspective. Weather Clim. Extr. 32:100313. doi: 10.1016/j.wace.2021.100313
Ceccherini, G., Russo, S., Ameztoy, I., Romero, P. C., and Carmona-Moreno, C. (2016). Magnitude and frequency of heat and cold waves in recent decades: the case of South America. Nat. Hazards Earth Syst.Sci., 16, 821–831. doi: 10.5194/nhess-16-821-2016
Chitsaz, F., Gohari, A., Najafi, M. R., Zareian, M. J., and Haghighi, A. T. (2023). Heatwave duration and heating rate in a non-stationary climate: spatiotemporal pattern and key drivers. Earth Future 11:e2023EF003995. doi: 10.1029/2023EF003995
Collazo, S., Barrucand, M., and Rusticucci, M. (2023). Hot and dry compound events in South America: present climate and future projections, and their association with the Pacific Ocean. Nat Hazards, 119, 299–323. doi: 10.1007/s11069-023-06119-2
Copernicus Climate Change Service. (2023). Global Climate Highlights. Available at: https://climate.copernicus.eu/global-climate-highlights-2023 (Accessed October 2, 2024).
Coronato, T., Carril, A. F., Zaninelli, P. G., and Abalone, R. (2024). Exploring warm extremes in South America: insights into regional climate change projections through dry-bulb and wet-bulb temperatures. Clim. Dyn. 62, 4391–4410. doi: 10.1007/s00382-024-07140-2
Costa, N. V., and Rodrigues, R. R. (2021). Future summer marine heatwaves in the western South Atlantic. Geophys. Res. Lett. 48:e2021GL094509. doi: 10.1029/2021GL094509
Detring, C., Müller, A. A., Schielicke, L., Névir, P., and Rust, H. W. (2021). Occurrence and transition probabilities of omega and high-over-low blocking in the euro-Atlantic region. Articles Weather Clim. Dyn. 2, 927–952. doi: 10.5194/wcd-2-927-2021
Donat, M. G., Alexander, L. V., and Yang, H. (2013). Updated analyses of temperature and precipitation extreme indices since the beginning of the twentieth century: the HadEX2 dataset. J Geophys Res Atmos. doi: 10.1002/jgrd.50150
Domeisen, I. V. D., Eltahir, E. A. B., Fischer, E., Knutti, R., Perkins-Kirkpatrick, S., Schär, C., et al. (2022). Prediction and projection of heatwaves. Nat. Rev. Earth Environ. 4, 36–50. doi: 10.1038/s43017-022-00371-z
Dunn, R. J. H., Herold, N., Alexander, L. V., Donat, M. G., Allan, R., Bador, M., et al. (2024). Observed global changes in sector-relevant climate extremes indices— an extension to HadEX3. Earth Space Sci. 11:e2023EA003279. doi: 10.1029/2023EA003279
Espinoza, J., Jimenez, J. C., Marengo, J. A., Schongart, J., Ronchail, J., Lavado-Casimiro, W., et al. (2024). The new record of drought and warmth in the Amazon in 2023 related to regional and global climatic features. Sci. Rep. 14:8107. doi: 10.1038/s41598-024-58782-5
Fernandes, R., and Leblanc, S. G. (2005). Parametric (modified least squares) and non-parametric (Theil–Sen) linear regressions for predicting biophysical parameters in the presence of measurement errors. Remote Sens. Environ. 95, 303–316. doi: 10.1016/j.rse.2005.01.005
Feron, S., Cordero, R. R., Damiani, A., Lanillo, P. J., Jorquera, J., Sepulveda, E., et al. (2019). Observations and projections of heatwaves in South America. Sci. Rep. 9, 1–15. doi: 10.1038/s41598-019-44614-4
Feron, S., Cordero, R. R., Damiani, A., MacDonell, S., Pizarro, J., Goubanova, K., et al. (2024). South America is becoming warmer, drier, and more flammable. Commun. Earth Environ. 5:501. doi: 10.1038/s43247-024-01654-7
Firpo, M. A. F., Sansigolo, C. A., and Assis, S. V. (2012). Climatologia e variabilidade sazonal do número de ondas de calor e de frio no Rio Grande do Sul associadas ao ENOS. Revista Brasileira Meteorol. 27, 95–106. doi: 10.1590/S0102-77862012000100010
Frich, P., Alexander, L. V., Della-Marta, P., Gleason, B., Haylock, M., Tank, A. K., et al. (2002). Observed coherent changes in climatic extremes during the second half of the twentieth century. Clim. Res. 19, 193–212. doi: 10.3354/cr019193
Geirinhas, J. L., et al. (2017). Climatic and synoptic characterization of heat waves in Brazil Int. J. Climatol., 38, 1760–76.
Geirinhas, J. L., Russo, A. C., Libonati, R., Miralles, D. G., Ramos, A. M., Gimeno, L., et al. (2023). Combined large-scale tropical and subtropical forcing on the severe 2019–2022 drought in South America, npj climate and atmospheric. Science 6:185. doi: 10.1038/s41612-023-00510-3
Geirinhas, J. L., Russo, A. C., Libonati, R., Miralles, D. G., Sousa, P. M., Wouters, H., et al. (2022). The influence of soil dry-out on the record-breaking hot 2013/2014 summer in Southeast Brazil. Sci. Rep. 12:5836. doi: 10.1038/s41598-022-09515-z
Geirinhas, J. L., Russo, A., Libonati, R., Sousa, P. M., Miralles, D. G., and Trigo, R. M. (2021). Recent increasing frequency of compound summer drought and heatwaves in Southeast Brazil. Environ. Res. Lett. 16:034036. doi: 10.1088/1748-9326/abe0eb
Geirinhas, J. L., Trigo, R. M., Libonati, R., Castro, L. C. O., Sousa, P. M., Coelho, C. A. S., et al. (2019). Characterizing the atmospheric conditions during the 2010 heatwave in Rio de Janeiro marked by excessive mortality rates. Sci. Total Environ. 650, 796–808. doi: 10.1016/j.scitotenv.2018.09.060
Geirinhas, J. L., Trigo, R. M., Libonati, R., Coelho, C. A., and Palmeira, A. C. (2018). Climatic and synoptic characterization of heat waves in Brazil. Int. J. Climatol. 38, 1760–1776. doi: 10.1002/joc.5294
Hartinger, S., Yglesias-González, M., and Blanco-Villafuerte, L. (2023). The 2022 South America report of the lancet countdown on health and climate change: trust the science. Now that we know, we must act. Lancet Reg. Health Am. 20:100470. doi: 10.1016/j.lana.2023.100470
Hersbach, H., Bell, B., Berrisford, P., Biavati, G., Horanyi, A., and Muñoz Sabater, J. (2018) ERA5 hourly data on pressure levels from 1979 to present. Copernicus climate change service (C3S) climate data store (CDS). doi: 10.24381/cds.bd0915c6
Hersbach, H., Bell, B., Berrisford, P., Biavati, G., Horányi, A., and Muñoz Sabater, J. (2023) ERA5 monthly averaged data on pressure levels from 1940 to present. Copernicus climate change service (C3S) Climate Data Store (CDS). doi: 10.24381/cds.6860a573
Hersbach, H., Bell, B., Berrisford, P., Horanyi, A., Muñoz- Sabater, J., Nicolas, J., et al. (2020). The ERA5 global reanalysis. Q. J. R. Meteorol. Soc. 146, 1999–2049. doi: 10.1002/qj.3803
Hertig, E., Russo, A., and Trigo, R. M. (2020). Heat and ozone pollution waves in central and South Europe—characteristics. Weather Types Assoc. Mortality Atmosphere 11:1271. doi: 10.3390/atmos11121271
INMET (2023). Balanço de inverno/2023 no Brasil, Ministério da Agricultura e Pecuária – Mapa. Brasília: Instituto Nacional de Meteorologia – Inmet.
IPCC (2021). Climate change 2021: The physical science basis. Contribution of working group I to the sixth assessment report of the intergovernmental panel on climate change. Cambridge: Cambridge University Press.
IPCC (2023). Climate change 2023: synthesis report. Contribution of working groups I, II and III to the sixth assessment report of the intergovernmental panel on climate change. Geneva: IPCC.
Jiang, N., Zhu, C., Hu, Z. Z., McPhaden, M. J., Chen, D., Liu, B., et al. (2024). Enhanced risk of record-breaking regional temperatures during the 2023–24 El Niño. Sci. Rep. 14:2521. doi: 10.1038/s41598-024-52846-2
Kautz, L.-A., Martius, O., Pfahl, S., Pinto, J. G., Ramos, A. M., Sousa, P. M., et al. (2022). Atmospheric blocking and weather extremes over the euro-Atlantic sector – a review. Weather Clim. Dynam. 3, 305–336. doi: 10.5194/wcd-3-305-2022
Kew, S., Pinto, I., Alves, L., Santos, D., Libonati, R., Philip, S., et al. (2023). Strong influence of climate change in uncharacteristic early spring heat in South America. London: Imperial College.
Lanfredi, I. S. (2018). As Ondas de Calor sobre a América do Sul em suas áreas de atuação Regional. Ph. Thesis. São Paulo: Department of Atmospheric Sciences, University of São Paulo.
Larbey, R., and Weitkamp, E. (2020). Water scarcity communication in the UK: learning from water company communications following the 2018 heatwave. Front. Environ. Sci. 8:578423. doi: 10.3389/fenvs.2020.578423
Lavaysse, C., Cammalleri, C., Dosio, A., Van der Schrier, G., Toreti, A., and Vogt, J. (2018). Towards a monitoring system of temperature extremes in Europe. Nat. Hazards Earth Syst. Sci. 18, 91–104. doi: 10.5194/nhess-18-91-2018
Libonati, R., Geirinhas, J. L., Silva, P. S., Rodrigues, J. A., Russo, A., Peres, L. F., et al. (2022). Drought–heatwave nexus in Brazil and related impacts on health and fires: A comprehensive review. Ann. N. Y. Acad. Sci. 1517, 44–62. doi: 10.1111/nyas.14887
Libonati, R., Geirinhas, J. L., Silva, P. S., Russo, A., Rodrigues, J. A., Belém, L. B. C., et al. (2021). Assessing the role of compound drought and heatwave events on unprecedented 2020 wildfires in the Pantanal environ. Res. Lett. 17:015005. doi: 10.1088/1748-9326/ac462e
Lipfert, L., Hand, R., and Brönnimann, S. (2024). A global assessment of heatwaves since 1850 in different observational and model data sets. Geophys. Res. Lett. 51:e2023GL106212. doi: 10.1029/2023GL106212
Marengo, J. A., Ambrizzi, T., Barreto, N., Cunha, A. P., Ramos, A. M., Skansi, M., et al. (2021). The heatwave of October 2020 in Central South America. Int. J. Climatol. 42, 2281–2298. doi: 10.1002/joc.7365
Marengo, J. A., Cunha, A. P., Espinoza, J.-C., Fu, R., Schongart, J., Jimenez, J. C., et al. (2024). The drought of Amazonia in 2023-2024. Am. J. Clim. Chang. 13, 567–597. doi: 10.4236/ajcc.2024.133026
McEvoy, D., Ahmed, I., and Mullett, J. (2012). The impact of the 2009 heatwave on Melbourne’s critical infrastructure. Local Environ. 17, 783–796. doi: 10.1080/13549839.2012.678320
McKee, T.B., Doesken, N.J., and Kleist, J. (1993). “The relationship of drought frequency and duration to time scale,” in Proceedings of the Eighth Conference on Applied Climatology, Anaheim, California, 17–22 January 1993. Boston, MA: American Meteorological Society, 179–184.
Metropolis (2023). Available at: https://www.metropoles.com/saude/como-o-calor-mata-taylor-swift (accessed July 3, 2024).
Miralles, D. G., Teuling, A. J., VanHeerwaarden, C. C., and DeArellano, J. V. G. (2014). Mega-heatwave temperatures due to combined soil desiccation and atmospheric heat accumulation. Nat. Geosci. 7, 345–349.
Miranda, V. F. V. V., Monteiro dos Santos, D. M., Peres, L. F., Salvador, C., Nieto, R., Muller, G., et al. (2024). Heat stress in South America over the last four decades: a bioclimatic analysis. Theor. Appl. Climatol. 155, 911–928. doi: 10.1007/s00704-023-04668-x
Monteiro dos Santos, D., Libonati, R., Garcia, B. N., Geirinhas, J. L., Salvi, B. B., Rodrigues, J. A., et al. (2024b). Twenty-first-century demographic and social inequalities of heat-related deaths in Brazilian urban areas. PLoS One 19:e0295766. doi: 10.1371/journal.pone.0295766
Monteiro dos Santos, D., Oliveira, A. M., Duarte, E. S., Rodrigues, J. A., Menezes, L. S., Albuquerque, R., et al. (2024a). Compound dry-hot-fire events in South America: an unapparent, long-range and deadly ripple effect. NPJ Nat. Hazards 1:31. doi: 10.1038/s44304-024-00031-w
NCEI-NOAA (2023). National Centers for environmental information and National Oceanic and Atmospheric Administration. Annual 2023 global climate report. Asheville, NC: NCEI-NOAA.
Nobre, C. A., Marengo, J. A., Seluchi, M. E., Cuartas, L. A., and Alves, L. M. (2016). Some Characteristics and Impacts of the Drought and Water Crisis in Southeastern Brazil during 2014 and 2015. Journal of Water Resource and Protection, 8, 252–262. doi: 10.4236/jwarp.2016.82022
Orlov, A., Sillmann, J., Aunan, K., Kjellstrom, T., and Aaheim, A. (2020). Economic costs of heat-induced reductions in worker productivity due to global warming. Glob. Environ. Change 63:102087. doi: 10.1016/j.gloenvcha.2020.102087
Perkins, S. E., Alexander, L. V., and Nairn, J. R. (2012). Increasing frequency, intensity and duration of observed global heatwaves and warm spells. Geophys. Res. Lett. 39:3361. doi: 10.1029/2012GL053361
Perkins-Kirkpatrick, S., Barriopedro, D., Jha, R., Wang, L., Mondal, A., Libonati, R., et al. (2024). Extreme terrestrial heat in 2023. Nat. Rev. Earth Environ. 5, 244–246. doi: 10.1038/s43017-024-00536-y
Perkins-Kirkpatrick, S., and Lewis, S. (2020). Increasing trends in regional heatwaves. Nat. Commun. 11, 3357–3358. doi: 10.1038/s41467-020-16970-7
Regoto, P., Dereczynski, C., Chou, S. C., and Bazzanela, A. C. (2021). Observed changes in air temperature and precipitation extremes over Brazil. Int. J. Climatol. 41, 5125–5142. doi: 10.1002/joc.7119
Rivera, J. A., Arias, P. A., Sorensson, A., Zachariah, M., Barnes, C., Philip, S., et al. (2023). Early-summer heatwave in southern South America: 60 times more likely due to climate change. Climatic Change 176:102. doi: 10.1007/s10584-023-03576-3
Rodrigues, R. R., and Woollings, T. (2017). Impact of atmospheric blocking on South America in austral summer. J. Clim. 30, 1821–1837. doi: 10.1175/JCLI-D-16-0493.1
Ruffault, J., Curts, T., Moron, V., Trigo, R., Mouillot, F., Koutsias, N., et al. (2020). Increased likelihood of heat-induced large wildfires in the Mediterranean basin. Sci. Rep. 10:13790. doi: 10.1038/s41598-020-70069-z
Russo, S., et al. (2014). Magnitude of extreme heat waves in present climate and their projection in a warming world. J. Geophys. Res. Atmos. 119, 12500–12512.
Satgé, F., Pillco, R., Molina-Carpio, J., Mollinedo, P. P., and Bonnet, M. (2023). Reliability of gridded temperature datasets to monitor surface air temperature variability over Bolivia. Int. J. Climatol. 43, 6191–6206. doi: 10.1002/joc.8200
Schumacher, D. L., et al. (2019). Amplification of mega-heatwaves through heat torrents fuelled by upwind drought. Nat. Geosci. 12, 712–717.
Sen, P. K. (1968). Estimates of the regression coefficient based on Kendall's tau. J. Am. Stat. Assoc. 63, 1379–1389. doi: 10.1080/01621459.1968.10480934
Seneviratne, S., Donat, I. M. G., Mueller, B., and Alexander, L. V. (2014). No pause in the increase of hot temperature extremes. Nat. Clim. Chang. 4, 161–163. doi: 10.1038/nclimate2145
Seneviratne, S. I., Zhang, X., Adnan, M., Badi, W., Dereczynski, C., Di Luca, A., et al. (2023). “Weather and climate extreme events in a changing climate” in Climate change 2021 – The physical science basis: Working group I contribution to the sixth assessment report of the intergovernmental panel on climate change. eds. V. Masson-Delmotte, P. Zhai, A. Pirani, and S. L. Connors (Cambridge: Cambridge University Press), 1513–1766.
Simões dos Reis, N., Boiaski, N. T., and Ferraz, S. E. (2019). Characterization and spatial coverage of heatwave s in subtropical Brazil. Atmos. 10:284. doi: 10.3390/atmos10050284
Skansi, M. D. L., Brunet, M., Sigró, J., Aguilar, E., Groening, J. A., Bemtacur, O., et al. (2013). Warming and wetting signals emerging from analysis of changes in climate extreme indices over South America. Glob. Planet. Change 100, 295–307. doi: 10.1016/j.gloplacha.2012.11.004
Sousa, P. M., Barriopedro, D., García-Herrera, R., Woollings, T., and Trigo, R. M. (2021). A new combined detection algorithm for blocking and subtropical ridges. J. Clim. 34, 1–64. doi: 10.1175/JCLI-D-20-0658.1
Souza, C. M., Marengo, J. Á., Bruno, B., Ribeiro, J., Schirmbeck, L. W., Schirmbeck, J., et al. (2024). Amazon severe drought in 2023 triggered surface water loss. Environ. Res. Clim. 3:41002. doi: 10.1088/2752-5295/ad7c71
Suli, S., Barriopedro, D., García-Herrera, R., and Rusticucci, M. (2023). Regionalisation of heat waves in southern South America. Extremes 40:100569. doi: 10.1016/j.wace.2023.100569
The Guardian (2023). Available at: https://www.theguardian.com/world/2023/aug/03/south-america-winter-heatwave (Accessed October 2, 2024).
Theil, H. (1950). A rank-invariant method of linear and polynomial regression analysis. I, II, III. Nederl. Akad. Wetensch. Proc. 53, 386–392.
Ullah, S., You, Q., Chen, D., Sachindra, D. A., AghaKouchak, A., Kang, S., et al. (2022). Future population exposure to daytime and nighttime heat waves in South Asia. Earth Fut. 10:e2021EF002511. doi: 10.1029/2021EF002511
Ullah, S., You, Q., Ullah, W., Haga, D. F. T., Ali, A., Zhang, Y., et al. (2019). Daytime and nighttime heat wave characteristics based on multiple indices over the China–Pakistan economic corridor. Clim. Dyn. 53, 6329–6349. doi: 10.1007/s00382-019-04934-7
Ullah, S., You, Q., Ullah, W., Sachindra, D. A., Ali, A., Bhatti, A. S., et al. (2023). Climate change will exacerbate population exposure to future heat waves in the China-Pakistan. Economic Corridor Weather Clim. Extr. 40:100570. doi: 10.1016/j.wace.2023.100570
Valverde, M. C., and Barbio, M. (2023). Heatwave s in São Paulo state, Brazil: intensity, duration, spatial scope, and atmospheric characteristics. Int. J. Climatol. 43, 3782–3798. doi: 10.1002/joc.8058
Vicedo-Cabrera, A. M., Scovronick, N., and Sera, F. (2021). The burden of heat-related mortality attributable to recent human-induced climate change. Nat. Clim. Chang. 11, 492–500. doi: 10.1038/s41558-021-01058-x
Wang, Y., Zhao, N. A., Wu, C., Quan, J., and Chen, M. (2023). Future population exposure to heatwaves in 83 global megacities. Sci. Total Environ. 888:164142. doi: 10.1016/j.scitotenv.2023.164142
Washington Post (2023). Available at: https://www.washingtonpost.com/weather/2023/08/02/southamerica-record-winter-heat-argentina-chile/ (Accessed August 3, 2024).
World Economic Forum (2024). Available at: https://www.weforum.org/agenda/2024/01/climate-change-health-impact-mortality/ (Accessed September 1, 2024).
Xie, W., Zhou, B., You, Q., Zhang, Q., and Ullah, S. (2020). Observed changes in heat waves with different severitiesin China during 1961–2015. Theor. Appl. Climatol. 141, 1529–1540. doi: 10.1007/s00704-020-03285-2
Xu, P., Wang, L., Liu, Y., Chen, W., and Huang, P. (2019). The record-breaking heat wave of June 2019 in Central Europe. Atmos Sci Lett. 21:e964. doi: 10.1002/asl.964
Zachariah, M., Philip, S., Pinto, I., Vahlberg, M., Singh, R., Otto, F., et al. (2023). Extreme heat in North America, Europe and China in July 2023 made much more likely by climate change. Sci. Rep. 22:105549. doi: 10.25561/105549
Zhang, X., Hegerl, G., Zwiers, F., and Kenyon, J. (2005). Avoiding inhomogeneity in percentile-based indices of temperature extremes. J. Clim. 18, 1641–1651. doi: 10.1175/JCLI3366.1
Zhang, Q., She, D., Zhang, L., Wang, G., Chen, J., and Hao, Z. (2022). High sensitivity of compound drought and heatwave events to global warming in the future. Earths Future 10:e2022EF002833. doi: 10.1029/2022EF002833
Zhang, B., and Xie, Z. (2023). Mechanism of the record-breaking heatwave event dynamics in South America in January 2022. Atmos. 14:1326. doi: 10.3390/atmos14091326
Zhao, Q., Li, S., Coelho, M. S. Z. S., Saldiva, P. H. N., Hu, K., Huxley, R. R., et al. (2019). The association between heatwaves and risk of hospitalization in Brazil: A nationwide time series study between 2000 and 2015. PLoS Med. 16:e1002753. doi: 10.1371/journal.pmed.1002753
Keywords: heatwaves, El Niño, drought, compound drought-heat events, atmospheric blocking, maximum temperature, trends heatwaves
Citation: Marengo JA, Costa MC, Cunha AP, Espinoza J-C, Jimenez JC, Libonati R, Miranda V, Trigo IF, Sierra JP, Geirinhas JL, Ramos AM, Skansi M, Molina-Carpio J and Salinas R (2025) Climatological patterns of heatwaves during winter and spring 2023 and trends for the period 1979–2023 in central South America. Front. Clim. 7:1529082. doi: 10.3389/fclim.2025.1529082
Edited by:
Victor Ongoma, Mohammed VI Polytechnic University, MoroccoReviewed by:
José Francisco Oliveira Júnior, Federal University of Alagoas, BrazilCopyright © 2025 Marengo, Costa, Cunha, Espinoza, Jimenez, Libonati, Miranda, Trigo, Sierra, Geirinhas, Ramos, Skansi, Molina-Carpio and Salinas. This is an open-access article distributed under the terms of the Creative Commons Attribution License (CC BY). The use, distribution or reproduction in other forums is permitted, provided the original author(s) and the copyright owner(s) are credited and that the original publication in this journal is cited, in accordance with accepted academic practice. No use, distribution or reproduction is permitted which does not comply with these terms.
*Correspondence: Jose A. Marengo, am9zZS5tYXJlbmdvQGNlbWFkZW4uZ292LmJy
Disclaimer: All claims expressed in this article are solely those of the authors and do not necessarily represent those of their affiliated organizations, or those of the publisher, the editors and the reviewers. Any product that may be evaluated in this article or claim that may be made by its manufacturer is not guaranteed or endorsed by the publisher.
Research integrity at Frontiers
Learn more about the work of our research integrity team to safeguard the quality of each article we publish.