 Virgílio A. Bento
94% of researchers rate our articles as excellent or good
Learn more about the work of our research integrity team to safeguard the quality of each article we publish.
Find out more
ORIGINAL RESEARCH article
Front. Clim. , 21 February 2025
Sec. Climate Risk Management
Volume 7 - 2025 | https://doi.org/10.3389/fclim.2025.1519880
The Iberian Peninsula (IP) is anticipated to undergo future shifts in precipitation patterns and an increased occurrence of hot and dry extreme (HDE) weather events, including droughts and heatwaves. Such events pose substantial risks to the region’s population and ecosystems, particularly amidst evolving demographic dynamics marked by an overall population decrease and contrasting growth in urban areas. This study evaluates population exposure to HDEs in the IP, comparing projected conditions for the late 21st century with the historical period (1971–2000). The Standardized Precipitation-Evapotranspiration Index (SPEI) is used to quantify droughts’ duration and the number of warm months to assess the frequency of extreme heat events. Two representative concentration pathways (RCPs), specifically RCP4.5 and RCP8.5, are considered to represent distinct greenhouse gas emission scenarios. This research reveals a significant projected increase in population exposure to both drought and warm months across the entire IP by the century’s end, with climate change identified as the primary driver of this escalation. Certain regions will experience a particularly drastic surge in drought exposure, while exposure to warm months may exceed 500% in some cases. Climate change’s impact on exposure surpasses that of population change, and the interplay between climate and population changes predominantly contributes negatively across all Iberian regions. These findings are expected to provide valuable insights for policymakers, planners, and stakeholders, guiding the development of targeted adaptation strategies and resource allocation. This proactive approach aims to enhance the resilience of vulnerable communities and ecosystems in response to the evolving climatic conditions.
The Iberian Peninsula (hereafter IP) is a region highly susceptible to the impacts of climate change (Andrade et al., 2021; Diffenbaugh et al., 2007; Diffenbaugh and Giorgi, 2012; Giorgi, 2006), with projected shifts in precipitation patterns (Soares et al., 2017a) and increased frequency of hot and dry extreme (HDE) weather events (Cardoso et al., 2023; Soares et al., 2023). Droughts and heatwaves stand out as significant environmental challenges that pose substantial risks to the population and ecosystems of the region (Bastos et al., 2014; Bento et al., 2021; García-Herrera et al., 2005; Salvador et al., 2020, 2021; Trigo et al., 2009). Droughts exacerbate water scarcity, impacting agriculture, hydropower production, and urban water supply, while extreme heat poses significant risks to human health, particularly among vulnerable populations such as the elderly and those with pre-existing conditions. Exposure to these climate extremes is further amplified by the region’s socio-economic context, including urbanization patterns, aging demographics, and economic reliance on water-intensive sectors like tourism and agriculture. Understanding the interplay between HDEs, population exposure, and socio-economic vulnerability is critical for informing effective adaptation strategies and mitigating the adverse impacts of climate change in the Iberian Peninsula. Understanding the future dynamics of HDEs and its implications for human well-being is crucial for developing effective adaptation strategies and policies. Particularly, compound extreme events possess the capacity to exacerbate the impacts compared to individual stressors (Zscheischler et al., 2018; Bevacqua et al., 2023), thereby driving global socioeconomic systems closer to critical tipping points (Brunner et al., 2021; Zscheischler et al., 2020). This phenomenon arises from the cumulative stressors that can surpass the resilience of both natural and human systems exposed to extreme conditions. Notably, when such stressors manifest as significant natural hazards like a drought event or heatwave—culprits in 40% of global disaster-related fatalities in recent decades—the resultant consequences can be calamitous (Douris et al., 2021).While it is vital to understand how these extreme events are potentiated, how they interact, and how their compound occurrence may exacerbate their effects on the population, it is important to consider the changing population dynamics, which is not evolving equally throughout the world. While the global population is projected to continue growing (United Nations, 2019), the IP is expected to experience an overall decrease in population, primarily driven by declining birth rates and an aging population (Newsham and Rowe, 2023). However, this overall trend masks the contrasting growth observed in urban areas, particularly in the larger cities (Kabisch and Haase, 2011). Urbanization and migration patterns are reshaping the demographic landscape of the region, concentrating populations in urban centres and surrounding areas (Bosch, 2000; González-Leonardo et al., 2023). These demographic changes have the potential to significantly alter the vulnerability and resilience of communities to HDE impacts. As urban areas expand and populations concentrate, the demand for water resources and the exposure to HDE risks become critical. Simultaneously, the declining population in rural areas may have implications for agricultural activities and resources availability (Newsham and Rowe, 2023), further influencing the social and economic dimensions of HDE impacts. Notably, an increase in population exposure within areas prone to hazards has been identified as a more influential factor in the future escalation of certain extreme events than merely amplifying the hazards themselves (Tabari and Willems, 2023). Consequently, the changing nature of these risk components underscores the need for proactive disaster risk reduction initiatives aimed at managing the potential impacts of compound events. While numerous studies have investigated the impact of hot, dry, or combined hot and dry events on populations in various regions worldwide or on a global scale (Smirnov et al., 2016; Liu and Chen, 2021; Tabari and Willems, 2023; Wang et al., 2023; Yin et al., 2023), there remains a notable absence of research specifically centered on the IP. Therefore, it becomes imperative to study the extent to which future HDE events may affect the changing population dynamics in this decreasing population area.
This research aims to assess population exposure to drought and warm months, comparing the projected conditions at the end of the 21st century (2066–2095) with the historical period (1971–2000). To quantify and classify drought and warm months, the Standardized Precipitation-Evapotranspiration Index (SPEI) and the number of hot days (NHD) per months will be used. The SPEI provides a comprehensive measure of meteorological drought by incorporating both precipitation and evapotranspiration data (Vicente-Serrano et al., 2010), thus allowing a holistic evaluation of drought impacts on water availability and ecosystem functioning. This makes SPEI particularly suitable for assessing agricultural (short-term) and hydrological (long-term) droughts. It quantifies the deviation of current precipitation and evapotranspiration amounts from the long-term historical average at different time scales. The inclusion of evapotranspiration data also makes SPEI more sensitive to changes in temperature, enabling a more accurate assessment of future population exposure to drought on the IP considering climate change (Vicente-Serrano et al., 2010; Beguería et al., 2014). In the case of extreme hot events, the option relied on NHD, which is a climate index that quantifies the frequency of extreme heat events and represents the count of days with maximum temperatures exceeding a predetermined threshold, such as the 90th percentile of historical temperature data. The NHD provide valuable information about the occurrence and intensity of hot weather conditions, aiding in the assessment of climate change impacts and their implications for various sectors, including human health, agriculture, and energy demand (Bento et al., 2022; Russo et al., 2019). Monitoring and understanding NHD plays a crucial role in developing strategies to cope with the challenges posed by increasing temperatures and extreme heat events (Zhang et al., 2011).
Overall, this study seeks to shed light on the implications of projected shifts in HDE conditions to the population exposure in IP at the end of the 21st century, considering the changing population dynamics, particularly the contrasting trends between urban and rural areas. We consider two representative concentration pathways (RCPs) to represent different greenhouse gas emission scenarios: RCP4.5, representing a moderate emissions trajectory, and RCP8.5, representing a high-emission scenario. These scenarios allow us to explore a range of possible future climate conditions and their potential impacts on drought occurrence.
Thus, the objectives of this research are threefold: (1) to evaluate the historical patterns of HDE (droughts and warm months) and population on the IP during the reference period (1971–2000); (2) to project and compare the population exposure to drought and warm months at the end of the 21st century under the RCP4.5 and RCP8.5 scenarios; and (3) to assess the contributions of changes in population, climate, and their interaction, and the potential implications of these projected changes in population exposure to HDEs for socioeconomic systems and environmental sustainability. By examining population exposure to HDEs using SPEI and NHD, this study contributes to a better understanding of the potential future impacts of climate change on the IP and their inhabitants. The findings of this research will aid policymakers, planners, and stakeholders in developing targeted adaptation strategies and resource allocation to enhance the resilience of vulnerable communities and ecosystems in the face of changing climatic conditions.
This study focuses on the IP, located in the southwestern part of Europe, encompassing both Portugal and Spain. The region is characterized by three primary bioclimatic zones: Mediterranean dry, Mediterranean oceanic, and temperate oceanic (Rivas-Martinez et al., 2011; Gouveia et al., 2012, 2018). The Mediterranean dry climate dominates the eastern areas of the IP and is marked by dry, hot summers prone to intense, frequent, and prolonged droughts, along with mild, wet winters. The Mediterranean oceanic climate prevails in the western parts of the IP, particularly in the southwest, with similar summer droughts but greater oceanic influence. In contrast, the temperate oceanic bioclimate, found in the northern and northwestern regions, features milder temperatures, warm summers, and relatively consistent precipitation across all seasons. These diverse climatic conditions significantly influence the hydrological cycles, vegetation dynamics, and socio-economic activities in the region, making the IP a critical area for studying population exposure to hot and dry climate extremes.
HDEs refer to the occurrence of extreme heat and arid conditions that significantly disrupt the environmental, social, and economic fabric of a region. Heatwaves, defined as prolonged periods of excessively hot temperatures, and droughts, characterized by a deficiency of precipitation over extended periods, can occur independently or as compound events, where their simultaneous occurrence exacerbates the impacts on human health, agriculture, and ecosystems (Zscheischler et al., 2018). The Iberian Peninsula is highly vulnerable to these extreme weather conditions, with projections suggesting a significant increase in the frequency, intensity, and duration of HDEs by the end of the 21st century (Soares et al., 2023). While droughts traditionally have been assessed through their meteorological and hydrological impacts, their socio-economic effects, especially on agriculture and water resources, cannot be underestimated. For instance, reduced precipitation during droughts hampers agricultural productivity, leading to food shortages and increased prices, which disproportionately affect low-income communities (Bevacqua et al., 2021; Ribeiro et al., 2020a, 2020b). Similarly, heat events put an additional pressure on energy demand, particularly in urban centres where demand spikes due to increased air conditioning use (Davis and Gertler, 2015).
During the last decades, people, assets, and systems have been consistently more exposed to environmental hazards such as HDEs. This exposure refers to the degree to which they are affected by HDEs, while vulnerability encompasses sensitivity to these events and adaptive capacity (IPCC, 2012). Exposure is extremely influenced by demographic shifts, with rural areas declining in population and urban centres growing (González-Leonardo et al., 2023; Gómez Valenzuela and Holl, 2023). Considering expected changes (Figure 1), urban areas face higher exposure due to denser populations than rural areas.
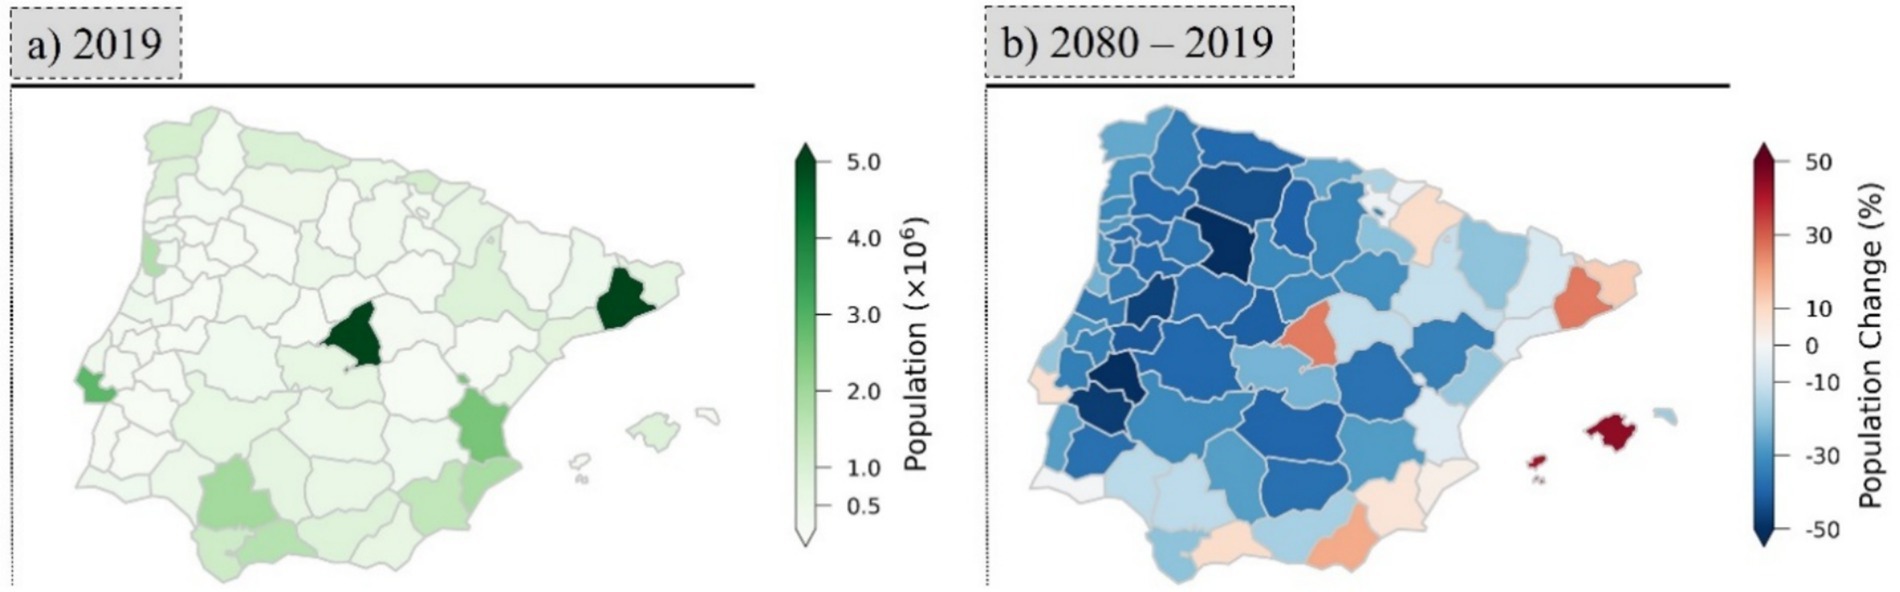
Figure 1. Population in millions of people in each NUTS III regions in 2019 (A), and the projected % of population change in 2080 relative to 2019 (B). Values are obtained from EUROSTAT EUROPOP 2019.
On the other hand, socio-economic vulnerability of populations is not uniform (García-León et al., 2021), with vulnerable groups such as the elderly, children, and people with comorbidities facing heightened risks during extreme climate events (Thiery et al., 2021; Salvador et al., 2022; Monteiro Dos Santos et al., 2024). The socio-economic impacts of HDEs in the Iberian Peninsula are severe, threatening food security (Ribeiro et al., 2020a, 2020b), public health (Salvador et al., 2020; Alho et al., 2024), and economic stability (García-León et al., 2021). To mitigate these effects, adaptation strategies are crucial, including climate-resilient agriculture, improved urban planning, and targeted social protection for vulnerable populations (Bento et al., 2021).
The conceptual framework of this research (Figure 2) is centred on evaluating the historical patterns of HDEs in relation to population dynamics in the IP, projecting future exposure to these events under varying climate scenarios, and assessing the contributions of climate change and population shifts to vulnerability. By focusing on the impacts of droughts and warm months, the study aims to better understand how these changes will affect the region’s population, hopefully providing valuable insights for the development of adaptation strategies and resource management to improve resilience in vulnerable areas.
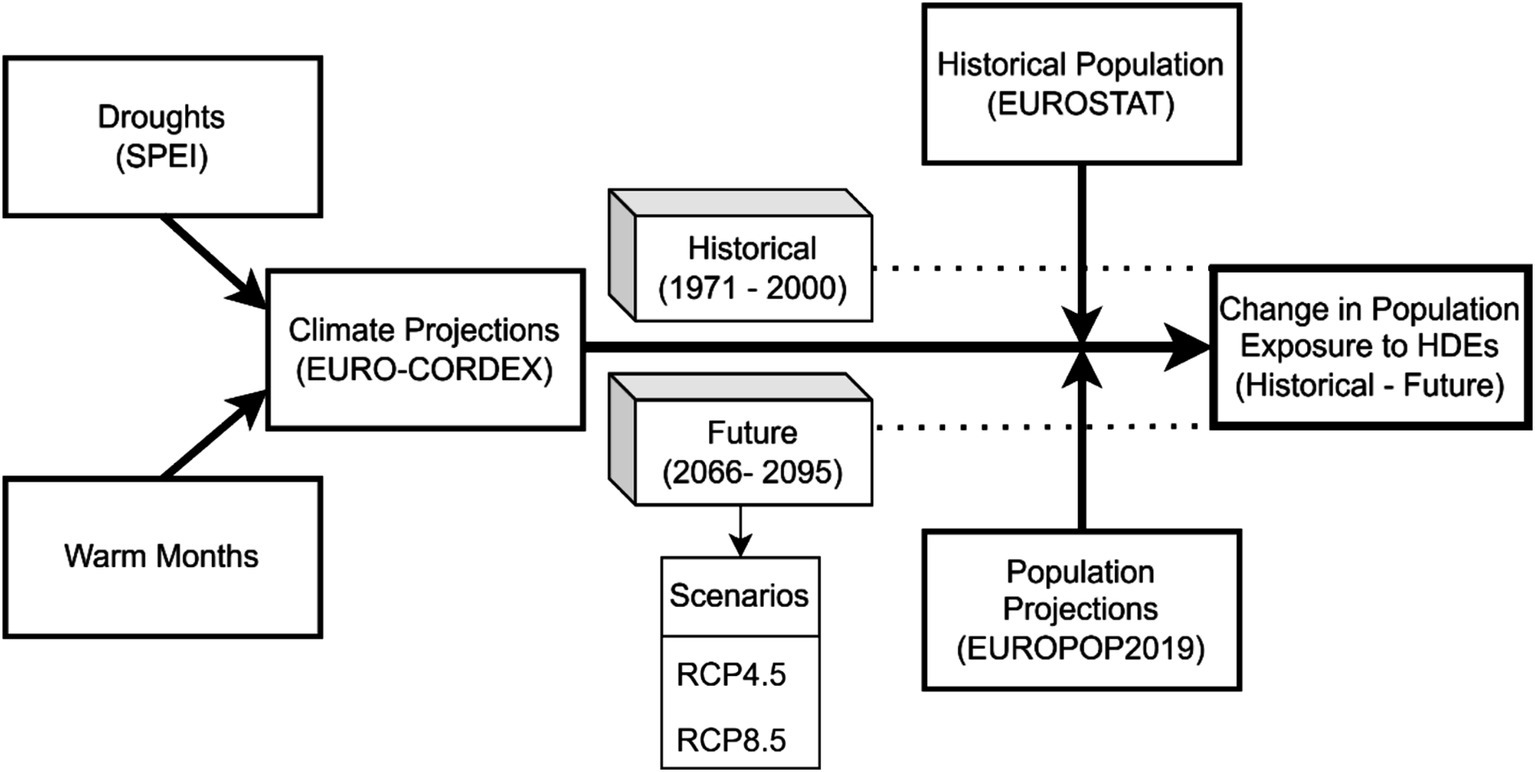
Figure 2. Conceptual framework.
The regional climate projections used in this study were obtained from the EURO-CORDEX initiative, which is part of the larger CORDEX experiment (Giorgi et al., 2009). EURO-CORDEX provides a comprehensive collection of Regional Climate Model (RCM) simulations specifically designed to cover the European region. To achieve a high-resolution representation, the simulations employ a horizontal grid spacing of 0.11°, achieved through the process of dynamically downscaling Global Climate Models (GCMs) from the CMIP5 project (Jacob et al., 2014).
For this research, two EURO-CORDEX experiments were considered, encompassing different time periods, namely: (i) the historical period from 1971 to 2000; and (ii) the projected end of the century period spanning 2066 to 2095, aligned with two distinct emission scenarios: RCP4.5 and RCP8.5. We have opted to analyse RCP4.5 and RCP8.5, keeping RCP2.6 out of the study, to maintain the clarity and conciseness of the manuscript. Furthermore, RCP2.6 represents an ambitious mitigation scenario that may be overly optimistic for the study area at this time (Cos et al., 2022; Matthews and Wynes, 2022; Masson-Delmotte et al., 2021). Daily total precipitation, as well as the maximum and minimum 2-meter temperatures, were the primary variables of interest. These data records were accessed through the Earth System Grid Federation (ESGF) data portal and encompassed outputs from 13 RCMs. A detailed overview of the RCMs used in this study and their corresponding driving GCMs is presented in Table 1. The respective references for each RCM are provided, and detailed descriptions of the parametrizations used can be found in Kotlarski et al. (2014) and Katragkou et al. (2015).
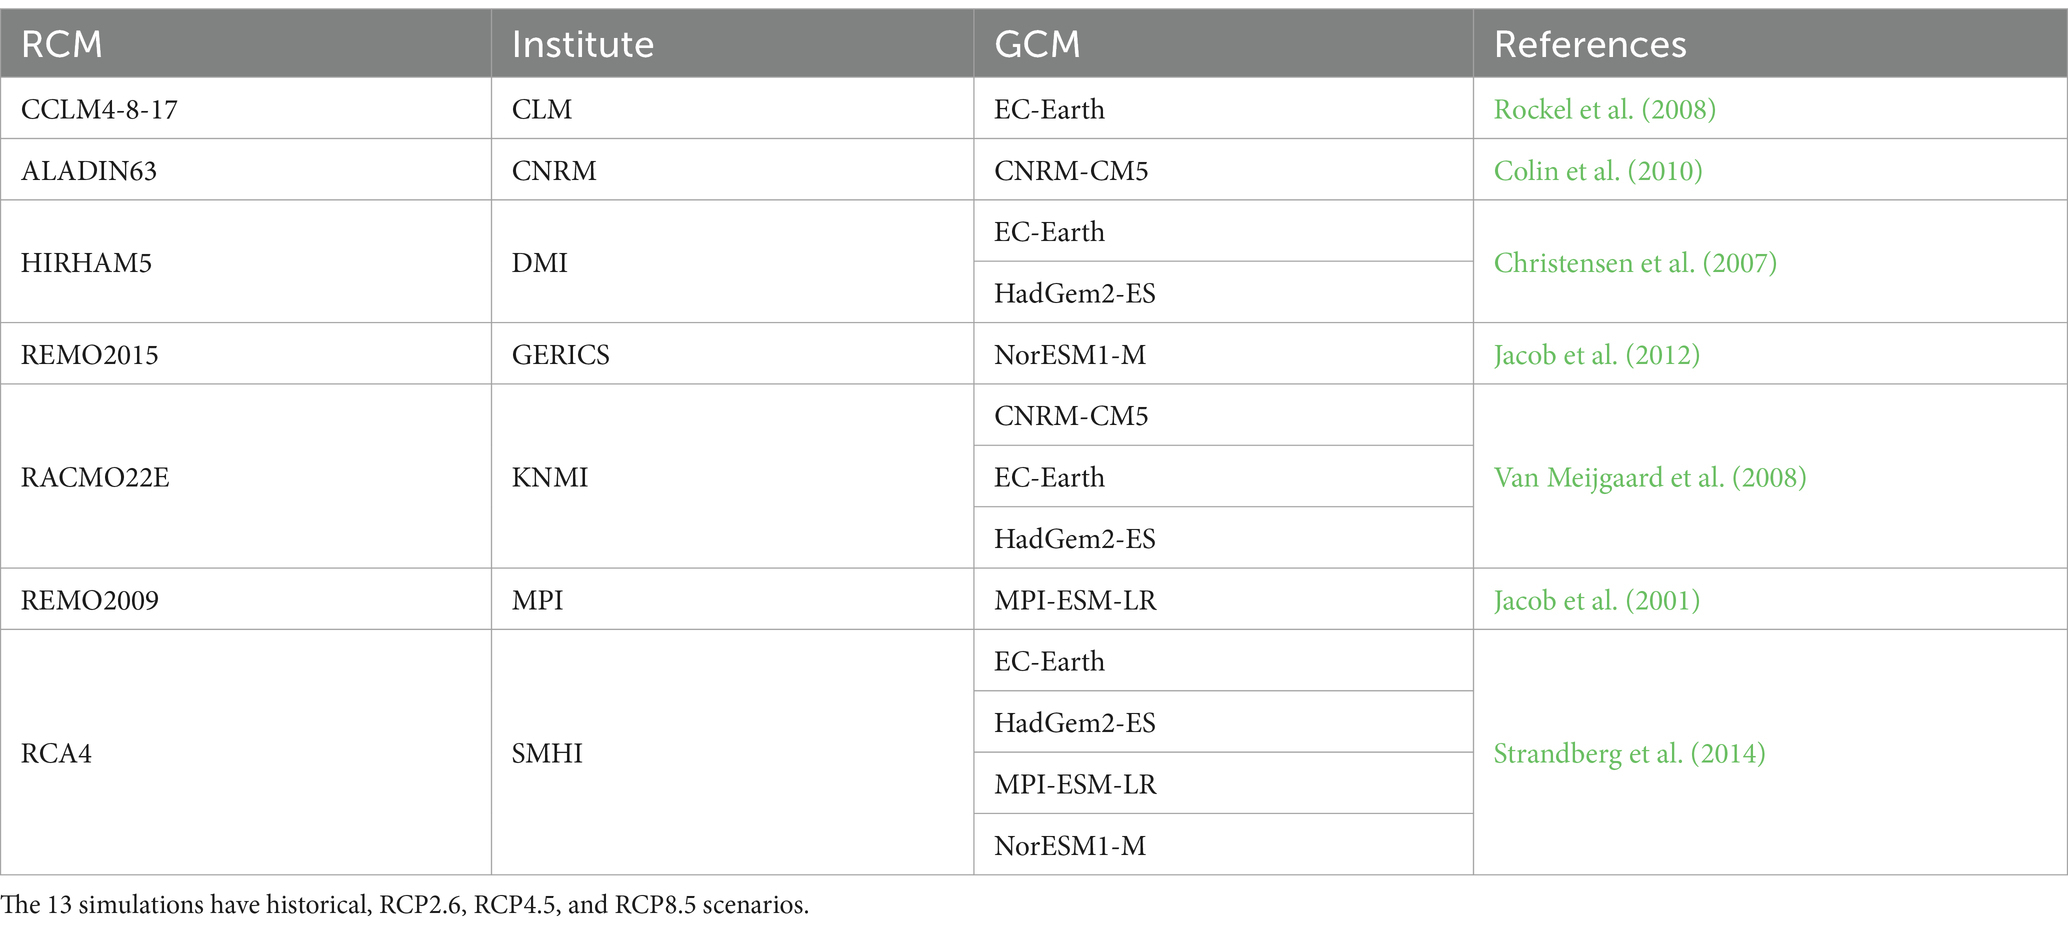
Table 1. EURO-CORDEX RCMs used in this study, along with the responsible institute and the forcing GCMs.
The EURO-CORDEX simulations have undergone extensive evaluation to assess their ability to accurately represent current climate conditions. Multiple studies have demonstrated significant improvements in simulating key climate variables, capturing both the spatial and temporal variability across Europe (Vautard et al., 2013; Kotlarski et al., 2014; Katragkou et al., 2015; Prein et al., 2016) and specifically within the IP (Cardoso et al., 2019; Lima et al., 2023a, 2023b; Soares et al., 2017a). Notably, Soares and Cardoso (2018) quantified the added value of utilizing the high-resolution EURO-CORDEX simulations throughout the entire European domain, revealing significant enhancements in capturing precipitation patterns, particularly for extreme events. Additionally, Cardoso and Soares (2022) assessed the added value of EURO-CORDEX simulations for temperature across Europe, while Careto et al. (2022a, 2022b) evaluated the added value for both temperature and precipitation characteristics specifically within the IP. Collectively, these studies provide compelling evidence for the benefits of using EURO-CORDEX simulations in delivering enhanced representations of temperature and precipitation characteristics in the study area. By incorporating the robust EURO-CORDEX dataset into our analysis, we can leverage the advancements in spatial and temporal representation achieved through downscaling, thus enabling a comprehensive evaluation of population exposure to HDEs under different future climate scenarios on the IP.
This study uses a weighted multi-variable multi-model ensemble, combining precipitation, maximum temperature, and minimum temperature variables. This choice was made as weighted multi-model ensembles improve climate simulations and provide reliable projections (Brunner et al., 2019; Christensen et al., 2010; Eyring et al., 2019; Knutti et al., 2017; Lorenz et al., 2018; Sanderson et al., 2017; Wenzel et al., 2016). Performance evaluation of 13 EURO-CORDEX RCMs against the Iberia01 dataset over the IP (Herrera et al., 2019) provided the model weights following the approach of Lima et al. (2023a). The ensemble performs well in representing precipitation means and extremes, as well as temperature, instilling confidence in its ability to characterize future climate extremes and indices (Lima et al., 2023b). The approach enhances drought assessment based on SPEI index (Soares et al., 2023).
Population projections for this study are sourced from Eurostat (European Statistical Office; DG ESTAT). The Eurostat data covers regional demographic trends across 31 countries, including the 27 European Union (EU) Member States and the four European Free Trade Association (EFTA) countries, referred to as EU+. The population projections used in this study are derived from the Eurostat Population Projections 2019-based dataset (EUROPOP2019;1 Lanzieri, 2020) for Portugal and Spain. These projections are aggregated at the regional level and are based on population and vital events data up to 2018, following the NUTS 2016 classification system, specifically NUTS III. The projection time horizon extends until 2,100, with intervals of 5 years starting from 2020. The study focuses specifically on 73 NUTS III, which correspond to continental Portugal and Spain, as well as the Balearic Islands (Supplementary Figure S1).
It is important to note that the methodology employed in the Eurostat population projections assumes a gradual reduction in socioeconomic disparities among the EU+ countries over a long period of time. Consequently, major demographic indicators are expected to converge across countries, although complete convergence is not assumed. Instead, the assumption is that countries will move together and become increasingly similar in demographic aspects due to the expected convergence of socioeconomic drivers. For more information on the data and methodology, please refer to the Eurostat website.2
However, historical population values for Iberia in NUTS III are only available from 2014 onwards in the Eurostat dataset. Therefore, values of population for the year 2019 were used for the historical period (Figure 1A). For the end of the century, the population value from the year 2080 (middle of the period) is used (Figure 1B).
To attain the set goal, our investigation focused on assessing drought through the computation of the SPEI (Vicente-Serrano et al., 2010). SPEI was computed for the IP at a spatial resolution of 0.11° from 1971 to 2,100 monthly, using the RCP4.5 and RCP8.5 scenarios as projected by EURO-CORDEX (Jacob et al., 2014; Kjellström et al., 2018; Table 1). The reference period for assessing climate change was 1971–2000 (Kjellström et al., 2018; Soares et al., 2023). All indices were computed by considering the full period, from 1971 to 2005 merged with 2006–2100 from each RCP scenario. Accumulation periods of 3 and 12 months were addressed as representative of short-term and long-term droughts, respectively. This temporal multi-scalar approach provides a valuable advantage as it allows for a diverse characterization of the phenomenon, considering the varying response times of different ecosystems to drought conditions. In line with the methodology proposed by Beguería et al. (2014), reference evapotranspiration was determined for each grid-point using the Hargreaves equation (Hargreaves and Samani, 1985).
Mathematically, the computation of SPEI for the different accumulation periods involves fitting a probability density function to a series of differences between precipitation and evapotranspiration (climatic water balance) (Vicente-Serrano et al., 2010). Log-logistic distribution functions were employed, and the parameters of the distributions were estimated using the L-moment method (Wilks, 2011), and a rectangular kernel function was applied to aggregate data from preceding months.
In this study, drought severity is categorized into three levels: moderate, severe, and extreme. These categories follow a predefined classification based on thresholds. The categorization used in this study aligns with the classification defined by Agnew (2000). A moderate drought is identified when the index value falls between −0.84 and −1.28. A severe drought is characterized by index values ranging from −1.28 to −1.64. Finally, an extreme drought is determined when the index value falls below −1.64. These specific thresholds provide a standardized framework for assessing and comparing drought severity based on SPEI. By utilizing these predefined thresholds, we can effectively quantify and classify drought events into distinct severity levels, enabling a comprehensive analysis of population exposure to different levels of drought intensity.
To assess drought duration in this study, the number of months experiencing moderate, severe, and extreme drought is computed for each 30-year period (historical and end of the century) using the SPEI under RCP4.5 and RCP8.5 scenarios. This computation is performed for the grid-points of the 13 RCMs included in the analysis. Next, the spatial average of drought duration is calculated for the NUTS III regions, representing subnational geographic statistical units. This allows for a regional-scale analysis of drought occurrence. The weighted multi-model ensemble approach (Lima et al., 2023a) is then applied to estimate the number of months in moderate, severe, and extreme drought for each NUTS III region.
To further investigate the drought patterns, the anomaly of the number of months in each drought category is computed. This anomaly calculation involves comparing the drought durations obtained from the end of the century projected weighted multi-model ensemble with the historical baseline period. Specifically, the difference in the number of months in each category of drought is calculated, providing insight into the changes and variations in drought occurrence over time for each NUTS III region.
In the main body of the paper, the results concerning SPEI-12 are presented, while results for SPEI-3 are showed in Supplementary material. This was done for the sake of simplicity as the results are aligned.
In the quest to detect changes in climate extremes, a range of bio-climatic indices have been developed, ensuring statistical robustness, wide applicability across various climates, and a high signal-to-noise ratio (Zhang et al., 2011). Among these indices, the NHD emerges as a prominent measure, which has been proven useful in several studies addressing hot extremes and/or their impacts (e.g., Mueller and Seneviratne, 2012; Ribeiro et al., 2020a, 2020b; Russo et al., 2019). NHD is defined as the count of days at each grid point where the maximum temperature exceeds the 90th percentile threshold (Fischer et al., 2007; Zhang et al., 2011). This index provides valuable insights into the frequency of extreme heat events and their potential variations over time, making it a crucial tool for studying climate change impacts and trends.
Here, a similar approach to the previous subsection is followed: the NHD are counted for each month over the 30-year period (historical and end of the century) under RCP4.5 and RCP8.5 scenarios. This is performed for the grid-points of each one of the 13 RCMs. Then, a warm month is considered if the NHD is larger than the 90th percentile of the NHD in the historical period (this is performed on a grid-point basis). Finally, the anomaly of warm months is computed by comparing the end of the century projected multi-model ensemble (RCP4.5 and RCP8.5) with the historical period. Then, the spatial average of the number of warm months is estimated for the NUTS III regions. This allows for a regional-scale analysis of extreme heat occurrences.
Addressing population exposure to HDEs is a crucial aspect for understanding the potential impacts of such events on human populations. In this study, population exposure is defined as the product of the number of HDE occurrences, and the number of people exposed, following the approach outlined in previous studies (Chen and Sun, 2021; Jones et al., 2015; Zhang et al., 2022).
To account for interannual variability and provide a more robust assessment, a 30-year mean of HDE occurrences and population data is performed to estimate population exposure, as recommended by Liu et al. (2020) and Ullah et al. (2022). This approach helps capturing long-term trends and reduce the influence of year-to-year fluctuations. The computation of population exposure to HDEs is represented by the Equation 1:
where E represents the 30-year average population exposure, i corresponds to the calculation year within the selected period, HDEi indicates the number of months affected by HDE during that particular year, and P represents the population in the central year of the calculation period. The exposure is measured in person-month per year.
Population exposure to HDE is computed for each 30-year period of historical and future projections of HDE and population. To quantify the change in exposure, Equation 2 is employed:
where δE denotes the change in population exposure to HDE, while Efut and Ehist represent the population exposures at the end of the century and historical periods, respectively. The change in exposure is presented as a percentage, indicating the magnitude of the difference between future and historical population exposure to HDEs.
To disentangle the influences of climate change and population dynamics on exposure to HDE, the approach proposed by Jones et al. (2015) is adopted in this study. This attribution analysis method has been widely applied in studying the contributions of various factors to changes in exposure to extreme events, such as heat (Ullah et al., 2022), compound hot and dry (Zhang et al., 2022), or precipitation (Chen and Sun, 2021) extremes.
The exposure change (ΔE) is decomposed and attributed to the effects of population change (RC_pop: captures the changes in exposure resulting solely from variations in population size), climate change (RC_clim: isolates the impact of changes in HDE occurrences driven by climate change), and their interactions (RC_int: captures the combined influence of population dynamics and climate change) (Equation 3). By quantifying these individual contributions, a comprehensive understanding of the relative importance of each factor can be gained. For example, in the case of heat-related mortality, RC_pop represents how an increasing or decreasing population size directly influences the number of people exposed to extreme heat. RC_clim reflects how the intensification of HDEs due to climate change raises the risk of heat-related mortality, regardless of population changes. Finally, RC_int captures the combined effect, such as when a growing population coincides with increasing HDEs, leading to an amplified impact on heat-related health outcomes. The attribution of changes in exposure to drought (ΔE) is quantified by examining the contributions of climate change and population dynamics using the following equation:
where HDEH represents the occurrence of HDEs during the historical period, PH represents the population during the same period, and ΔHDE and ΔP represent the changes in HDE occurrence and population in the future period compared to the reference period.
To assess the relative importance of each term, their contributions can be quantified by calculating the percentage change they contribute to the overall change in exposure, as follows by Equation 4:
where RC is the relative contribution of population, climate, and the interaction between population and climate (noted as Relative Term ) to the exposure change ΔE . This analysis enables a comprehensive understanding of the relative significance of each factor and their combined effects on population exposure.
The occurrence of months with SPEI-12 (i.e., long-term drought) falling within thresholds associated with moderate, severe, and extreme drought during the historical period is presented in Figure 3A. Results reveal that over a span of 360 months (30 years), certain regions in coastal northern and northwestern IP experienced a maximum of nearly 30 months in a state of moderate drought. Conversely, some inner regions exhibited between 5 and 10 months in moderate drought. In terms of severe drought, northern regions and certain eastern coastal areas reached a maximum of 10 to 14 months. Extreme droughts were rare events and typically occurred less than 5 months over the 30-year period in most of IP. Similar spatial patterns were observed for droughts measured with SPEI-3 (i.e., short-term drought), albeit with more months affected by each type of drought (Supplementary Figure S2).
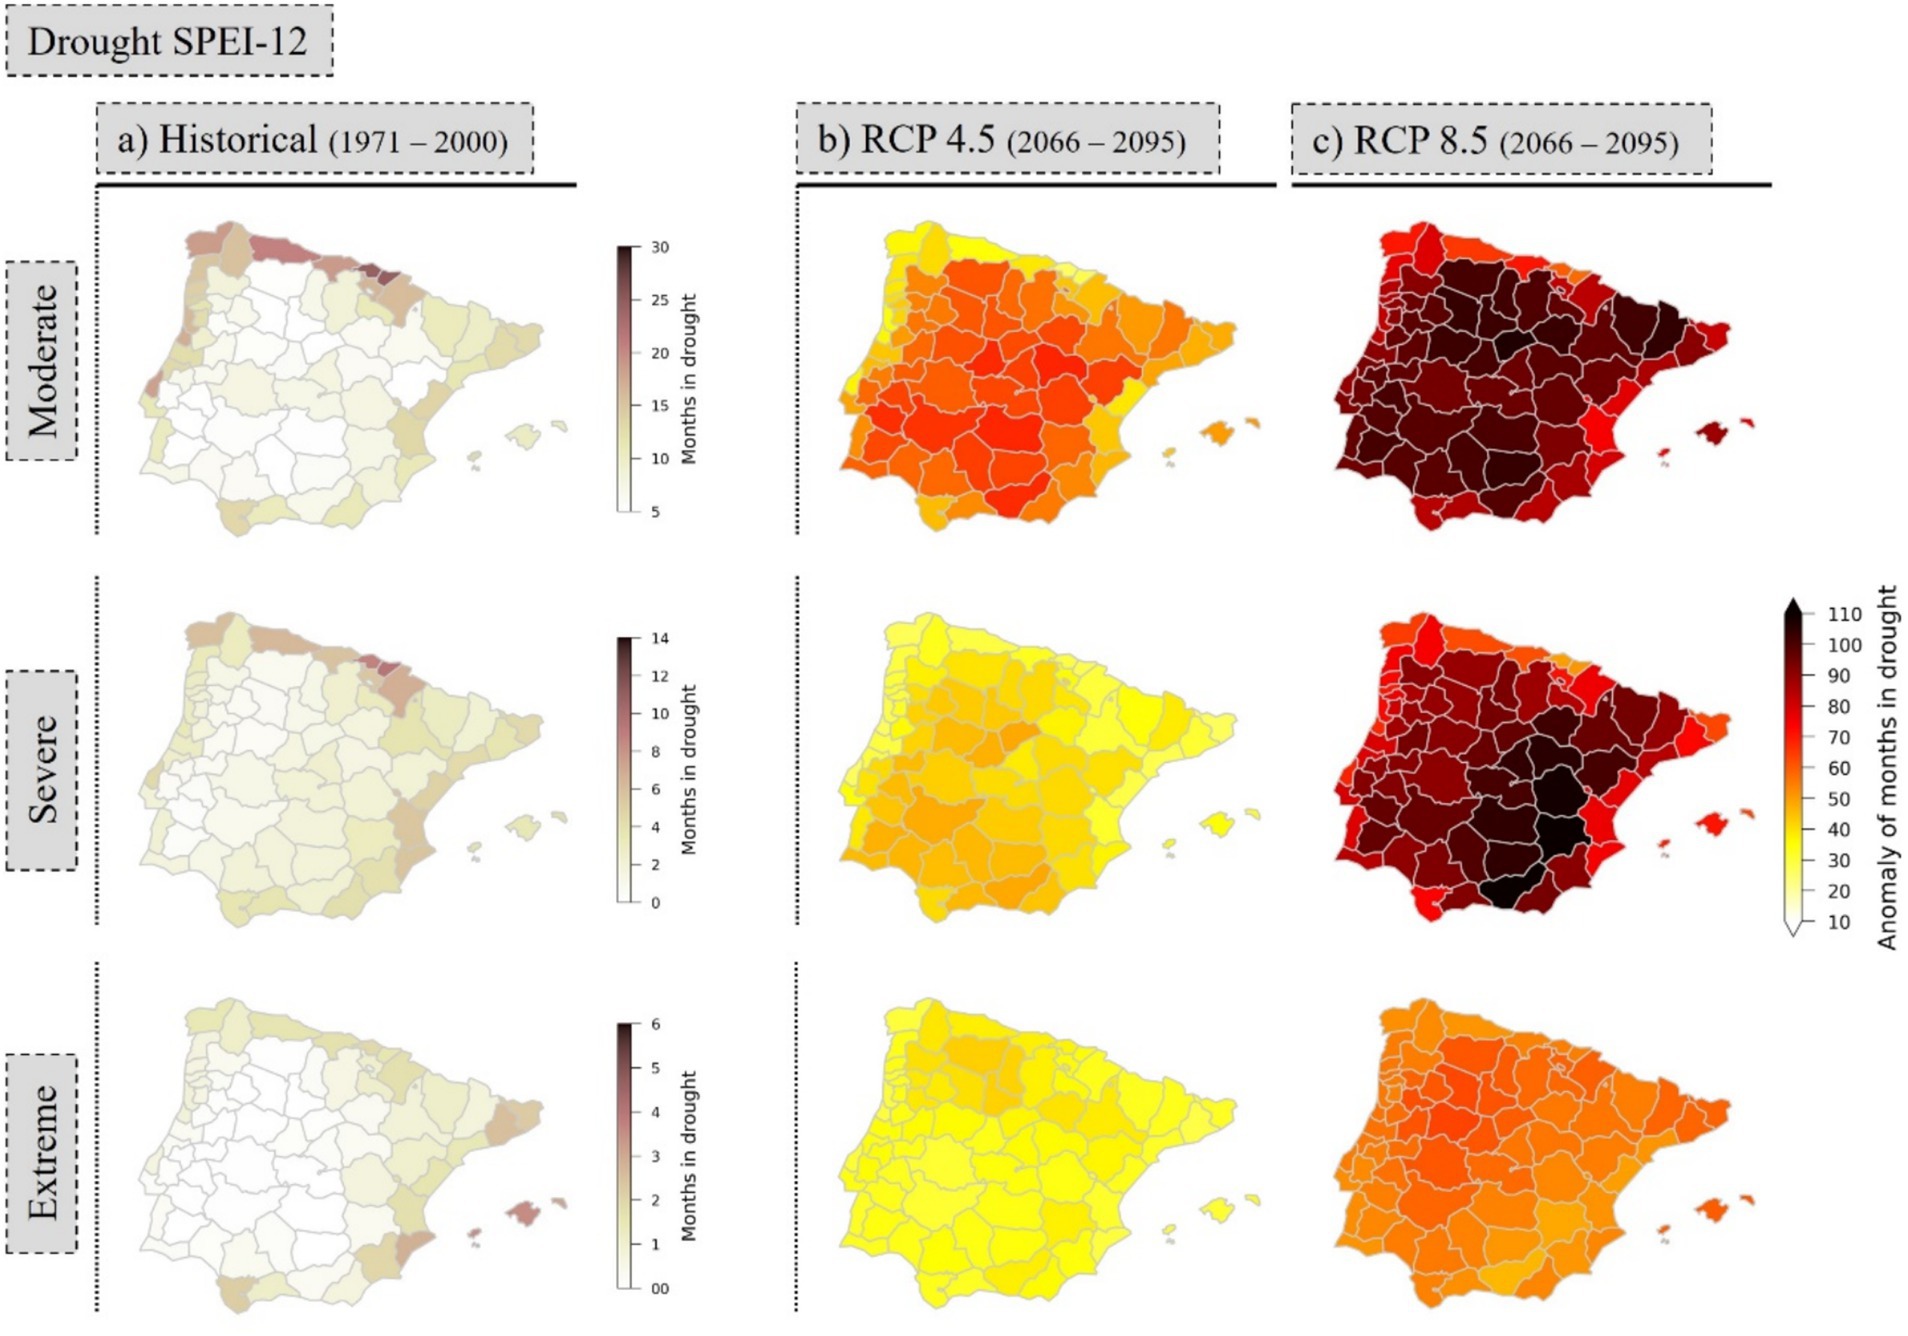
Figure 3. Moderate (top), severe (center), and extreme (bottom) droughts based on SPEI-12: (A) number of months in the historical period, (B) anomaly of the number of months in the end of the century compared with the historical period under RCP4.5, and (C) anomaly of the number of months in the end of the century compared with the historical period under RCP8.5.
Projected changes in the number of drought-affected months by the end of the century under RCP4.5 and RCP8.5 scenarios indicate substantial increases in the three types of droughts (Figures 3B,C). Regions located in inner IP are projected to experience a 10-fold increase in the number of months in moderate drought under RCP4.5 and a 20-fold increase under RCP8.5. Similarly, for severe droughts, inner regions in southeastern Iberia are projected to transition from 4 months of severe drought in the historical period to approximately 50 months under RCP4.5 and more than 110 months under RCP8.5. As for extreme droughts, central-western Spain, which experienced nearly 0 months of extreme drought during the historical period, is projected to face 30–50 months under RCP4.5 and 60–70 months under RCP8.5.
The number of warm months for the historical period point to a slight spatial variation, ranging from 33 months in some regions in southwestern Iberia to high as 40 months over northwestern Iberia (Figure 4A). Most regions exhibit about 36 warm months, which corresponds to 10% of the months in 30 years.
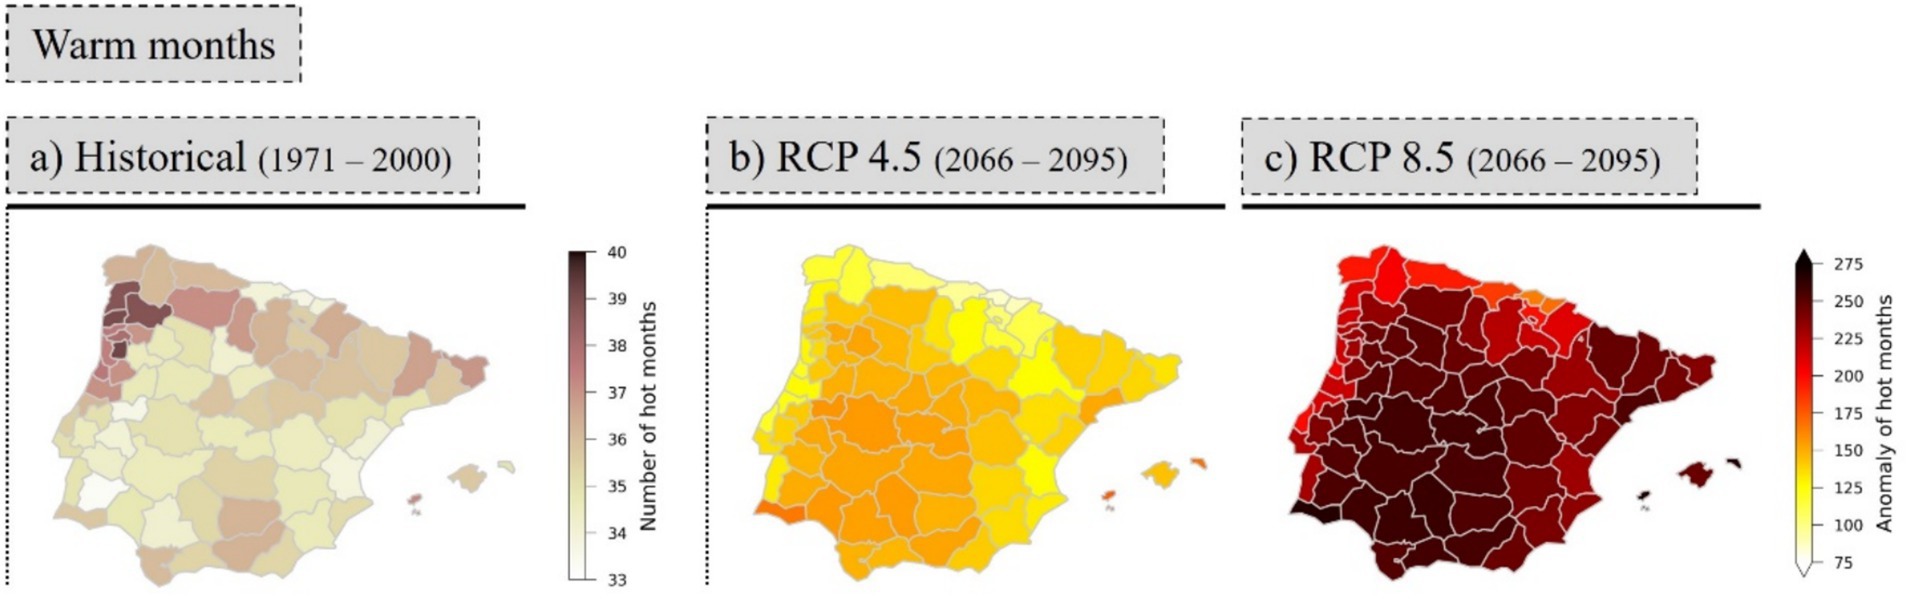
Figure 4. Number of warm months in (A) the historical period, (B) anomaly of the number of months in the end of the century compared with the historical period under RCP4.5, and (C) anomaly of the number of months in the end of the century compared with the historical period under RCP8.5.
The projections for the end of the 21st century show a pronounced increase of the number of warm months over all IP, stronger for the RCP8.5 scenario (Figure 4C), higher in the inner regions than in the north and western littoral regions. For the RCP4.5 scenario (Figure 4B), the projections indicate an increase around 100 months in some of northern and western regions, where the inner IP presents a projected increase of about 150 months. In the Algarve region (south of Portugal), the increase of warm months surpasses 150 months, reaching a maximum of 165 months. Depending on the regions, the projections point to a two- or three-fold increase in the number of warm months under RCP4.5 scenario for the end of the 21st century. Looking to RCP8.5 scenario, the increase of warm months can reach more than 275 months when compared to the historical period in the inner regions of IP. Some of northern regions have increases of about 175 months and close to 200 months along the western coast of Iberia. These results indicate that, under RCP8.5, between 50 and 75% of the months in the 30 years’ time span are projected to be warm months.
The projected changes in exposure to drought (δE) by the end of the century, with reference to the historical period, using SPEI-12 values falling within thresholds associated with moderate, severe, and extreme drought reveal a substantial increase in population exposure to drought across all categories (Figure 5; see also Supplementary Figure S3 for results concerning SPEI-3).
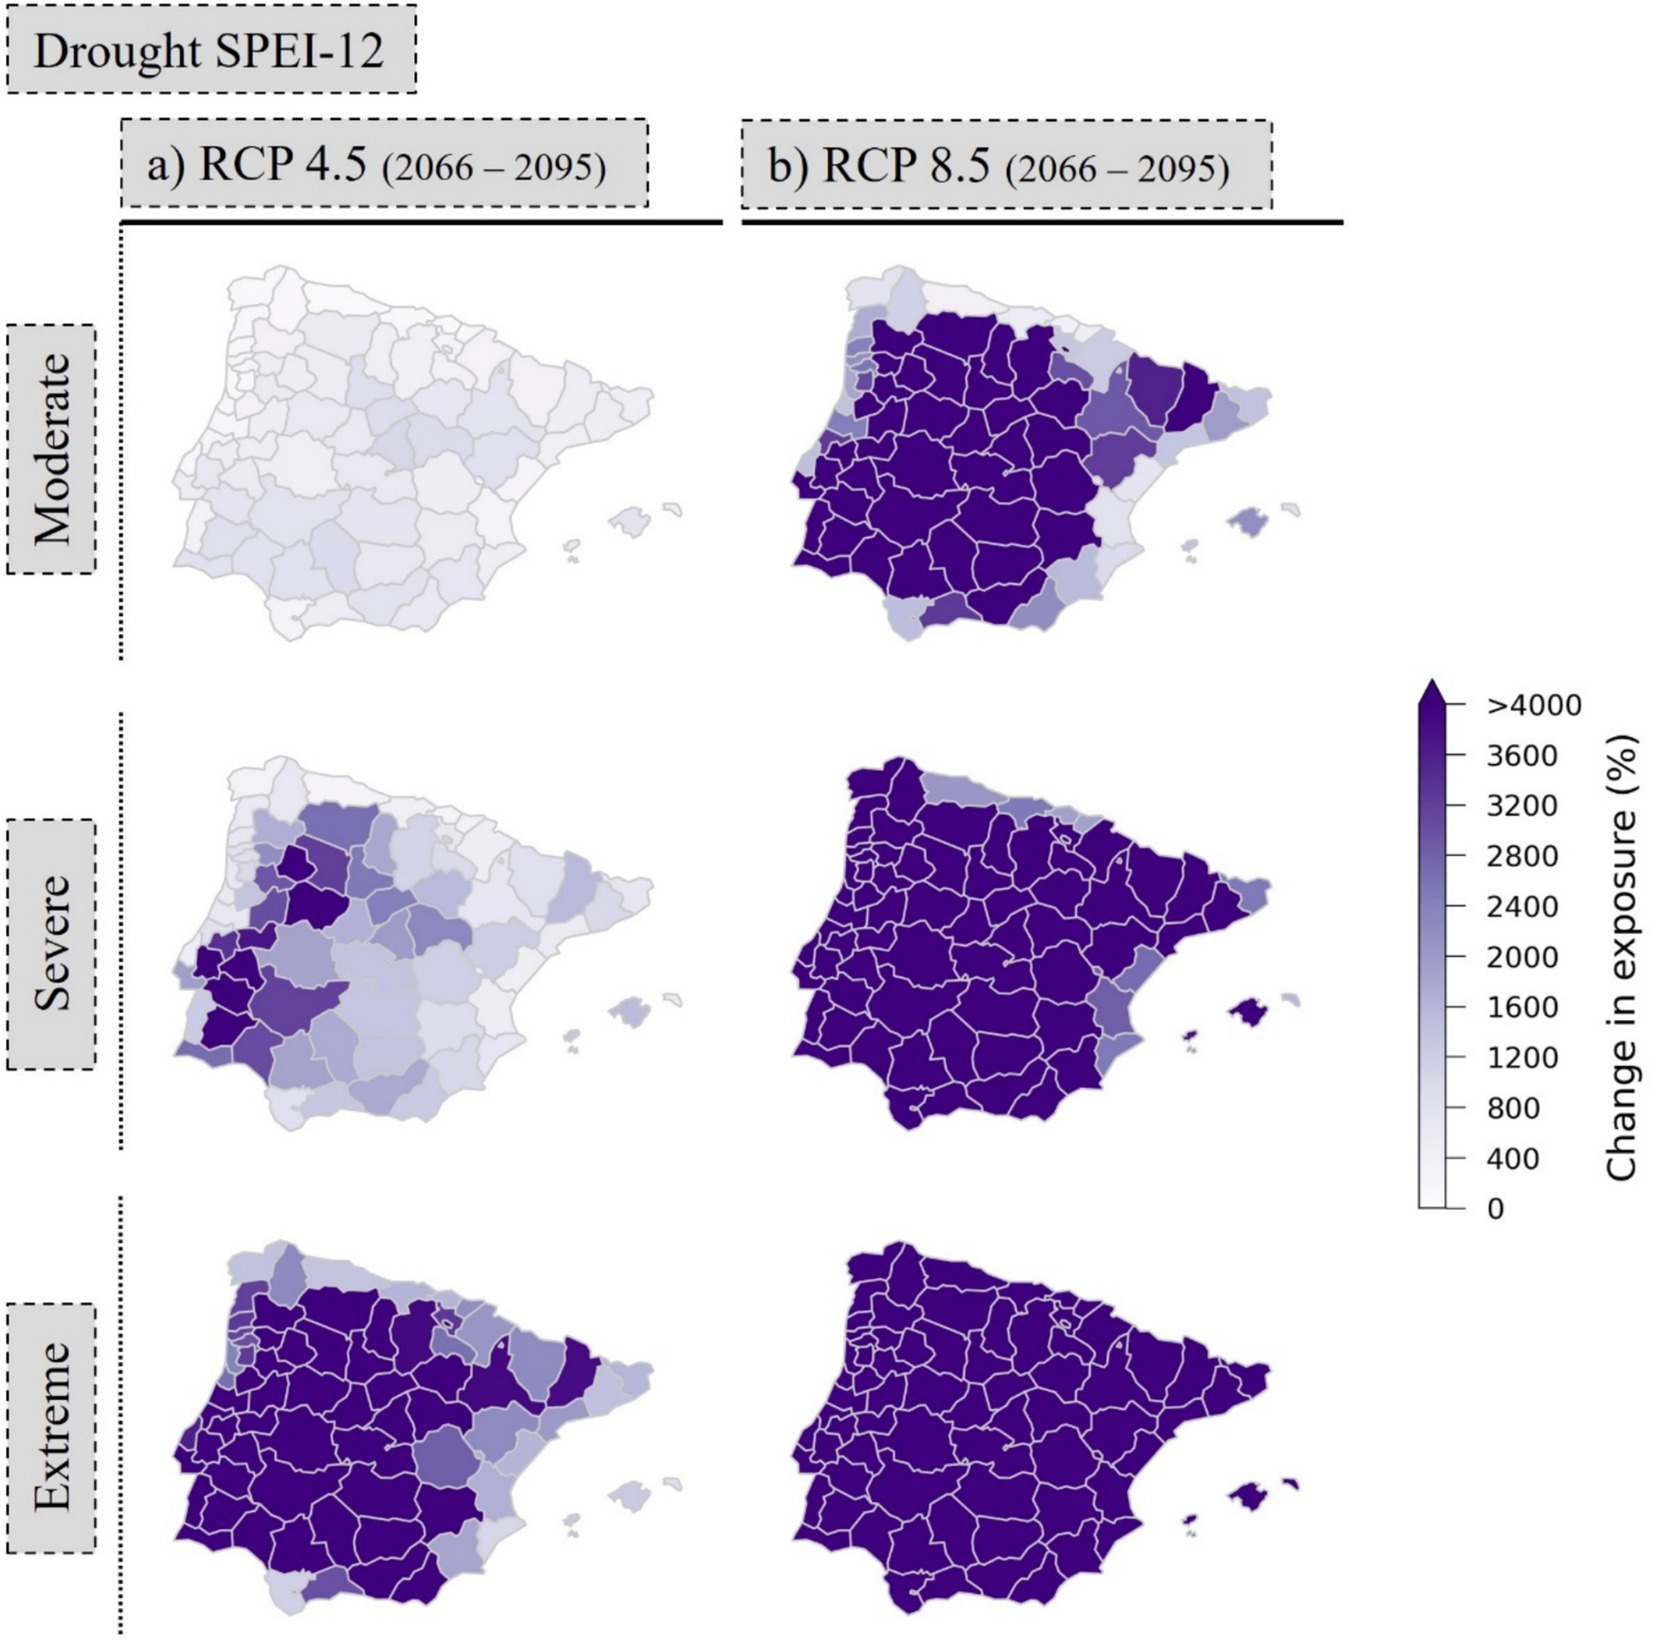
Figure 5. Moderate (top), severe (middle), and extreme (bottom) droughts based on SPEI-12: (A) change in population exposure to drought in the end of the century compared with the historical period under RCP4.5, and (B) change in population exposure to drought in the end of the century compared with the historical period under RCP8.5.
Under RCP8.5 (Figure 5B), all regions of IP are projected to experience a substantial positive change in exposure to severe and extreme droughts, with a substantial increase of over 2000%. Moderate droughts also exhibit an increase of over 2000% in most regions, except for the northern and eastern coastal areas, where the rise is slightly lower but still large. For RCP4.5 (Figure 5A), exposure to extreme droughts is projected to increase by more than 2000% in most regions, with only a few scattered coastal regions in the south, east, and north showing relatively smaller increases. Particularly noteworthy is the western coast of Portugal, which is projected to experience an increase of more than 2000% in exposure to extreme droughts. In the case of moderate droughts under RCP4.5, the percentage increases are comparatively smaller but still substantial, exceeding 200% and, in some cases, reaching more than 1,000% (e.g., Madrid, southern Portugal, and southern Spain). The population’s exposure to severe drought is anticipated to increase by over 2,000% by the end of the century when compared to historical levels, particularly in a large portion of the inner central-western region of IP. Overall, these findings indicate a concerning trend of heightened drought exposure by the end of the century, with some regions experiencing drastic increases.
Projected changes in population exposure to warm months by the end of the century compared to the historical period point to an increase in population exposure to the number of warm months (Figure 6).

Figure 6. (A) Change in population exposure to warm months in the end of the century compared with the historical period under RCP4.5, and (B) change in population exposure to hot months in the end of the century compared with the historical period under RCP8.5.
For RCP4.5 (Figure 6A), the exposure is expected to increase more than 500% along the eastern and southern regions of IP (particularly in the coastal regions), Madrid and Lisbon regions. The remaining regions will experience increases around 250%. For RCP8.5 (Figure 6B), the spatial pattern of changes is like that of RCP4.5, although projected changes in exposure are higher. Except in the northwestern regions, the change in exposure is projected to increase more than 500%. In the eastern and southern regions and Lisbon area, the projections indicate increases in change of exposure between 500 and 1,000%. However, the change of exposure in Madrid region and Baleares surpasses 1,000%.
The relative contributions of climate change, population change, and their interaction into the exposure change to severe drought using SPEI-12 are illustrated in Figure 7. The analysis considers both the overall impact on IP as well as individual countries: Portugal and Spain, under RCP4.5 and RCP8.5 (Figures 7A,B). Details for each of the 72 NUTS III regions under RCP4.5 and RCP8.5 are also available (Figures 7C,D).
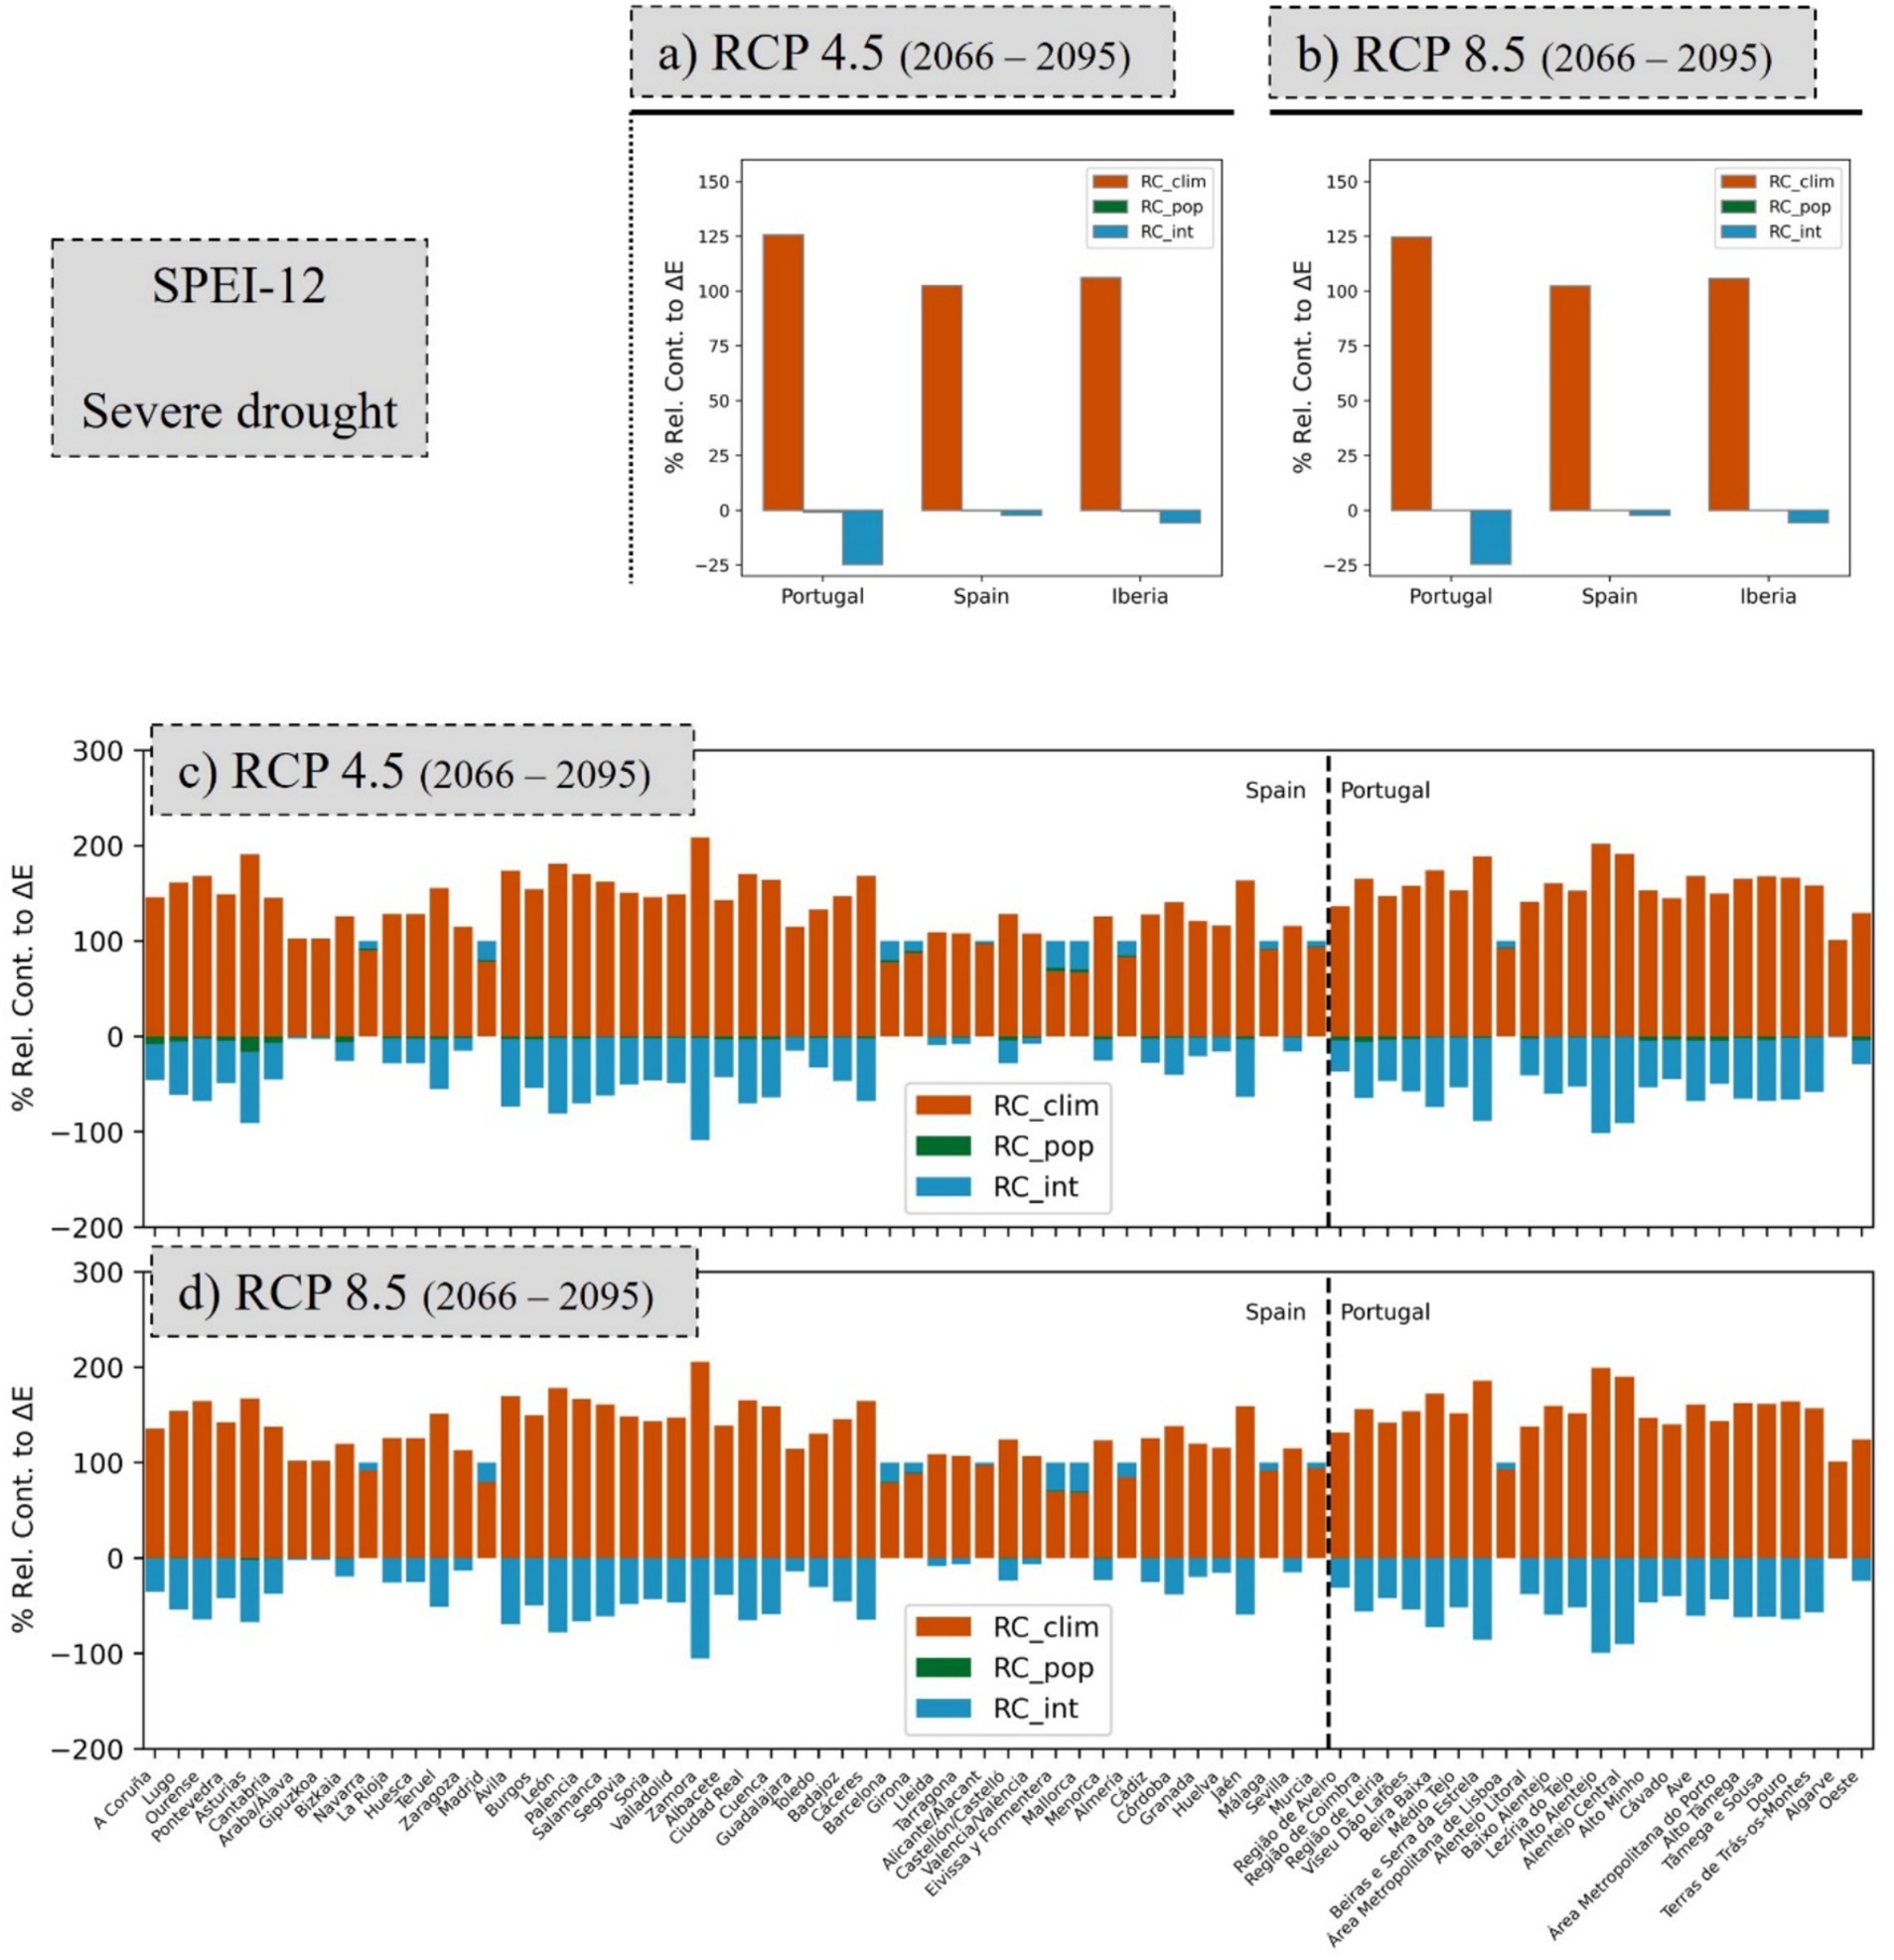
Figure 7. Relative contribution of climate change (RC_clim), population change (RC_pop), and their interaction (RC_int) to population exposure change ( ΔΔE) to severe droughts based on SPEI-12: for Portugal, Spain, and the Iberian Peninsula as a whole (A) under RCP4.5 and (B) under RCP8.5, and for each NUTS III region (C) under RCP4.5 and (D) under RCP8.5.
The results reveal that, over a 12-month timescale, climate change has a significantly greater impact on exposure change compared to population change. This observation holds true when analysing SPEI-3 as well (Supplementary Figure S4), although in that case, population change demonstrates a slightly stronger influence, especially in Portugal. One crucial finding is that climate change makes a substantial positive contribution to exposure change, while population change exhibits a slightly negative contribution. This pattern is particularly pronounced in Portugal, where almost all regions are expected to experience a decrease in population (except for Lisbon and Algarve). Regarding the interactive term, which represents the combined effect of climate and population changes, its relative contribution is predominantly negative across all regions of IP, except for those regions where both climate change and population change lead to positive contributions to exposure change. Notably, there is a distinction between Portugal and Spain: Spain shows a very small contribution from the interactive term due to a more balanced population change. Regions like Madrid, eastern coastal regions, and a few regions in the south and north coasts of Spain are expected to see an increase in population. Similar results are observed when analysing SPEI-3 data (Supplementary Figure S4). These findings provide valuable insights into the factors influencing exposure to severe drought in IP.
Under both scenarios (RCP4.5 and RCP8.5), climate change has a greater impact on the increase of population exposure change to warm months (Figures 8A,B). The contribution of climate change is positive whilst the population change contributes negatively to most regions. This pattern is more pronounced in Portugal than in Spain due to a more balanced change in population in the latter. This can be seen in the results for the NUTS III for each country and scenario (Figures 8C,D). For Portugal, climate change contributes positively, and the population counts negatively in all regions, except for Lisbon and Algarve, where a slightly increase in population is expected. Also, the interaction between climate and population has a negative contribution. Looking to Spain, in regions like Madrid, Barcelona, Baleares and some in southeastern IP, the climate change and the population and its interaction contributes all positively to the increase of population exposure change to warm months.

Figure 8. Relative contribution of climate change (RC_clim), population change (RC_pop), and their interaction (RC_int) to population exposure change (ΔE) to hot months: for Portugal, Spain, and the Iberian Peninsula as a whole (A) under RCP4.5 and (B) under RCP8.5, and for each NUTS III region (C) under RCP4.5 and (D) under RCP8.5.
Climate change poses an important problem to society that is already felt nowadays (Bento et al., 2022; IPCC, 2023a; Páscoa et al., 2017, 2021), and the globally projected warming conditions are expected to significantly impact the natural environment and human health (IPCC, 2023b). The warming trends are expected to be stronger, with more frequent, intense, and geographically extensive droughts and heatwaves. Critical for these projections are the projected increase of global population along the 21st century (Vollset et al., 2020; World Population Prospects 2022: Summary of Results, 2022). Although this trend may not be observed over the IP (EUROPOP2019), the warming and drying trends are expected (Cardoso et al., 2023; Soares et al., 2023).
Numerous studies conducted across the IP have consistently underscored noteworthy changes in climatic conditions (Bento et al., 2021; Cardoso et al., 2016, 2019, 2023; Nogueira et al., 2019; Soares et al., 2017a,b). These studies collectively anticipate a trajectory marked by higher temperatures and increased aridity as we progress towards the conclusion of the 21st century (Cramer et al., 2018; Giorgi, 2006; Tuel and Eltahir, 2020). In line with the outlook of regional warming and decreased precipitation, changes in the frequency, duration, and spatial dispersion of extreme climatic events, most notably droughts and heatwaves, are expected (Cardoso et al., 2023; Lima et al., 2023a,b; Soares et al., 2023). Moreover, these projections indicate a substantial reduction in soil moisture content, which, in turn, has the potential to catalyse the exacerbation of heatwaves and drought occurrences (Soares and Lima, 2022). The projections point to more severe, prolonged, and geographically widespread drought events across the IP throughout the 21st century that is particularly striking when considering emission scenarios like RCP4.5 or RCP8.5 (Soares et al., 2023), which agrees with results presented here. Indeed, the number of months that are expected to be in moderate, severe, and extreme drought show alarming increases from the historical period, reaching anomalies of about 100 months (in 30 years, this accounts for almost one third of the entire period) in moderate and severe drought under RCP8.5, which represents a 10-fold increase relative to the historical period.
Like droughts, there has been a discernible recent increase in the frequency of heatwaves and the number of warm days and nights in select regions of Europe accompanied by a noticeable decline in the occurrence of cold days (Giorgi and Lionello, 2008; IPCC, 2023a; Trenberth, 2011). Furthermore, extreme high temperatures are projected to escalate at a swifter pace than the overall mean temperature (Weisheimer and Palmer, 2005; Schoetter et al., 2015; IPCC, 2023a). For example, heatwaves, characterized by consecutive days of extreme temperatures, are poised to become increasingly prevalent, severe, and prolonged, with their geographical footprint expanding, as concentrations of greenhouse gases continue to rise in accordance with future climate scenarios (Cardoso et al., 2023; Dosio et al., 2018; Fischer et al., 2012; Fischer and Schär, 2009; Molina et al., 2020; Russo et al., 2014; King and Karoly, 2017). Results in the current study point to a critical number of warm months in the future, with some regions in the central and southern IP reaching more than 250 months in these conditions (of a total of 360 months, i.e., about 70% of the climatological period). This agrees with Lima et al. (2023b), which points to an increase of warm spells (using the Warm Spell Duration Index, WSDI) to near 180 days per year in the end of the century in eastern Portugal (western IP except coastal regions), i.e., around half of every year in warm spell, which leads to several months to be considered as warm.
This increase in drought and warm months under both RCP4.5 and RCP8.5 scenarios has profound implications across multiple sectors. Prolonged droughts and extreme heat pose significant risks to water resources, potentially reducing availability for agriculture and drinking water, exacerbating soil degradation, and threatening crop yields with other hazards, such as plagues (Yue and Lee, 2020) or the steep increase of meteorological fire danger (Bento et al., 2023; Santos et al., 2023), and consequent potential increase of ignitions that result in large wildfires (DaCamara et al., 2024). Such hazards can then menace agricultural yields, such as winter wheat or barley (Bento et al., 2021; Ceglar et al., 2021; Ribeiro et al., 2020a, 2020b), resulting in severe food shortage (Bevacqua et al., 2021). Moreover, the increased incidence of HDEs carries detrimental implications for human well-being, encompassing health issues like heat stroke and dehydration, which can lead to high mortality rates, particularly among the elderly population (Mukherjee et al., 2021; Thiery et al., 2021). Assessing population exposure to these events presents itself as a key study to shape adaptation strategies to face the consequences of climate change.
The decreasing population trend in IP (EUROPOP2019) may indicate that less people in general will be affected by hot and dry extreme events in the future. However, the question whether population exposure to these events will decrease due to overall population decline, or will increase due to more frequent, intense, and geographically extensive droughts and heatwaves, deserves our attention.
Indeed, EUROSTAT projections for 2080 point to a decrease in population in most of IP (Península Ibérica em Números 2021 – The Iberian Peninsula 2021, 2021), with some regions expected to lose near half of today’s population (e.g., Alentejo in southwestern IP). For example, Portugal’s National Statistical Office (Instituto Nacional de Estatística – INE)3 attributes this projected reduction to a decrease in the number of births, driven by a decline in the population of women of childbearing age due to previously low fertility levels. The aging index in Portugal is anticipated to almost double, rising from 159 to 300 elderly individuals per 100 young people by 2080. This shift is a result of both a decrease in the young population and an increase in the elderly population. Conversely, densely populated regions that encompass large cities (e.g., Lisbon, Madrid, Barcelona) or coastal regions that focus on tourism (e.g., Algarve, Málaga, Almería) are expected to become even more populated, with increases that can reach more than 30% in Madrid and Barcelona.
Population exposure to long-term droughts and warm months shows a substantial increase in most regions of IP. However, the intensity of exposure is rather different depending on the scenario that is selected. For example, exposure change to moderate droughts considering RCP4.5 is relatively small, nevertheless with increases of the order of 100 to 400%. However, it is important to note that under RCP4.5 the population becomes more exposed with the increase in severity of the drought. Indeed, exposure change to extreme droughts takes values greater than 4,000% in most IP (except regions located in the northern and eastern coast, and few regions on the western and southern coast). As expected, under RCP8.5 population exposure to drought is even larger. These results agree with those from (Zhang et al., 2022), which states that exposure to HDEs is expected to increase with the largest magnitudes in the Sahara but followed by the Mediterranean region (that encompasses the IP). The authors also present values of exposure change in the order of the 1,000% for the globe, with the caveat of using GCMs with lower resolution than the RCMs used here. Additionally, the present study relies on a weighted multi-variable multi-model ensemble based on 13 RCMs, examines two CMIP5 RCPs and includes shorter and longer timescales (3-months and 12-months) for droughts.
The relative contribution of climate and population change, and their interaction is further analysed. Results show that climate change is the predominant factor in population exposure to future droughts and warm months accounting for about 75% for droughts and about 70% for warm months in Portugal, and about 95% for both HDEs in Spain. The decline of population in Portugal and the migration to Lisbon and Algarve (both located in the coast) point to a slight negative contribution of population change and consequently the interaction factor. This is more pronounced when considering warm months (and short-term droughts) than long-term droughts. On the other hand, Spain presents more regions with an increase of population and thus the negative contribution of population change is more diluted. These results agree with the results presented by Zhang et al. (2022) for a larger Mediterranean region. Other studies pursued similar approaches in different regions of the world. For example, Jones et al. (2015) took advantage of an ensemble of CMIP3 RCMs to study projected population exposure to heat extremes in the U.S.A., with results pointing to climate change as the greater contributor, but with population having a strong positive signal. Still for the U.S.A., Batibeniz et al. (2020) projects twofold population exposure to climate extremes by 2050. However, it is important to note that population is expected to grow in this region [United States Census Bureau: 2023 National Population Projections Tables: Main Series; 2023 National Population Projections Tables: Main Series (census.gov)]. Chen and Sun (2021) took a similar approach to study global population exposure to precipitation extremes in the future, using GCMs from CMIP6, and concluded that for higher emission scenarios climate change is the main mechanism for exposure in the Mediterranean region.
While this study focuses on population exposure to hot and dry events (HDEs), these climatic extremes are likely to have significant impacts on agricultural systems and livestock in the Iberian Peninsula. Prolonged droughts and extreme heat can reduce crop yields, disrupt planting and harvesting schedules, and exacerbate soil degradation. Similarly, heat stress in livestock may lead to reduced productivity, increased mortality, and higher vulnerability to diseases. These cascading effects underscore the need for integrated adaptation strategies that address both human and ecosystem vulnerabilities to HDEs in the region.
This work presents a high-resolution multi-model multi-variable ensemble developed to better represent climate change scenarios in the IP (Lima et al., 2023a), allowing for a regional characterization of population exposure to droughts and warm months, which represents an upgrade relative to the global model’s perspective from other studies (e.g., Chen and Sun, 2021; Zhang et al., 2022). However, this work presents its limitations. For example, the use of CMIP5 RCMs, which do not consider socioeconomic pathways, is a limitation that needs to be addressed as soon as CMIP6 RCMs are available. The upcoming EURO-CORDEX simulations with the new CMIP6 scenarios will provide a further understanding of the climate and its development. Several works have already started analysing global drought with CMIP6 ESGCMs (Earth System and Global Climate Models) (Essa et al., 2023; Xu et al., 2023), but for regional assessment the coarse resolution of CMIP6 ESGCMs is a limitation. Using deep learning methods for downscaling CMIP6 ESGCMs to RCM resolution represents an innovative approach that holds the potential to provide an initial approximation of the results. For instance, Soares et al. (2023) demonstrates promising outcomes in downscaled projections for near-surface temperature and precipitation over IP through the application of deep learning. These findings present a potential new tool for supplying regional climate information derived from CMIP6, anticipating the subsequent phase of EURO-CORDEX. This novel approach could be further investigated in a future study, particularly in its application to regional drought characterization. Furthermore, advancing research to focus on population exposure to compound HDEs, rather than single events, represents a promising direction for future studies. The methodology employed in this study is not only robust for assessing exposure in the Iberian Peninsula but also transferable to other regions. By incorporating region-specific population and climate data, the framework can provide valuable insights into population exposure and help inform targeted adaptation strategies elsewhere. This flexibility makes it a useful tool for climate risk assessment at broader geographic scales.
Population exposure to droughts and prolonged warm periods is projected to increase significantly by the end of the 21st century across the Iberian Peninsula, based on CMIP5 scenarios RCP4.5 and RCP8.5. Our findings reveal that climate change is the primary driver of this trend, while population changes play a smaller role. Without immediate action to achieve net-zero emissions, current trajectories suggest a future aligned with conditions between these emission pathways. To mitigate these risks, adaptation strategies must be urgently prioritized, especially in countries like Portugal and Spain, whose emissions have a negligible impact on the global climate but will face severe consequences of climate change. Key adaptive measures include enhancing water resource management for agriculture and drinking water, promoting climate-resilient crop types, strengthening healthcare systems to address heat-related illnesses, and implementing robust fire management strategies to mitigate the threat of megafires. Further research on the vulnerability of these critical sectors, coupled with the development and modelling of targeted adaptation strategies, is essential. Such efforts will provide valuable guidance for policymakers, authorities, and society to better prepare for and respond to the increasing frequency and severity of hot and dry events in the region.
Publicly available datasets were analyzed in this study. This data can be found at: https://ec.europa.eu/eurostat/cache/metadata/en/proj_19n_esms.htm.
VB: Conceptualization, Data curation, Formal analysis, Investigation, Methodology, Visualization, Writing – original draft, Writing – review & editing. DL: Data curation, Investigation, Methodology, Validation, Writing – review & editing. AR: Conceptualization, Investigation, Methodology, Supervision, Validation, Writing – review & editing.
The author(s) declare that financial support was received for the research, authorship, and/or publication of this article. This work was funded by the Portuguese Fundação para a Ciência e a Tecnologia (FCT) I.P./MCTES through national funds (PIDDAC) - UIDB/50019/2020 (https://doi.org/10.54499/UIDB/50019/2020), UIDP/50019/2020 (https://doi.org/10.54499/UIDP/50019/2020) and LA/P/0068/2020 (https://doi.org/10.54499/LA/P/0068/2020). This work was performed under the scope of project DHEFEUS (https://doi.org/10.54499/2022.09185.PTDC) and supported by national funds through FCT.
VB acknowledges FCT I.P./MCTES for the FCT 2023.08200.CEECIND titled “On fire risk projections throughout the XXI century and its relationship with new climate extremes with a spotlight on the design of storylines for adaptation strategies”, DL acknowledges FCT I.P./MCTES for the FCT (https://doi.org/10.54499/2022.03183.CEECIND/CP1715/CT0004), and AR acknowledges FCT I.P./MCTES for the FCT (https://doi.org/10.54499/2022.01167.CEECIND/CP1722/CT0006).
The authors declare that the research was conducted in the absence of any commercial or financial relationships that could be construed as a potential conflict of interest.
The authors declare that no Gen AI was used in the creation of this manuscript.
All claims expressed in this article are solely those of the authors and do not necessarily represent those of their affiliated organizations, or those of the publisher, the editors and the reviewers. Any product that may be evaluated in this article, or claim that may be made by its manufacturer, is not guaranteed or endorsed by the publisher.
The Supplementary material for this article can be found online at: https://www.frontiersin.org/articles/10.3389/fclim.2025.1519880/full#supplementary-material
1. ^https://ec.europa.eu/eurostat/cache/metadata/en/proj_19n_esms.htm
2. ^https://ec.europa.eu/eurostat/statistics-explained/
3. ^www.ine.pt
Agnew, C. T. (2000). Using the SPI to identify drought. Drought Network News 12, 6–12. Available at: http://digitalcommons.unl.edu/droughtnetnews/1 (accessed January 23, 2019).
Alho, A. M., Oliveira, A. P., Viegas, S., and Nogueira, P. (2024). Effect of heatwaves on daily hospital admissions in Portugal, 2000–18: an observational study. Lancet Planet Health 8, e318–e326.
Andrade, C., Contente, J., and Santos, J. A. (2021). Climate change projections of aridity conditions in the Iberian Peninsula. Water (Switzerland) 13:2035. doi: 10.3390/w13152035
Bastos, A., Gouveia, C. M., Trigo, R. M., and Running, S. W. (2014). Analysing the spatio-temporal impacts of the 2003 and 2010 extreme heatwaves on plant productivity in Europe. Biogeosciences 11, 3421–3435. doi: 10.5194/BG-11-3421-2014
Batibeniz, F., Ashfaq, M., Diffenbaugh, N. S., Key, K., Evans, K. J., Turuncoglu, U. U., et al. (2020). Doubling of U.S. population exposure to climate extremes by 2050. Earths Future 8:e2019EF001421. doi: 10.1029/2019EF001421
Beguería, S., Vicente-Serrano, S. M., Reig, F., and Latorre, B. (2014). Standardized precipitation evapotranspiration index (SPEI) revisited: parameter fitting, evapotranspiration models, tools, datasets and drought monitoring. Int. J. Climatol. 34, 3001–3023. doi: 10.1002/joc.3887
Bento, V. A., Lima, D. C. A., Santos, L. C., Lima, M. M., Russo, A., Nunes, S. A., et al. (2023). The future of extreme meteorological fire danger under climate change scenarios for Iberia. Weather Clim. Extrem. 42:100623. doi: 10.1016/J.WACE.2023.100623
Bento, V. A., Ribeiro, A. F. S., Russo, A., Gouveia, C. M., Cardoso, R. M., and Soares, P. M. M. (2021). The impact of climate change in wheat and barley yields in the Iberian Peninsula. Sci. Rep. 11, 15484–15412. doi: 10.1038/s41598-021-95014-6
Bento, V. A., Russo, A., Gouveia, C. M., and Dacamara, C. C. (2022). Recent change of burned area associated with summer heat extremes over Iberia. Int. J. Wildland Fire 31, 658–669. doi: 10.1071/WF21155
Bevacqua, E., de, C., Manning, C., Couasnon, A., Ribeiro, A. F. S., Ramos, A. M., et al. (2021). Guidelines for studying diverse types of compound weather and climate events. Earths Future 9:e2021EF002340. doi: 10.1029/2021EF002340
Bevacqua, E., Suarez-Gutierrez, L., Jézéquel, A., Lehner, F., Vrac, M., Yiou, P., et al. (2023). Advancing research on compound weather and climate events via large ensemble model simulations. Nat. Commun. 14, 1–16. doi: 10.1038/s41467-023-37847-5
Bosch, X. (2000). Spain faces massive decline in population. Br. Med. J. 320:891. doi: 10.1136/bmj.320.7239.891
Brunner, L., Lorenz, R., Zumwald, M., and Knutti, R. (2019). Quantifying uncertainty in European climate projections using combined performance-independence weighting. Environ. Res. Lett. 14:124010. doi: 10.1088/1748-9326/ab492f
Brunner, M. I., Gilleland, E., and Wood, A. W. (2021). Space-time dependence of compound hot-dry events in the United States: assessment using a multi-site multi-variable weather generator. Earth Syst. Dynam. 12, 621–634. doi: 10.5194/ESD-12-621-2021
Cardoso, R. M., Lima, D. C. A., and Soares, P. M. M. (2023). How persistent and hazardous will extreme temperature events become in a warming Portugal? Weather Clim. Extrem 41:100600. doi: 10.1016/J.WACE.2023.100600
Cardoso, R. M., and Soares, P. M. M. (2022). Is there added value in the EURO-CORDEX hindcast temperature simulations? Assessing the added value using climate distributions in Europe. Int. J. Climatol. 42, 4024–4039. doi: 10.1002/joc.7472
Cardoso, R. M., Soares, P. M. M., Lima, D. C. A., and Miranda, P. M. A. (2019). Mean and extreme temperatures in a warming climate: EURO CORDEX and WRF regional climate high-resolution projections for Portugal. Clim. Dyn. 52, 129–157. doi: 10.1007/s00382-018-4124-4
Cardoso, R. M., Soares, P. M. M., Lima, D. C. A., and Semedo, A. (2016). The impact of climate change on the Iberian low-level wind jet: EURO-CORDEX regional climate simulation. Tellus Ser. A Dyn. Meteorol. Oceanogr. 68:29005. doi: 10.3402/tellusa.v68.29005
Careto, J. A. M., Soares, P. M. M., Cardoso, R. M., Herrera, S., and Gutiérrez, J. M. (2022a). Added value of EURO-CORDEX high-resolution downscaling over the Iberian Peninsula revisited – part 1: precipitation. Geosci. Model Dev. 15, 2635–2652. doi: 10.5194/gmd-15-2635-2022
Careto, J. A. M., Soares, P. M. M., Cardoso, R. M., Herrera, S., and Gutiérrez, J. M. (2022b). Added value of EURO-CORDEX high-resolution downscaling over the Iberian Peninsula revisited – part 2: max and min temperature. Geosci. Model Dev. 15, 2653–2671. doi: 10.5194/gmd-15-2653-2022
Ceglar, A., Toreti, A., Zampieri, M., and Royo, C. (2021). Global loss of climatically suitable areas for durum wheat growth in the future. Environ. Res. Lett. 16:104049. doi: 10.1088/1748-9326/AC2D68
Chen, H., and Sun, J. (2021). Significant increase of the global population exposure to increased precipitation extremes in the future. Earths Future 9:e2020EF001941. doi: 10.1029/2020EF001941
Christensen, J. H., Kjellström, E., Giorgi, F., Lenderink, G., and Rummukainen, M. (2010). Weight assignment in regional climate models. Clim. Res. 44, 179–194. doi: 10.3354/cr00916
Christensen, O. B., Drews, M., Christensen, J. H., Dethloff, K., Ketelsen, K., Hebestadt, I., et al. (2007). The HIRHAM regional climate model version 5 (beta). Technical Report 06-17, 1–22. Available at: www.dmi.dk/dmi/tr (accessed October 26, 2023).
Colin, J., DéQué, M., Radu, R., and Somot, S. (2010). Sensitivity study of heavy precipitation in limited area model climate simulations: influence of the size of the domain and the use of the spectral nudging technique. Tellus Ser. A Dyn. Meteorol. Oceanogr. 62, 591–604. doi: 10.1111/j.1600-0870.2010.00467.x
Cos, J., Doblas-Reyes, F., Jury, M., Marcos, R., Bretonnière, P. A., and Samsó, M. (2022). The Mediterranean climate change hotspot in the CMIP5 and CMIP6 projections. Earth Syst. Dyn. 13, 321–40.
Cramer, W., Guiot, J., Fader, M., Garrabou, J., Gattuso, J. P., Iglesias, A., et al. (2018). Climate change and interconnected risks to sustainable development in the Mediterranean. Nat. Clim. Chang. 8, 972–980. doi: 10.1038/s41558-018-0299-2
DaCamara, C. C., Bento, V. A., Nunes, S. A., Lemos, G., Soares, P. M., and Trigo, R. M. (2024). Impacts of fire prevention strategies in a changing climate: an assessment for Portugal. Environ. Res.: Clim. 3:045002. doi: 10.1088/2752-5295/ad574f
Davis, L. W., and Gertler, P. J. (2015). Contribution of air conditioning adoption to future energy use under global warming. Proc. Natl. Acad. Sci. U.S.A. 112, 5962–5967. doi: 10.1073/pnas.1423558112
Diffenbaugh, N. S., and Giorgi, F. (2012). Climate change hotspots in the CMIP5 global climate model ensemble. Clim. Chang. 114, 813–822. doi: 10.1007/s10584-012-0570-x
Diffenbaugh, N. S., Pal, J. S., Giorgi, F., and Gao, X. (2007). Heat stress intensification in the Mediterranean climate change hotspot. Geophys. Res. Lett. 34:11706. doi: 10.1029/2007GL030000
Dosio, A., Mentaschi, L., Fischer, E. M., and Wyser, K. (2018). Extreme heat waves under 1.5 °C and 2 °C global warming. Environ. Res. Lett. 13:054006. doi: 10.1088/1748-9326/AAB827
Douris, J., Kim, G., Abrahams, J., Lapitan Moreno, J., Shumake-Guillemot, J., Green, H., et al. (2021). WMO atlas of mortality and economic losses from weather, climate and water extremes (1970–2019) (WMO-no. 1267). Geneva. Available at: https://library.wmo.int/index.php?lvl=notice_display&id=21930 (accessed November 7, 2023).
Essa, Y. H., Hirschi, M., Thiery, W., El-Kenawy, A. M., and Yang, C. (2023). Drought characteristics in Mediterranean under future climate change. NPJ Clim. Atmos. Sci. 6, 1–13. doi: 10.1038/s41612-023-00458-4
Eyring, V., Cox, P. M., Flato, G. M., Gleckler, P. J., Abramowitz, G., Caldwell, P., et al. (2019). Taking climate model evaluation to the next level. Nat. Clim. Chang. 9, 102–110. doi: 10.1038/s41558-018-0355-y
Fischer, E. M., Rajczak, J., and Schär, C. (2012). Changes in European summer temperature variability revisited. Geophys. Res. Lett. 39:19702. doi: 10.1029/2012GL052730
Fischer, E. M., and Schär, C. (2009). Future changes in daily summer temperature variability: driving processes and role for temperature extremes. Clim. Dyn. 33, 917–935. doi: 10.1007/s00382-008-0473-8
Fischer, E. M., Seneviratne, S. I., Lüthi, D., and Schär, C. (2007). Contribution of land-atmosphere coupling to recent European summer heat waves. Geophys. Res. Lett. 34, 1–8. doi: 10.1029/2006GL029068
García-Herrera, R., Díaz, J., Trigo, R. M., and Hernández, E. (2005). Extreme summer temperatures in Iberia: health impacts and associated synoptic conditions. Ann. Geophys. 23, 239–251. doi: 10.5194/ANGEO-23-239-2005
García-León, D., Casanueva, A., Standardi, G., Burgstall, A., Flouris, A. D., and Nybo, L. (2021). Current and projected regional economic impacts of heatwaves in Europe. Nat. Commun. 12:5807. doi: 10.1038/s41467-021-26050-z
Giorgi, F., Jones, C., and Asrar, G. R. (2009). Addressing climate information needs at the regional level: the CORDEX framework. WMO Bull. 58, 175–183. Available at: http://wcrp.ipsl (accessed November 7, 2023).
Giorgi, F., and Lionello, P. (2008). Climate change projections for the Mediterranean region. Glob Planet Change 63, 90–104. doi: 10.1016/J.GLOPLACHA.2007.09.005
Gómez Valenzuela, V., and Holl, A. (2023). Growth and decline in rural Spain: an exploratory analysis. Eur. Plan. Stud. 32, 430–453. doi: 10.1080/09654313.2023.2179390
González-Leonardo, M., Newsham, N., and Rowe, F. (2023). Understanding population decline trajectories in Spain using sequence analysis. Geogr. Anal. 55, 495–516. doi: 10.1111/GEAN.12357
Gouveia, C. M., Bastos, A., Trigo, R. M., and DaCamara, C. C. (2012). Drought impacts on vegetation in the pre- and post-fire events over Iberian Peninsula. Nat. Hazards Earth Syst. Sci. 12, 3123–3137. doi: 10.5194/nhess-12-3123-2012
Gouveia, C. M., Páscoa, P., and DaCamara, C. (2018). Post-fire vegetation recovery in iberia based on remote-sensing information. Forest Fire Janusz Szmyt, IntechOpen. doi: 10.5772/intechopen.72594
Hargreaves, G. H., and Samani, Z. A. (1985). Reference crop evapotranspiration from temperature. Appl. Eng. Agric. 1, 96–99. doi: 10.13031/2013.26773
Herrera, S., Margarida Cardoso, R., Matos Soares, P., Espírito-Santo, F., Viterbo, P., and Gutiérrez, J. M. (2019). Iberia01: a new gridded dataset of daily precipitation and temperatures over Iberia. Earth Syst. Sci. Data 11, 1947–1956. doi: 10.5194/essd-11-1947-2019
IPCC (2023b). Climate Change 2022: Impacts, Adaptation and Vulnerability. Available at: https://www.ipcc.ch/report/ar6/wg2/ (accessed August 3, 2023).
IPCC (2012). eds. C. B. Field, V. Barros, T. F. Stocker, D. Qin, D. J. Dokken, and K. L. Ebi, et al. Cambridge: Cambridge University Press. pp. 582.
Jacob, D., Elizalde, A., Haensler, A., Hagemann, S., Kumar, P., Podzun, R., et al. (2012). Assessing the transferability of the regional climate model REMO to different coordinated regional climate downscaling experiment (CORDEX) regions. Atmosphere (Basel) 3, 181–199. doi: 10.3390/atmos3010181
Jacob, D., Petersen, J., Eggert, B., Alias, A., Christensen, O. B., Bouwer, L. M., et al. (2014). EURO-CORDEX: new high-resolution climate change projections for European impact research. Reg. Environ. Chang. 14, 563–578. doi: 10.1007/s10113-013-0499-2
Jacob, D., Van Den Hurk, B. J. J. M., Andræ, U., Elgered, G., Fortelius, C., Graham, L. P., et al. (2001). A comprehensive model inter-comparison study investigating the water budget during the BALTEX-PIDCAP period. Meteorog. Atmos. Phys. 77, 19–43. doi: 10.1007/s007030170015
Jones, B., O’Neill, B. C., Mcdaniel, L., Mcginnis, S., Mearns, L. O., and Tebaldi, C. (2015). Future population exposure to US heat extremes. Nat. Clim. Chang. 5, 652–655. doi: 10.1038/nclimate2631
Kabisch, N., and Haase, D. (2011). Diversifying European agglomerations: evidence of urban population trends for the 21st century. Popul. Space Place 17, 236–253. doi: 10.1002/PSP.600
Katragkou, E., García-Díez, M., Vautard, R., Sobolowski, S., Zanis, P., Alexandri, G., et al. (2015). Regional climate hindcast simulations within EURO-CORDEX: evaluation of a WRF multi-physics ensemble. Geosci. Model Dev. 8, 603–618. doi: 10.5194/gmd-8-603-2015
King, A. D., and Karoly, D. J. (2017). Climate extremes in Europe at 1.5 and 2 degrees of global warming. Environ. Res. Lett. 12:114031. doi: 10.1088/1748-9326/AA8E2C
Kjellström, E., Nikulin, G., Strandberg, G., Bøssing Christensen, O., Jacob, D., Keuler, K., et al. (2018). European climate change at global mean temperature increases of 1.5 and 2 °C above pre-industrial conditions as simulated by the EURO-CORDEX regional climate models. Earth Syst. Dynam. 9, 459–478. doi: 10.5194/ESD-9-459-2018
Knutti, R., Sedláček, J., Sanderson, B. M., Lorenz, R., Fischer, E. M., and Eyring, V. (2017). A climate model projection weighting scheme accounting for performance and interdependence. Geophys. Res. Lett. 44, 1909–1918. doi: 10.1002/2016GL072012
Kotlarski, S., Keuler, K., Christensen, O. B., Colette, A., Déqué, M., Gobiet, A., et al. (2014). Regional climate modeling on European scales: a joint standard evaluation of the EURO-CORDEX RCM ensemble. Geosci. Model Dev. 7, 1297–1333. doi: 10.5194/gmd-7-1297-2014
Lanzieri, G. (2020). Methodology of the Eusostat population projections 2019-based (EUROPOP2019). Luxembourg.
Lima, D. C. A., Bento, V. A., Lemos, G., Nogueira, M., and Soares, P. M. M. (2023a). A multi-variable constrained ensemble of regional climate projections under multi-scenarios for Portugal – part II: sectoral climate indices. Clim. Serv 30:100377. doi: 10.1016/j.cliser.2023.100377
Lima, D. C. A., Lemos, G., Bento, V. A., Nogueira, M., and Soares, P. M. M. (2023b). A multi-variable constrained ensemble of regional climate projections under multi-scenarios for Portugal – part I: an overview of impacts on means and extremes. Clim. Serv. 30:100351. doi: 10.1016/j.cliser.2023.100351
Liu, Y., and Chen, J. (2021). Future global socioeconomic risk to droughts based on estimates of hazard, exposure, and vulnerability in a changing climate. Sci. Total Environ. 751:142159. doi: 10.1016/J.SCITOTENV.2020.142159
Liu, Y., Chen, J., Pan, T., Liu, Y., Zhang, Y., Ge, Q., et al. (2020). Global socioeconomic risk of precipitation extremes under climate change. Earths Future 8:e2019EF001331. doi: 10.1029/2019EF001331
Lorenz, R., Herger, N., Sedláček, J., Eyring, V., Fischer, E. M., and Knutti, R. (2018). Prospects and caveats of weighting climate models for summer maximum temperature projections over North America. J. Geophys. Res. Atmos. 123, 4509–4526. doi: 10.1029/2017JD027992
Masson-Delmotte, V., Zhai, P., Pirani, A., Connors, S. L., Péan, C., Berger, S., et al. (2021). “Climate change 2021: the physical science basis,” in Contribution of working group I to the sixth assessment report of the intergovernmental panel on climate change. 2:2391. Available at: www.ipcc.ch/report/ar6/wg1/downloads/report/IPCC_AR6_WGI_FullReport.pdf
Matthews, H. D., and Wynes, S. (2022). Current global efforts are insufficient to limit warming to 1.5 C. Science 376, 1404–1409.
Molina, M. O., Sánchez, E., and Gutiérrez, C. (2020). Future heat waves over the Mediterranean from an Euro-CORDEX regional climate model ensemble. Sci. Rep. 10, 1–10. doi: 10.1038/s41598-020-65663-0
Monteiro Dos Santos, D., Libonati, R., Garcia, B. N., Geirinhas, J. L., Salvi, B. B., Lima e Silva, E., et al. (2024). Twenty-first-century demographic and social inequalities of heat-related deaths in Brazilian urban areas. PLoS one 19:e0295766. doi: 10.1371/journal.pone.0295766
Mueller, B., and Seneviratne, S. I. (2012). Hot days induced by precipitation deficits at the global scale. Proc. Natl. Acad. Sci. USA 109, 12398–12403. doi: 10.1073/pnas.1204330109
Mukherjee, S., Mishra, A. K., Mann, M. E., and Raymond, C. (2021). Anthropogenic warming and population growth may double US heat stress by the late 21st century. Earths Future 9:e2020EF001886. doi: 10.1029/2020EF001886
Newsham, N., and Rowe, F. (2023). Understanding trajectories of population decline across rural and urban Europe: a sequence analysis. Popul. Space Place 29:e2630. doi: 10.1002/PSP.2630
Nogueira, M., Soares, P. M. M., Tomé, R., and Cardoso, R. M. (2019). High-resolution multi-model projections of onshore wind resources over Portugal under a changing climate. Theor. Appl. Climatol. 136, 347–362. doi: 10.1007/s00704-018-2495-4
Páscoa, P., Gouveia, C. M., Russo, A., and Trigo, R. M. (2017). Drought trends in the Iberian Peninsula over the last 112 years. Adv. Meteorol. 2017, 1–13. doi: 10.1155/2017/4653126
Páscoa, P., Russo, A., Gouveia, C. M., Soares, P. M. M., Cardoso, R. M., Careto, J. A. M., et al. (2021). A high-resolution view of the recent drought trends over the Iberian Peninsula. Weather Clim Extrem 32:100320. doi: 10.1016/j.wace.2021.100320
Península Ibérica em Números 2021 – The Iberian Peninsula 2021 (2021). Available at: https://www.ine.pt/ine_novidades/PIN2021/index.html (accessed November 15, 2023).
Prein, A. F., Gobiet, A., Truhetz, H., Keuler, K., Goergen, K., Teichmann, C., et al. (2016). Precipitation in the EURO-CORDEX 0.11∘ and 0.44∘ simulations: high resolution, high benefits? Clim. Dyn. 46, 383–412. doi: 10.1007/s00382-015-2589-y
Ribeiro, A. F. S., Russo, A., Gouveia, C. M., Páscoa, P., and Zscheischler, J. (2020a). Risk of crop failure due to compound dry and hot extremes estimated with nested copulas. Biogeosciences 17, 4815–4830. doi: 10.5194/bg-17-4815-2020
Ribeiro, A. F. S., Russo, A., Gouveia, C. M., and Pires, C. A. L. (2020b). Drought-related hot summers: a joint probability analysis in the Iberian Peninsula. Weather Clim. Extrem. 30:100279. doi: 10.1016/J.WACE.2020.100279
Rivas-Martinez, S., Sáenz, S. R., and Penas, A. (2011). Worldwide bioclimatic classification system. Glob. Geobotany 1, 1–634. doi: 10.5616/gg110001
Rockel, B., Will, A., and Hense, A. (2008). The regional climate model COSMO-CLM (CCLM). Meteorol. Z. 17, 347–348. doi: 10.1127/0941-2948/2008/0309
Russo, A., Gouveia, C. M., Dutra, E., Soares, P. M. M., and Trigo, R. M. (2019). The synergy between drought and extremely hot summers in the Mediterranean. Environ. Res. Lett. 14, 1–11. doi: 10.1088/1748-9326/aaf09e
Russo, S., Dosio, A., Graversen, R. G., Sillmann, J., Carrao, H., Dunbar, M. B., et al. (2014). Magnitude of extreme heat waves in present climate and their projection in a warming world. J. Geophys. Res. Atmos. 119, 12500–12512. doi: 10.1002/2014JD022098
Salvador, C., Nieto, R., Linares, C., Díaz, J., Alves, C. A., and Gimeno, L. (2021). Drought effects on specific-cause mortality in Lisbon from 1983 to 2016: risks assessment by gender and age groups. Sci. Total Environ. 751:142332. doi: 10.1016/J.SCITOTENV.2020.142332
Salvador, C., Nieto, R., Linares, C., Díaz, J., and Gimeno, L. (2020). Quantification of the effects of droughts on daily mortality in Spain at different timescales at regional and National Levels: a Meta-analysis. Int. J. Environ. Res. Public Health 17, 1–16. doi: 10.3390/IJERPH17176114
Salvador, C., Vicedo‐Cabrera, A. M., Libonati, R., Russo, A., Garcia, B. N., Belem, L. B. C., et al. (2022). Effects of drought on mortality in macro urban areas of Brazil between 2000 and 2019. GeoHealth 6:e2021GH000534.
Sanderson, B. M., Wehner, M., and Knutti, R. (2017). Skill and independence weighting for multi-model assessments. Geosci. Model Dev. 10, 2379–2395. doi: 10.5194/gmd-10-2379-2017
Santos, L. C., Lima, M. M., Bento, V. A., Nunes, S. A., DaCamara, C. C., Russo, A., et al. (2023). An evaluation of the atmospheric instability effect on wildfire danger using ERA5 over the Iberian Peninsula. Fire 6:120. doi: 10.3390/fire6030120
Schoetter, R., Cattiaux, J., and Douville, H. (2015). Changes of western European heat wave characteristics projected by the CMIP5 ensemble. Clim. Dyn. 45, 1601–1616. doi: 10.1007/s00382-014-2434-8
Smirnov, O., Zhang, M., Xiao, T., Orbell, J., Lobben, A., and Gordon, J. (2016). The relative importance of climate change and population growth for exposure to future extreme droughts. Clim. Chang. 138, 41–53. doi: 10.1007/s10584-016-1716-z
Soares, P. M. M., and Cardoso, R. M. (2018). A simple method to assess the added value using high-resolution climate distributions: application to the EURO-CORDEX daily precipitation. Int. J. Climatol. 38, 1484–1498. doi: 10.1002/joc.5261
Soares, P. M. M., Cardoso, R. M., Lima, D. C. A., and Miranda, P. M. A. (2017a). Future precipitation in Portugal: high-resolution projections using WRF model and EURO-CORDEX multi-model ensembles. Clim. Dyn. 49, 2503–2530. doi: 10.1007/s00382-016-3455-2
Soares, P. M. M., Careto, J. A. M., Russo, A., and Lima, D. C. A. (2023). The future of Iberian droughts: a deeper analysis based on multi-scenario and a multi-model ensemble approach. Nat. Hazards 117, 2001–2028. doi: 10.1007/s11069-023-05938-7
Soares, P. M. M., and Lima, D. C. A. (2022). Water scarcity down to earth surface in a Mediterranean climate: the extreme future of soil moisture in Portugal. J. Hydrol. (Amst) 615:128731. doi: 10.1016/j.jhydrol.2022.128731
Soares, P. M. M., Lima, D. C. A., Cardoso, R. M., and Semedo, A. (2017b). High resolution projections for the western Iberian coastal low level jet in a changing climate. Clim. Dyn. 49, 1547–1566. doi: 10.1007/s00382-016-3397-8
Strandberg, G., Bärring, L., Hansson, U., Jansson, C., Jones, C., Kjellström, E., et al. (2014). CORDEX scenarios for Europe from the Rossby Centre regional climate model RCA4. Rep. Meteorol. Climatol. 116, 1–84. Available at: https://www.smhi.se/polopoly_fs/1.90273!/Menu/general/extGroup/attachmentColHold/mainCol1/file/RMK_116.pdf (accessed October 26, 2023).
Tabari, H., and Willems, P. (2023). Global risk assessment of compound hot-dry events in the context of future climate change and socioeconomic factors. NPJ Clim. Atmos. Sci. 6, 1–10. doi: 10.1038/s41612-023-00401-7
Thiery, W., Lange, S., Rogelj, J., Schleussner, C. F., Gudmundsson, L., Seneviratne, S. I., et al. (2021). Intergenerational inequities in exposure to climate extremes. Science 1979, 158–160. doi: 10.1126/SCIENCE.ABI7339/SUPPL_FILE/SCIENCE.ABI7339_SM.PDF
Trenberth, K. E. (2011). Changes in precipitation with climate change. Clim. Res. 47, 123–138. doi: 10.3354/cr00953
Trigo, R. M., Ramos, A. M., Nogueira, P. J., Santos, F. D., Garcia-Herrera, R., Gouveia, C., et al. (2009). Evaluating the impact of extreme temperature based indices in the 2003 heatwave excessive mortality in Portugal. Environ. Sci. Pol. 12, 844–854. doi: 10.1016/J.ENVSCI.2009.07.007
Tuel, A., and Eltahir, E. A. B. (2020). Why is the Mediterranean a climate change hot spot? J. Clim. 33, 5829–5843. doi: 10.1175/JCLI-D-19-0910.1
Ullah, S., You, Q., Chen, D., Sachindra, D. A., AghaKouchak, A., Kang, S., et al. (2022). Future population exposure to daytime and nighttime heat waves in South Asia. Earths. Future 10:e2021EF002511. doi: 10.1029/2021EF002511
United Nations (2019). World population prospects 2019: highlights. United Nations. doi: 10.18356/13BF5476-EN
Van Meijgaard, E., Van Ulft, L. H., Van De Berg, W. J., Bosveld, F. C., Van Den Hurk, B. J. J. M., Lenderink, G., et al. (2008). The KNMI regional atmospheric climate model RACMO version 2.1.
Vautard, R., Gobiet, A., Jacob, D., Belda, M., Colette, A., Déqué, M., et al. (2013). The simulation of European heat waves from an ensemble of regional climate models within the EURO-CORDEX project. Clim. Dyn. 41, 2555–2575. doi: 10.1007/s00382-013-1714-z
Vicente-Serrano, S. M., Beguería, S., and López-Moreno, J. I. (2010). A multiscalar drought index sensitive to global warming: the standardized precipitation evapotranspiration index. J. Clim. 23, 1696–1718. doi: 10.1175/2009JCLI2909.1
Vollset, S. E., Goren, E., Yuan, C. W., Cao, J., Smith, A. E., Hsiao, T., et al. (2020). Fertility, mortality, migration, and population scenarios for 195 countries and territories from 2017 to 2100: a forecasting analysis for the global burden of disease study. Lancet 396, 1285–1306. doi: 10.1016/S0140-6736(20)30677-2
Wang, Y., Zhao, N., Yin, X., Wu, C., Chen, M., Jiao, Y., et al. (2023). Global future population exposure to heatwaves. Environ. Int. 178:108049. doi: 10.1016/J.ENVINT.2023.108049
Weisheimer, A., and Palmer, T. N. (2005). Changing frequency of occurrence of extreme seasonal temperatures under global warming. Geophys. Res. Lett. 32, 1–5. doi: 10.1029/2005GL023365
Wenzel, S., Eyring, V., Gerber, E. P., and Karpechko, A. Y. (2016). Constraining future summer austral jet stream positions in the CMIP5 ensemble by process-oriented multiple diagnostic regression. J. Clim. 29, 673–687. doi: 10.1175/JCLI-D-15-0412.1
World Population Prospects 2022: Summary of Results (2022). Available at: https://desapublications.un.org/publications/world-population-prospects-2022-summary-results (Accessed November 15, 2023).
Xu, F., Bento, V. A., Qu, Y., and Wang, Q. (2023). Projections of global drought and their climate drivers using CMIP6 global climate models. Water 15:2272. doi: 10.3390/W15122272
Yin, J., Gentine, P., Slater, L., Gu, L., Pokhrel, Y., Hanasaki, N., et al. (2023). Future socio-ecosystem productivity threatened by compound drought–heatwave events. Nat. Sustain. 6, 259–272. doi: 10.1038/s41893-022-01024-1
Yue, R. P. H., and Lee, H. F. (2020). Drought-induced spatio-temporal synchrony of plague outbreak in Europe. Sci. Total Environ. 698:134138. doi: 10.1016/J.SCITOTENV.2019.134138
Zhang, G., Wang, H., Gan, T. Y., Zhang, S., Shi, L., Zhao, J., et al. (2022). Climate change determines future population exposure to summertime compound dry and hot events. Earths Future 10:e2022EF003015. doi: 10.1029/2022EF003015
Zhang, X., Alexander, L., Hegerl, G. C., Jones, P., Tank, A. K., Peterson, T. C., et al. (2011). Indices for monitoring changes in extremes based on daily temperature and precipitation data. Wiley Interdiscip. Rev. Clim. Chang. 2, 851–870. doi: 10.1002/WCC.147
Zscheischler, J., Martius, O., Westra, S., Bevacqua, E., Raymond, C., Horton, R. M., et al. (2020). A typology of compound weather and climate events. Nat. Rev. Earth Environ. 1, 333–347. doi: 10.1038/s43017-020-0060-z
Keywords: climate change, droughts, heatwaves, population exposure, Iberian Peninsula
Citation: Bento VA, Lima DCA and Russo A (2025) Projections of population exposure to hot and dry events in the end of the 21st century on the Iberian Peninsula. Front. Clim. 7:1519880. doi: 10.3389/fclim.2025.1519880
Edited by:
Jose A. Marengo, Centro Nacional de Monitoramento e Alertas de Desastres Naturais (CEMADEN), BrazilReviewed by:
Najibullah Omerkhil, Forest Research Institute (ICFRE), IndiaCopyright © 2025 Bento, Lima and Russo. This is an open-access article distributed under the terms of the Creative Commons Attribution License (CC BY). The use, distribution or reproduction in other forums is permitted, provided the original author(s) and the copyright owner(s) are credited and that the original publication in this journal is cited, in accordance with accepted academic practice. No use, distribution or reproduction is permitted which does not comply with these terms.
*Correspondence: Virgílio A. Bento, vabento@ciencias.ulisboa.pt
Disclaimer: All claims expressed in this article are solely those of the authors and do not necessarily represent those of their affiliated organizations, or those of the publisher, the editors and the reviewers. Any product that may be evaluated in this article or claim that may be made by its manufacturer is not guaranteed or endorsed by the publisher.
Research integrity at Frontiers
Learn more about the work of our research integrity team to safeguard the quality of each article we publish.