
94% of researchers rate our articles as excellent or good
Learn more about the work of our research integrity team to safeguard the quality of each article we publish.
Find out more
ORIGINAL RESEARCH article
Front. Clim., 26 February 2025
Sec. Climate Mobility
Volume 7 - 2025 | https://doi.org/10.3389/fclim.2025.1516045
 Alina Schürmann1*
 Mike Teucher1
 Janina Kleemann2
 Justice Nana Inkoom2
 Benjamin Kofi Nyarko3
 Appollonia Aimiosino Okhimamhe4
 Christopher Conrad1
West Africa’s vulnerability to climate change is influenced by a complex interplay of socio-economic and environmental factors, exacerbated by the region’s reliance on rain-fed agriculture. Climate variability, combined with rapid population growth, intensifies existing socio-economic challenges. Migration has become a key adaptive response to these challenges, enabling communities to diversify livelihoods and enhance resilience. However, spatial patterns of migration in response to climate risks are not fully understood. Thus, the study evaluates the applicability of the IPCC risk assessment framework to map and predict migration patterns in Ghana and Nigeria, with a focus on identifying areas of potential out-migration. By integrating geospatial environmental, socio-economic, and population data, the study highlights areas that have a higher likelihood of migration for the current baseline and near future (2050). Future climate is modeled using CMIP6 projections under the RCP4.5 scenario, while population projections providing insight into future exposure. The results from the baseline assessment are compared with actual migrant motivations, providing a ground-level perspective on migration drivers. In northern Ghana and Nigeria, elevated hazard, vulnerability, and exposure scores suggest a higher likelihood of migration due to the overall risk faced by the population. This pattern is projected to persist in the future. However, migrant responses indicate that environmental factors often play a secondary role, with vulnerability factors cited more frequently as migration drivers. The findings highlight the importance of developing localized adaptation strategies that address the specific needs of vulnerable areas. Additionally, management strategies that enhance community resilience and support sustainable migration pathways will be critical in addressing future climate-induced migration challenges.
West Africa’s exposure and vulnerability to climate change is shaped by the interaction of socio-economic, political, and environmental factors (Trisos et al., 2022). Approximately 60% of the West African workforce is employed in agriculture (Allen et al., 2018). The reliance on rain-fed agriculture increases vulnerability to climate variability, especially for rural households (Sultan and Gaetani, 2016). In Ghana and Nigeria, the economies are heavily reliant on the agricultural sector, which is a key source of employment in both countries (Alehile, 2023; GSS, 2022a). In recent years, both countries have experienced increased frequency and intensity of droughts and floods, which have adversely affected agricultural productivity and food security (Owusu and Yiridomoh, 2021; Umar and Gray, 2023; Wrigley-Asante et al., 2019).
In both countries, the population is projected to grow significantly in the coming decades, further intensifying pressures on both agricultural and urban systems (Herrmann et al., 2020). As the population grows, the demand for food, water, and energy will rise, exacerbating environmental degradation and raising the risks associated with climate change (Simpson et al., 2023). Urban areas will be confronted with more people migrating to cities in search of better opportunities, increasing the density of informal settlements, poor sanitation and limited access to health care and education (Dick and Schraven, 2021). Rural areas, on the other hand, will face increased pressure on land and water resources due to population growth, potentially leading to more severe food and water shortages (Trisos et al., 2022). Rising temperatures and changing rainfall patterns could result in the unsuitability of current agricultural zones for staple crops such as maize, millet, and sorghum (Porter et al., 2014; Tomalka et al., 2021), which are of critical importance for food security and livelihoods in the region. Furthermore, increased evapotranspiration rates due to higher temperatures could exacerbate water scarcity issues, further challenging agricultural productivity (Tomalka et al., 2021). Climate-induced agricultural decline is likely to exacerbate existing socio-economic inequalities, as poorer households have fewer resources to adapt to changing conditions (Vinke et al., 2022).
In response to decreasing agricultural productivity, migration is often employed as an adaptive strategy, enabling individuals and communities to pursue alternative sources of income in urban areas or less affected rural areas (Adger et al., 2020; Borderon et al., 2019; Tuholske et al., 2024; van der Geest, 2011). By choosing to move to new locations or engaging in different economic activities, migrants can reduce their risks and enhance their resilience to environmental changes. Migrants often remit funds to their households in areas affected by climate change, providing a vital source of financial support for adaptation efforts (Maduekwe and Adesina, 2022). These remittance flows can help improve living standards, build infrastructure, and invest in sustainable practices that enhance resilience to climate impacts (Bendandi and Pauw, 2016).
It is likely that rural–urban migration will intensify, further contributing to the already pronounced urbanization trends in the region (Adamo, 2010; Serdeczny et al., 2017). However, migration itself can introduce new vulnerabilities, including social integration challenges, inadequate housing, and limited access to basic services in urban areas (Szaboova et al., 2023). In addition, people without financial resources or social networks may not be able to migrate, making them even more vulnerable to the adverse effects of climate change (Trisos et al., 2022). The ability of individuals, households and groups to make free and informed choices about whether, when and where to move or not to move is central to ensuring that mobility serves as an adaptation to climate change (Simpson et al., 2024). Simultaneous exposure to multiple stressors, including climate-related risks and other crises, can put translocal livelihood systems under severe pressure, potentially pushing them to their limits. Translocal livelihoods refer to the ways in which households and communities sustain themselves by using resources, networks and opportunities that are interlinked across different geographical areas (Steinbrink and Niedenführ, 2020). This interconnectedness allows households to diversify income sources, manage risks and access support from different places. However, when different parts of a migrant household face stressors simultaneously, their ability to coordinate, cope and adapt effectively can be compromised, leading to increased vulnerability and reduced well-being (Sakdapolrak et al., 2024).
In recent years, a growing body of research has focused on mapping vulnerability to various environmental and socio-economic risks (De Sherbinin et al., 2019). These studies employ spatial analysis to identify regions most at risk to hazards such as droughts (Ortega-Gaucin et al., 2021; Stephan et al., 2023) and floods (De Moel et al., 2015; Roy et al., 2021) or vulnerability due to climate change (Gupta et al., 2020; McMillan et al., 2024). The majority of the cited research is rooted in the risk assessment framework proposed by the Intergovernmental Panel on Climate Change (IPCC, 2014, 2022). Some studies also incorporate climate and/or population projections to map potential future risks (Dubey et al., 2021; Marzi et al., 2021). While this research has improved the understanding of where vulnerable areas are located, there is still a gap in the knowledge of the way people respond to these risks, particularly in relation to migration. How and where people move in the face of climate risks is not yet systematically understood (Szaboova et al., 2023). Nevertheless, spatial data indicating areas prone to such risks may help identify regions from which people are likely to relocate. Research on migration has often focused on environmental and demographic factors to identify migration hotspots (Hermans-Neumann et al., 2017; Mijani et al., 2022; Neumann et al., 2015).
To date, no study has applied the risk assessment framework specifically within the context of migration. Therefore, the study aims to evaluate the suitability of risk assessments to map and predict local migration patterns, with a focus on identifying areas of potential out-migration, both in the present and the future. To achieve this, multiple spatial datasets representing current and near-future conditions were collected based on expert knowledge and integrated into a framework proposed by Zebisch et al. (2023) based on the IPCC sixth assessment report (AR6). The results of the current state assessment were compared with the actual motivations of migrants from Ghana and Nigeria to provide a ground-level perspective on the factors driving migration.
While most studies using risk assessments have been conducted at the supra- and national or coarse subnational level (Ayodotun et al., 2019; Marzi et al., 2021), this study seeks to refine the approach by integrating environmental data with existing socio-economic vulnerabilities at a more localized administrative level. This approach provides a clearer picture of where communities might respond to the impacts of climate change and therefore targeted interventions can be developed to enhance the local adaptive capacity and/or provide sustainable support for inhabitants that choose to migrate.
Ghana, a lower-middle income country in West Africa, has a population of approx. 31 million inhabitants (GSS, 2021a). Ghana’s economy is mainly driven by the agricultural sector, which employs 33% of the workforce (62.9% when referring to the rural population), with a high dependency on rain-fed crops such as maize, millet, and cassava (GSS, 2022b; MoFA, 2021). The country faces challenges due to inadequate infrastructure and lacking access to essential services such as water, sanitation, and health care (GSS, 2021b). Cocoa is a key economic contributor, alongside other cash crops such as oil palm, cashew and rubber (Essegbey and MacCarthy, 2020). Ghana is divided into 16 regions (administrative level 1) and 261 districts (administrative level 2; see Figure 1).
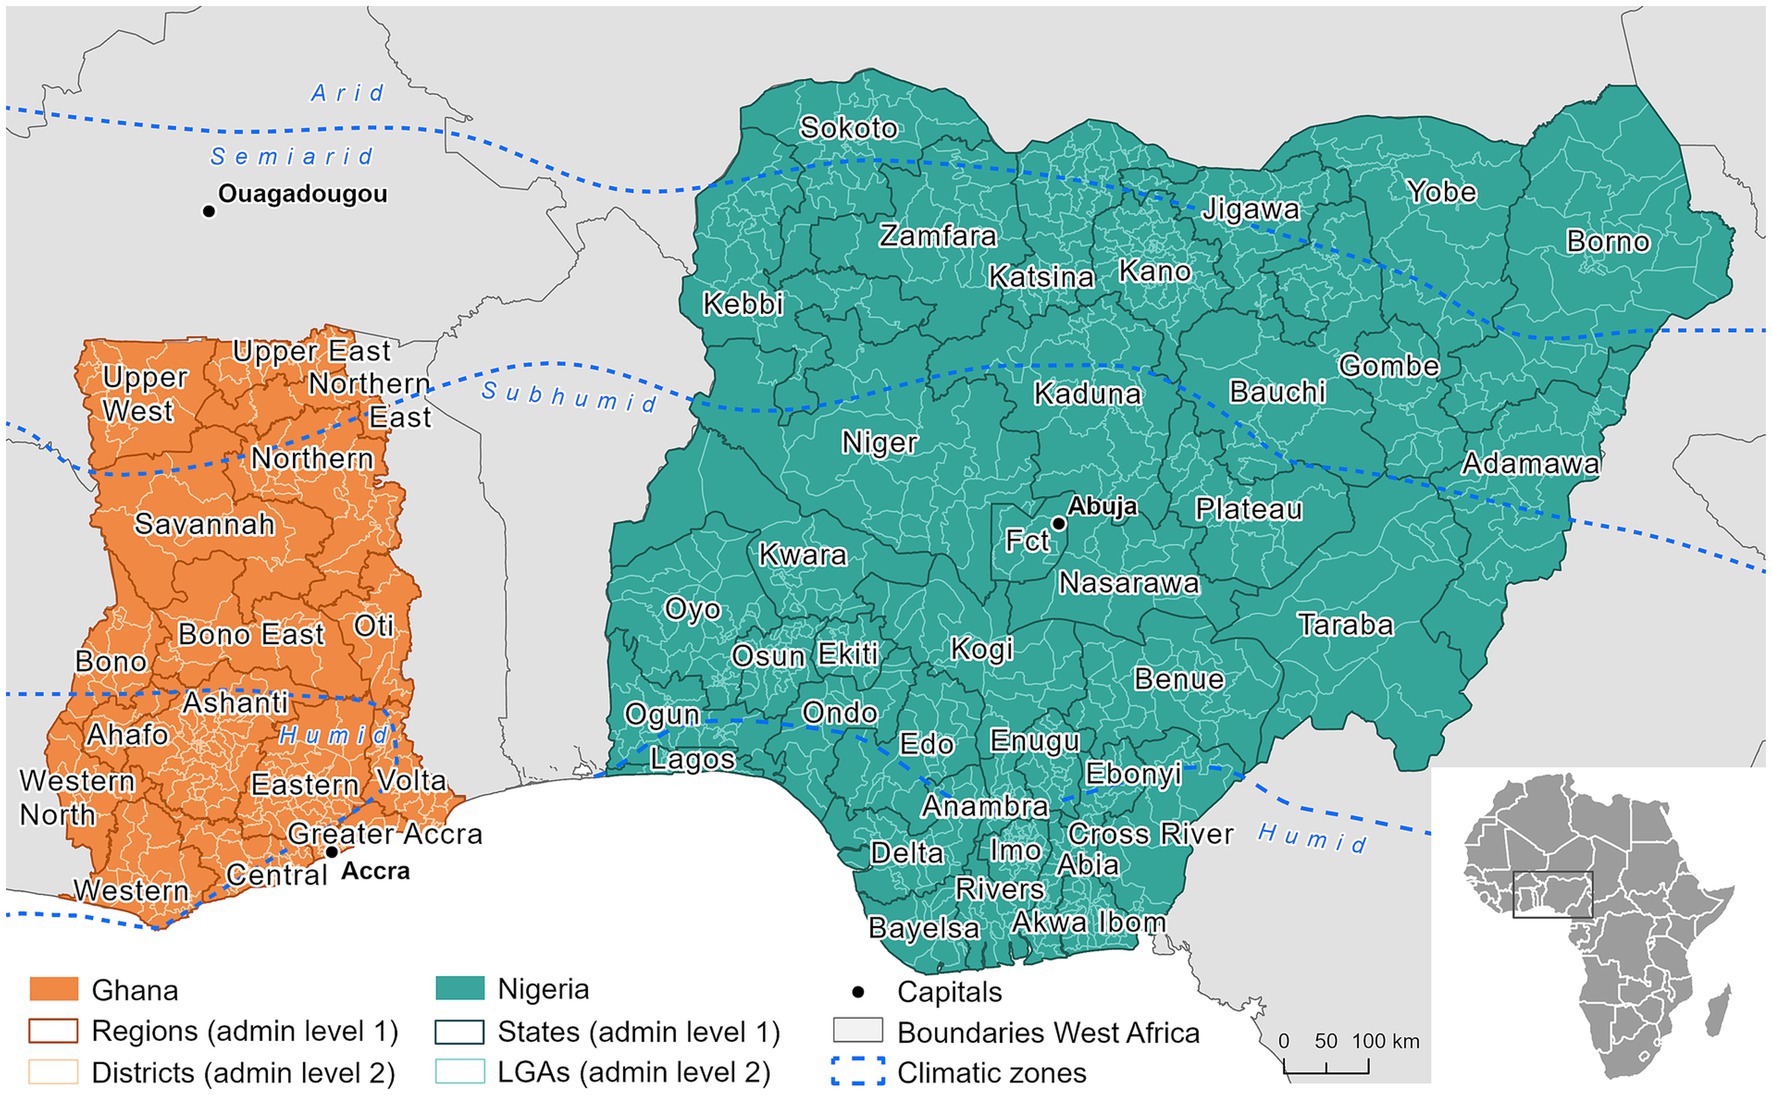
Figure 1. Focus countries with administrative levels and climatic zones. Fct, Federal Capital Territory.
The second country investigated is Nigeria, which is the continent’s largest economy and most populous country with 236.7 million people (The World Factbook, 2021). Nevertheless, the poverty rate exceeds 50%, inequality is increasing, and the economy is vulnerable to fluctuating oil prices. Agriculture employs about 35% of the workforce, and the sector is heavily dependent on rainfall (Alehile, 2023). Ongoing conflicts, such as the Boko Haram insurgency in the north-east and unrest in the Niger Delta, are exacerbated by governance challenges that threaten the overall stability of the country (Berger et al., 2021). Climate change increases challenges in key sectors such as agriculture and hydropower, and disrupting food and water security (The World Bank Group, 2021). Moreover, Nigeria’s rapid urbanization has led to the growth of informal settlements in cities such as Lagos and Abuja, where residents are exposed to various climate-related risks, including flooding and heat waves (Benjamin Obe et al., 2023; Ismail et al., 2024; Ndimele et al., 2024). Nigeria is divided into 36 states and 774 local government areas (LGAs). In both countries, the rural population’s reliance on agriculture amplifies vulnerability to impacts of climate risks like poor crop yields due to droughts.
In this study, the risk assessment framework proposed by Zebisch et al. (2023) based on the IPCC AR6 was adapted to identify areas where climate-induced hazards interact with pre-existing vulnerabilities potentially leading to migration. McLeman et al. (2021) expanded this framework by viewing migration as part of a continuum of agency, emphasizing that migration decisions are shaped by perceived risks and available options. When local adaptation measures are not sufficient to reduce risk and a certain threshold is crossed - such as resource depletion or a decline in livelihoods - households may choose to migrate as a response. As outlined in the IPCC AR6, the determinants of risk include hazard, vulnerability and exposure (IPCC, 2021). Hazards, such as droughts or floods, intensified by climate change, threaten agriculture and food security in the region (Zougmoré et al., 2016). Section 2.4 details the newly generated data related to hazard indicators. Vulnerability refers to the susceptibility of a population to harm due to various socio-economic and environmental factors, such as poverty, lack of infrastructure, and limited access to resources. In West Africa, high agricultural dependency, combined with socio-economic challenges, amplifies the vulnerability of rural communities to climate impacts (Sultan and Gaetani, 2016). Vulnerability indicators are classified into ‘sensitivity’ (socio-economic/ecological) and ‘capacity’, as proposed by Zebisch et al. (2023). The newly generated data related to vulnerability indicators is detailed in Section 2.5. Exposure refers to the presence of people, livelihoods, and assets in hazard-prone areas. In West Africa, large segments of the population reside in regions highly susceptible to climate hazards, increasing their risk of adverse impacts (Almar et al., 2023; Trisos et al., 2022). The data generated for exposure indicators is outlined in Section 2.7.
Migration is integrated into the risk assessment framework as a potential outcome resulting from the interaction of hazard, vulnerability and exposure. The overall risk is calculated using Equation 1:
Where the present or future hazard, vulnerability, and exposure component are combined for the risk indicator and wH, wV, and wE are the respective weights assigned to each component. The indicator selection for each component, along with their weightings, is described in the Section 2.3. For all components and the overall risk, values ≥0.6 are assumed to have rather negative impacts on the population (GIZ and EURAC, 2017). This threshold is used to identify areas where migration is more likely to occur compared to areas below this threshold. Migration is conceptualized as one of the adaptive responses that individuals and communities may choose to reduce their exposure to climate risks, increase their resilience, or seek better opportunities (McLeman et al., 2021).
This study focuses on the RCP4.5 scenario, a “middle of the road” pathway that projects a temperature rise of approximately 2.7°C by the end of the century (IPCC, 2023). This scenario aligns with the guidance from Zebisch et al. (2023) for the application of climate risk assessments. An overall workflow is illustrated in Figure 2.
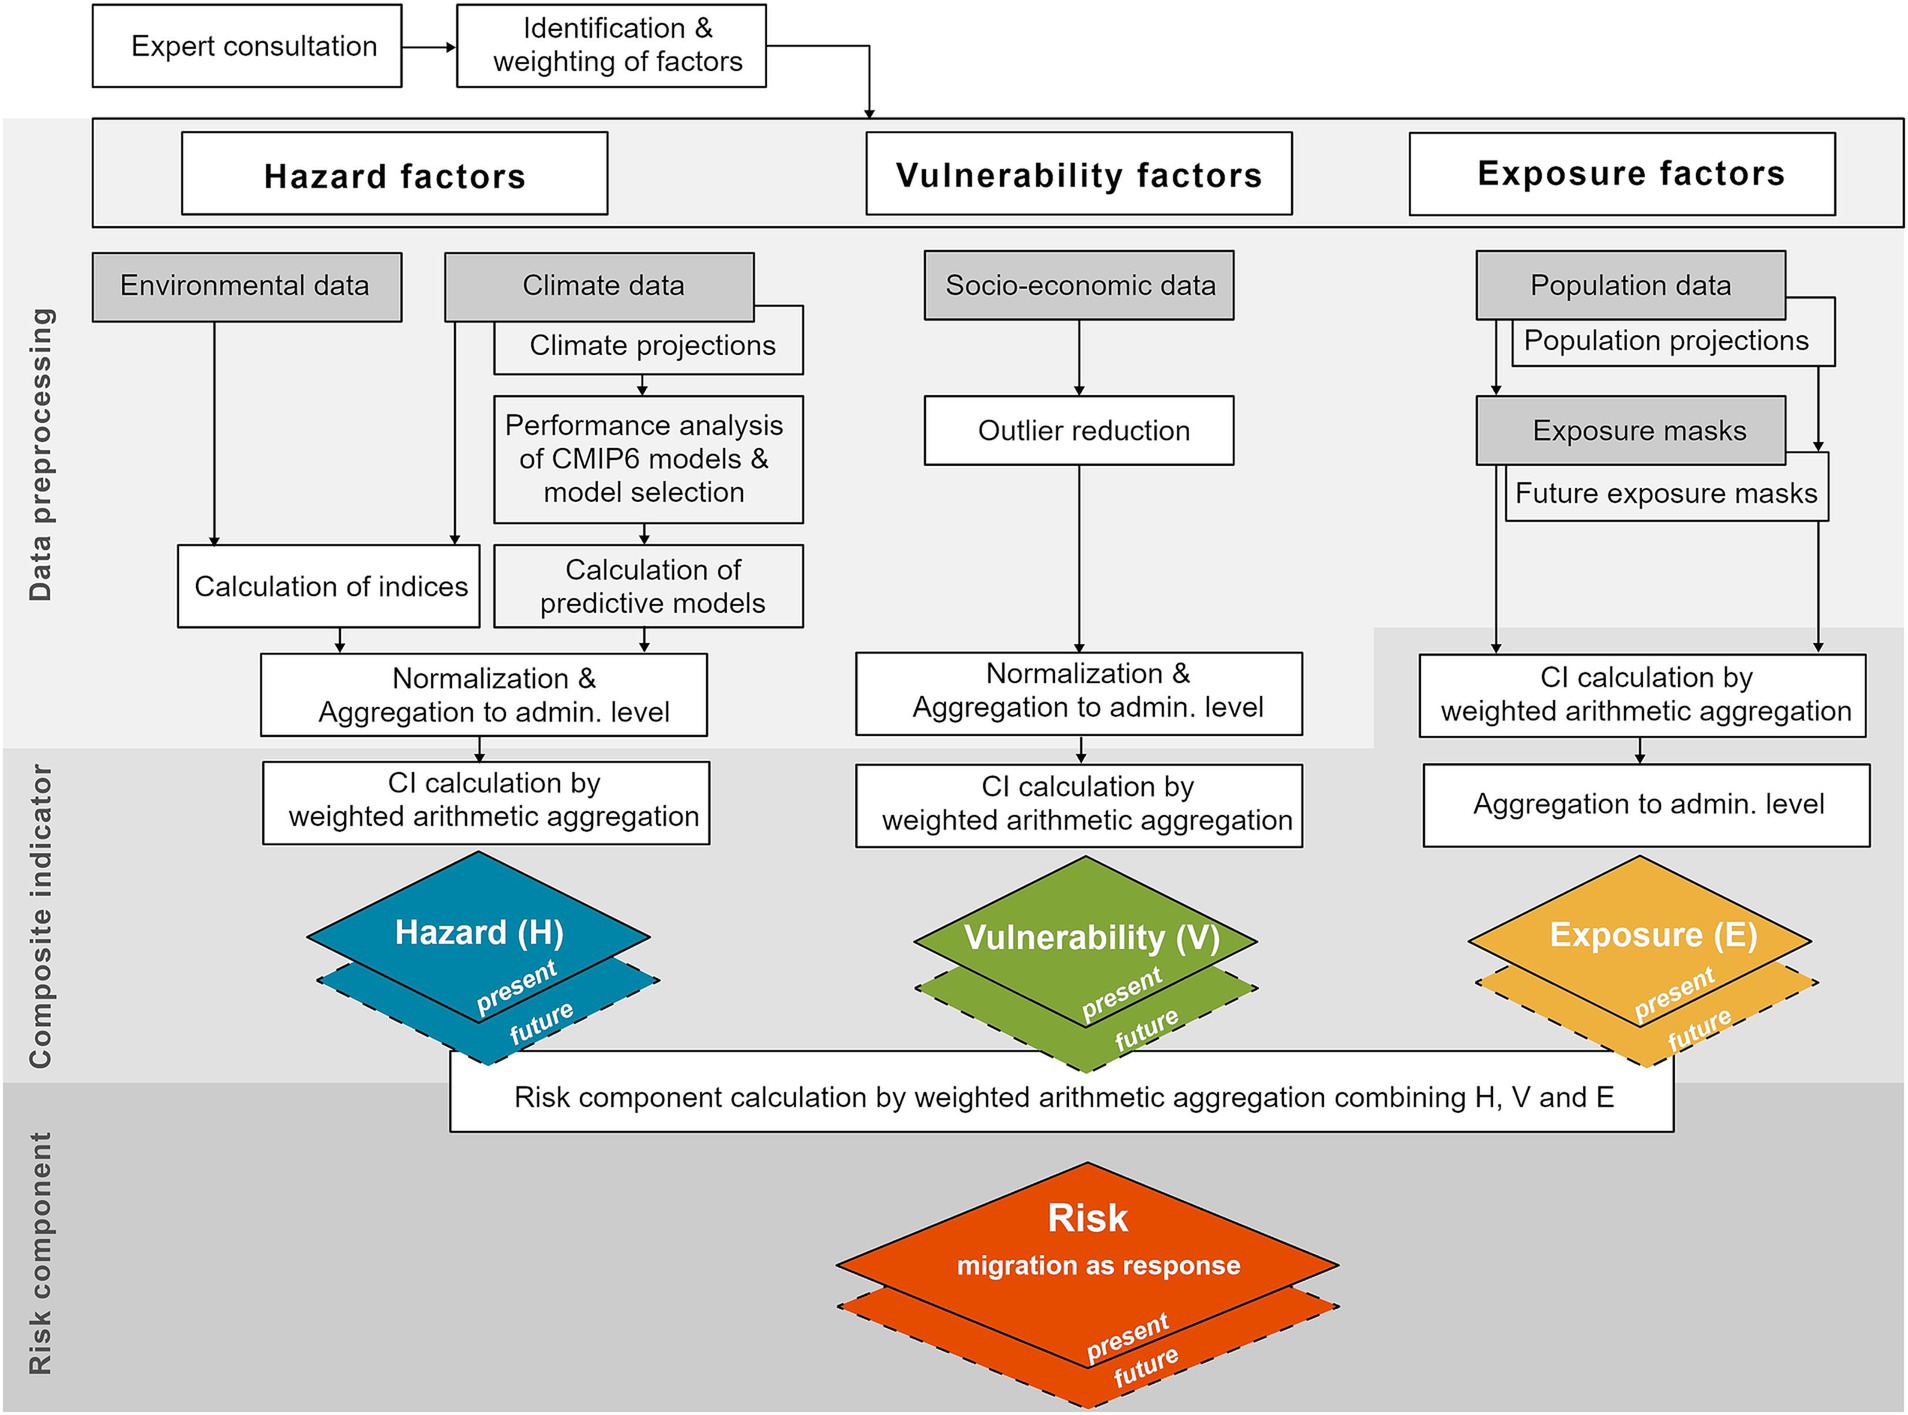
Figure 2. Overall workflow of present and future risk assessments. CI, Composite indicator.
In November and December 2023, two online workshops with experts from Ghana and Nigeria aimed to identify and weight key hazard, vulnerability and exposure factors that influence migration decisions in each country. The interactive tool Miro Board (Miro, 2024)1 was used to introduce pre-defined factors from a literature review (based on Schürmann et al., 2022) to the participants. Four experts from Ghana and six from Nigeria reviewed these factors, with the option to modify, delete or add new factors, and to map connections between components. This process resulted in the identification of 11 hazard factors, 16 vulnerability factors and 10 exposure factors, although not all were relevant in both countries (e.g., fire events were important for Ghana but not for Nigeria). Some factors could not be included in the analysis due to unavailability of proxy indicators (see Supplementary Table S1).
Participants in these interviews were scientists from research institutes and NGOs with expertise in human migration and related research fields, particularly agricultural systems, rural and urban systems, food security, climate change risks, and adaptation strategies in their respective countries. The majority of the experts have more than 10 years of experience in their fields (Supplementary Table S2).
The “Budget Allocation” method (European Commission, 2023) was employed to weight these factors. Each expert was given a budget of 100 points to distribute among the factors for each composite category (hazard, vulnerability, and exposure) and for two time periods (the current situation as baseline and for 2050). This method enabled the experts to assign relative importance to each factor, allowing for equal weighting where necessary.
The median of the assigned budgets for each factor, for both countries and time periods, was normalized by dividing each value by the highest value across both the available present and future datasets. This approach allows to account for changes in the weightings over time. Table 1 lists the factors and respective proxy indicators used, and Figure 3 shows their normalized weightings.
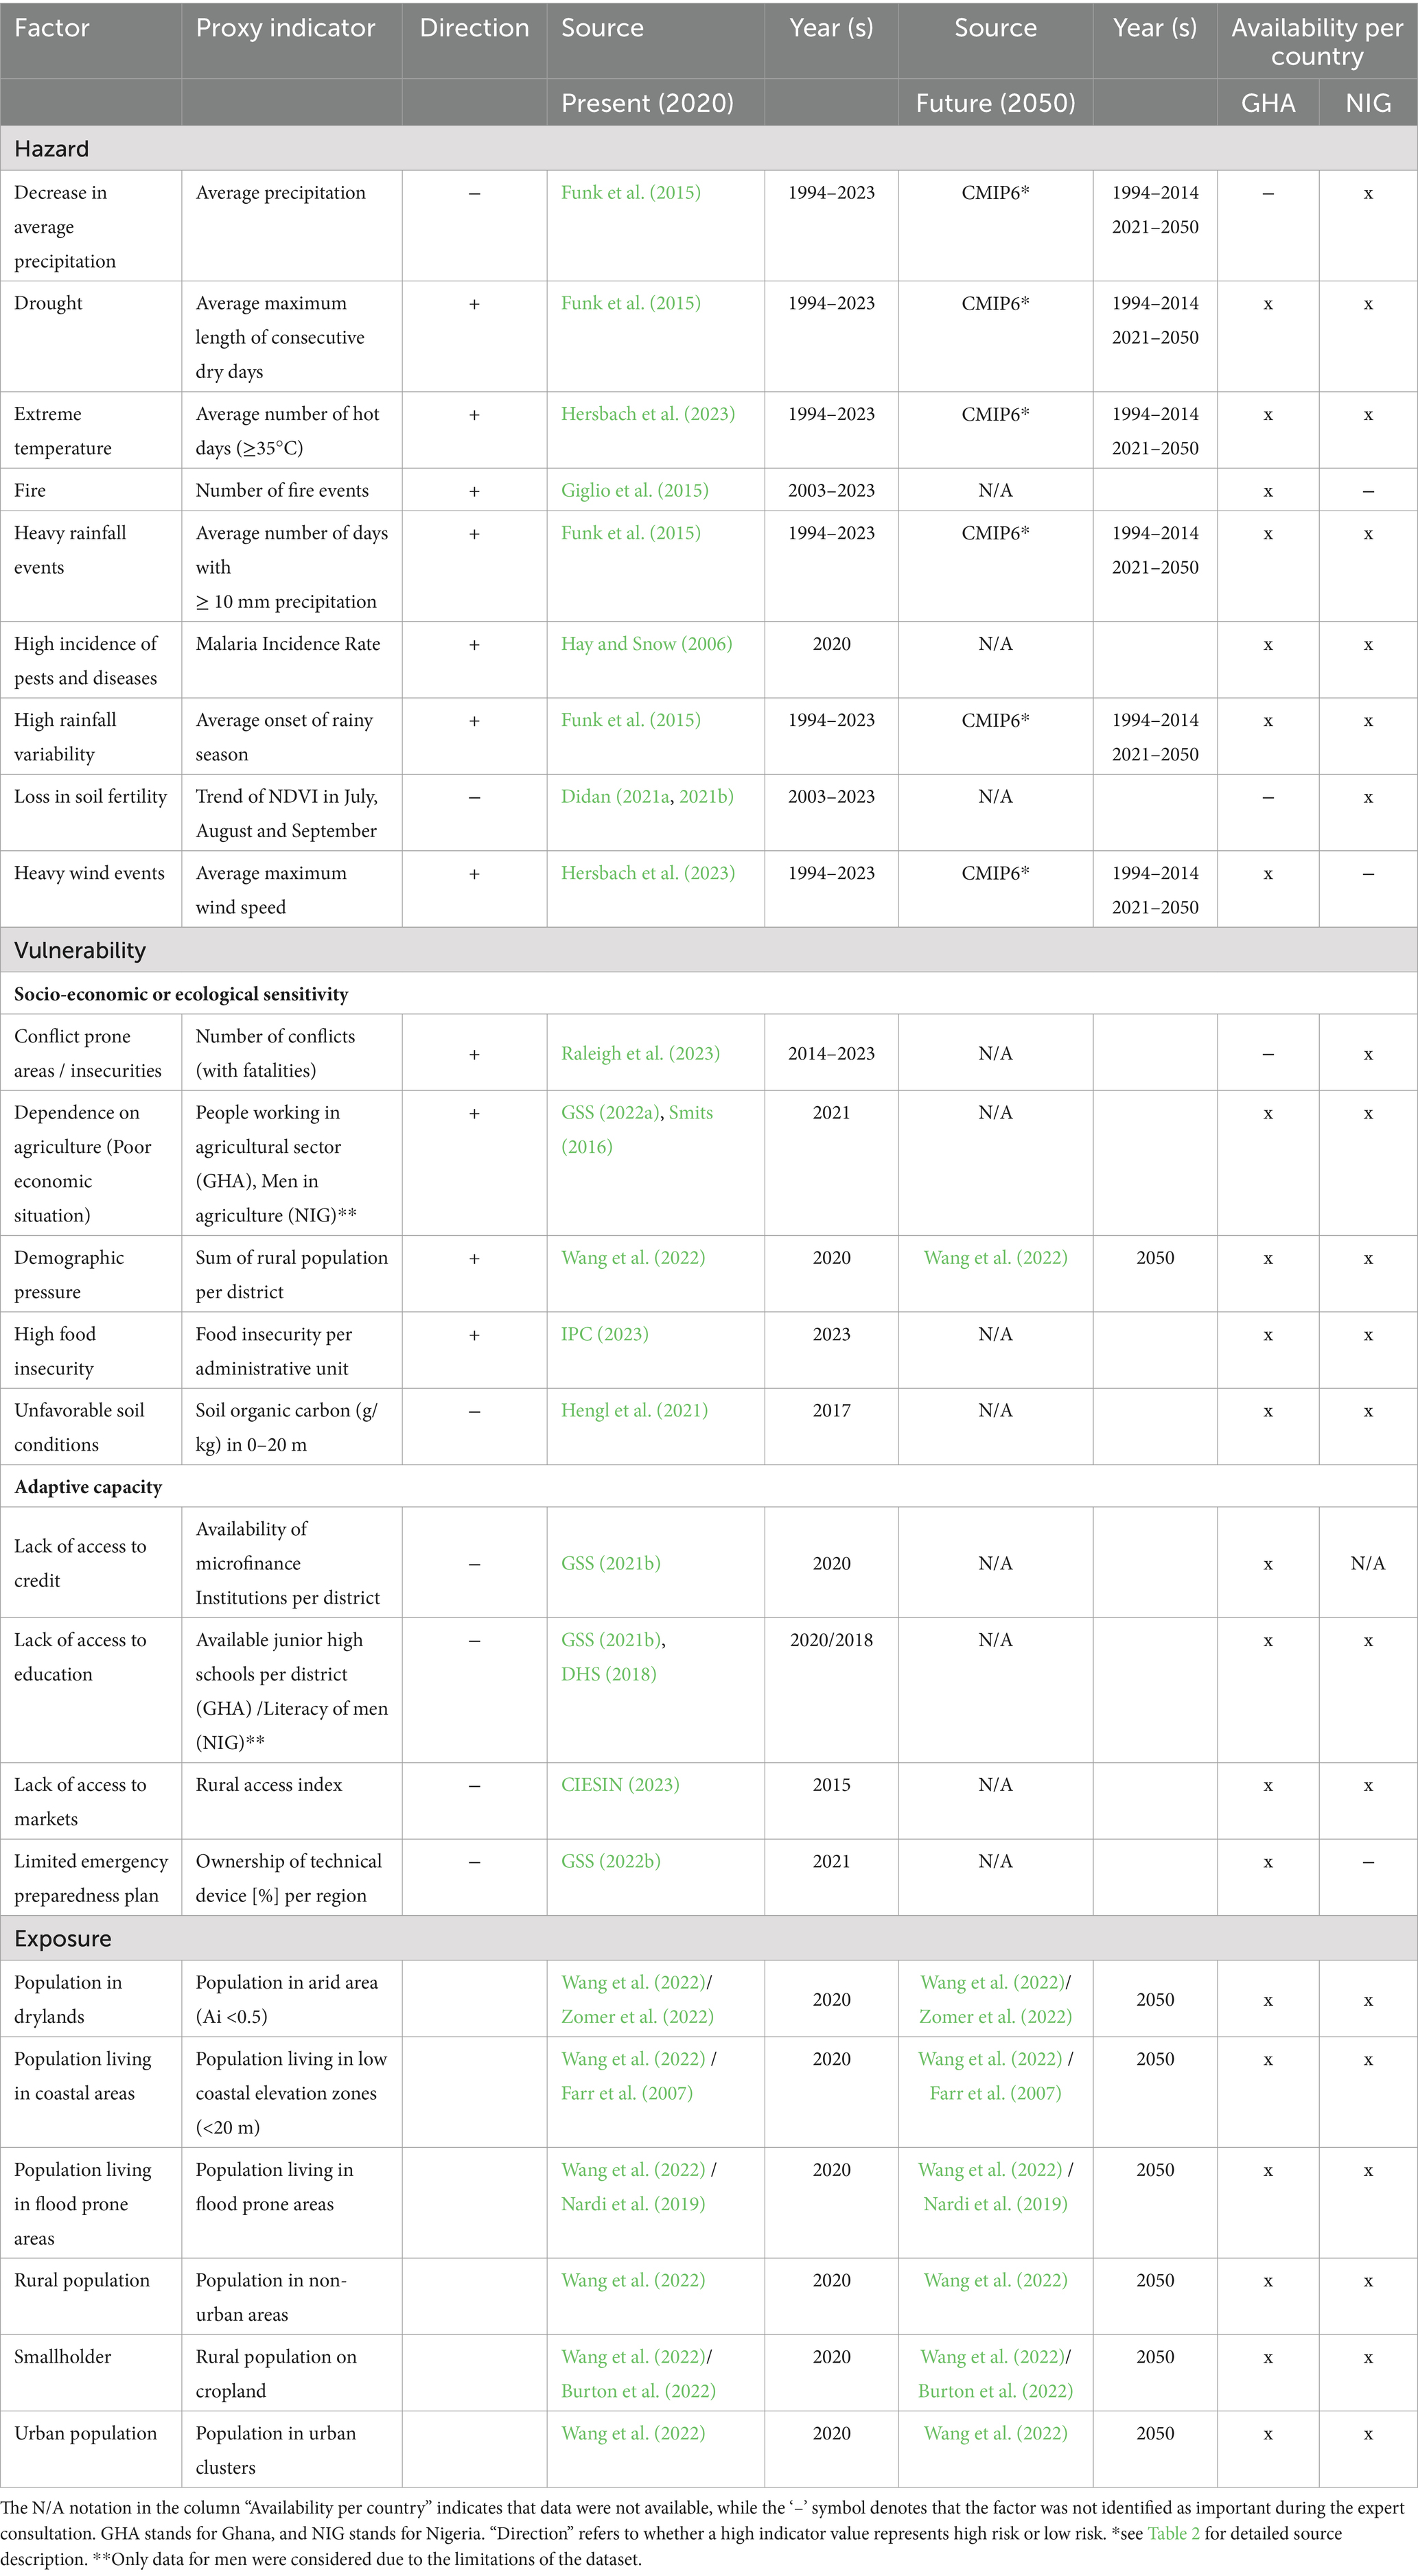
Table 1. The table presents the identified factors and their proxy indicators with information on data sources.
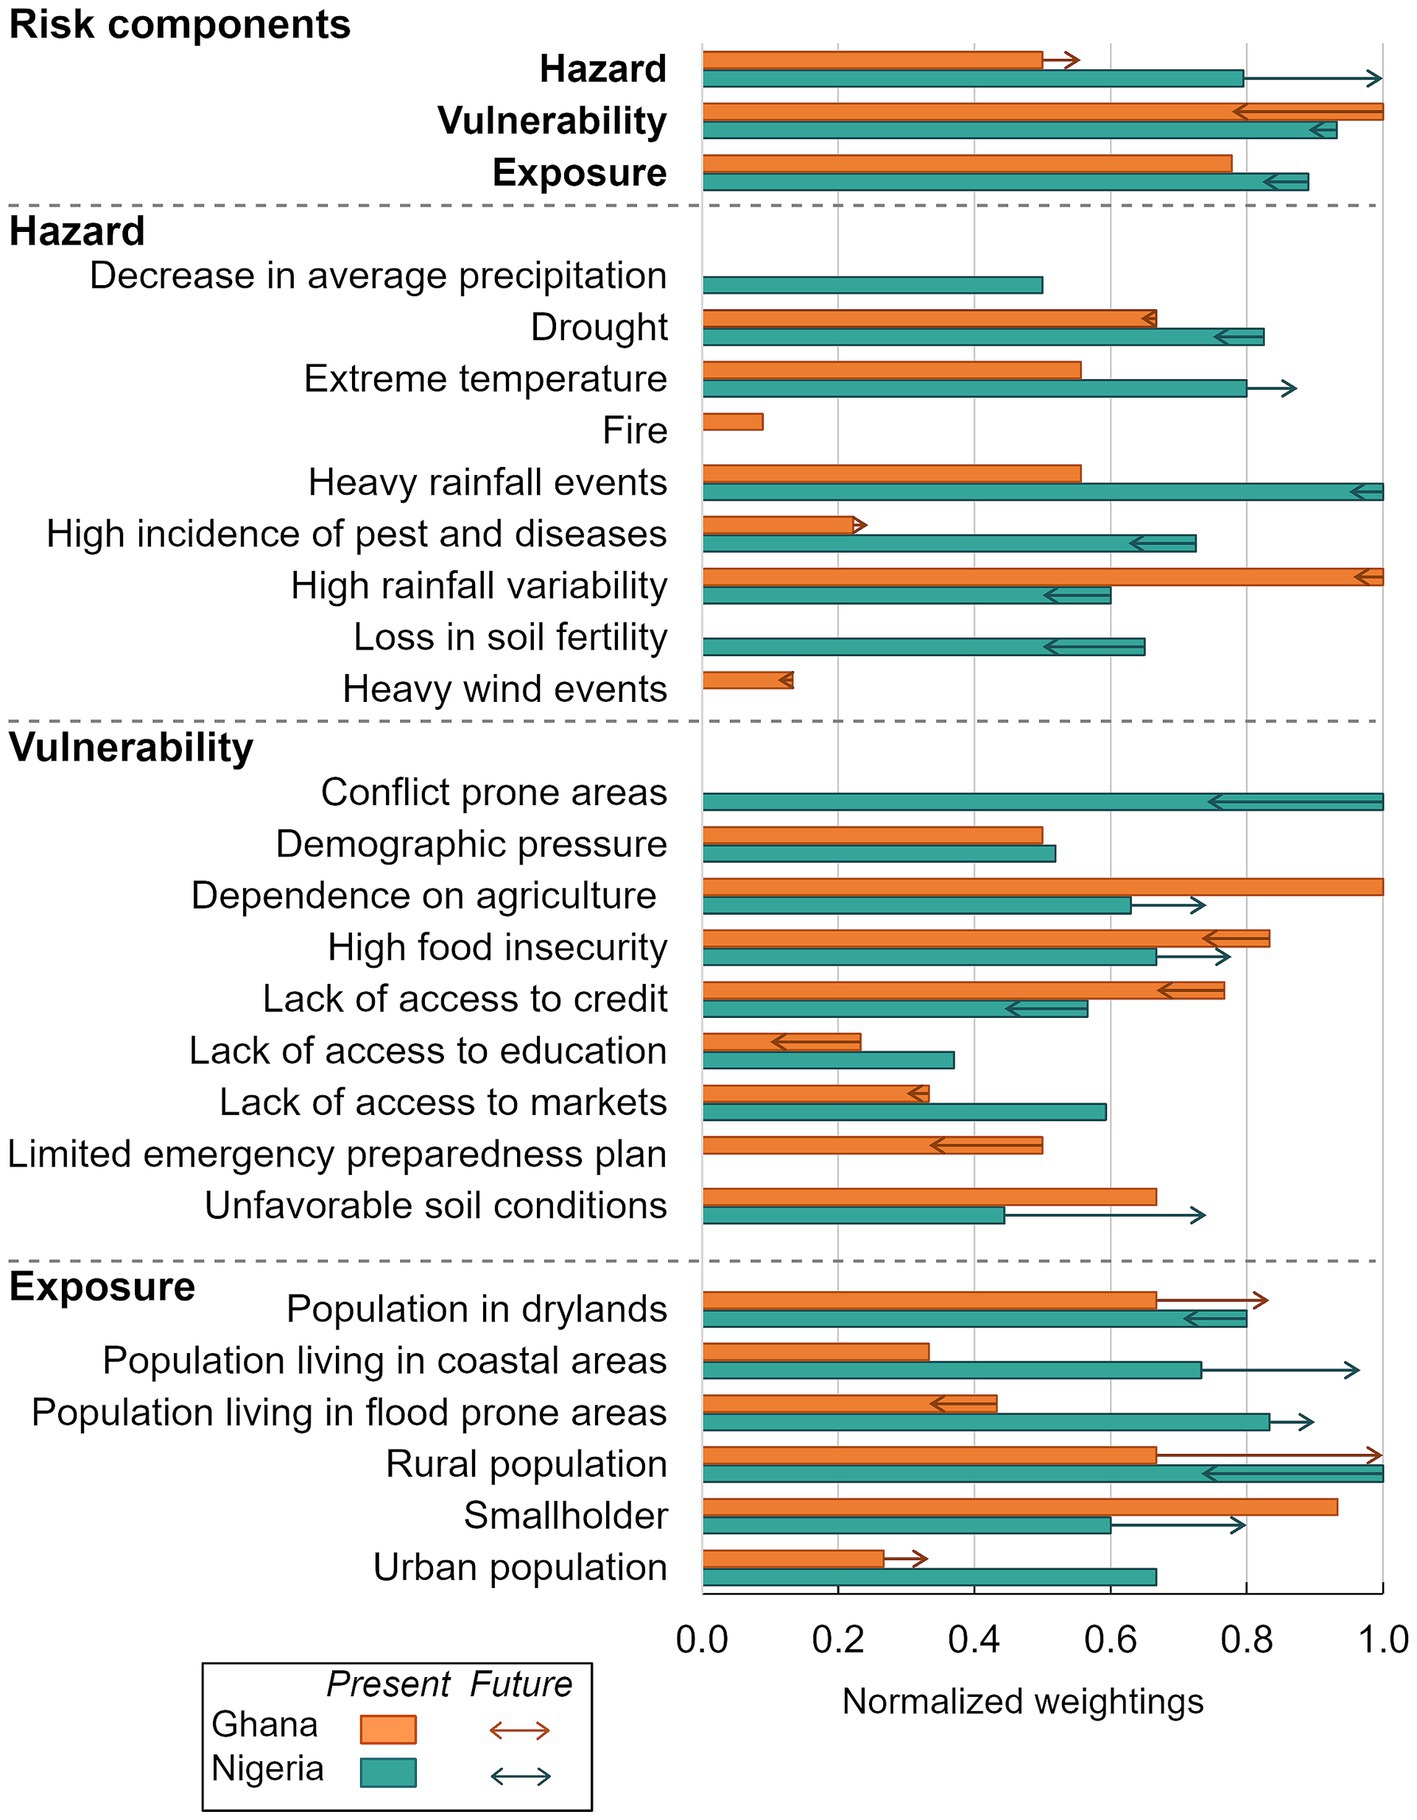
Figure 3. Composite indicators and respective identified factors with available spatial data and their weightings for the present and the future risk assessment. The bars indicate the present weighting, the arrows show the weighting for the future.
The hazard composite indicator, primarily based on climate indices, required extensive preprocessing. For the present rainfall indices calculation, covering the period 1994–2023, we derived precipitation data from the Climate Hazards Group InfraRed Precipitation with Station data (CHIRPS; Funk et al., 2015). The CHIRPS dataset, which covers Africa from 1981 to the present, combines satellite data with in-situ measurements at a 0.05° × 0.05° resolution, producing gridded precipitation time series that are well-suited for trend analysis and seasonal drought monitoring (Kouakou et al., 2023). The ERA5 reanalysis dataset (C3S, 2023; Hersbach et al., 2023) with 0.25° x 0.25° resolution was used to estimate daily maximum temperature and daily maximum wind speed with the latter calculated from the u- and v-components of wind at 10 m height.
In addition to calculating basic precipitation indices such as the number of heavy rainfall events, the factor “High rainfall variability” was proxied by the shifted onset of the first rainy season. A shift of the onset can have impacts on traditional planting schedules and crop growth cycles (Dunning et al., 2018; Van De Giesen et al., 2010). The rainy season onset was calculated pixel-wise for each year using an adapted method from Stern et al. (1981) and Laux et al. (2008), which defines the onset as the first day meeting three conditions: (1) at least 20 mm of rainfall is observed within a 5-day period; (2) the starting day and at least two other days within this 5-day period are wet (receiving at least 0.1 mm of rainfall); and (3) there is no dry period of seven or more consecutive days within the subsequent 30 days.
We calculated the future climate indices based on the difference of CMIP6 model projections (2021–2050) and historical CMIP6 data (1994–2014), which was then added to the respective present climate index. CMIP6 models were acquired from the Earth System Grid Federation’s data portals (ESGF) CMIP6 archives.2 Preselection criteria included their availability under the RCP4.5 scenario and a spatial resolution of at least 1.4° (~ 150 km), ensuring adequate pixel coverage over the study area in order to be able to analyze spatial differences, resulting in 13 models (Table 1). Historical simulations of daily precipitation, maximum temperature and maximum wind speed from 1994 to 2014 were utilized to assess the performance of the CMIP6 models, as not all climate models perform equally for each geographical location (Dembélé et al., 2020). Some models perform better for specific locations than others.
Therefore, the performance of the CMIP6 models in representing the main features of the West African climate was evaluated by comparing the precipitation, the number of days ≥35°C and maximum wind speed over the historical study period to observational data, using monthly averages as suggested by Romanovska et al. (2023). In case of precipitation, this approach allowed us to examine the models’ capacity to capture seasonal distribution and accurately represent the bimodal rainfall regime characteristic of southern Ghana. CHIRPS data were used as the observational reference for daily precipitation, while ERA5 reanalysis data were used for daily maximum temperature and 10 m maximum wind speed.
Due to variations in the horizontal resolution of each dataset (see Table 2), bilinear interpolation was employed to standardize all model datasets to a 1° resolution (~110 km) before performance assessment. All models were harmonized to a 365-day calendar.

Table 2. CMIP6 global climate models used in this study, sorted alphabetically.
The outputs of the historical CMIP6 models were compared with the observational datasets for Ghana and Nigeria individually, using two performance metrics: Mean Absolute Error (MAE; Equation 2) and Kling-Gupta Efficiency (KGE; Equation 3). The MAE represents the mean of the absolute differences between the model predictions and the reference data, with lower MAE values indicating higher model quality (Willmott, 1982).
Where n is the number of observations, is the model data and is the observational data. The KGE (Gupta et al., 2009) accounts for the model’s correlation, bias, and variability compared to the validation data.
Where r is the Pearson correlation coefficient, σ is the standard deviation of model (m) and validation (v) which is the observational data, μ = arithmetic mean of model (m) and validation (v).
A model is selected if:
is the average of values across all models. The results of the performance assessment and selected models can be found in Supplementary Table S3 and Supplementary Figure S1.
Subsequently, we calculated each climate index for each selected model at the native resolution and then resampled the outputs to a 1° resolution. Then, the equal-weighted ensemble mean of each climate index across the selected models was calculated. This method reduces the impact of inconsistencies among different model outputs, thereby producing more reliable outcomes compared to reliance on individual models (Abel et al., 2024), as the models have different strengths in the performance of simulating extreme events or long-term changes (Klutse et al., 2021).
All climate indices were averaged over the respective time periods, and the differences between the predicted CMIP6 models and the historical CMIP6 models were calculated. These differences were added to the corresponding high-resolution observational datasets, such as CHIRPS or ERA5, after resampling the difference layer to match the resolution of the observational dataset using the nearest neighbor method. This method allowed us to generate predictive models with the high resolution of the observational data while incorporating climate model outputs. A simplified visualization of this approach can be found in Figure 4. The output of this approach can be found in Supplementary Figures S2, S3.
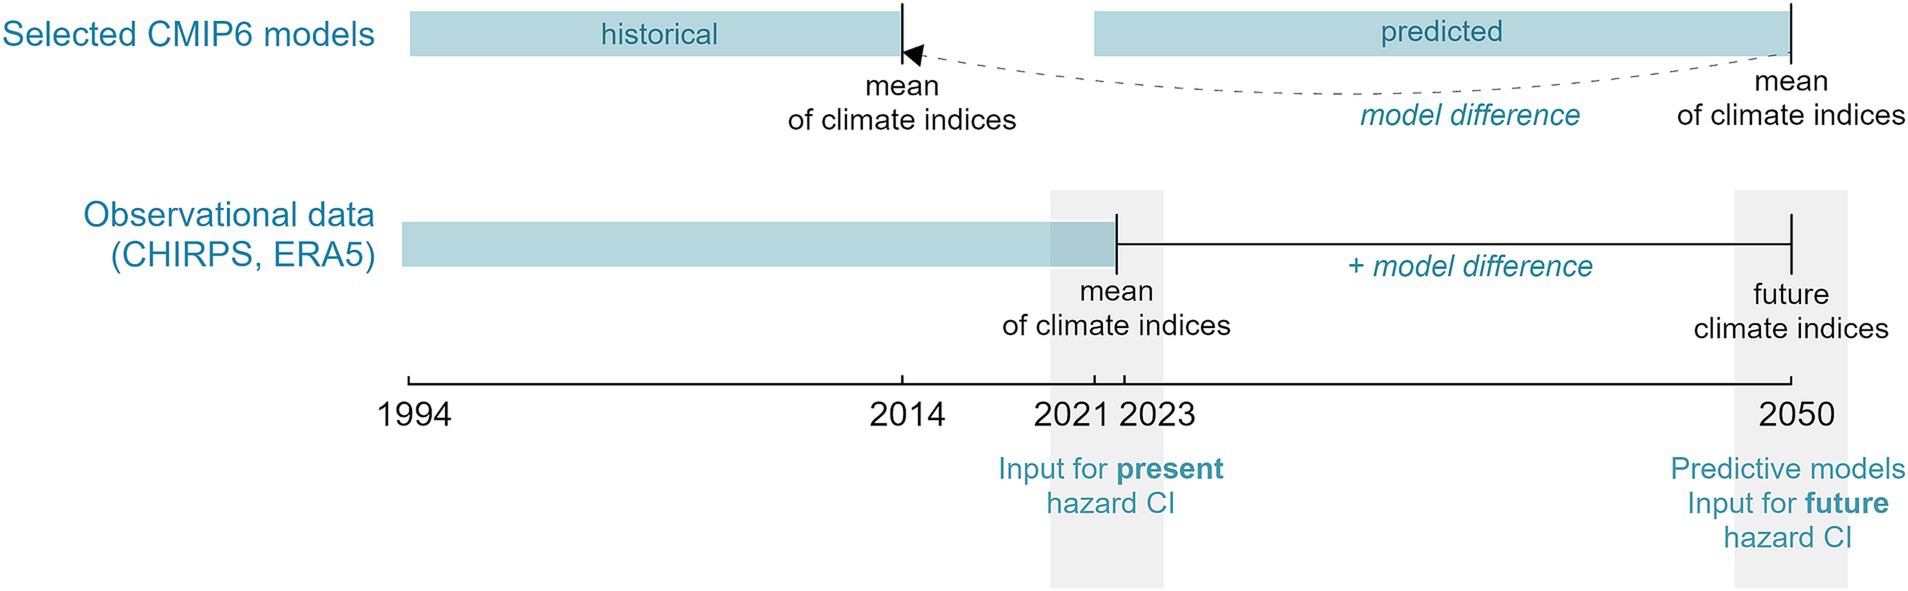
Figure 4. Visualization of future climate indices (predictive model) calculation. CI stands for Composite Indicator.
As an indicator of loss in soil fertility, the Normalized Difference Vegetation Index (NDVI) was used to assess vegetation vitality and productivity. This study combined NDVI data from the MODIS products AQUA (MYD13Q1; Didan, 2021a) and TERRA (MOD13Q1; Didan, 2021b) to produce 46 layers per year from 2003 to 2023. The Mann-Kendall test was employed to detect trends in soil fertility, using the tau as a proxy indicator. For this purpose, three-month median composites were created for June, July and August, representing the growing season of major food crops in Ghana and Nigeria (FAO, 2024a, 2024b). Pixels lacking information due to cloud cover were replaced by the median of a 5×5 moving window after these pixels were identified using the MODIS pixel reliability layer.
While data from the current census are available for Ghana, an attempt was made to identify corresponding equivalents for Nigeria. The future vulnerability component was calculated using the present-state vulnerability data in conjunction with their future weightings, given the unavailability of gridded or subnational data for future periods for both countries. In the case of demographic pressure, however, future projections were accessible for both countries. This factor was calculated by summing the rural population for 2020 and 2050 per district or LGA, as it is assumed that a high rural population, in particular, reflects the potential scarcity of resources. The aggregated datasets were then normalized using the global minimum and maximum, which is further explained in Section 2.6.
To align with the method proposed by GIZ and EURAC, (2017) and Zebisch et al. (2023), each indicator was rescaled to a consistent range from 0.0 to 1.0, with higher values indicating more negative conditions for livelihoods. For the hazard component, first the indicators were aggregated to the administrative level 2 boundaries (districts in Ghana and LGAs in Nigeria). In case of the hazard component with future predications available, a global normalization approach was used to normalize the aggregated datasets (see Equation 4), utilizing the minimum and maximum values across both the observational and predictive model time layers. This “global” normalization ensures comparability between present and projected future conditions.
Where, represents the input value, either from the observational dataset or the predicted dataset , denotes the minimum value across both datasets. The value is the maximum value across both datasets.
Other hazard indicators, which could not be predicted to the future were normalized according to the formula:
In case of a negative direction (when a high indicator value represents a low risk, e.g., in case of available microfinance institutions; see Table 1), the value was subtracted by 1.
As socio-economic factors may vary significantly between urban and rural areas, we first reduced outliers by identifying the 95th percentile. Any values exceeding the 95th percentile were replaced with the value below this threshold. Subsequently, data were aggregated at the administrative level 2 boundaries and normalized according to Equation 5. The normalized hazard and vulnerability factors are displayed in Supplementary Figures S4–S6. To aggregate individual indicators into composite indicators, Zebisch et al. (2023) recommend using a ‘weighted arithmetic aggregation’. This method involves multiplying each individual indicator by its respective weight, summing these products, and then dividing the sum by the total sum of the weights. This process is used to calculate the composite indicator (CI) of a risk component (see Equation 6).
Where CI is the composite indicator for the or the (e.g., hazard), I represents an individual indicator of a component, n is the number of indicators, and w is the weight assigned to the indicator. The weights used were identified in the expert consultation (see Section 2.3) and are shown in Figure 3. If no future dataset was available, the present-day data were utilized for the future risk components, with their weighting adjusted based on expert opinions.
A gridded projected population dataset published by Wang et al. (2022) with a 1 km resolution for the years 2020 and 2050 was employed to assess the exposure component. This dataset had been developed using the Shared Socioeconomic Pathways 2 (SSP2) “middle of the road” scenario. Six exposure layers were created for each year to represent different population groups identified by the expert consortium as being particularly vulnerable and more likely to migrate in response to hazards (see Table 1; Figure 3). Urban areas were defined on the basis of the spatial extent of settlements (CIESIN, 2021). Thus, in Ghana urban clusters are defined as grid cells with a minimum population of 5,000 and a density of 500 people per km2. For Nigeria, urban areas are characterized by a minimum population of 10,000 and a population density of at least 1,500 people per km2. Rural areas were defined as non-urban areas. Farmers were represented by overlaying rural population data with cropland areas, reflecting the assumption that smallholders reside near their farmland. The spatial distribution of the exposure layers is illustrated in Figure 5. After clipping each exposure layer with the population raster, population density was reclassified to a value of 1 for densities equal to or greater than 50 inhabitants per km2. This reclassification emphasized population distribution while minimizing misinterpretations from urban density outliers during normalization. The detailed population distribution for each layer and time period is provided in Supplementary Figure S7. Subsequently, these distribution layers were used to calculate the exposure component according to Equation 6. The gridded exposure component was then aggregated to the administrative boundaries using the 99th quantile, allowing to map the most at-risk population groups and recognize that certain areas, such as drylands or rural regions, may face higher migration pressures from hazards. In order to quantify population growth within a district or LGA, we calculated the percentage difference between 2020 and 2050 using data published by Wang et al. (2022) (see Supplementary Figure S8), enabling more accurate assessments of population exposure.
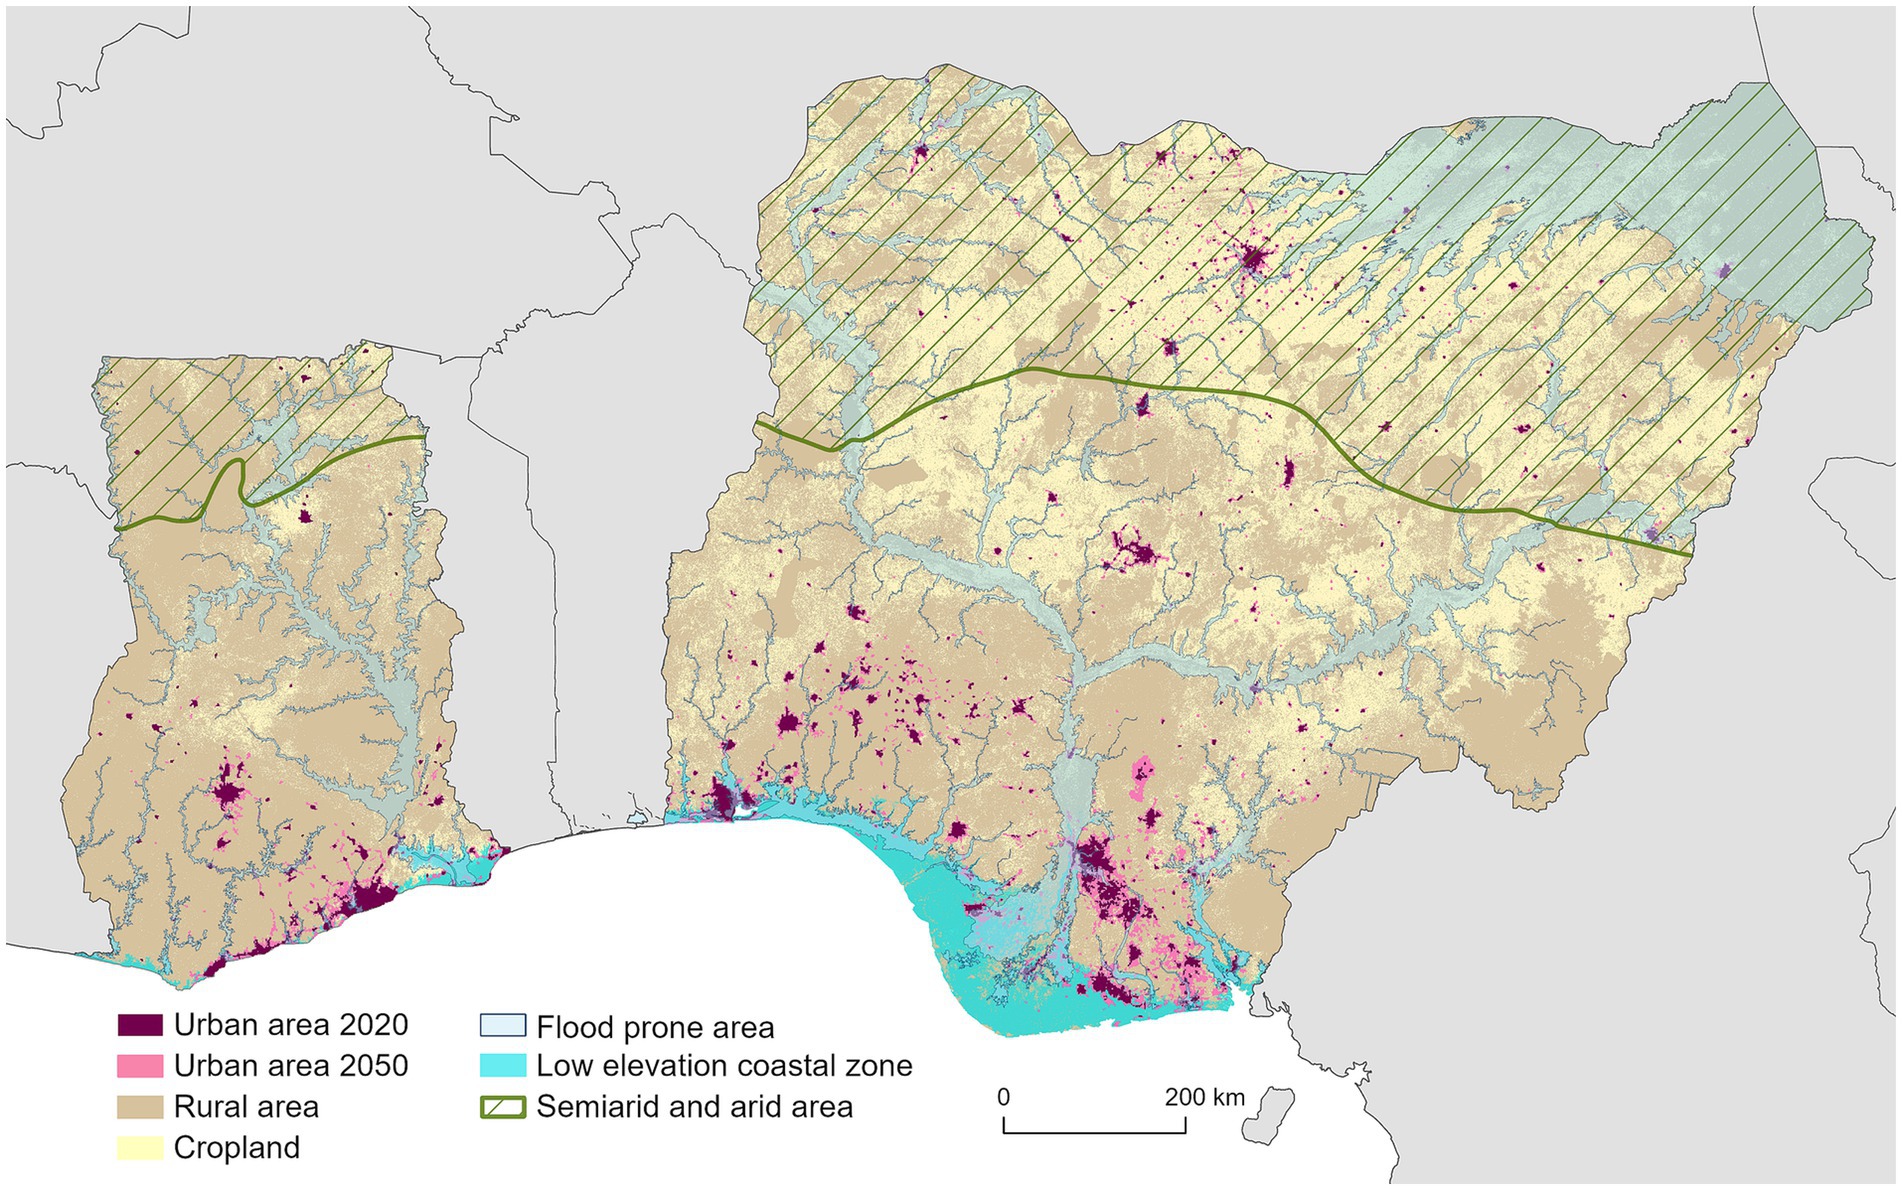
Figure 5. Spatial distribution of exposure layers.
To assess whether high hazard and vulnerability scores align with migrants’ actual motivations, we analyzed data from national interviews developed and implemented in Ghana and Nigeria by research teams from the University of Cape Coast (Ghana) and the Federal University of Technology Minna (Nigeria). Interviews with migrants, non-migrants and potential migrants were conducted between May and September 2022 in Ghana and between June and October 2022 in Nigeria. For this study, we focused specifically on the responses of migrants. The questionnaire gathered information on socio-economic status, migration histories, and perceptions of climate change, among other factors.
In this study we used responses to the question: “What are the main reasons why you left your most recent place of origin/last destination?,” allowing multiple answers for migration motivations. This was combined with the question” Where was your place of origin before migrating to this current destination?” which provides information about the respondents’ places of origin (see Supplementary Tables S4, S5). For Ghana, 1,265 interviews were available while for Nigeria, 472 interviews were considered.
The spatial patterns of hazard and vulnerability scores was compared with the migrants’ actual motivation. We calculated the proportion of respondents identifying environmental factors as the primary reason for migration to compare with the hazard component. For the vulnerability component, we summed the proportion of respondents citing “job opportunities,” “access to markets,” and “education” as their main migration motivations, with “insecurity” also included for Nigeria. For each region (Ghana) or state (Nigeria), we identified the highest hazard and vulnerability scores and plotted them against the normalized motivation scores. This method enabled both visual and quantitative evaluations of how well perceived migration motivations aligned with the calculated risk components. In order to compare the risk scores with actual migration rates, we plotted the current net migration rates for Ghana from the Population and Housing Census (Ghana Statistical Service (GSS), 2023) against the maximum risk scores per region. As this data was not available for Nigeria, we have included the outcome for Ghana in Supplementary Figure S9.
A total of 36 individual factors were identified during the expert consultation, of which 24 are included in the analysis due to data availability (Figure 3). Among these, nine factors related to hazards were identified. The Ghanaian experts considered ‘Decrease in average rainfall’ to be similar to drought, leading to the inclusion of only the drought indicator for Ghana. High rainfall variability in Ghana and high rainfall events in Nigeria were considered to have a highest impact on the agriculture-dependent population; in the present and in the future. For vulnerability factors, ‘conflict prone areas’ was mentioned only by the Nigerian experts, while ‘limited preparedness for emergencies’ was only highlighted for Ghana. Conflict is seen as having the greatest impact on the decision to migrate in Nigeria at present and in future, while in Ghana the reliance on agriculture is attributed to a high vulnerability. In Nigeria, people living in coastal and flood-prone areas are expected to be more exposed in the future, while in Ghana, people living in rural and arid areas are expected to face higher levels of exposure.
For reasons of comprehensibility, the results are discussed at administrative level 1 (regional level for Ghana, Figure 6, and state level for Nigeria, Figure 7), although they have been visualized at administrative level 2 (district level for Ghana and LGA level for Nigeria). The highest hazard scores (≥0.6) in the current assessment are observed in districts located within the Upper East, Upper West, Northern East, and Northern Region. In contrast, the lowest hazard scores are concentrated in the central regions, including Ashanti, Eastern, and Central Region. Overall, hazard scores are predicted to increase across all districts in the future, except in some districts at the coast. The greatest increase is expected in the central regions, attributed to an increase of consecutive dry days and heavy rainfall events as well as a later onset of the rainy season. Highest vulnerability scores are observed in the Northern, Northern East, Savannah and Bono North regions, with values above 0.7, reflecting a high degree of negative impact of pre-existing adverse socio-economic conditions and low adaptive capacity of people. Factors contributing to this high vulnerability include a large agricultural workforce, limited access to education, and unfavorable soil conditions, specifically low organic carbon content. Conversely, the Greater Accra and Ashanti Regions exhibit the lowest vulnerability, or, more specifically, the highest adaptive capacity, due to better access to education and the presence of microfinance institutions. While most of the input data for both present and future vulnerability scenarios remain consistent, changes in the weighting of variables contribute to a shift in vulnerability patterns. Although the future vulnerability is distributed in a similar way to the current situation, a closer look at the differences reveals an upward trend, especially in the central regions. This is attributed to increased rural population.
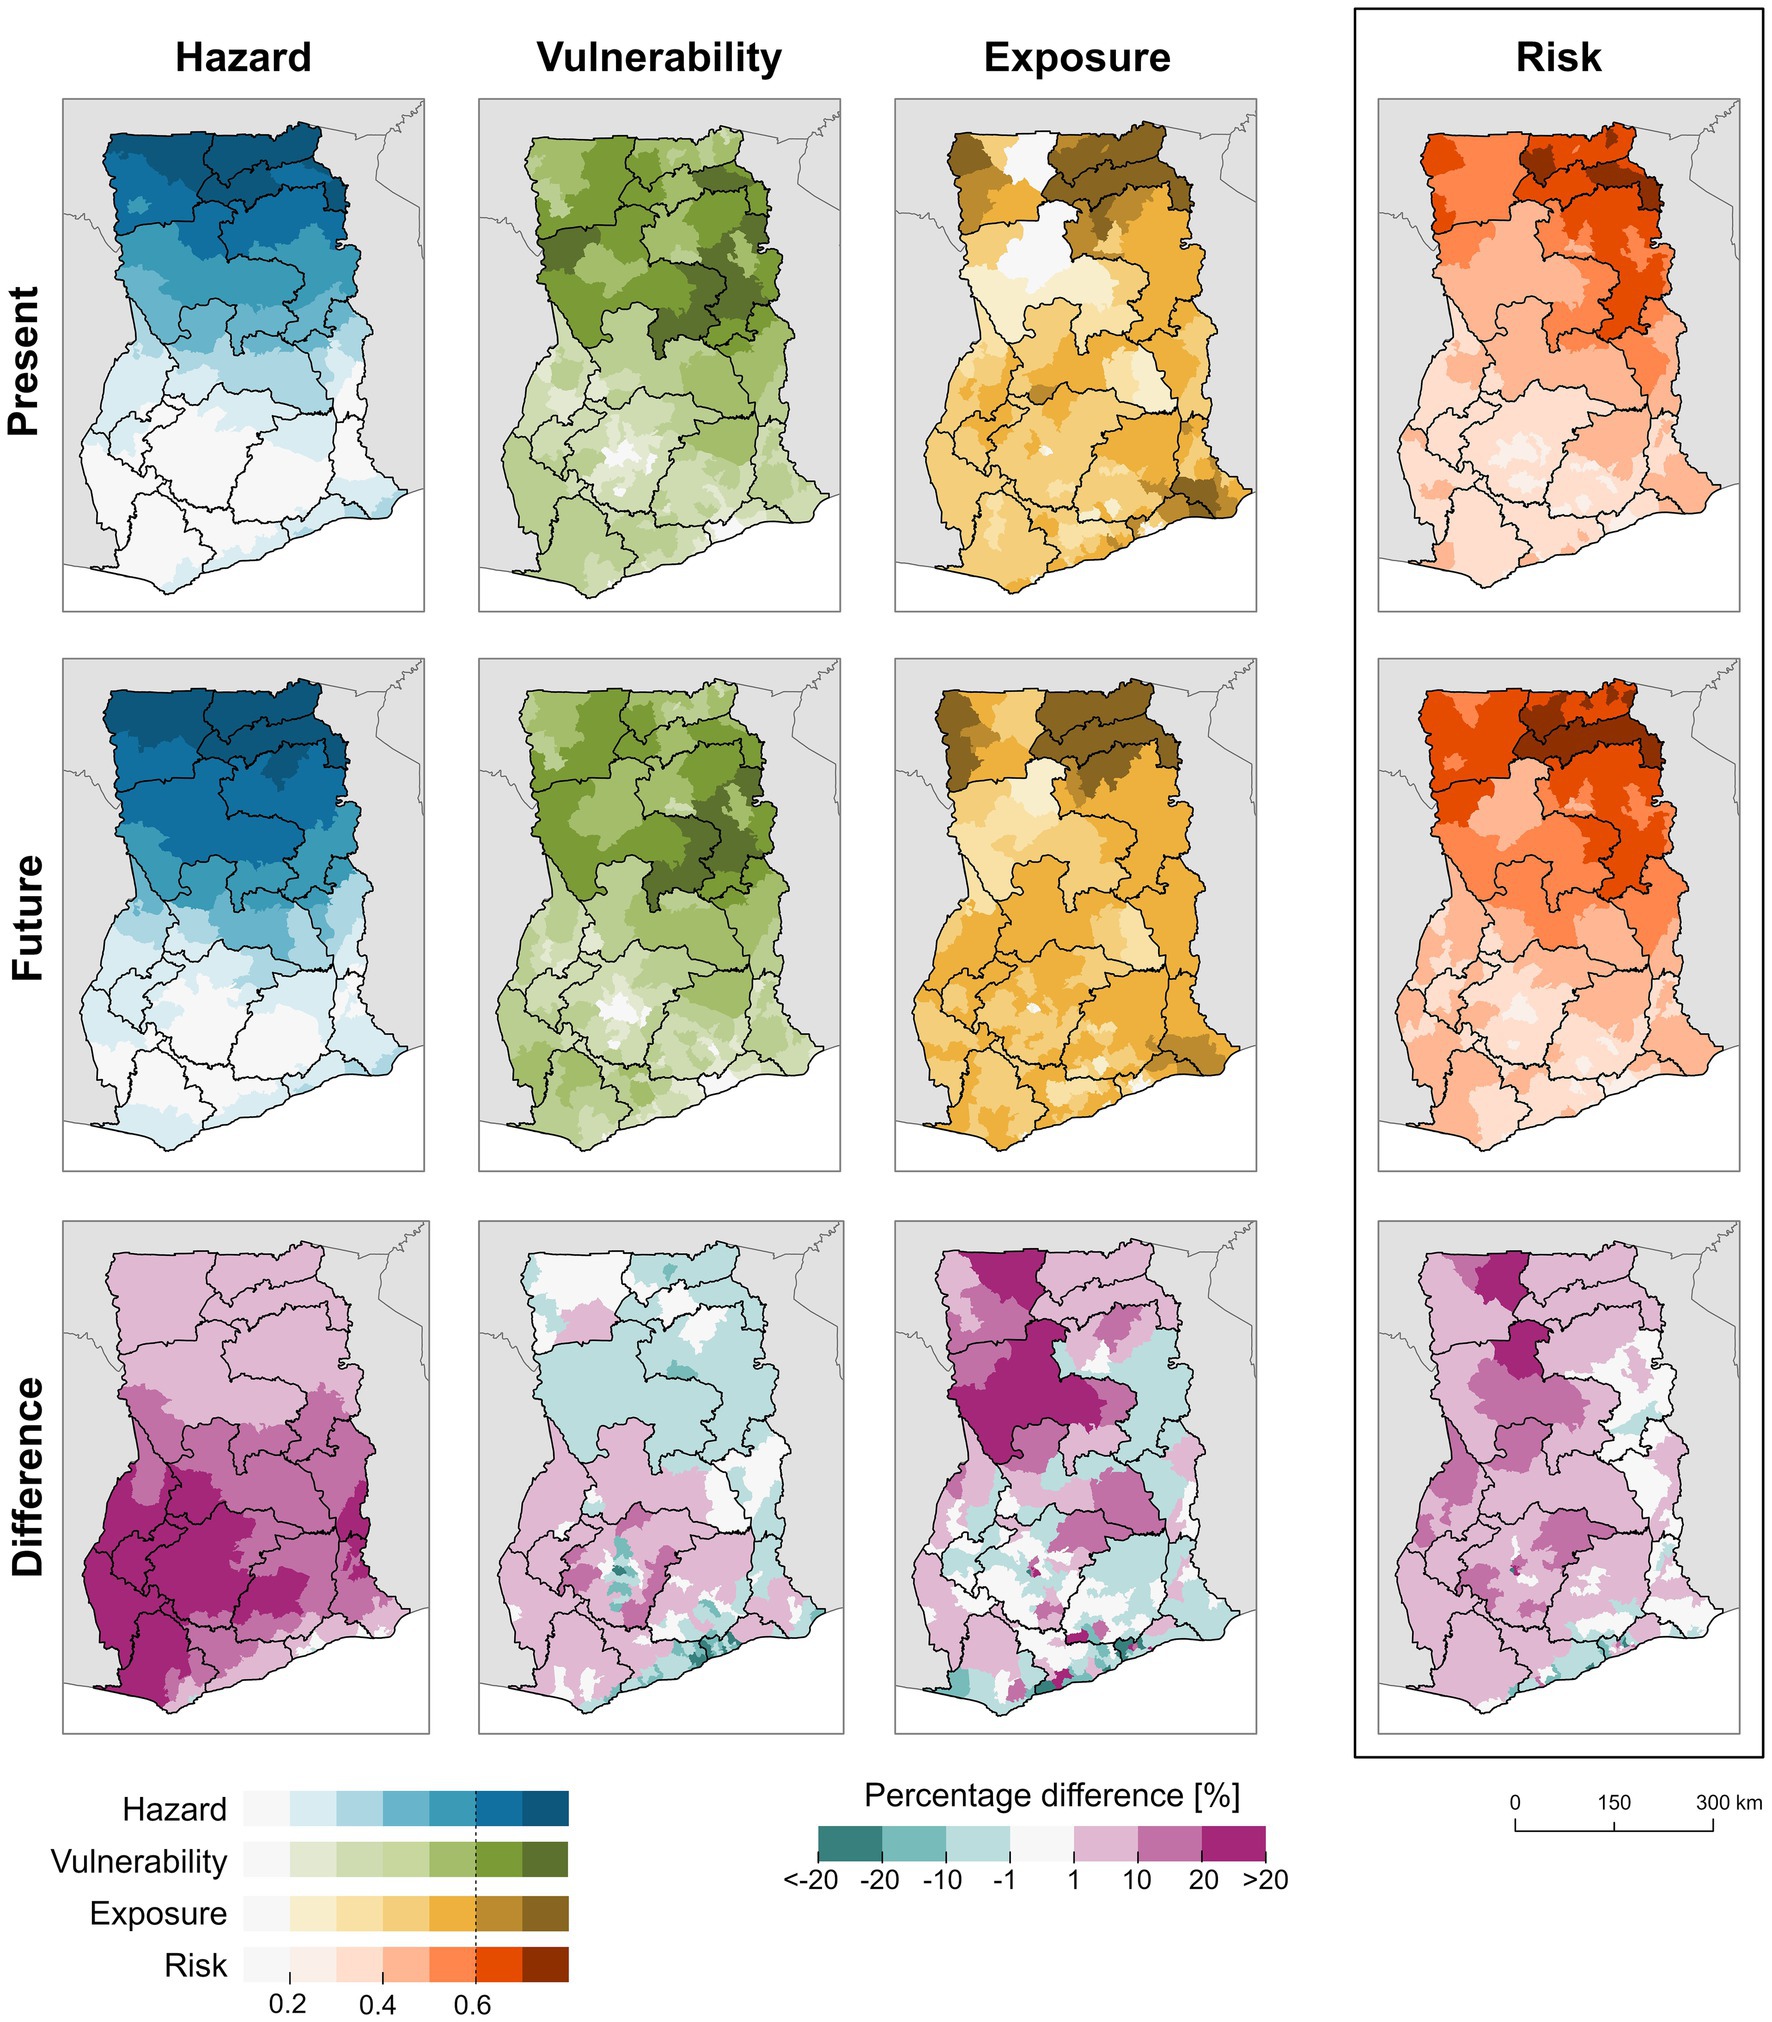
Figure 6. Risk assessment for Ghana. The risk map (right side and red map) shows the combination of the hazard, vulnerability and exposure maps. The darker the colors the higher the risk score.
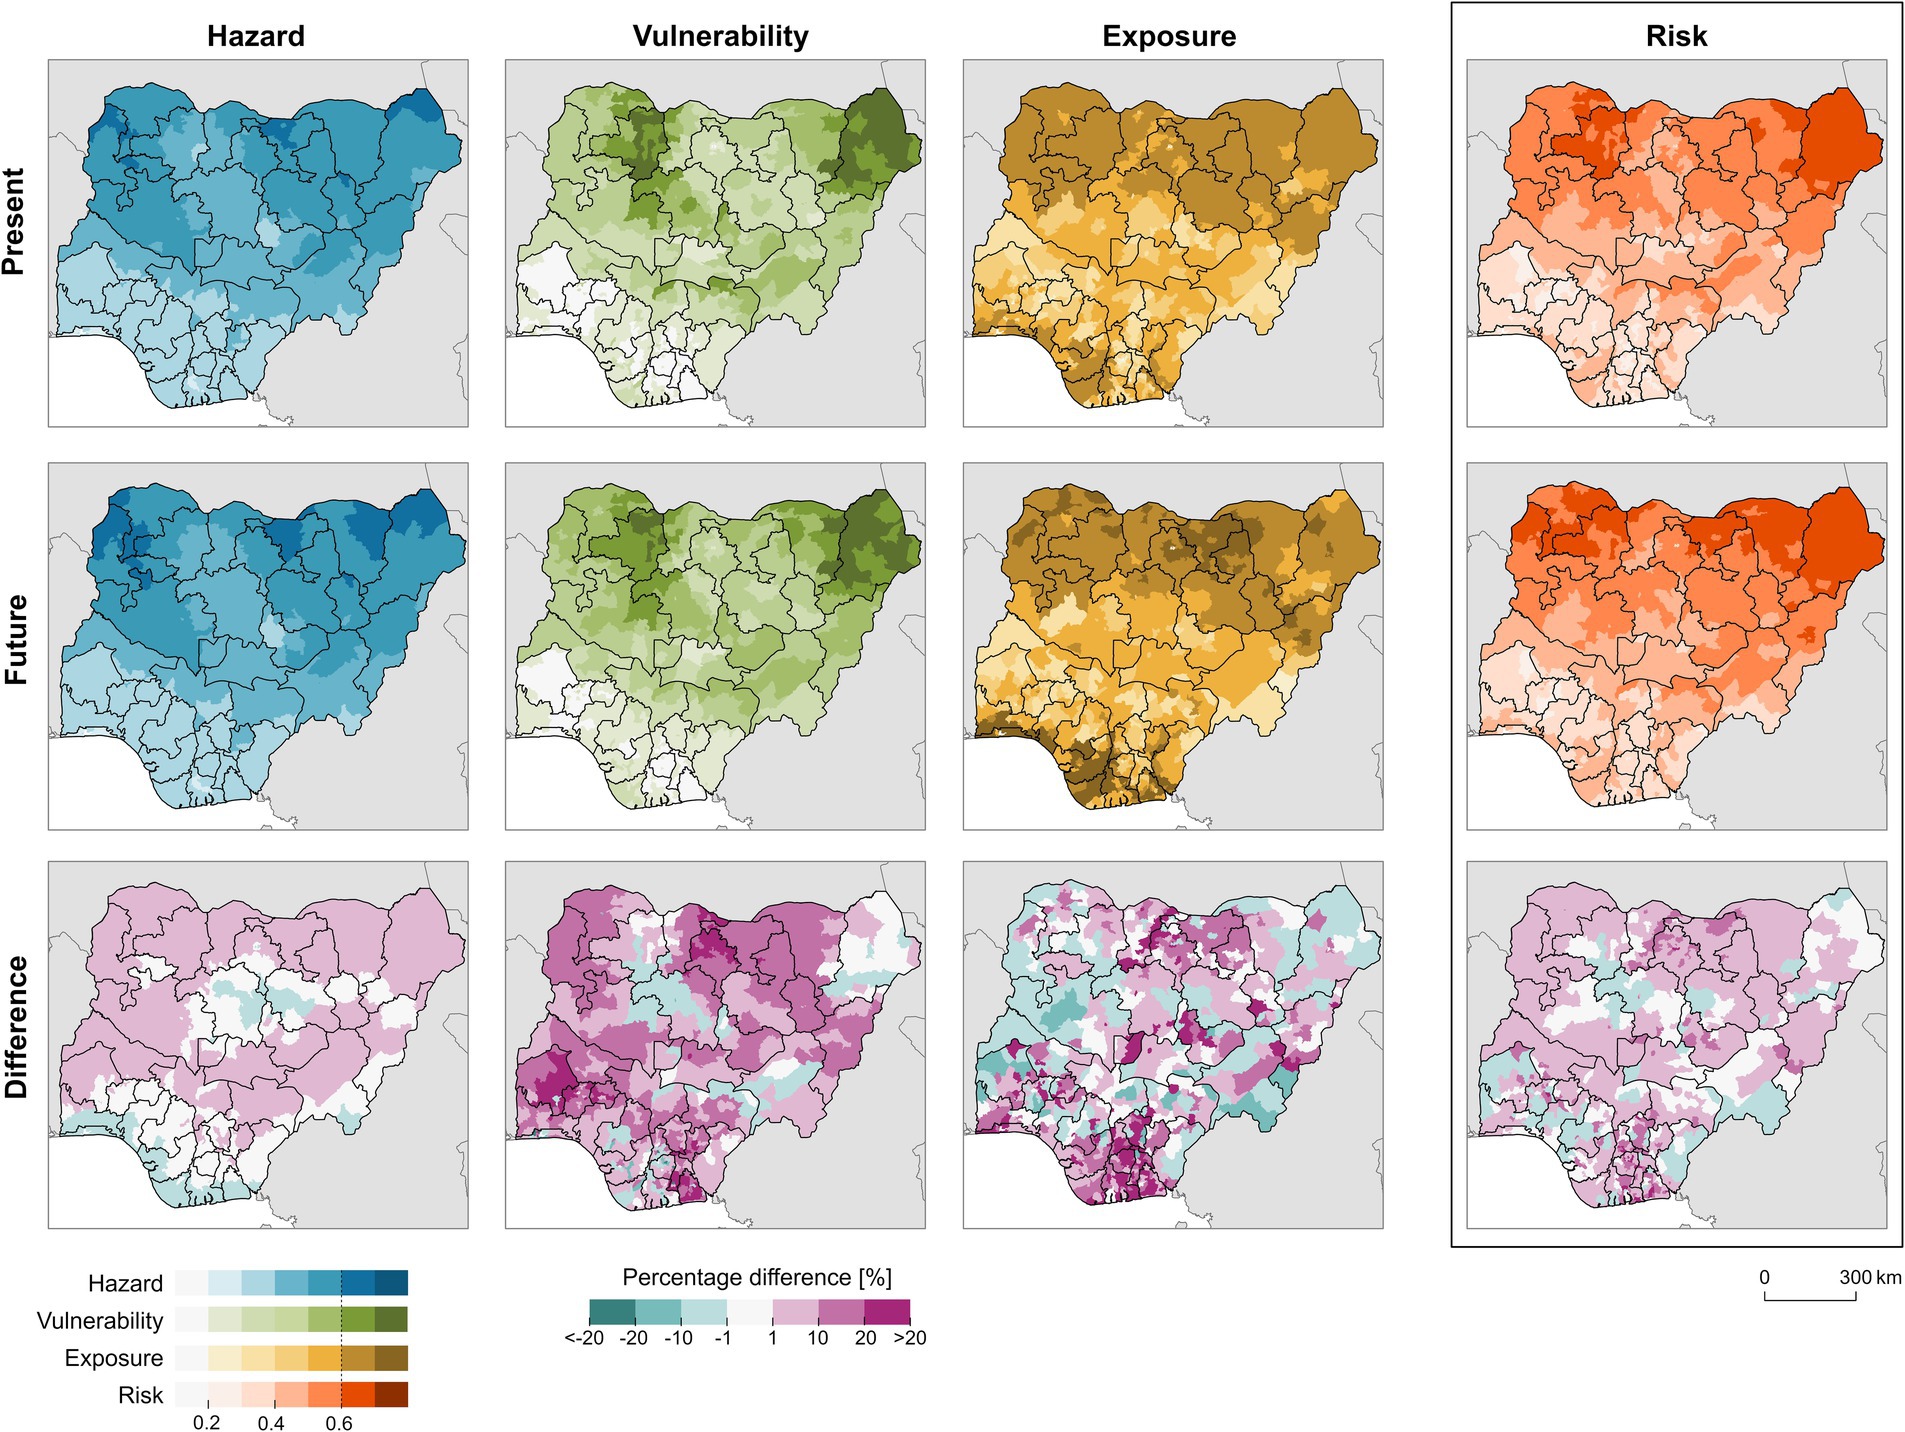
Figure 7. Risk assessment for Nigeria. The risk map (right side and red map) shows the combination of the hazard, vulnerability and exposure maps. The darker the colors the higher the risk score.
Exposure is most pronounced in arid and rural areas, resulting to highest exposure levels in northern Ghana. These regions have a more arid climate and a higher proportion of arable land, which contributes to their higher exposure levels. Low exposure in the Savannah region is attributed to the low population distribution. While exposure in the northern regions is increasing, some coastal districts are experiencing a decline in exposure due to urban expansion, as urban areas are classified as less exposed compared to rural regions. An analysis of the percentage of difference in the population between 2020 and 2050 for Ghana and Nigeria (see Supplementary Figure S8) reveals a notable population increase in the central and southern regions of Ghana, particularly around districts that are already urbanized. In northern regions where an increase in risk has been calculated, the percentage difference is not as high as in the rest of the country, but still within a 20–40% range.
Finally, the risk component shows the combination of all three components, indicating high risk scores in the northern regions of Ghana, especially in the Upper East and Northern East Region. Those regions maintain their high-risk status in the future, while some districts within these regions are experiencing even higher scores. Risk scores are increasing in the majority of the regions, especially in the Upper West and Savannah regions.
In Nigeria, there is, like in Ghana, a north–south gradient in hazard scores, with generally higher scores in the northern regions compared to the south (Figure 7). In the present scenario, Sokoto, Kebbi and Borno states display the highest hazard scores, which are projected to increase due to higher temperature and more heavy rainfall events (see Supplementary Figure S3). Both factors received a high weighting in the future by the experts. Some states in Nigeria show a low decrease in hazard scores in future. The observed decline in the map of difference for hazard in parts of the Sudano-Sahelian Zone can be attributed to the relatively low number of hot days and an accompanying lower increase, in comparison to other regions of the country. The relatively low values observed along the coast can be attributed to the fact that temperatures do not rise as high, and heavy rainfall events do not increase as much, as they do in the northern regions. Additionally, these areas typically experience higher precipitation levels than the northern regions, which are expected to increase slightly in the future. High vulnerability scores are most pronounced in Borno and Zamfara, with Borno being particularly affected by a high number of armed conflicts—and being a factor of socio-economic sensitivity. An increase in vulnerability is predominantly observed in the northern states, while the reduction in Borno’s vulnerability is primarily attributed to a lower weighting of conflicts for the future by the experts compared to the present (see Figure 3). In general, the majority of vulnerability factors are assigned with a higher weight, which leads to an overall increase of vulnerability scores in the future scenario. The northern regions exhibit the highest levels of exposure, which can be attributed to the high proportion of people living in arid or semi-arid areas and of population being engaged in agricultural activities. Furthermore, elevated levels of exposure are observed in certain coastal states like Lagos, Delta or Bayelsa, a pattern that is anticipated to intensify in the future due to population growth. On the contrary, in the central and northern part of Nigeria, the exposure score is predicted to decrease slightly. In Nigeria, the population growth is generally higher than in Ghana (see Supplementary Figure S8). It is notable that the north is experiencing a particularly strong increase in population, e.g., in Kano and Katsina state. This growth is accompanied by an overall increase in risk in these regions, driven by an increase in hazards and vulnerability. By 2050, the population of some southern LGAs is expected to double, contributing to higher exposure scores as more people inhabit areas with elevated exposure risks. The states with high overall risk in both the present and future remain largely unchanged, with further intensification in Yobe and Kebbi State. In contrast, some states in the southern part of Nigeria, such as Oyo, Ondo, and Cross River, are expected to experience a decrease in risk.
The relationship between present hazard and vulnerability scores and migrants’ motivations is illustrated in Figures 8, 9 for Ghana and Nigeria, respectively. It is important to note that, overall, relatively few migrants cited environmental factors as their primary reason for migration. In Ghana, the highest percentage of respondents citing environmental reasons within any region was 14.5%, while in Nigeria, the highest percentage within a state was 33.3%. In contrast, socio-economic factors related to vulnerability were cited more frequently, with the highest percentage being 74.5% in Ghana and 100% for Nigeria. This analysis aims to determine whether regions or states where migrants more frequently cited environmental or vulnerability related factors correspond to those with higher hazard or vulnerability scores.
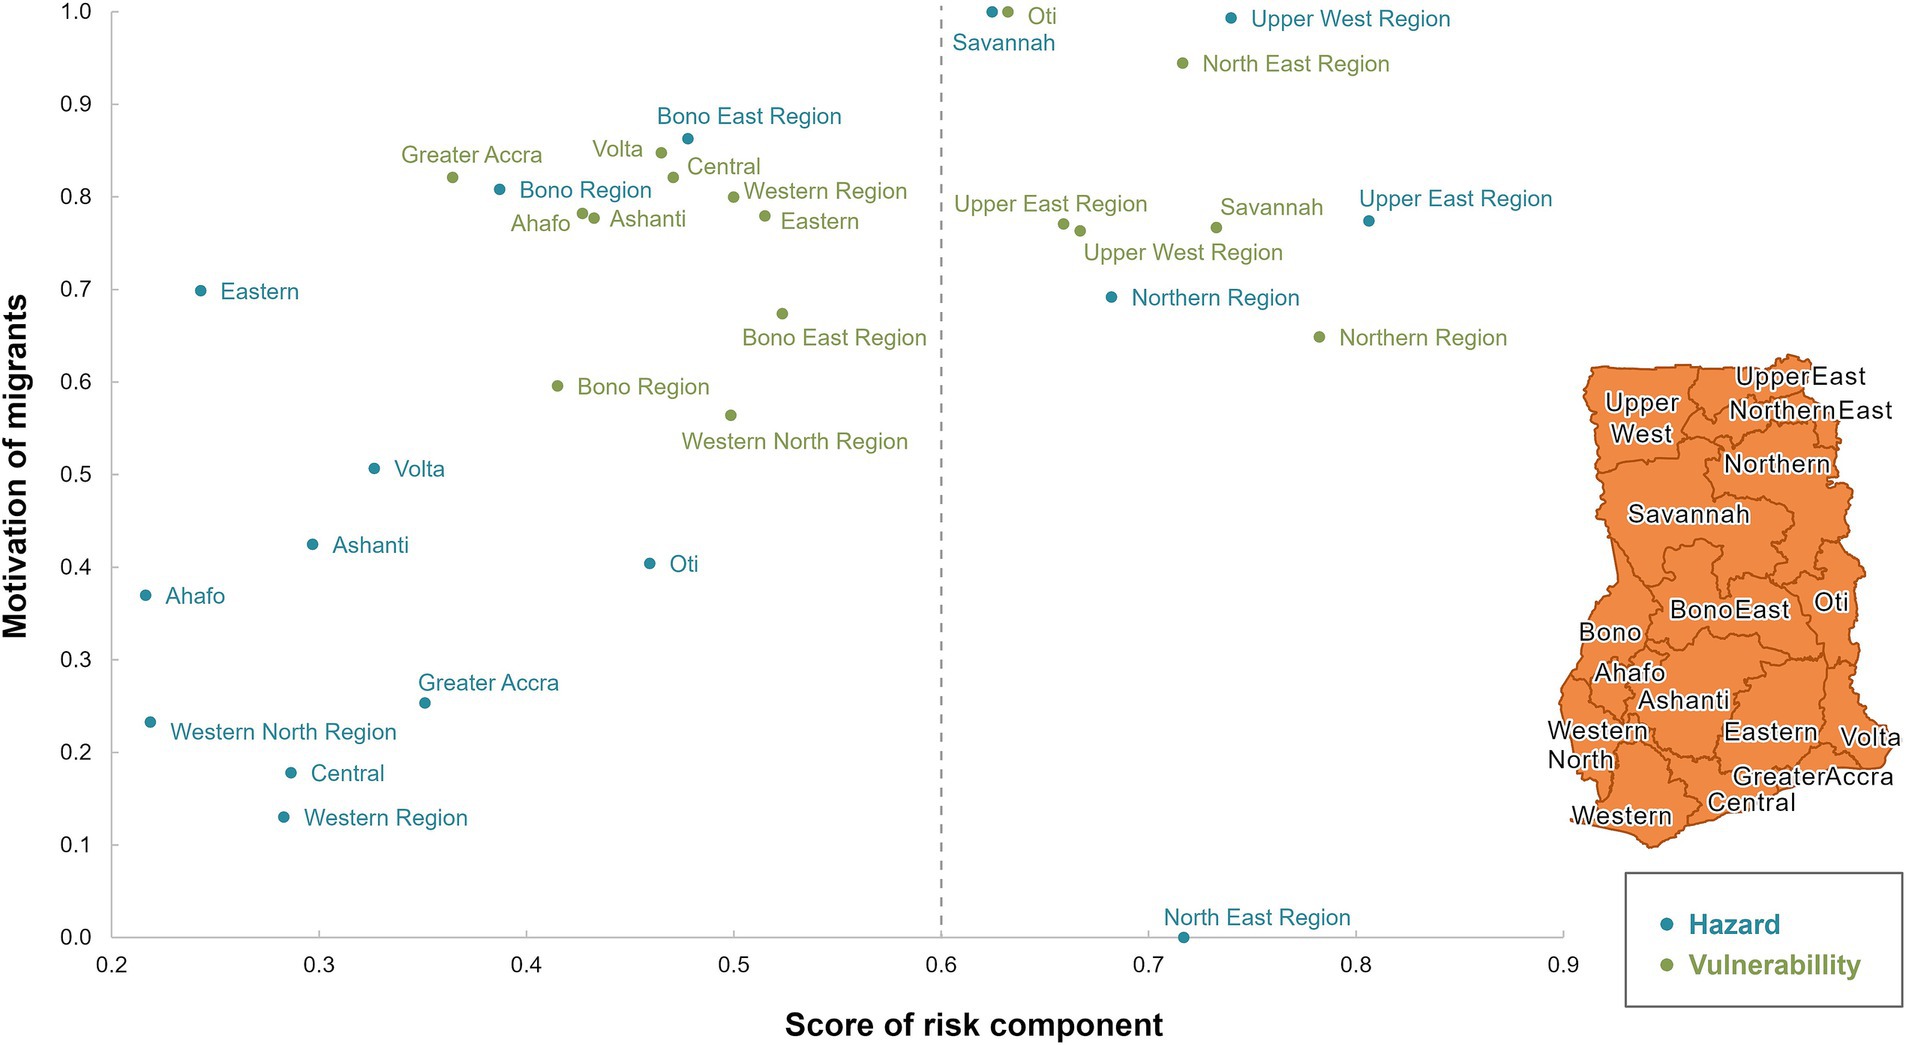
Figure 8. Comparison of score of risk component and the migrants’ motivation for Ghana. Dashed line marks critical threshold of 0.6. Blue color = motivation related to hazard, green color = motivation related to vulnerability. A map of Ghana is included for better localization of the regions.
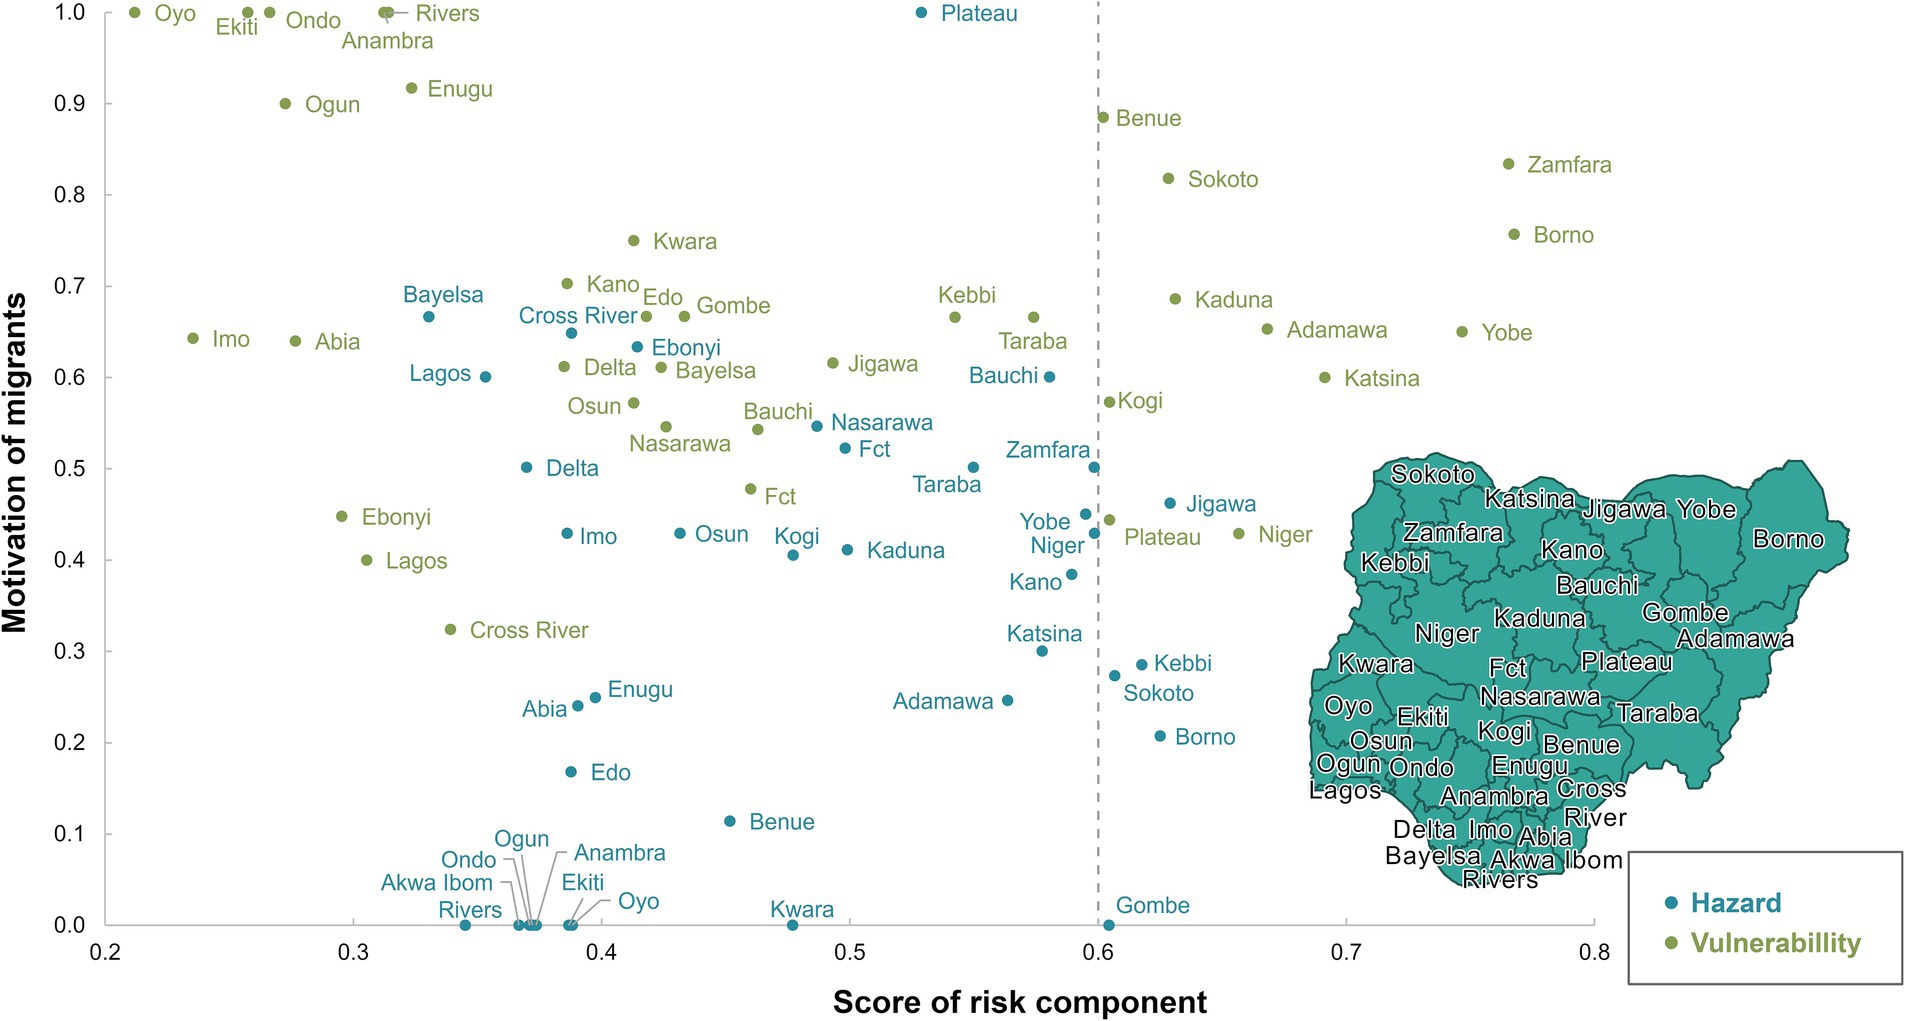
Figure 9. Comparison of score of risk component and the migrants’ motivation for Nigeria. Dashed line marks critical threshold of 0.6. Blue color = motivation related to hazard, green color = motivation related to vulnerability. A map of Nigeria is included for better localization of the states.
In Ghana, migrants more frequently identified environmental factors as a primary reason for relocating from regions with high hazard scores (≥0.6). Conversely, migrants from regions with lower hazard scores less often attributed their migration to environmental conditions. Socio-economic factors are prevailing reasons for migration in regions characterized by both high vulnerability and hazard scores. This suggests that economic factors often play a crucial role in migration decisions, especially in regions facing environmental challenges.
In the case of Nigeria (Figure 9), states with high hazard scores, such as Borno, Sokoto, Zamfara, and Yobe, environmental factors did not exhibit a higher frequency of migrants citing environmental factors as their reason for migration. Instead, socio-economic factors were identified as key motivations for migration. In states such as Borno and Sokoto, where both high vulnerability scores and high hazard scores were calculated, socio-economic factors were identified as the primary motivation for migration, rather than environmental factors. This indicates that environmental-related stressors may not be perceived as direct threats by the population, but rather as contributors to deteriorating economic conditions, which subsequently drive migration. The indirect impact of environmental changes on livelihoods likely results in people prioritizing economic motivations over environmental ones when explaining their migration decisions. This underscores the complex interplay between environmental stressors and socio-economic conditions in shaping migration patterns.
The risk assessment framework is able to account for the interplay of environmentally related hazards, vulnerability (especially socio-ecological sensitivity and low adaptive capacity) together with exposed population groups. The study intends to quantify the impact of external factors influencing rural out-migration by integrating spatial data in order to identify areas where migration is more likely to occur. However, it is important to acknowledge that numerical values of thresholds are not absolute reflections of reality. Migration decisions may occur in regions independently from counted data or numerical thresholds, while some individuals may choose to stay in areas even though these areas are scientifically classified as high-risk areas. While adverse climate events can create conditions that lead individuals or communities to consider relocation, their decision to stay is often influenced by a range of factors. For example, many vulnerable communities use local coping strategies, such as diversifying livelihoods or adapting agricultural practices, to address climate-related challenges and reduce the need to migrate (van der Geest and Warner, 2015). In addition, strong community ties and deep cultural attachments may support a preference to remain in place despite certain risks (Kutor et al., 2025). Nevertheless, the method provides a systematic approach to linking spatial datasets and projecting shifts between current and future migration patterns. An increase in the risk score does not necessarily indicate that a greater number of people will migrate from these regions in the near future. Rather, it suggests that living conditions in these regions are deteriorating due to factors such as increased rainfall variability or greater resource pressure from a growing rural population, which is further compounded by existing socio-economic vulnerabilities. Nevertheless, this could also indicate that rural-to-urban migration may intensify in the future, placing greater strain on urban areas.
The results of our analysis for the present state are largely consistent with statements from migration studies, which indicate that areas in northern Nigeria and Ghana are the primary areas of internal out-migration (Alarima, 2019; Ango et al., 2014; GSS, 2023; Schürmann et al., 2024; van der Geest, 2011). Main destinations for internal migrants in Nigeria are often economically vibrant states such as Lagos and the Federal Capital Territory (FCT) around Abuja, which attract people seeking better job opportunities and living conditions (UN, 2023). For most LGAs in Lagos State, we computed an increase in vulnerability and exposure scores due to the growing rural and urban population, as well as the state’s coastal location, which will be more vulnerable to floods and rising sea level in the future (Adegun, 2023). Most internal migrants in Ghana move to Ashanti or Greater Accra Region (GSS, 2023), both of which have low risk scores. However, it should be noted that this study does not account for coastal flooding and erosion, which are expected to increase in the future and could impact coastal cities like Lagos or Accra (Rigaud et al., 2021).
The ongoing instability in northern Nigeria due to terrorist activities poses an additional layer of complexity. Although more rainfall is projected for the Sahel zone (Almazroui et al., 2020; Stanzel et al., 2018; Weber et al., 2023), which could improve yields for certain crops as cassava, groundnuts or rice, but at the same time potentially decrease yields for maize and millet (Tomalka et al., 2021). Even with potentially better agricultural conditions in the Sahel, the socio-political factors may continue to drive vulnerability and therefore rural out-migration. Studies have shown a correlation between increased rainfall and reduced conflict in communities. However, as rainfall becomes more variable and adaptation to these changes becomes more difficult, the potential for conflict may increase (Coulibaly and Managi, 2022; Nordkvelle et al., 2017). In addition, an increase of precipitation can lead to higher malaria transmission due to more occasions of open, stagnant water and higher moisture (Jambou et al., 2022). More frequent hot days and greater variability in precipitation challenges for water management and agricultural stability (Berger et al., 2021; Röhrig et al., 2019), exacerbating existing vulnerabilities in already economically weak regions in northern Ghana and Nigeria, which could influence migration dynamics. However, it is not possible in this study to make any statements regarding a potential improvement or deterioration in socio-economic sensitivity or adaptive capacity in future. An improvement of the adaptive capacity or reduction of socio-economic sensitivity could lower future risk values in our assessment. Furthermore, different weightings are applied to the future components which also affect the risk score. This highlights the inherent uncertainty in predicting local migration patterns (de Valk et al., 2022).
Nonetheless, it is important to acknowledge that individual aspirations and capabilities influence migrants’ decisions, shaping their responses to environmental and socio-economic factors (Adger et al., 2024; De Haas, 2021). In addition to these personal drivers, the role of government policies is also critical, as highlighted by the experts in Nigeria. Despite its potential to improve the lives of vulnerable populations, few West African governments incorporate migration into climate adaptation plans. Due to limited capacity to manage urban growth and infrastructure, policies often discourage rural-to-urban migration (Farrell, 2018; Teye and Nikoi, 2022). In order to address the challenges of rural–urban migration, policies should aim to create rural employment opportunities and reduce pressure on urban infrastructure. Actions to promote sustainable rural development and thus sustainable rural–rural and urban–rural migration should focus on agricultural resilience, land accessibility and diversification of the rural economy sector. Governments could expand sustainable agriculture programs to provide farmers with climate-smart techniques, access to credit and improved irrigation systems to reduce the current and future risks associated with climate-related hazards and socio-economic vulnerabilities.
The factors identified as highly relevant by the experts, including ‘high rainfall variability’, ‘drought’, ‘dependence on agriculture’, ‘limited access to microcredit’ in Ghana, and ‘heavy rainfall’ and ‘conflict’ in Nigeria, are also identified in recent literature as important determinants of migration decisions (Teye and Nikoi, 2022). These stressors are of particular importance in agricultural communities where livelihoods are closely intertwined with environmental conditions. For example, Rigaud et al. (2021) demonstrate that climate-induced changes, including variability in rainfall and increased drought frequency, play a direct role in migration, as these conditions lead to a reduction in agricultural output and economic instability. Additionally, heavy rainfall events and subsequent flooding have been demonstrated to displace large populations, thereby highlighting the critical role of extreme weather events in migration decisions in Nigeria (Ibrahim and Mensah, 2022; Rigaud et al., 2021).
Although environmental factors are often highlighted as drivers of migration, it is essential to recognize their interaction with pre-existing socio-economic vulnerabilities. Kaczan and Orgill-Meyer (2020) conducted a systematic review and propose that environmental factors should be regarded as contextual rather than primary drivers of migration. This is also evident in our analysis, which shows that in Ghana the reasons for environmental migration are consistent with the characteristics of the region’s geography, suggesting that external factors such as environmental hazards may influence the decision to migrate. In Nigeria, by contrast, socio-economic factors appear to dominate, even in areas that are highly vulnerable to environmental hazards.
Conflicts in Nigeria not only drive rural–urban migration but also exacerbate food insecurity (Ayuba et al., 2023), which is also identified by the experts as having major influence on migration decisions in the future. In addition, financial capacity plays a crucial role in migration decisions. Research indicates that it is often wealthier households that have the means to migrate in response to climate change (Duijndam et al., 2022; Hirvonen, 2016; Kaczan and Orgill-Meyer, 2020). Limited access to microcredit, e.g., to buy necessary inputs for agricultural production on loan basis, further constrains adaptive capacities (Twumasi et al., 2020).
Regarding different population groups, rural populations, particularly farmers, are more exposed to these stressors than urban populations. This is undermined by the ongoing trend of rural–urban migration in Ghana and Nigeria (Abbass, 2012; Dick and Schraven, 2021). This migration trend is not only a response to immediate environmental stressors but also a reflection of deeper structural inequalities in access to resources and opportunities between rural and urban areas.
In addition to these structural factors, historical gender roles have influenced migration patterns in West Africa, with men more likely to migrate for employment opportunities and women more likely to migrate for family reunification or marriage. However, this trend is changing as more women are choosing to migrate independently (Setrana and Kleist, 2022). Age is also an important factor in migration decisions, with younger people generally more likely to migrate in search of better education and employment opportunities (Alarima, 2019; Ango et al., 2014). Furthermore, historical pre-colonial trade networks, ethnic ties and shared official languages continue to shape current migration cultures and cross-border migration patterns (Teye, 2022).
The presented framework integrates the aforementioned environmental factors, socio-economic conditions, and the vulnerability of exposed population groups, addressing the complex and ongoing debate about the interplay between environmental stressors and socio-economic vulnerabilities in shaping migration patterns, particularly in rural areas. This approach enables a more nuanced analysis of migration dynamics and helps identifying areas where multiple risk factors coincide.
The study primarily focuses on external factors, such as environmental hazards, socio-economic vulnerabilities, and population exposure, with only limited consideration of individual perceptions. It does not account for personal factors such as social capital or cultural attitudes. Additionally, a more differentiated analysis of especially highly exposed demographic groups, including women and youth, could not be conducted due to the lack of data. This omission may underrepresent the social dynamics that influence migration decisions. Besides, the study focuses on rural migration because many factors, particularly those related to environmental conditions, are most relevant to rural populations dependent on agriculture. As such, migration from urban areas, which is also prevalent in Ghana and Nigeria, was not examined in detail.
The weighting process with experts introduces a certain degree of bias, reflecting the subjective judgments and potential limitations of the experts’ perspectives even though expert consultation proves a higher reliability in statements than nonexperts (Han and Dunning, 2024). Such bias may influence the relative importance assigned to different indicators, potentially skewing the results toward certain vulnerabilities while underrepresenting others. Furthermore, the identification of factors and their proxy indicators have an impact on the results. However, the weights assigned mainly correspond to recent literature (see Section 4.1) and the selection of proxy indicators was restricted to the data available.
The normalization of data, required to integrate multiple datasets with varying scales, introduces an additional layer of uncertainty. Different normalization techniques, or the use of alternative quantiles to address outliers, particularly for vulnerability factors, could alter the data range and subsequently influence the overall results. Conversely, normalization facilitates interpretation and enables a wide range of data to be combined. In particular, the use of global minimum and maximum values permits the illustration of changes between the present and the future.
For the estimations of the future risk component, the study relies on climate and population projections under the RCP4.5 scenario, which can vary depending on the models and assumptions used. In particular, rainfall projections are more challenging to model accurately than, for instance, temperature data (Tomalka et al., 2021). To reduce the degree of uncertainty of the climate projections, ensemble means were employed. Although climate models predict increased rainfall in certain regions, particularly in the Sahel of Nigeria, uncertainty remains regarding the distribution of this precipitation throughout the year and its impact on rain-fed agriculture. It is also evident that the selected CMIP6 models underestimate heavy rainfall events and overestimate consecutive dry days in Ghana. Conversely, they demonstrate comparable patterns for the climate indices in Nigeria. On the other hand, the CMIP6 models seem to be able to estimate annual precipitation and extreme temperatures. Additionally, population data for Nigeria are highly uncertain, as there has not been an official population census for almost two decades.
The risk framework employed in this study is a simplified representation of the complex interactions between environmental hazards, vulnerabilities, and exposure. While simplification is necessary for modeling and analysis, it also means that certain feedback loops and dynamic interactions are not fully captured. To illustrate, the framework does not incorporate potential feedback mechanisms where increased migration could either mitigate or exacerbate local vulnerabilities, according to the context. A distinction between different types of migration may also be crucial. This is particularly true for Ghana and Nigeria, where temporal and seasonal migration is common alongside permanent migration. To identify potentially vulnerable areas, we used the responses of individuals who had already left their place of origin, without further distinguishing between different types. This could be an important consideration for more in-depth analysis. Furthermore, although adaptive capacity is included as a component of vulnerability, the framework may not fully represent the range of adaptive strategies or the potential for communities to develop new adaptive capacities in response to changing conditions.
The IPCC risk assessment framework was used in combination with spatial datasets to reflect current and potentially future migration patterns in Ghana and Nigeria, particularly for the rural, agriculture-dependent population. We have identified areas in northern Ghana and northern Nigeria in which populations are more likely to migrate due to the combined effects of high hazard, vulnerability, and exposure. Areas identified with an upward trend in risk scores reflect deteriorating livelihood conditions, which are likely to further exacerbate rural out-migration, as individuals search for ways to cope with increasing environmental and socio-economic pressures. However, due to unpredictable circumstances and individual decisions, migration might also occur in low risk areas and some people may (need to) stay in high-risk areas. In the northern regions of Ghana, there is a link between high estimated hazard scores and migrants citing environmental factors as the main reason for their migration. Whereas in Nigeria, socio-economic factors dominate, even in areas that are particularly vulnerable to environmental hazards. This suggests that the aspiration to find better employment and livelihoods is shaped by a complex range of personal and external factors, many of which are difficult to measure and not fully captured by the framework. This highlights the importance of considering the broader socio-economic context and to be more specific on exposed groups. However, it is difficult to assess the spatial distribution of, e.g., exposed women or the youth for a whole country at a local level. Additionally, projections of future climate change and related impacts remain highly uncertain, making it difficult to reliably predict future scenarios. Despite these limitations, this research contributes to a deeper understanding of how and where migration due to multiple factors might occur, providing valuable insights for policymakers seeking to develop targeted interventions that enhance local adaptive capacity and support sustainable migration pathways.
The original contributions presented in the study are included in the article/Supplementary material, further inquiries can be directed to the corresponding author.
The studies involving humans were approved by the Directorate for Research Innovation and Development (DRID), Federal University of Technology-Minna, Nigeria and the Institutional Review Board, University of Cape Coast (UCCIRB), Ghana. The studies were conducted in accordance with the local legislation and institutional requirements. The participants provided their written informed consent to participate in this study.
AS: Conceptualization, Data curation, Formal analysis, Investigation, Methodology, Software, Validation, Visualization, Writing – original draft, Writing – review & editing. MT: Methodology, Supervision, Writing – original draft, Writing – review & editing. JK: Methodology, Supervision, Writing – original draft, Writing – review & editing. JI: Data curation, Writing – original draft, Writing – review & editing. BN: Validation, Writing – original draft, Writing – review & editing. AO: Validation, Writing – original draft, Writing – review & editing. CC: Formal analysis, Resources, Supervision, Writing – original draft, Writing – review & editing.
The author(s) declare that financial support was received for the research, authorship, and/or publication of this article. This research was conducted in the context of the project “WASCAL WRAP 2.0-MIGRAWARE,” funded by the German Federal Ministry of Education and Research (BMBF) with grant number 01LG2082A. In addition, we acknowledge the financial support of the Open Access Publication Fund of the Martin-Luther-University Halle-Wittenberg.
We would like to thank all the experts interviewed for their valuable time and for sharing their experiences. We are also very thankful to the research teams at the University of Cape Coast (Ghana) and the Federal University of Technology Minna (Nigeria) for providing us with data from their national surveys with migrants. Finally, we would like to thank the migrants who participated in the surveys.
The authors declare that the research was conducted in the absence of any commercial or financial relationships that could be construed as a potential conflict of interest.
The authors declare that no Gen AI was used in the creation of this manuscript.
All claims expressed in this article are solely those of the authors and do not necessarily represent those of their affiliated organizations, or those of the publisher, the editors and the reviewers. Any product that may be evaluated in this article, or claim that may be made by its manufacturer, is not guaranteed or endorsed by the publisher.
The Supplementary material for this article can be found online at: https://www.frontiersin.org/articles/10.3389/fclim.2025.1516045/full#supplementary-material
Abel, D., Ziegler, K., Gbode, I. E., Weber, T., Ajayi, V. O., Traoré, S. B., et al. (2024). Robustness of climate indices relevant for agriculture in Africa deduced from GCMs and RCMs against reanalysis and gridded observations. Clim. Dyn. 62, 1077–1106. doi: 10.1007/s00382-023-06956-8
Adamo, S. B. (2010). Environmental migration and cities in the context of global environmental change. Curr. Opin. Environ. Sustain. 2, 161–165. doi: 10.1016/j.cosust.2010.06.005
Adegun, O. B. (2023). Flood-related challenges and impacts within coastal informal settlements: a case from LAGOS, NIGERIA. Int. J. Urban Sustain. Develop. 15, 1–13. doi: 10.1080/19463138.2022.2159415
Adger, W. N., Crépin, A.-S., Folke, C., Ospina, D., Chapin, F. S., Segerson, K., et al. (2020). Urbanization, migration, and adaptation to climate change. One Earth 3, 396–399. doi: 10.1016/j.oneear.2020.09.016
Adger, W. N., Fransen, S., Safra de Campos, R., and Clark, W. C. (2024). Migration and sustainable development. Proc. Natl. Acad. Sci. USA 121:e2206193121. doi: 10.1073/pnas.2206193121
Alarima, C. I. (2019). Factors influencing rural-urban migration of youths in Osun state. Nigeria. Agro-Sci. 17:34. doi: 10.4314/as.v17i3.6
Alehile, K. S. (2023). Climate change effects on employment in the Nigeria’s agricultural sector. Chin. J. Urban Environ. Stud. 11. doi: 10.1142/S2345748123500185
Allen, T., Heinrigs, P., and Heo, I. (2018). Agriculture, food and jobs in West Africa: West African papers, N°14. Paris: OECD Publishing.
Almar, R., Stieglitz, T., Addo, K. A., Ba, K., Ondoa, G. A., Bergsma, E. W. J., et al. (2023). Coastal zone changes in West Africa: challenges and opportunities for satellite earth observations. Surv. Geophys. 44, 249–275. doi: 10.1007/s10712-022-09721-4
Almazroui, M., Saeed, F., Saeed, S., Nazrul Islam, M., Ismail, M., Klutse, N. A. B., et al. (2020). Projected change in temperature and precipitation over Africa from CMIP6. Earth Syst. Environ. 4, 455–475. doi: 10.1007/s41748-020-00161-x
Ango, A. K., Ibrahim, S. A., Yakubu, A. A., and Alhaji, A. S. (2014). Impact of youth rural-urban migration on household economy and crop production: a case study of Sokoto metropolitan areas, Sokoto state, North-Western Nigeria. J. Agricul. Extension Rural Develop. 6, 122–131. doi: 10.5897/JAERD2013.0547
Ayodotun, B., Bamba, S., and Adio, A. (2019). Vulnerability assessment of west African countries to climate change and variability. J. Geosci. Environ. Protection 7, 13–15. doi: 10.4236/gep.2019.76002
Ayuba, D., Akinga, A. Y., Okeh, D. U., Ogaya, J. B., Precious, F. K., and Lucero-Prisno, D. E. (2023). Migration and food security in urban Nigeria: the dilemma of the urban poor. Advances in food security and sustainability. 8, 235–265. doi: 10.1016/bs.af2s.2023.08.003
Bendandi, B., and Pauw, P. (2016). “Remittances for adaptation: an ‘alternative source’ of international climate finance?” in Migration, risk management and climate change: Evidence and policy responses. eds. A. Milan, B. Schraven, K. Warner, and N. Cascone, vol. 6 (Cham: Springer International Publishing), 195–211.
Benjamin Obe, O., Morakinyo, T. E., and Mills, G. (2023). Assessing heat risk in a sub-saharan African humid city, Lagos, Nigeria, using numerical modelling and open-source geospatial socio-demographic datasets. City Environ. Interactions 20:100128. doi: 10.1016/j.cacint.2023.100128
Bentsen, M., Oliviè, D. J. L., Seland, Y., Toniazzo, T., Gjermundsen, A., Graff, L. S., et al. (2019). NCC NorESM2-mm model output prepared for CMIP6 CMIP. Earth System Grid Federation. doi: 10.22033/ESGF/CMIP6.506
Berger, J., Zimmer, A., Udechukwu, S., Plinke, C., and Lange, S. (2021). Climate Risk Profile. Nigeria: ifo Institute for Economic Research and Climate Analytics gGmbH.
Borderon, M., Sakdapolrak, P., Muttarak, R., Kebede, E., Pagogna, R., and Sporer, E. (2019). Migration influenced by environmental change in Africa: a systematic review of empirical evidence. Demogr. Res. 41, 491–544. doi: 10.4054/DemRes.2019.41.18
Burton, C., Yuan, F., Ee-Faye, C., Halabisky, M., Ongo, D., Mar, F., et al. (2022). Co-production of a 10-m cropland extent map for continental Africa using Sentinel-2, cloud computing, and the open-data-cube. ESS Open Archive. doi: 10.1002/essoar.1051
Center for International Earth Science Information Network (CIESIN). (2021). GRID3 Ghana Settlement Extents, Version 01.01. Available at: https://data.grid3.org/datasets (Accessed January 29, 2024).
Center for International Earth Science Information Network (CIESIN), (2023). SDG Indicator 9.1.1: The rural access index (RAI), 2023 release (Accessed February 13, 2024).
Copernicus Climate Change Service (C3S) (2023). ERA5 hourly data on single levels from 1940 to present. Copernicus Climate Change Service (C3S) Climate Data Store (CDS).
Coulibaly, T. Y., and Managi, S. (2022). Identifying the impact of rainfall variability on conflicts at the monthly level. Sci. Rep. 12:18162. doi: 10.1038/s41598-022-23079-y
Danabasoglu, G., Lamarque, J.-F., Bacmeister, J., Bailey, D. A., DuVivier, A. K., Edwards, J., et al. (2020). The community earth system model version 2 (CESM2). J. Advan. Modeling Earth Syst. 12:e2019MS001916. doi: 10.1029/2019MS001916
De Haas, H. (2021). A theory of migration: the aspirations-capabilities framework. Comp. Migr. Stud. 9:8. doi: 10.1186/s40878-020-00210-4
De Moel, H., Jongman, B., Kreibich, H., Merz, B., Penning-Rowsell, E., and Ward, P. J. (2015). Flood risk assessments at different spatial scales. Mitig. Adapt. Strateg. Glob. Chang. 20, 865–890. doi: 10.1007/s11027-015-9654-z
De Sherbinin, A., Bukvic, A., Rohat, G., Gall, M., McCusker, B., Preston, B., et al. (2019). Climate vulnerability mapping: a systematic review and future prospects. WIREs Climate Change 10. doi: 10.1002/wcc.600
de Valk, H. A., Acostamadiedo, E., Guan, Q., Melde, S., Mooyaart, J., Sohst, R. R., et al. (2022). “How to predict future migration: different methods explained and compared” in Introduction to migration studies: An interactive guide to the literatures on migration and diversity. ed. P. Scholten. 1st ed (Cham: Springer International Publishing), 463–482.
Dembélé, M., Schaefli, B., van de Giesen, N., and Mariéthoz, G. (2020). Suitability of 17 gridded rainfall and temperature datasets for large-scale hydrological modelling in West Africa. Hydrol. Earth Syst. Sci. 24, 5379–5406. doi: 10.5194/hess-24-5379-2020
Dick, E., and Schraven, B. (2021). Rural-urban migration in West Africa: Contexts, trends, and recommendations: Policy brief 13 : KNOMAD.
Didan, K. (2021a). MODIS/Aqua vegetation indices 16-day L3 global 250m SIN grid V061, distributed by NASA EOSDIS Land Processes DAAC. Available at: https://doi.org/10.5067/MODIS/MYD13Q1.061 (Accessed October 15, 2023).
Didan, K. (2021b). MODIS/Terra vegetation indices 16-day L3 global 250m SIN grid V061, distributed by NASA EOSDIS Land Processes DAAC. Available at: https://doi.org/10.5067/MODIS/MOD13Q1.061 (Accessed October 15, 2023).
Dubey, A. K., Lal, P., Kumar, P., Kumar, A., and Dvornikov, A. Y. (2021). Present and future projections of heatwave hazard-risk over India: a regional earth system model assessment. Environ. Res. 201:111573. doi: 10.1016/j.envres.2021.111573
Duijndam, S. J., Botzen, W. J. W., Hagedoorn, L. C., and Aerts, J. C. J. H. (2022). Anticipating sea-level rise and human migration: a review of empirical evidence and avenues for future research. WIREs Climate Change 13:e747. doi: 10.1002/wcc.747
Dunne, J. P., Horowitz, L. W., Adcroft, A. J., Ginoux, P., Held, I. M., John, J. G., et al. (2020). The GFDL earth system model version 4.1 (GFDL-ESM 4.1): overall coupled model description and simulation characteristics. J. Advan. Modeling Earth Syst. 12:e2019MS002015. doi: 10.1029/2019MS002015
Dunning, C. M., Black, E., and Allan, R. P. (2018). Later wet seasons with more intense rainfall over Africa under future climate change. J. Clim. 31, 9719–9738. doi: 10.1175/JCLI-D-18-0102.1
EC-Earth Consortium (EC-Earth) (2019). EC-Earth-Consortium EC-Earth3-Veg model output prepared for CMIP6 CMIP. Earth System Grid Federation. doi: 10.22033/ESGF/CMIP6.642
EC-Earth Consortium (EC-Earth) (2020). EC-Earth-Consortium EC-Earth3-Veg-LR model output prepared for CMIP6 CMIP historical. Earth System Grid Federation. doi: 10.22033/ESGF/CMIP6.4707
EC-Earth Consortium (EC-Earth) (2021). EC-Earth-Consortium EC-Earth-3-CC model output prepared for CMIP6 CMIP historical. Earth System Grid Federation. doi: 10.22033/ESGF/CMIP6.4702
Essegbey, G. O., and MacCarthy, D. S. (2020). Situational analysis study for the agriculture sector in Ghana.: CCAFS report. Wageningen, the Netherlands: CGIAR Research Program on Climate Change, Agriculture and Food Security (CCAFS).
European Commission (2023). Composite indicators - step 6: weighting | knowledge for policy. Available at: https://knowledge4policy.ec.europa.eu/composite-indicators/10-step-guide/step-6-weighting_en#budget-allocation. (Accessed August 9, 2024).
FAO (2024a). GIEWS country brief - Nigeria. Available at: https://www.fao.org/giews/countrybrief/country/NGA/pdf/NGA.pdf (Accessed August 28, 2024).
FAO (2024b). GIEWS country brief - the republic of Ghana. Available at: https://www.fao.org/giews/countrybrief/country/GHA/pdf/GHA.pdf (Accessed September 18, 2024).
Farr, T. G., Rosen, P. A., Caro, E., Crippen, R., Duren, R., Hensley, S., et al. (2007). The shuttle radar topography Mission. Rev. Geophys. 45. doi: 10.1029/2005RG000183
Farrell, K. (2018). An inquiry into the nature and causes of Nigeria’s rapid urban transition. Urban Forum 29, 277–298. doi: 10.1007/s12132-018-9335-6
Funk, C., Peterson, P., Landsfeld, M., Pedreros, D., Verdin, J., Shukla, S., et al. (2015). The climate hazards infrared precipitation with stations—a new environmental record for monitoring extremes. Scientific Data 2:150066. doi: 10.1038/sdata.2015.66
Ghana Statistical Service (GSS) (2021a). 2021 population and housing census. Preliminary Report. Accra: Ghana Statistical Service.
Ghana Statistical Service (GSS) (2021b). 2021 population and housing census. Proximity of Residential Structures to Essential Service Facilities. Accra: Ghana Statistical Service.
Ghana Statistical Service (GSS) (2022a). 2021 population and housing census. General Report Volume 3E - Economic Activity. Accra: Ghana Statistical Service.
Ghana Statistical Service (GSS) (2022b). 2021 population and housing census. General report volume 3G -information and communication technology. Accra: Ghana Statistical Service.
Ghana Statistical Service (GSS) (2023). 2021 population and housing census. Thematic Report Migration. Accra: Ghana Statistical Service.
Giglio, L., Justice, C., Boschetti, L., and Roy, D. (2015). MCD64A1 MODIS/Terra+Aqua burned area monthly L3 global 500m SIN grid V006, distributed by NASA EOSDIS Land Processes Distributed Active Archive Center.
GIZ and EURAC (2017). Risk supplement to the vulnerability sourcebook. Guidance on how to apply the vulnerability Sourcebook’s approach with the new IPCC AR5 concept of climate risk. Bonn: GIZ.
Gupta, H. V., Kling, H., Yilmaz, K. K., and Martinez, G. F. (2009). Decomposition of the mean squared error and NSE performance criteria: implications for improving hydrological modelling. J. Hydrol. 377, 80–91. doi: 10.1016/j.jhydrol.2009.08.003
Gupta, A. K., Negi, M., Nandy, S., Kumar, M., Singh, V., Valente, D., et al. (2020). Mapping socio-environmental vulnerability to climate change in different altitude zones in the Indian Himalayas. Ecol. Indic. 109:105787. doi: 10.1016/j.ecolind.2019.105787
Gutjahr, O., Putrasahan, D., Lohmann, K., and Jungclaus, J. H. (2019). Max Planck institute earth system model (MPI-ESM1.2) for the high-resolution model Intercomparison project (HighResMIP). Geosci. Model Dev. 12, 3241–3281. doi: 10.5194/gmd-12-3241-2019
Han, Y., and Dunning, D. (2024). Metaknowledge of experts versus nonexperts: do experts know better what they do and do not know? J. Behav. Decis. Mak. 37:e2375. doi: 10.1002/bdm.2375
Hay, S. I., and Snow, R. W. (2006). The malaria atlas project: developing global maps of malaria risk. PLoS Med. 3:e473. doi: 10.1371/journal.pmed.0030473
Hengl, T., Miller, M. A. E., Križan, J., Shepherd, K. D., Sila, A., Kilibarda, M., et al. (2021). African soil properties and nutrients mapped at 30 m spatial resolution using two-scale ensemble machine learning. Sci. Rep. 11:6130. doi: 10.1038/s41598-021-85639-y
Hermans-Neumann, K., Priess, J., and Herold, M. (2017). Human migration, climate variability, and land degradation: hotspots of socio-ecological pressure in Ethiopia. Reg. Environ. Chang. 17, 1479–1492. doi: 10.1007/s10113-017-1108-6
Herrmann, S. M., Brandt, M., Rasmussen, K., and Fensholt, R. (2020). Accelerating land cover change in West Africa over four decades as population pressure increased. Commun. Earth & Environ. 1, 1–10. doi: 10.1038/s43247-020-00053-y
Hersbach, H., Bell, B., Berrisford, P., Biavati, G., Horányi, A., Muñoz Sabater, J., et al. (2023). ERA5 hourly data on single levels from 1940 to present. Copernicus Climate Change Service (C3S) Climate Data Store (CDS). doi: 10.24381/cds.adbb2d47
Hirvonen, K. (2016). Temperature changes, household consumption, and internal migration: evidence from Tanzania. Am. J. Agric. Econ. 98, 1230–1249. doi: 10.1093/ajae/aaw042
Ibrahim, B., and Mensah, H. (2022). Rethinking climate migration in sub-Saharan Africa from the perspective of tripartite drivers of climate change. SN Soc. Sci. 2, 1–24. doi: 10.1007/s43545-022-00383-y
Integrated Food Security Phase Classification (IPC), (2023). Acute food insecurity. Available at: https://www.ipcinfo.org/ipc-country-analysis/ipc-mapping-tool/ (Accessed February 19, 2024).
IPCC (2014). “Climate Change 2014: Mitigation of Climate Change,” in Contribution of Working Group III to the Fifth Assessment Report of the Intergovernmental Panel on Climate Change. eds. O. R. Edenhofer, Y. Pichs-Madruga, E. Sokona, S. Farahani, K. Kadner, and A. Seyboth, et al. (Cambridge, United Kingdom and New York, NY, USA: Cambridge University Press).
IPCC (2021). “Annex VII: glossary,” in Intergovernmental panel on climate change (IPCC), Climate Change 2021 - e Physical Science Basis. eds. J. B. R. Matthews, V. Möller, J. S. Fuglestvedt, C. Méndez, and S. Semenov (Cambridge, United Kingdom and New York, NY, USA: Cambridge University Press), 2215–2256. doi: 10.1017/9781009157896.022
IPCC (2022). “Climate Change 2022: Impacts, Adaptation, and Vulnerability,” in Contribution of Working Group II to the Sixth Assessment Report of the Intergovernmental Panel on Climate Change. eds. H.-O. Pörtner, D. C. Roberts, M. Tignor, E. S. Poloczanska, K. Mintenbeck, and A. Alegría, et al. (Cambridge, UK and New York, NY, USA: Cambridge University Press), 3056.
IPCC (2023). “Annex VII: glossary” in Intergovernmental panel on climate change (IPCC), Climate Change 2021– e Physical Science Basis. eds. J. B. R. Cooper, V. Möller, J. S. Fuglestvedt, C. Méndez, and S. Semenov (Cambridge, United Kingdom and New York, NY, USA: Cambridge University Press), pp 2215–2256.
Ismail, N. A., Adu-Ampong, E. A., and Aceska, A. (2024). The making of urban informal settlements: critical junctures and path dependency in governing Abuja. Nigeria. Cities 147:104789. doi: 10.1016/j.cities.2024.104789
Jambou, R., Njedanoun, M., Panthou, G., and Descroix, L. (2022). Malaria transmission in Sahelian African regions, a witness of climate changes. Int. J. Environ. Res. Public Health 19. doi: 10.3390/ijerph191610105
Kaczan, D. J., and Orgill-Meyer, J. (2020). The impact of climate change on migration: a synthesis of recent empirical insights. Clim. Chang. 158, 281–300. doi: 10.1007/s10584-019-02560-0
Klutse, N. A. B., Quagraine, K. A., Nkrumah, F., Quagraine, K. T., Berkoh-Oforiwaa, R., Dzrobi, J. F., et al. (2021). The climatic analysis of summer monsoon extreme precipitation events over West Africa in CMIP6 simulations. Earth Syst. Environ. 5, 25–41. doi: 10.1007/s41748-021-00203-y
Kouakou, C., Paturel, J.-E., Satgé, F., Tramblay, Y., Defrance, D., and Rouché, N. (2023). Comparison of gridded precipitation estimates for regional hydrological modeling in west and Central Africa. J. Hydrol.: Regional Stud. 47:101409. doi: 10.1016/j.ejrh.2023.101409
Kutor, S. K., Ofori, O. D., Akyea, T., and Arku, G. (2025). Climate change-immobility nexus: perspectives of voluntary immobile populations from three coastal communities in Ghana. Clim. Chang. 178, 1–23. doi: 10.1007/s10584-024-03849-5
Laux, P., Kunstmann, H., and Bárdossy, A. (2008). Predicting the regional onset of the rainy season in West Africa. Int. J. Climatol. 28, 329–342. doi: 10.1002/joc.1542
Lee, W.-L., and Liang, H.-C. (2020). AS-RCEC TaiESM1.0 model output prepared for CMIP6 CMIP. Earth System Grid Federation. doi: 10.22033/ESGF/CMIP6.9755
Lovato, T., Peano, D., Butenschön, M., Materia, S., Iovino, D., Scoccimarro, E., et al. (2022). CMIP6 simulations with the CMCC earth system model (CMCC-ESM2). J. Advan. Modeling Earth Syst. 14:e2021MS002814. doi: 10.1029/2021MS002814
Maduekwe, N. I., and Adesina, F. A. (2022). Can remittances contribute to financing climate actions in developing countries? Evidence from analyses of households’ climate hazard exposure and adaptation actors in SE Nigeria. Mitig. Adapt. Strateg. Glob. Chang. 27:10. doi: 10.1007/s11027-021-09987-w
Marzi, S., Mysiak, J., Essenfelder, A. H., Pal, J. S., Vernaccini, L., Mistry, M. N., et al. (2021). Assessing future vulnerability and risk of humanitarian crises using climate change and population projections within the INFORM framework. Glob. Environ. Chang. 71:102393. doi: 10.1016/j.gloenvcha.2021.102393
McLeman, R., Wrathall, D., Gilmore, E., Thornton, P., Adams, H., and Gemenne, F. (2021). Conceptual framing to link climate risk assessments and climate-migration scholarship. Clim. Chang. 165, 1–7. doi: 10.1007/s10584-021-03056-6
McMillan, J. M., Göttsche, F., Birkmann, J., Kapp, R., Schmidt, C., Weisser, B., et al. (2024). Mapping vulnerability to climate change for spatial planning in the region of Stuttgart. EGUsphere [preprint].
Mijani, N., Shahpari Sani, D., Dastaran, M., Karimi Firozjaei, H., Argany, M., and Mahmoudian, H. (2022). Spatial modeling of migration using GIS-based multi-criteria decision analysis: a case study of Iran. Trans. GIS 26, 645–668. doi: 10.1111/tgis.12873
Ministry of Food and Agriculture (MoFA). (2021). Agriculture in Ghana: Facts and figures. Statistics Research and Information Directorate (SRID) of the Ministry of Food and Agriculture (MoFA).
Miro, (2024). Online-whiteboard. Available at: https://miro.com/online-whiteboard/ (Accessed December 8, 2023).
Nardi, F., Annis, A., Di Baldassarre, G., Vivoni, E. R., and Grimaldi, S. (2019). GFPLAIN250m, a global high-resolution dataset of Earth’s floodplains. Scientific Data 6:180309. doi: 10.1038/sdata.2018.309
Ndimele, P. E., Ojewole, A. E., Mekuleyi, G. O., Badmos, L. A., Agosu, C. M., Olatunbosun, E. S., et al. (2024). Vulnerability, resilience and adaptation of Lagos coastal communities to flooding. Earth Sci., Syst. Society 4:4. doi: 10.3389/esss.2024.10087
Neumann, K., Sietz, D., Hilderink, H., Janssen, P., Kok, M., and van Dijk, H. (2015). Environmental drivers of human migration in drylands – a spatial picture. Appl. Geogr. 56, 116–126. doi: 10.1016/j.apgeog.2014.11.021
Nordkvelle, J., Rustad, S. A., and Salmivalli, M. (2017). Identifying the effect of climate variability on communal conflict through randomization. Clim. Chang. 141, 627–639. doi: 10.1007/s10584-017-1914-3
Ortega-Gaucin, D., Ceballos-Tavares, J. A., Sánchez, A. O., and Castellano-Bahena, H. V. (2021). Agricultural drought risk assessment: A spatial analysis of Hazard, exposure, and vulnerability in Zacatecas, Mexico. WaterSA 13:431. doi: 10.3390/w13101431
Owusu, V., and Yiridomoh, G. Y. (2021). Assessing the determinants of women farmers’ targeted adaptation measures in response to climate extremes in rural Ghana. Weather and Climate Extremes 33:100353. doi: 10.1016/j.wace.2021.100353
Porter, J. R., Xie, L., Challinor, A. J., Cochrane, K., Howden, S. M., Iqbal, M. M., et al. (2014). “Food security and food production systems,” in Climate Change 2014: Impacts, Adaptation, and Vulnerability. Part A: Global and Sectoral Aspects. eds. C. B. Field, V. R. Barros, D. J. Dokken, K. J. Mach, M. D. Mastrandrea, and T. E. Bilir, et al. (Cambridge, United Kingdom and New York, NY, USA: Contribution of Working Group II to the Fifth Assessment Report of the Intergovernmental Panel on Climate Change Cambridge University Press), 485–533.
Raleigh, C., Kishi, R., and Linke, A. (2023). Political instability patterns are obscured by conflict dataset scope conditions, sources, and coding choices. Human. Soc. Sci. Commun. 10, 1–17. doi: 10.1057/s41599-023-01559-4
Rigaud, K. K., de, A., Jones, B., Adamo, S., Maleki, D., Abu-Ata, N., et al. (2021). Groundswell Africa: Internal climate migration in west African countries. Washington, DC: World Bank.
Röhrig, F., Lange, S., Aschenbrenner, P., Chemura, A., Gornott, C., Murken, L., et al. (2019). Climate Risk Profile: Ghana. Deutsche Gesellschaft für Internationale Zusammenarbeit (GIZ). Available at: https://publications.pik-potsdam.de/pubman/item/item_23505 (Accessed August 19, 2024).
Romanovska, P., Gleixner, S., and Gornott, C. (2023). Climate data uncertainty for agricultural impact assessments in West Africa. Theor. Appl. Climatol. 152, 933–950. doi: 10.1007/s00704-023-04430-3
Roy, B., Khan, M. S. M., Saiful Islam, A. K. M., Khan, M. J. U., and Mohammed, K. (2021). Integrated flood risk assessment of the Arial Khan River under changing climate using IPCC AR5 risk framework. J. Water and Climate Change 12, 3421–3447. doi: 10.2166/wcc.2021.341
Sakdapolrak, P., Borderon, M., and Sterly, H. (2024). The limits of migration as adaptation. A conceptual approach towards the role of immobility, disconnectedness and simultaneous exposure in translocal livelihoods systems. Clim. Dev. 16, 87–96. doi: 10.1080/17565529.2023.2180318
Schürmann, A., Kleemann, J., Teucher, M., and Conrad, C. (2024). Mapping socio-environmental vulnerability to assess rural migration in Ghana. Appl. Geogr. 167:103283. doi: 10.1016/j.apgeog.2024.103283
Schürmann, A., Kleemann, J., Teucher, M., Fürst, C., and Conrad, C. (2022). Migration in West Africa: A visual analysis of motivation, causes, and routes. Ecol. Soc. 27. doi: 10.5751/ES-13489-270316
Serdeczny, O., Adams, S., Baarsch, F., Coumou, D., Robinson, A., Hare, W., et al. (2017). Climate change impacts in sub-Saharan Africa: from physical changes to their social repercussions. Reg. Environ. Chang. 17, 1585–1600. doi: 10.1007/s10113-015-0910-2
Setrana, M. B., and Kleist, N. (2022). “Gendered dynamics in West African migration,” in Migration in West Africa. IMISCOE Research Series. ed. T. K. Teye (Cham: Springer).
Shiogama, H., Abe, M., and Tatebe, H., (2019). MIROC MIROC6 model output prepared for CMIP6 ScenarioMIP. Earth System Grid Federation. doi: 10.22033/ESGF/CMIP6.898
Simpson, N. P., Mach, K. J., Tebboth, M. G., Gilmore, E. A., Siders, A. R., Holden, P., et al. (2024). Research priorities for climate mobility. One Earth 7, 589–607. doi: 10.1016/j.oneear.2024.02.002
Simpson, N. P., Williams, P. A., Mach, K. J., Berrang-Ford, L., Biesbroek, R., Haasnoot, M., et al. (2023). Adaptation to compound climate risks: a systematic global stocktake. iScience 26:105926. doi: 10.1016/j.isci.2023.105926
Smits, J. (2016). GDL Area Database. Sub-national development indicators for research and policy-making.
Stanzel, P., Kling, H., and Bauer, H. (2018). Climate change impact on west African rivers under an ensemble of CORDEX climate projections. Climate Services 11, 36–48. doi: 10.1016/j.cliser.2018.05.003
Steinbrink, M., and Niedenführ, H. (2020). “Translocal Livelihoods: New Perspectives in Livelihood Research,” in Africa on the Move. Springer Geography. Cham: Springer.
Stephan, R., Terzi, S., Erfurt, M., Cocuccioni, S., Stahl, K., and Zebisch, M. (2023). Assessing agriculture’s vulnerability to drought in European pre-alpine regions. Nat. Hazards Earth Syst. Sci. 23, 45–64. doi: 10.5194/nhess-23-45-2023
Stern, R. D. (1981). The start of the rains in West Africa. J. Clim. 1, 3–5. doi: 10.1002/joc.3370010107
Sultan, B., and Gaetani, M. (2016). Agriculture in West Africa in the twenty-first century: climate change and impacts scenarios, and potential for adaptation. Front. Plant Sci. 7:1262. doi: 10.3389/fpls.2016.01262
Szaboova, L., Adger, W. N., Safra de Campos, R., Maharjan, A., Sakdapolrak, P., Sterly, H., et al. (2023). Evaluating migration as successful adaptation to climate change: trade-offs in well-being, equity, and sustainability. One Earth 6, 620–631. doi: 10.1016/j.oneear.2023.05.009
Teye, J. K. (2022). “Migration in West Africa: An introduction,” in Migration in West Africa. IMISCOE Research Series. ed. T. K. Teye (Cham: Springer).
Teye, J. K., and Nikoi, E. G. A. (2022). “Climate-Induced Migration in West Africa,” in Migration in West Africa. IMISCOE Research Series. ed. J. K. Teye (Cham: Springer).
The Demographic and Health Surveys Program (DHS), (2018). Spatial data repository - modeled surfaces. Available at: https://spatialdata.dhsprogram.com/modeled-surfaces (Accessed March 20, 2024).
The World Bank Group, (2021). Climate Risk Profile: Nigeria. Available at: https://climateknowledgeportal.worldbank.org/sites/default/files/2021-07/15918-WB_Nigeria%20Country%20Profile-WEB.pdf (Accessed June 14, 2024).
The World Factbook (2021). Nigeria. Central Intelligence Agency. Available at: https://www.cia.gov/the-world-factbook/countries/nigeria/ (Accessed February 22, 2024).
Tomalka, J., Birner, J., Dieye, A.M., and Gleixner, S., (2021). Climate risk profile: Sahel. A joint publication by the Potsdam Institute for Climate Impact Research (PIK) and the United Nations high commissioner for refugees (UNHCR) under the predictive analytics project in support of the United Nations integrated strategy for the Sahel (UNISS). Available at: https://publications.pik-potsdam.de/pubman/item/item_26168 (Accessed August 22, 2024)
Trisos, C. H., Adelekan, I. O., Totin, E., and Ayanlade, A. (2022). “Africa” in Climate change 2022 – Impacts, adaptation and vulnerability: Working group II contribution to the sixth assessment report of the intergovernmental panel on climate change. eds. H.-O. Pörtner, D. C. Roberts, and M. Tignor (Cambridge, UK and New York: Cambridge University Press), 1285–1456.
Tuholske, C., di, M., Anderson, W., van, R., and de, A. (2024). A framework to link climate change, food security, and migration: unpacking the agricultural pathway. Popul. Environ. 46. doi: 10.1007/s11111-024-00446-7
Twumasi, M. A., Jiang, Y., Danquah, F. O., Chandio, A. A., and Agbenyo, W. (2020). The role of savings mobilization on access to credit: a case study of smallholder farmers in Ghana. Agricultural Finance Rev. 80, 275–290. doi: 10.1108/AFR-05-2019-0055
Umar, N., and Gray, A. (2023). Flooding in Nigeria: a review of its occurrence and impacts and approaches to modelling flood data. Int. J. Environ. Stud. 80, 540–561. doi: 10.1080/00207233.2022.2081471
United Nations (UN). (2023). Internal migration trends in Nigeria. Available at https://nigeria.un.org/en/download/149644/255132 (Accessed August 22, 2024).
Van De Giesen, N., Liebe, J., and Jung, G. (2010). Adapting to climate change in the Volta Basin, West Africa. Curr. Sci. 98.
van der Geest, K. (2011). North-south migration in Ghana: what role for the environment? Int. Migr. 49, e69–e94. doi: 10.1111/j.1468-2435.2010.00645.x
van der Geest, K., and Warner, K. (2015). “Vulnerability, coping and loss and damage from climate events,” in Hazards, risks and disasters in society. ed. A. Collins (New York: Elsevier), 121–144.
Vinke, K., Rottmann, S., Gornott, C., Zabre, P., Nayna Schwerdtle, P., and Sauerborn, R. (2022). Is migration an effective adaptation to climate-related agricultural distress in sub-Saharan Africa? Popul. Environ. 43, 319–345. doi: 10.1007/s11111-021-00393-7
Wang, X., Meng, X., and Long, Y. (2022). Projecting 1 km-grid population distributions from 2020 to 2100 globally under shared socioeconomic pathways. Scientific data 9:563. doi: 10.1038/s41597-022-01675-x
Weber, T., Cabos, W., Sein, D. V., and Jacob, D. (2023). Benefits of simulating precipitation characteristics over Africa with a regionally-coupled atmosphere–ocean model. Clim. Dyn. 60, 1079–1102. doi: 10.1007/s00382-022-06329-7
Willmott, C. J. (1982). Some comments on the evaluation of model performance. Bull. Am. Meteorol. Soc. 63, 1309–1313. doi: 10.1175/1520-0477(1982)063<1309:SCOTEO>2.0.CO;2
Wrigley-Asante, C., Owusu, K., Egyir, I. S., and Owiyo, T. M. (2019). Gender dimensions of climate change adaptation practices: the experiences of smallholder crop farmers in the transition zone of Ghana. African Geographical Rev. 38, 126–139. doi: 10.1080/19376812.2017.1340168
Xin, X., Zhang, J., Zhang, F., Wu, T., Shi, X., Xueli, L., et al. (2018). BCC BCC-CSM2MR model output prepared for CMIP6 CMIP. Earth System Grid Federation. doi: 10.22033/ESGF/CMIP6.1725
Yu, Y. (2019). CAS FGOALS-f3-L model output prepared for CMIP6 ScenarioMIP. Earth System Grid Federation. doi: 10.22033/ESGF/CMIP6.2046
Yukimoto, S., Koshiro, T., Kawai, H., and Oshima, N., (2019). MRI MRI-ESM2.0 model output prepared for CMIP6 CMIP. Earth System Grid Federation. doi: 10.22033/ESGF/CMIP6.621
Zebisch, M., Renner, K., Pittore, M., Fritsch, U., Fruchter, S. R., Kienberger, S., et al. (2023). Climate Risk Sourcebook. Bonn: Deutsche Gesellschaft für Internationale Zusammenarbeit (GIZ) GmbH.
Zomer, R. J., Xu, J., and Trabucco, A. (2022). Version 3 of the global aridity index and potential evapotranspiration database. Scientific Data 9:409. doi: 10.1038/s41597-022-01493-1
Zougmoré, R., Partey, S., Ouédraogo, M., Omitoyin, B., Thomas, T., Ayantunde, A., et al. (2016). Toward climate-smart agriculture in West Africa: a review of climate change impacts, adaptation strategies and policy developments for the livestock, fishery and crop production sectors. Agric. Food Secur. 5. doi: 10.1186/s40066-016-0075-3
Keywords: climate change, exposure, geospatial data, hazard, internal migration, vulnerability, West Africa
Citation: Schürmann A, Teucher M, Kleemann J, Inkoom JN, Nyarko BK, Okhimamhe AA and Conrad C (2025) Spatial assessment of current and future migration in response to climate risks in Ghana and Nigeria. Front. Clim. 7:1516045. doi: 10.3389/fclim.2025.1516045
Edited by:
Cristiano Prestrelo Oliveira, Federal University of Rio Grande do Norte, BrazilReviewed by:
Francis Xavier Jarawura, SD Dombo University of Business and Integrated Development Studies, GhanaCopyright © 2025 Schürmann, Teucher, Kleemann, Inkoom, Nyarko, Okhimamhe and Conrad. This is an open-access article distributed under the terms of the Creative Commons Attribution License (CC BY). The use, distribution or reproduction in other forums is permitted, provided the original author(s) and the copyright owner(s) are credited and that the original publication in this journal is cited, in accordance with accepted academic practice. No use, distribution or reproduction is permitted which does not comply with these terms.
*Correspondence: Alina Schürmann, YWxpbmEuc2NodWVybWFubkBwb3N0ZW8uZGU=; YWxpbmEuc2NodWVybWFubkBnZW8udW5pLWhhbGxlLmRl
Disclaimer: All claims expressed in this article are solely those of the authors and do not necessarily represent those of their affiliated organizations, or those of the publisher, the editors and the reviewers. Any product that may be evaluated in this article or claim that may be made by its manufacturer is not guaranteed or endorsed by the publisher.
Research integrity at Frontiers
Learn more about the work of our research integrity team to safeguard the quality of each article we publish.