
95% of researchers rate our articles as excellent or good
Learn more about the work of our research integrity team to safeguard the quality of each article we publish.
Find out more
ORIGINAL RESEARCH article
Front. Clim. , 31 March 2025
Sec. Climate and Health
Volume 7 - 2025 | https://doi.org/10.3389/fclim.2025.1504804
 Inma Martínez-Zarzoso1,2*
 Cristina Badarau3Luis R. Díaz Pavez1Juan Armando Torres Munguía1Konstantin Wacker4
Purpose: This paper aims at understanding the factors that are associated with disease outbreaks by investigating environmental and globalization risk factors.
Design/methodology/approach: As environmental factors we consider several dimensions of the Environmental Performance Index (EPI). To gauge globalization, we consider international trade flows and international flights, as well as two globalization indices accounting for economic and interpersonal globalization. Methodologically, we estimate a Poisson Random Effects model for panel data covering 195 countries over 25 years.
Findings: First, concerning the EPI dimensions, we find that improving sanitation and drinking water conditions are negatively and significantly correlated with the frequency of the outbreaks, whereas no robust relationship could be identified for changes in biodiversity habitat, ecosystem services, and waste management. Second, regarding the globalization factors, we find that an increase in imports and in the number of international flights are positively correlated with the number of outbreaks. Conversely, neither of the two globalization indices considered have a clear association with outbreaks.
Originality: The paper uses a new dataset of infectious disease outbreaks collected from the Disease Outbreak News produced by the World Health Organization (WHO) containing information on 1,462 events occurred between 1996 and 2019, covering 195 countries and 70 diseases.
Practical implications: In view of the results, local policy efforts in low-income countries should aim at improving sanitary conditions. This effort could be leveraged with development aid support. Once outbreaks have been detected in a location, international flight restrictions should be considered to reduce the international contagion rate. The main contribution of this paper is to provide empirical evidence for policymakers that can be used to minimize the probability of future pandemics.
Pandemics and epidemic-prone diseases have always been of great concern for human societies. Their catastrophic effects on human life and economic activity have been observed throughout our whole history. Recent examples are the AIDS pandemic caused by the Human Immunodeficiency Virus (HIV) in the 1980s and the COVID-19 pandemic caused by the SARS-CoV-2 virus in 2020. The latter is responsible for approximately seven million deaths worldwide as of 2025, has disrupted economic activity, decreased standards of living, and led to a setback in the global fight against poverty (SDG1) around the world. Given these potentially damaging consequences, it is imperative to understand what factors are associated with pandemics and disease outbreaks, such that policymakers can minimize the probability of such events occurring in the future.
The existent academic literature on the determinants of epidemics and pandemics is broad and has mainly focused on the impact of specific factors. Different disciplines have contributed to this literature, including ecology, health sciences, economics, and applied mathematics. For instance, ecological literature has studied environmental degradation as a potential determinant of epidemics due to their effects on increasing contact between humans and wild species, creating the conditions for the mutation of zoonotic viruses (Dobson et al., 2020; Tollefson, 2020; among others). Moreover, the effect of improvement in sanitary conditions on epidemic outbreaks has been extensively studied in health and epidemiological studies and laboratory experiments (Mari et al., 2012; Fawell et al., 2001; Watson et al., 2007; are some of them). Likewise, economic and applied mathematical literature has developed models explaining the relevance of globalization (for example, Hufnagel et al., 2004; Weiss and McMichael, 2004). The latter focuses particularly on how international flights increase the international transmission of outbreaks of viruses, such as acute respiratory syndrome (SARS).
Despite the availability of extensive research examining the factors that contribute to epidemic outbreaks from different perspectives, there is a lack of studies with global coverage that simultaneously consider ecological and globalization factors as determinants of epidemics and pandemics. This paper aims to fill this gap in the literature by using a global sample of countries to jointly analyze the above-mentioned simultaneity of both types of factors. For this purpose, we identify and quantify the effect of a set of environmental and globalization variables. Those are selected according to the literature on the frequency of epidemics and pandemics (Dobson et al., 2020; Tollefson, 2020) for a sample of 195 countries, covering around 70 infectious diseases and epidemic-prone diseases (including the COVID-19 virus) in the world during the period 1996–2019. The environmental variables considered, obtained from the Environmental Performance Index (IPI) database1, are Biodiversity, Ecosystem services, Sanitation and drinking water, and Waste management. Among the proxies for globalization, we considered a globalization index (Gygli et al., 2019), international trade flows (UN COMTRADE, 2024), shipping connectivity index [United Nations Conference on Trade and Development (UNCTAD), 2024], and the number of international flights (International Civil Aviation Organization, 2024). The frequency of epidemics has been constructed using the Disease Outbreak News from the WHO. The methodology used to identify correlations is based on panel data econometrics, which enables us to control for country-specific factors that are difficult to measure and do not vary over time. In particular, we estimate a correlated random effect model, which is a random-effects model extended with the time averages of the time-variant explanatory variables to proxy for common factors (Wooldridge, 2019, 2021).
We add to the existing literature on two fronts. First, we use a newly constructed index of epidemics and pandemics with global coverage in terms of countries and diseases, which includes the COVID-19 pandemic (Torres Munguía et al., 2022). And second, we present an econometric analysis that allows us to control for unobserved heterogeneity at the country level and to give several policy recommendations based on the estimation results. We are able to identify relevant correlations, but given potential endogeneity issues, we do not claim to infer causality.
The main results indicate that out of all ecological factors considered, sanitation and drinking water is the one consistently showing a relevant correlation with the frequency of epidemic outbreaks for all countries and country groups. This suggests that better sanitation conditions are associated with a lower frequency of disease outbreaks. Concerning the globalization variables, our main results indicate that an increase in the number of flights is positively associated with the frequency of epidemics.
Some policy implications could be extracted from these results. First, many local authorities should invest more in better sanitary conditions to prevent future outbreaks, particularly those in low and low-middle-income countries, where there are huge potential possibilities for improvement. Second, international efforts in terms of development aid directed to sanitation policies in low and low-middle-income countries should be incentivized. Such aid efforts create benefits beyond the recipient country in the form of a lower pandemic incidence. Finally, restrictions on international flights must be rapidly adopted once outbreaks have been detected in their original location since we found a large correlation between the number of international flights and the frequency of outbreaks.
The rest of the paper is organized as follows. Section 2 presents a brief review of closely related papers considering ecological, health, and globalization determinants of epidemics. Section 3 describes the data and stylized facts, and Section 4 outlines the empirical method and the model specification. Section 5 shows the main results, and finally, Section 6 summarizes the findings and presents some policy implications.
Different disciplines have studied the determinants of epidemics, each of them with their distinctive paradigms and methodologies, such as pure theoretical studies, laboratory experiments, and mathematical models. This section has selected some of the most recent literature from ecology, health sciences, and economics.
Ecological studies have mainly focused on the impact of biodiversity and ecosystem degradation on the generation of pandemic and epidemic outbreaks. For instance, Dobson et al. (2020) and Tollefson (2020) stated that biodiversity loss was the leading cause of recent viruses such as the SARS-CoV-2 and HIV. This loss is mainly due to deforestation and wildlife trade, which increases the contact between humans and wild species, creating the conditions for the mutation of zoonotic viruses. For the case of the COVID-19 pandemic originated by SARS-CoV-2, the authors show that the potential benefits of programs intended to reduce deforestation and wildlife trade outweigh their costs,2 with a net benefit of 8.1 trillion dollars in the most conservative scenario.3 In the same line, Faust et al. (2018) developed a multi-host model for pathogen transmission between species inhabiting intact and converted habitats, performing simulations with a representative natural system as a unit of analysis. They found that the highest spillover risks of epidemics occur at intermediate levels of habitat loss, and the largest but rarest epidemics occur at extreme levels of land conversion.
Regarding health science studies, these have paid particular attention to the impact of sanitation and drinking water on the emergence of epidemic outbreaks. In particular, Mari et al. (2012) developed a mechanistic spatially explicit model for cholera epidemics finding that sanitation and drinking water conditions and human mobility are one of the main determinants. In addition, the seminal Water Quality report of the WHO (Fawell et al., 2001) has underlined the uttermost importance of adequate sanitation and drinking water conditions to prevent epidemic intestinal and excreta-related diseases such as cholera, typhoid, hepatitis, polio, cryptosporidiosis, ascariasis, and schistosomiasis. The report also emphasizes the relevance of adequate sanitary conditions to decrease the contagion rate of viruses such as hepatitis E and Adenoviruses. Moreover, Watson et al. (2007) have stated the crucial role of sanitary conditions as facilitators of antimicrobial agents in preventing acute respiratory infections (ARI). Based on this evidence, adequate sanitary conditions would also help control the propagation of viruses such as COVID-19.
Moving to research in the fields of economics and mathematics, some studies dealing with the impact of globalization on epidemic outbreaks appeared in the first decade of the XXI century. Hufnagel et al. (2004) created a probabilistic network model to forecast the geographical spread of SARS. By combining a stochastic local infection dynamic with stochastic transport in a worldwide network, the authors show the uttermost relevance of international flights as determinants of SARS transmission, emphasizing that a fast and focused reaction is crucial to inhibit the global spread of epidemics. In the same line, Weiss and McMichael (2004) emphasized the crucial role of international flights in transmitting the SARS virus in 2003, which was successfully controlled by restrictions in international flights and quarantine measures in countries like China, Singapore, and Taiwan.
Other forms of globalization, such as imports, influence not only the international contagion of epidemics but also the international transmission of production shocks derived from lockdown restrictions. Sforza and Steininger (2020) constructed and calibrated an international general equilibrium model to show that the production shock induced by COVID-19 reduced real income for all countries in the world, with global trade linkages and sectoral interrelations playing a crucial role. Therefore, there is a trade-off between a reduction in international contagion and the disruption of global value chains generated by immediate measures intended to restrict imports. In this paper, and for simplicity purposes, we only focus on the contagion aspect.
This section describes the data and variables (subsection 3.1) and presents some stylized facts concerning the evolution of the environmental, economic, and globalization factors considered for the empirical application (subsection 3.2).
The outcome variable of interest is the likelihood of disease outbreaks occurrence. Information to construct this variable comes from the global dataset of pandemic and epidemic-prone diseases outbreaks (Torres Munguía et al., 2022). This dataset is one of the most complete open sources of information on the matter, covering more than 230 countries and territories since January 1996. Information is publicly available from the UNOCHA Humanitarian Data Exchange initiative.4
The global dataset of pandemic and epidemic-prone diseases outbreaks is sourced from the Disease Outbreak News produced by the WHO. The Disease Outbreak News are reports of epidemiological, clinical, and laboratory investigations about confirmed and potential public health events of concern. Specifically, these events can be classified into three categories: (1) Any outbreak with an unknown cause and significant or potential international health concern that may affect international travel or trade; (2) outbreaks of known cause, which have demonstrated the ability to cause serious public health impact and spread internationally; and (3) outbreaks that generate high public concern, which may lead to disruption of required public health interventions or could disrupt international travel or trade.
These reports are obtained from a global system integrated by official public health authorities, institutions, and research networks of the WHO and its partners. Given that the Disease Outbreak News are not primary produced for statistical purposes, they are unstructured and with a format that makes it difficult to extract detailed information. Torres Munguía et al. (2022) transformed these news into a structured dataset that is statistically sound for research purposes by applying data and text mining techniques for cleaning and organizing the information, and both large language models and manual imputation for event classification. The full code to replicate this process can be found at https://github.com/jatorresmunguia/disease_outbreak_news/tree/main.
After inspecting the global dataset of pandemic and epidemic-prone diseases outbreaks, we have identified 1,462 outbreaks that occurred between 1996 and 2020, covering 195 countries and around 70 different diseases. Using the generated data, we also constructed a count variable of the frequency of outbreaks. Figure 1 shows the evolution over time of this variable for different income groups of countries based on their Gross National Income (GNI) per capita.5 It can be observed that the frequency of outbreaks mainly increased in the decade 2010–2018 with respect to the previous 15 years of data coverage, reaching an even higher and steeper increase in the period 2019–2020 due to the COVID-19 pandemic. Another interesting insight is the decrease of the outbreak index in low-income countries from 1995 to 2013.
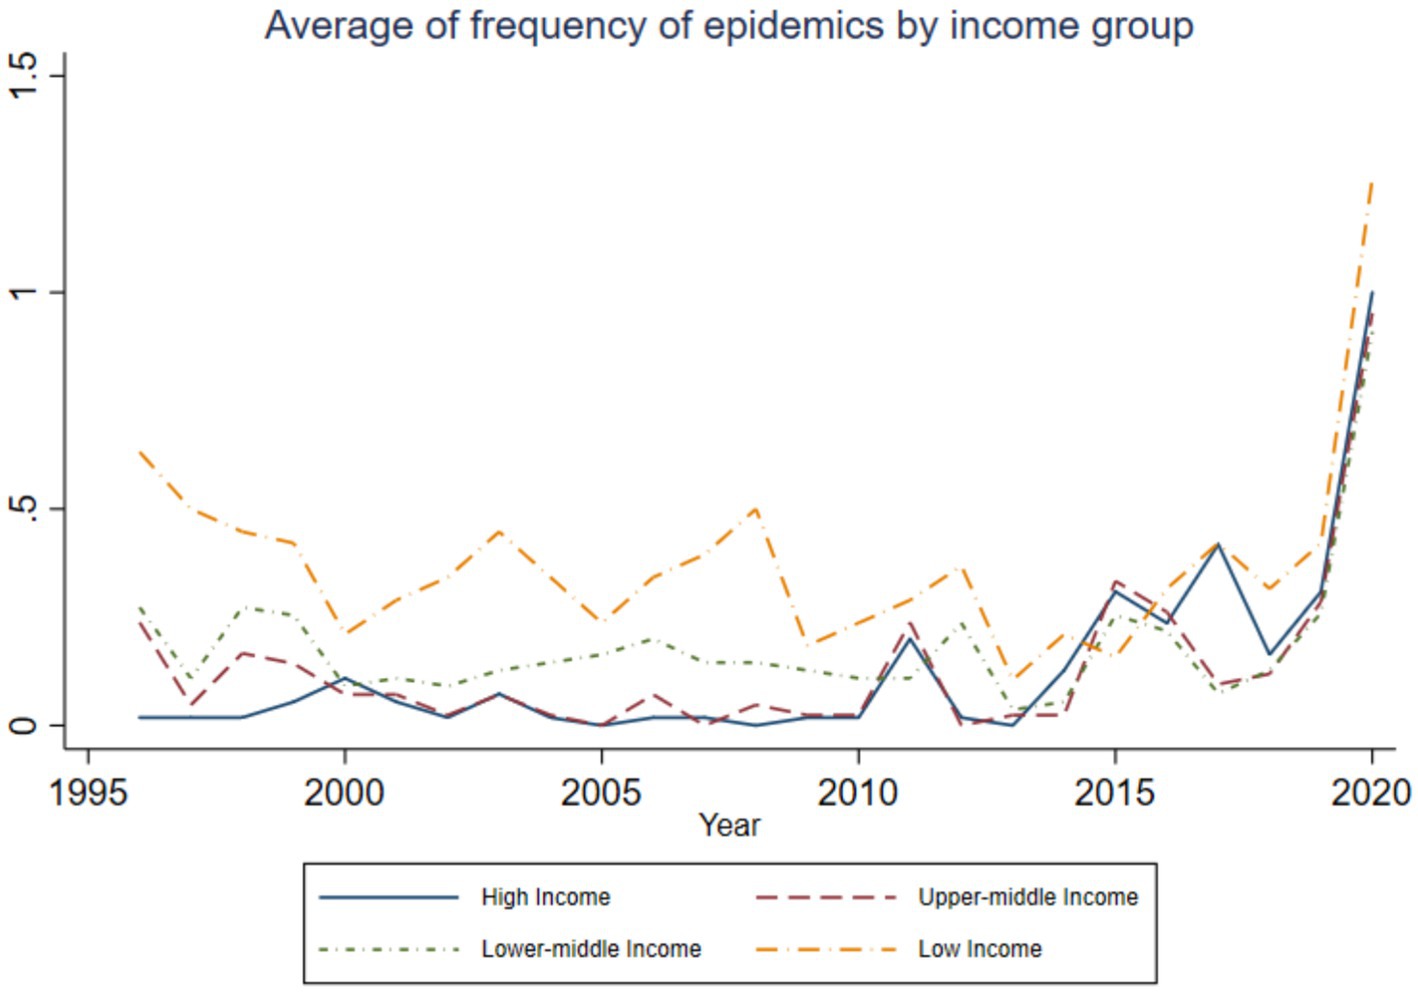
Figure 1. Evolution over time of averaged epidemic outbreaks by income group. Values represent the average number of outbreaks for each income group according to the WDI classification. Source: authors’ elaboration using information from the WHO.
The interoperability of the dataset, that uses the International Standard Organization for countries and territories (ISO-3166) and the tenth revision of the International Statistical Classification of Diseases and related Health Problems (ICD-10), allowed us to integrate the information of the outcome variable to the explanatory variables. The explanatory variables include four environmental performance indicators taken from the Environmental Performance Index (EPI) provided by the Yale Center for Environmental Law & Policy (YCELP), namely “Ecosystem services,” “Biodiversity habitat,” “Sanitation and drinking water,” and “Waste management,” which are the components that could most influence the frequency of epidemics according to the literature. All these indicators show some time variation except “Waste management,” which is only calculated for 2017 and then extrapolated backward and forward by the EPI group.6 These indexes are constructed as a weighted average of different subcomponents.7 All the indices and subcomponents come in a rescaled format and vary between 0 and 100, where a higher number indicates a better performance. The different subcomponents of the selected indices with their corresponding weights are shown in Table 1.

Table 1. Selected components of the environmental performance index.
In Figure 2, we present the evolution over time of these indices by income group of countries. The income categories of 2008 are used for the whole sample since this year represents the middle point of the period in our sample (1996–2020). Some interesting insights can be highlighted by examining Figure 2. First, along the sample period, lower-middle- and low-income countries show the best “Biodiversity habitat” performance, which slightly decreased over time, while the already low indices of upper-middle- and high-income countries show a sharper decrease, especially after 2010. Second, high-income countries show the worse performance concerning the “Ecosystem services” index, which shows a decreasing trend over the whole period. Differently, low-income countries greatly increased their performance after 2005, reaching the highest value in 2007, while lower-middle and upper-middle-income countries experienced a more volatile evolution. Furthermore, there is a slight improvement over time in the index “Sanitation and drinking water,” with a performance proportional to the income level of countries and with improvements that are more noticeable for low-income countries than the rest. Finally, the evolution over time of waste management presents no visual changes.
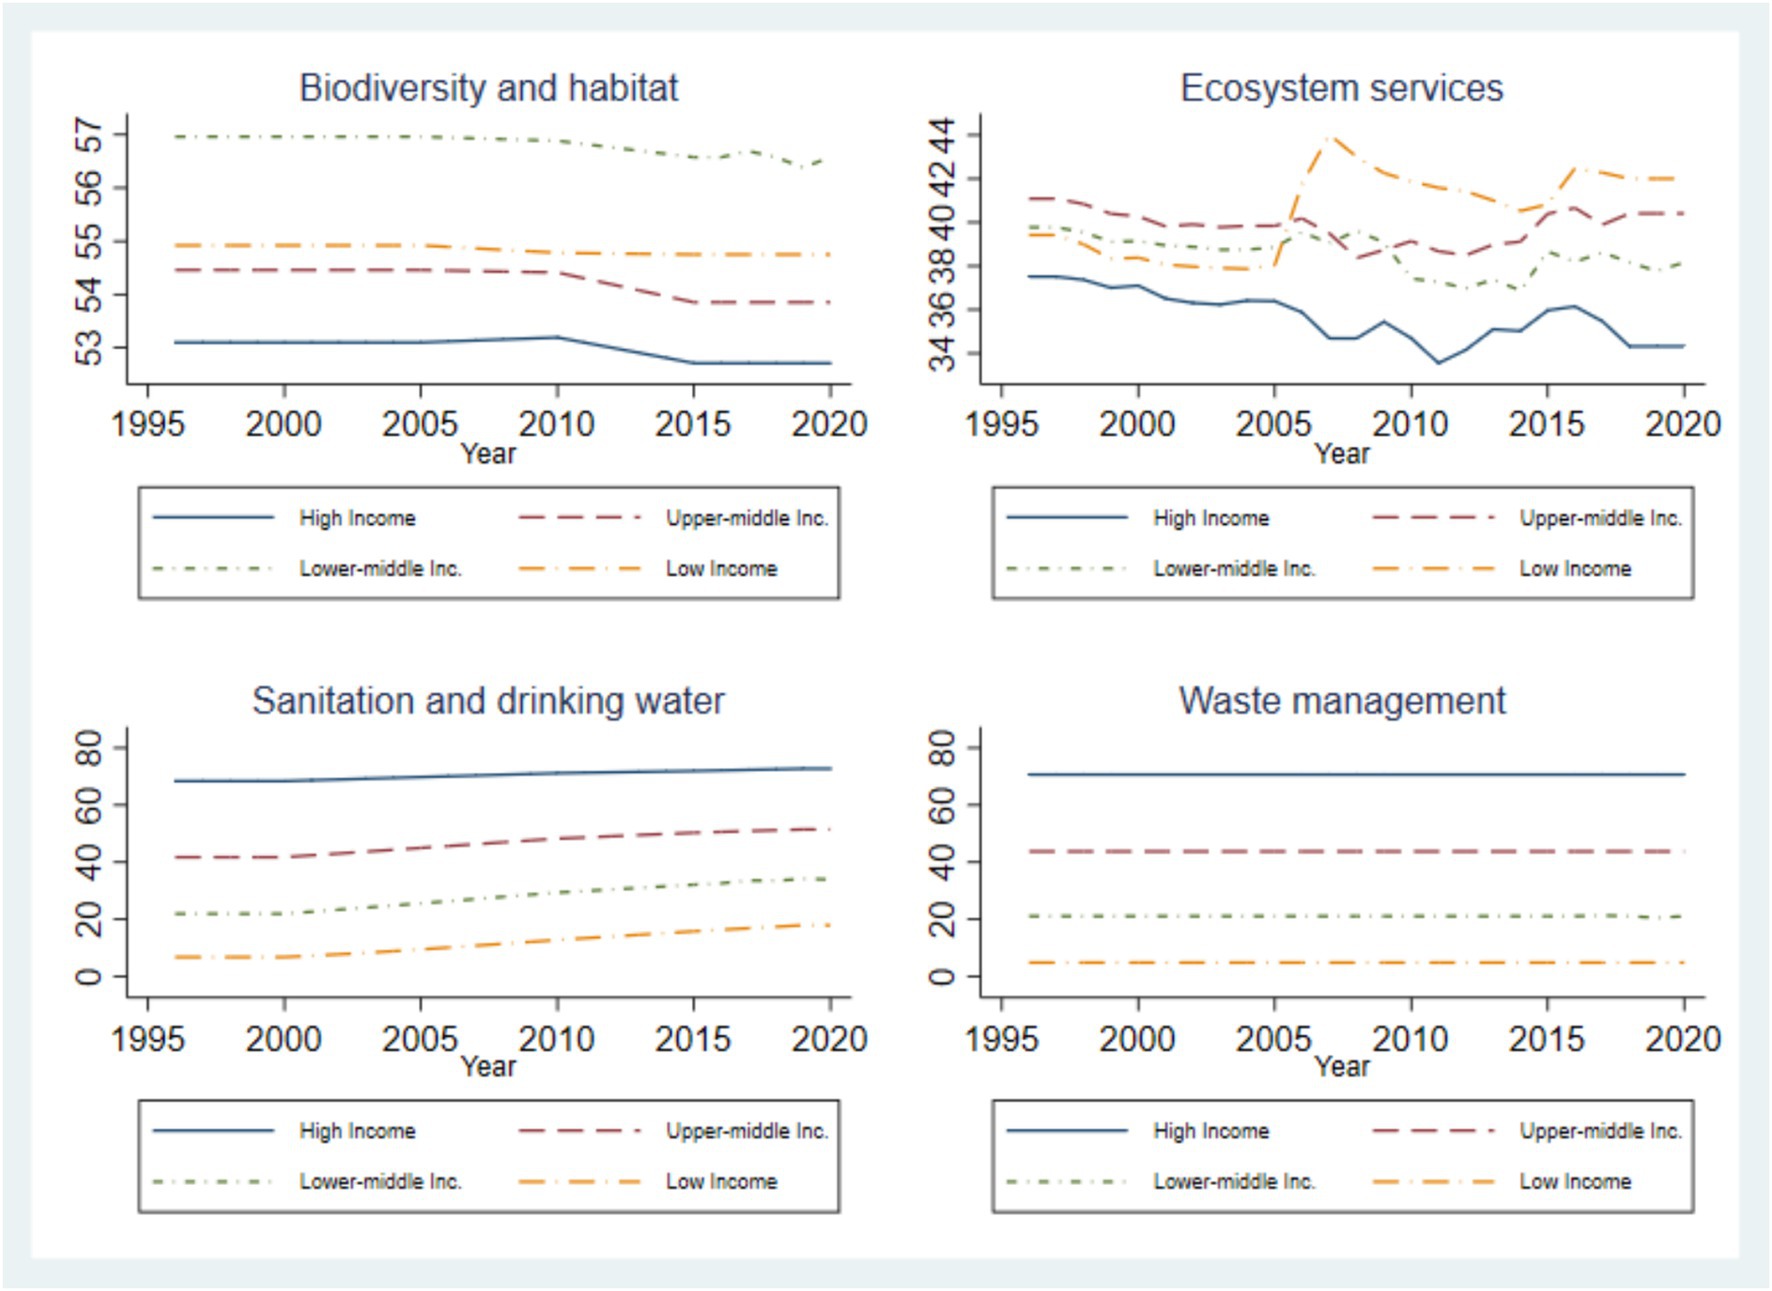
Figure 2. Evolution over time of environmental performance indicators by income group. Values represent the averaged index for each income group. Authors’ elaboration based on the Yale Center for Environmental law and Policy—YCELP—Yale University, and Center for International Earth Science Information Network—CIESIN—Columbia University (2020).
We selected two globalization variables for the empirical analysis: international flights, collected from the International Flights database provided by the International Civil Aviation Organization (2024),8 and Imports measured in USD, collected from the United Nations (UN) COMTRADE database (2024). According to the literature and the preliminary empirical analysis, these are the globalization variables that have been found to influence the frequency of epidemics. For illustrative purposes, we also present the evolution over time of a number of alternative measures. Those are the KOF Globalization Index (Gygli et al., 2019).9 which captures economic, social, and political globalization; the KOF Interpersonal globalization subindex,10 which considers migration, international students, international tourism, transfers, international voice traffic, telephone subscriptions, freedom to visit, and international airports. And the UNCTAD Shipping Connectivity Index [United Nations Conference on Trade and Development (UNCTAD), 2024].11
Figure 3 shows the evolution over time of the average values of the globalization indicators by income group. It can be observed that these indicators are significantly higher in high-income countries than in the other income groups. A striking feature in the case of the number of flights and imports is that not only the levels of these variables but also their growth over time is higher for high-income countries, indicating that the speed of the globalization process has been faster for those countries, with the potential consequences in terms of a higher contagion rate. Nevertheless, while for imports this happened mainly over the period 1995–2010, for flights the acceleration can be mainly seen in the second part of the period, that is after 2010.
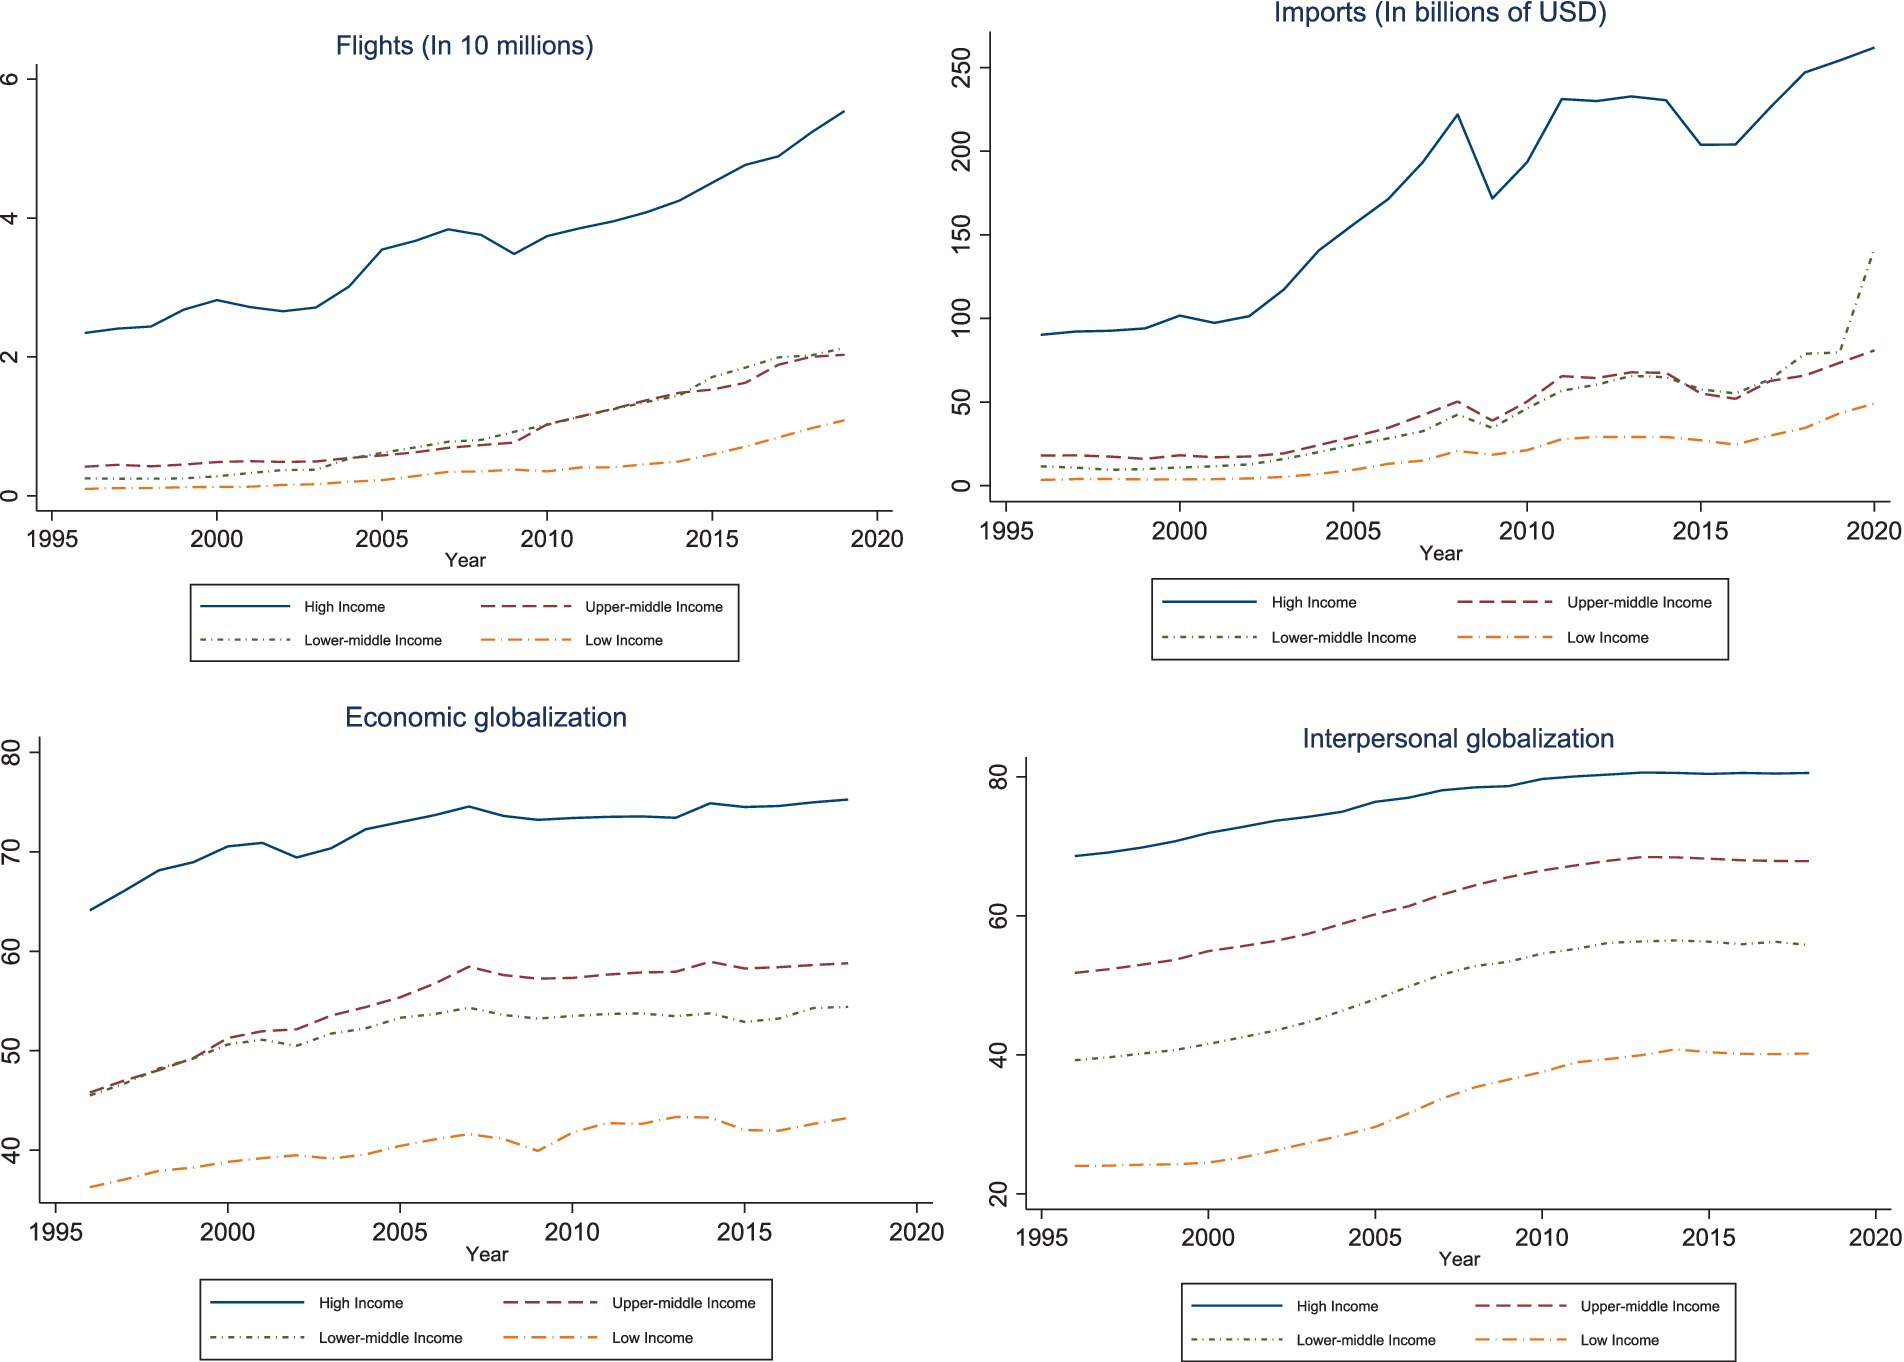
Figure 3. Evolution over time of selected globalization indicators. The globalization indices show average values for each income group (upper part of the figure), while the number of flights and import values are calculated as the sum for all countries belonging to each group. Source: authors’ elaboration based on the KOF globalization index (ETH Zürich), flights database (International Civil Aviation Organization), and UN-COMTRADE.
The summary statistics of the variables used in the empirical analysis are presented in Table 2 and a bi-variate correlation matrix can be found in Table A1 in the Appendix. We further included GDP per capita measured in USD from the World Development Indicators (WDI) of the World Bank to control for the development level of each country and the urban population as a share of the total population (urbanization) to control for the urbanization rate.
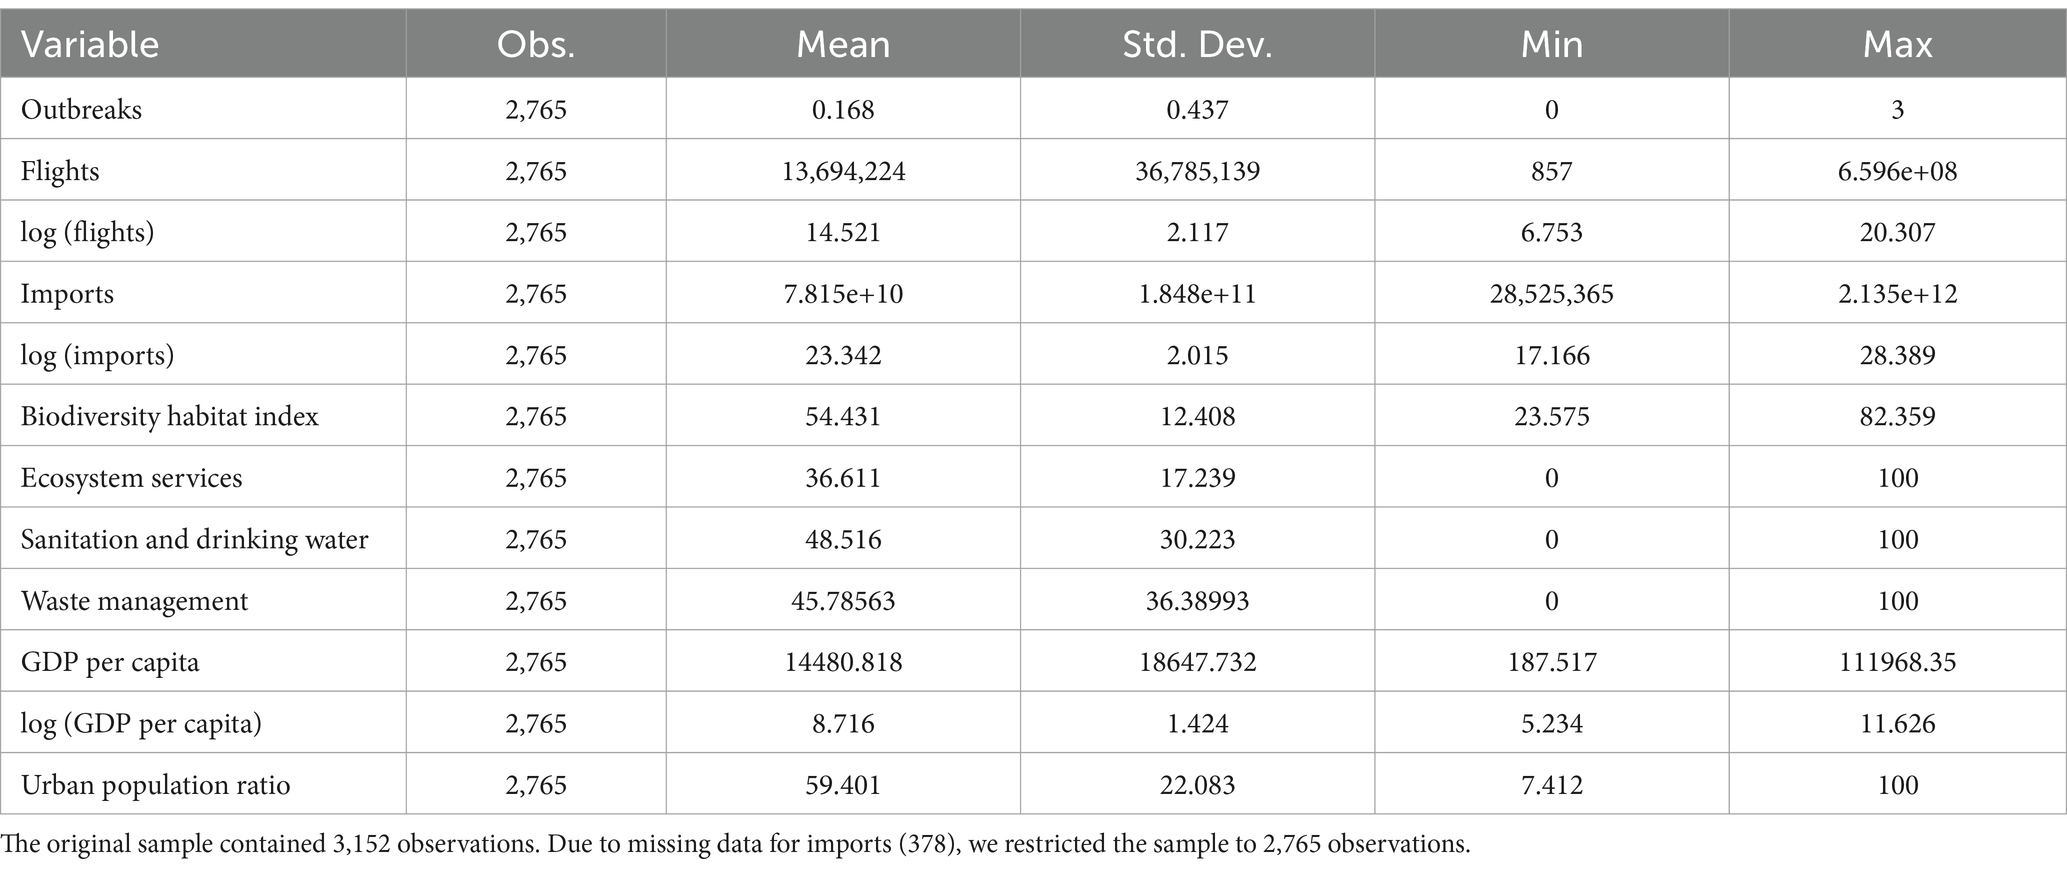
Table 2. Summary statistics.
Next, we show some descriptive evidence of the graphical relationship between selected environmental and globalization variables and the frequency of epidemic outbreaks. In Figure 4, we plot frequency bars of the time-averaged frequency of outbreaks against the time-averaged values of the environmental indicators. The figure shows a negative relationship between the “Sanitation and drinking water” indicator and the frequency of outbreaks and less for “Ecosystem services.” No clear relationship can be observed for “Biodiversity habitat”.
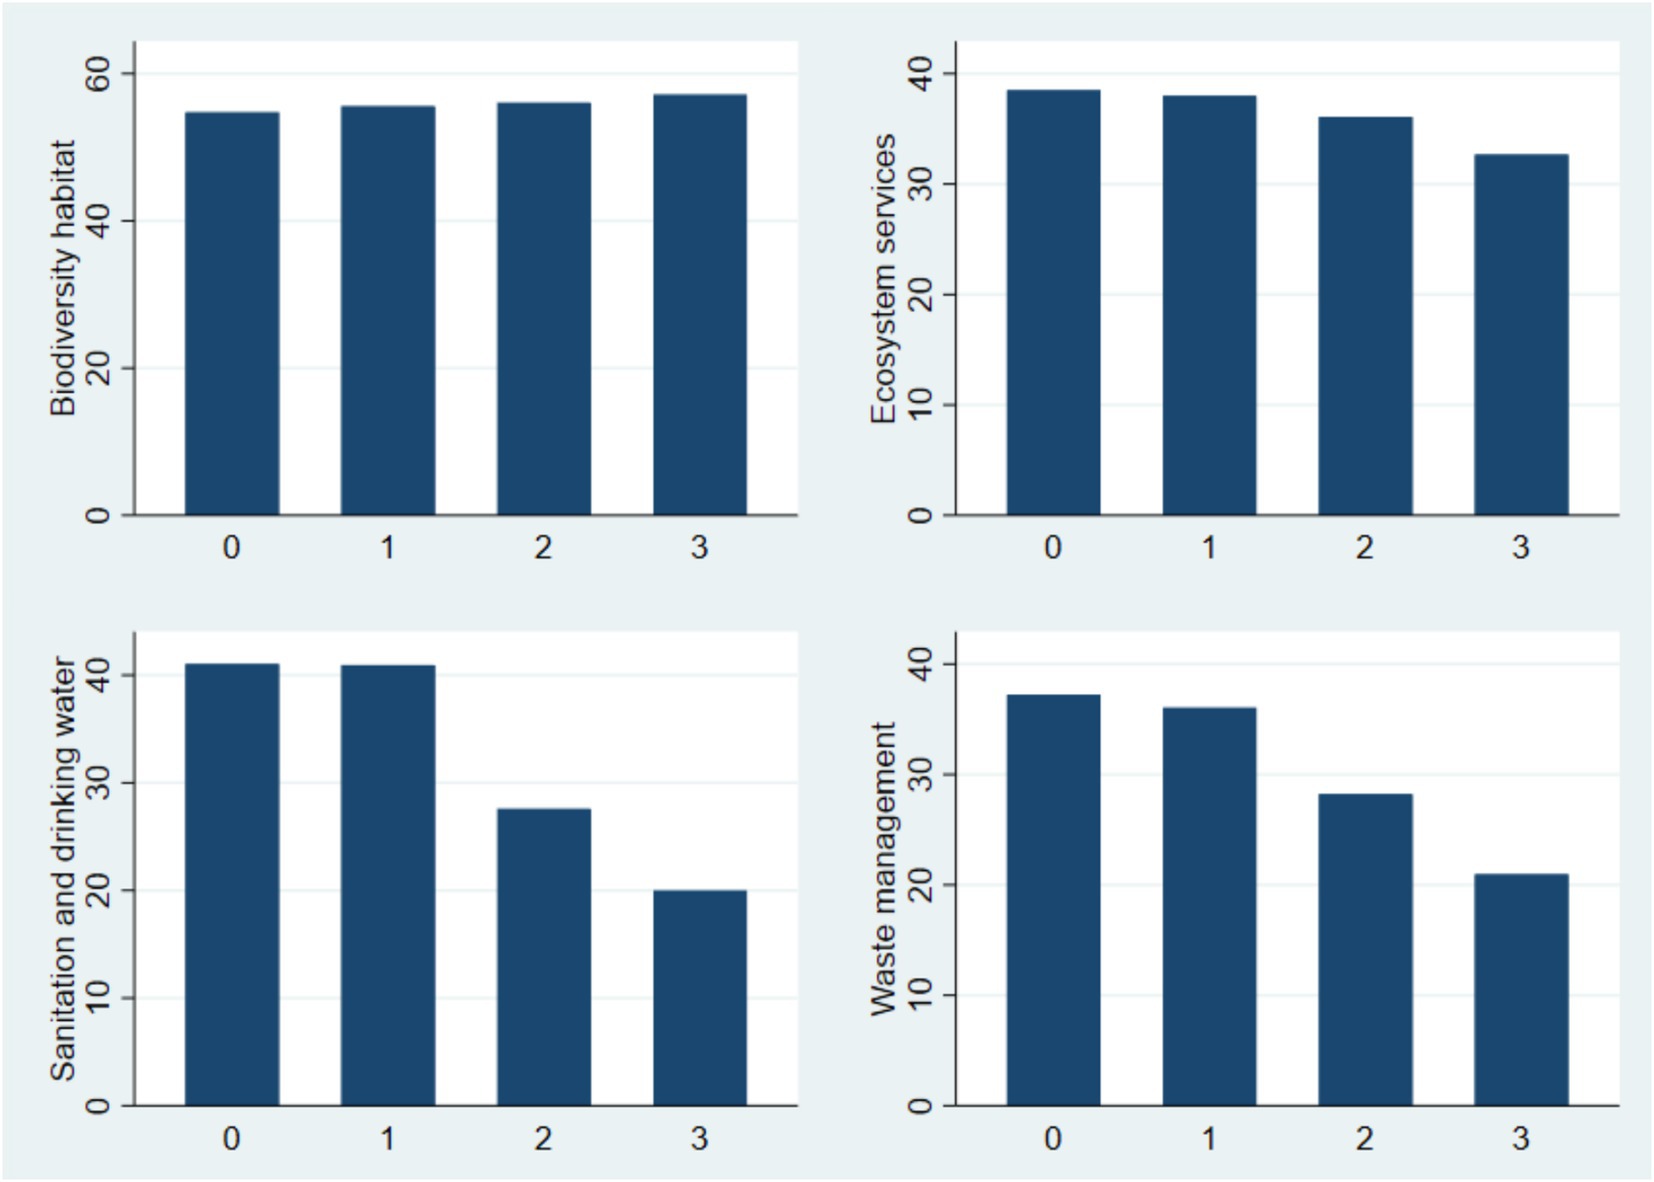
Figure 4. Bar plots showing the relationship between environmental indicators (Y-axis) and the frequency of outbreaks (X-axis). The Y-axis shows, for each frequency of outbreaks [from Torres Munguía et al. (2022)], the average of the environmental indexes across years for each country, averaged across countries. The four graphs show four components of the Environmental Performance Index: the Biodiversity habitat index, the Ecosystem index, the Sanitation and drinking water index and the Waste management index. See the Supplementary Material for a more detailed definition of each component. Source: Yale Center for Environmental law and Policy—YCELP—Yale University, and Center for International Earth Science Information Network—CIESIN—Columbia University (2020).
Concerning the globalization factors, namely, imports and international flights,12 Figure 5 shows a positive association of epidemic outbreaks with both globalization variables, which also is in line with our expectations.
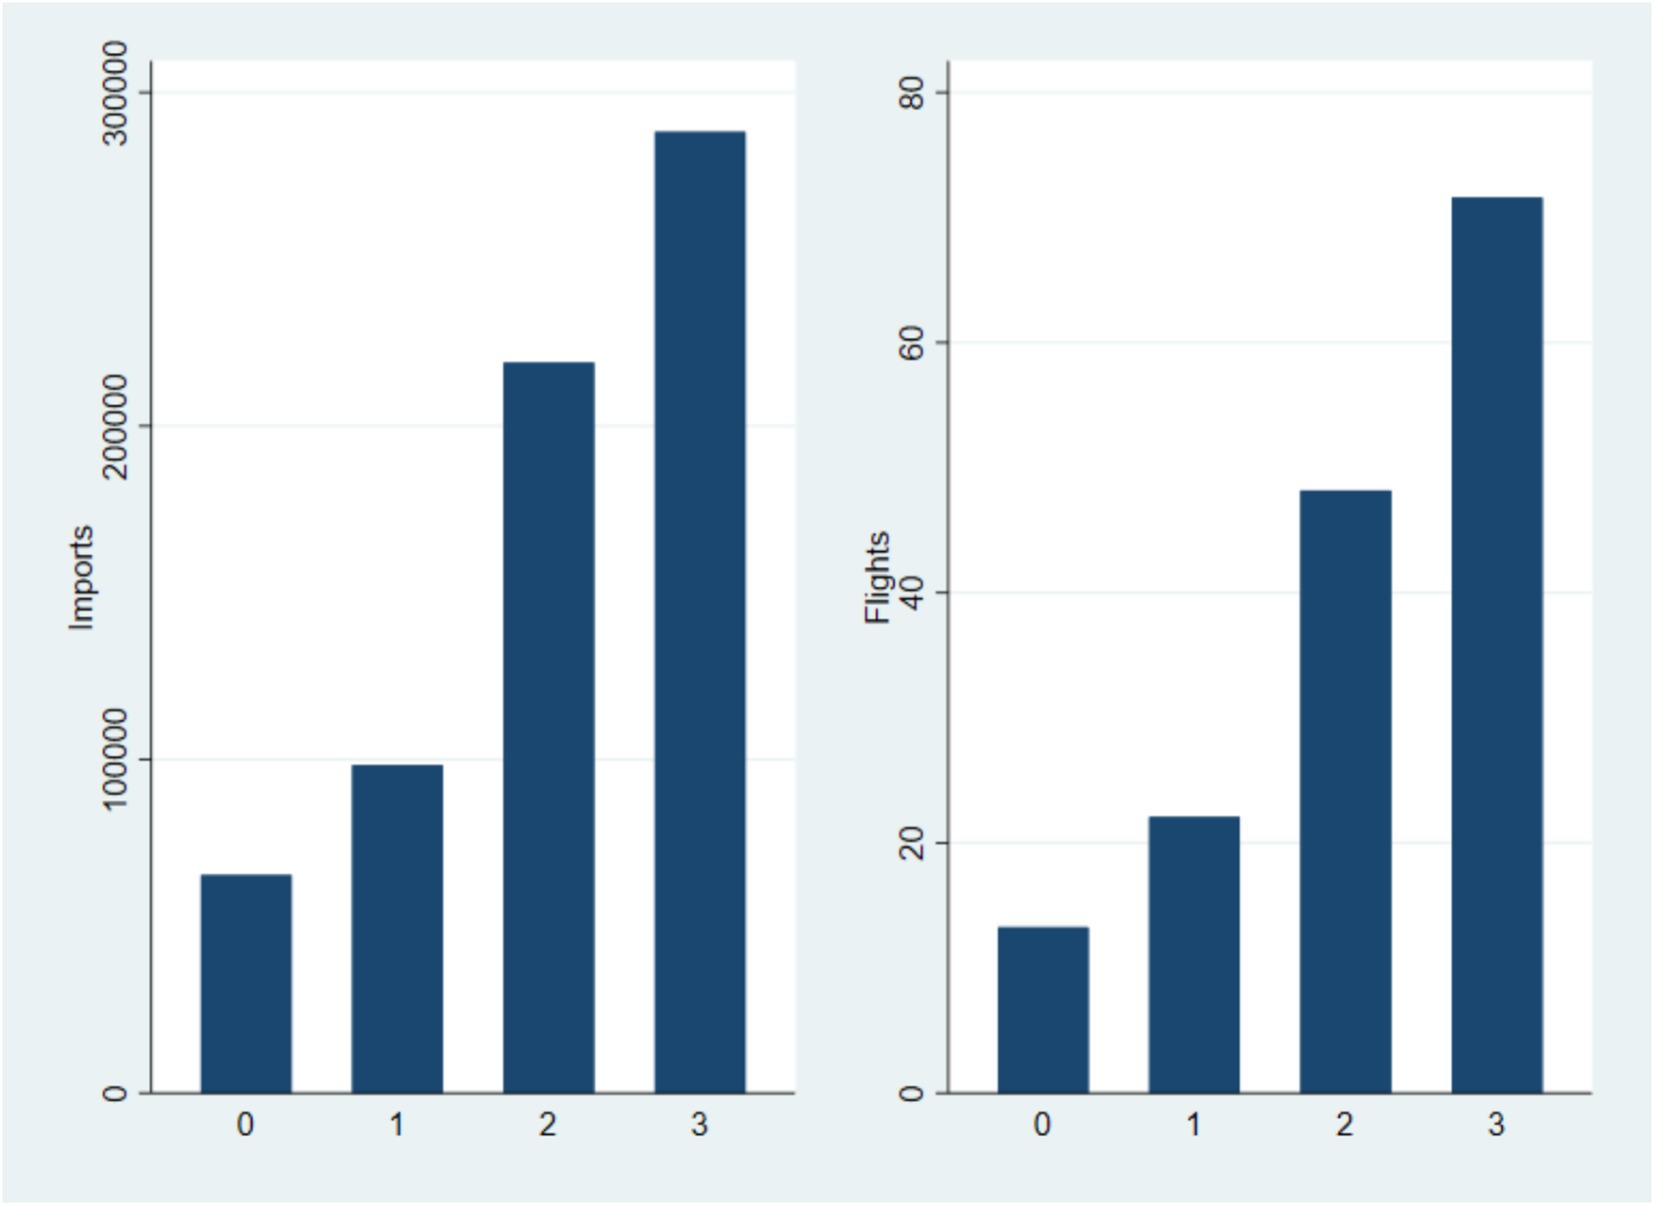
Figure 5. Relationship between globalization variables and the frequency of outbreaks. The figures in the X-axis refer to the average frequency of disease outbreaks per country and year from Torres Munguía et al. (2022). Imports from UN-COMTRADE are measured in millions of US dollars and flights in millions of passengers are from the Flights database (International Civil Aviation Organization).
The empirical strategy consists in estimating a Random Effects Poisson (RE-Poisson) model using the count variable of the frequency of outbreaks as the dependent variable. The two sets of explanatory factors include environmental and socio-economic variables. The environmental variables are “Biodiversity habitat,” “Ecosystem services,” and “Sanitation and drinking water,” which could affect the frequency of epidemics according to our theoretical framework. Furthermore, we include international flights and imports as proxies for globalization since they could increase the international contagion of epidemics. Globalization variables are added independently and sequentially in different estimations due to the high collinearity.13 Moreover, GDP per capita is included to control for the development level of countries, and we control for the urban population ratio in some specifications. These models include time fixed effects , while random effects are part of the error term. Finally, robust standard errors clustered at the country level are used to address potential autocorrelation and heteroskedasticity. The model specification is given by:
where Outbreaksit is the number of epidemic and pandemic outbreaks in country i at year t. Globalization is proxied with Imports, Flights (number of) in logs, and as robustness checks with a number of Globalization indices (in levels). Log denotes natural logarithms of the corresponding variables. denotes year-specific fixed effects that are common to all countries, such as global macroeconomic shocks. is a composite error term, denotes country-specific and time-invariant unobserved heterogeneity, and is the idiosyncratic component, which is assumed to be independently distributed.
The Poisson specification is used given the count nature of the dependent variable, frequency of epidemics, and pandemics. In addition, this method will address the potential bias produced by the non-random presence of zero epidemics in the dependent variable (Mnasri and Nechi, 2019) and will address the potential heteroskedasticity problem of the log specification due to the Jensen inequality (Silva and Tenreyro, 2006). The coefficients of the environmental indicators could be interpreted as semi-elasticities since they are in a discrete format and the globalization variables as elasticities since they are in logs. The Random Effects (RE) component assumes zero correlation between the unobservable heterogeneity and the explanatory variables while reporting a more efficient estimator than a Fixed Effects (FE) approach.
In order to test for the validity of the RE assumption, the orthogonality between the time-invariant component and the explanatory variables was tested using the correlated random-effects model, also called the Mundlak approach (Wooldridge, 2019, 2021). This consists of extending model (Equation 1) with the means of the time-variant explanatory variables and performing a joint test on the significance of the added means.14 The results of these regressions and the p-values of the joint significance tests can be found in Table A2 in the Appendix. They confirm that the means of the explanatory variables are not jointly significant. Hence, the unobserved heterogeneity is not correlated with the explanatory variables, which implies that the RE model provides consistent and more efficient estimates and is preferred to the extended model, which is equivalent to a FE estimator.
Table 3 presents the results of the RE-Poisson estimations of the impact of environmental and globalization variables on the frequency of outbreaks. In column (1), the only environmental variable that is statistically significant throughout is “Sanitation and drinking water” (significant at 1% level). It exhibits a negative coefficient, which means that countries with better performance on this indicator experience fewer epidemic outbreaks. “Biodiversity habitat” and “Ecosystem services” are estimated to have a positive and negative coefficient, respectively, but these results are not robust since they are only statistically significant when globalization is proxied by imports in columns (3) and (4). The positive correlation between the number of outbreaks and the “Biodiversity habitat” index might reflect the fact that zoonotic diseases are more frequent in biodiversity-rich environments where there is proximity between humans and animals. Furthermore, in column (1), one can observe that international flights have a strong positive correlation with outbreaks (statistically significant at the 1% level). These findings are robust to the inclusion of the urbanization ratio in column (2). Columns (3) and (4) of Table 3 use imports instead of international flights as a globalization variable, which also exhibits a positive association with the frequency of disease outbreaks (statistically significant at the 1% level).
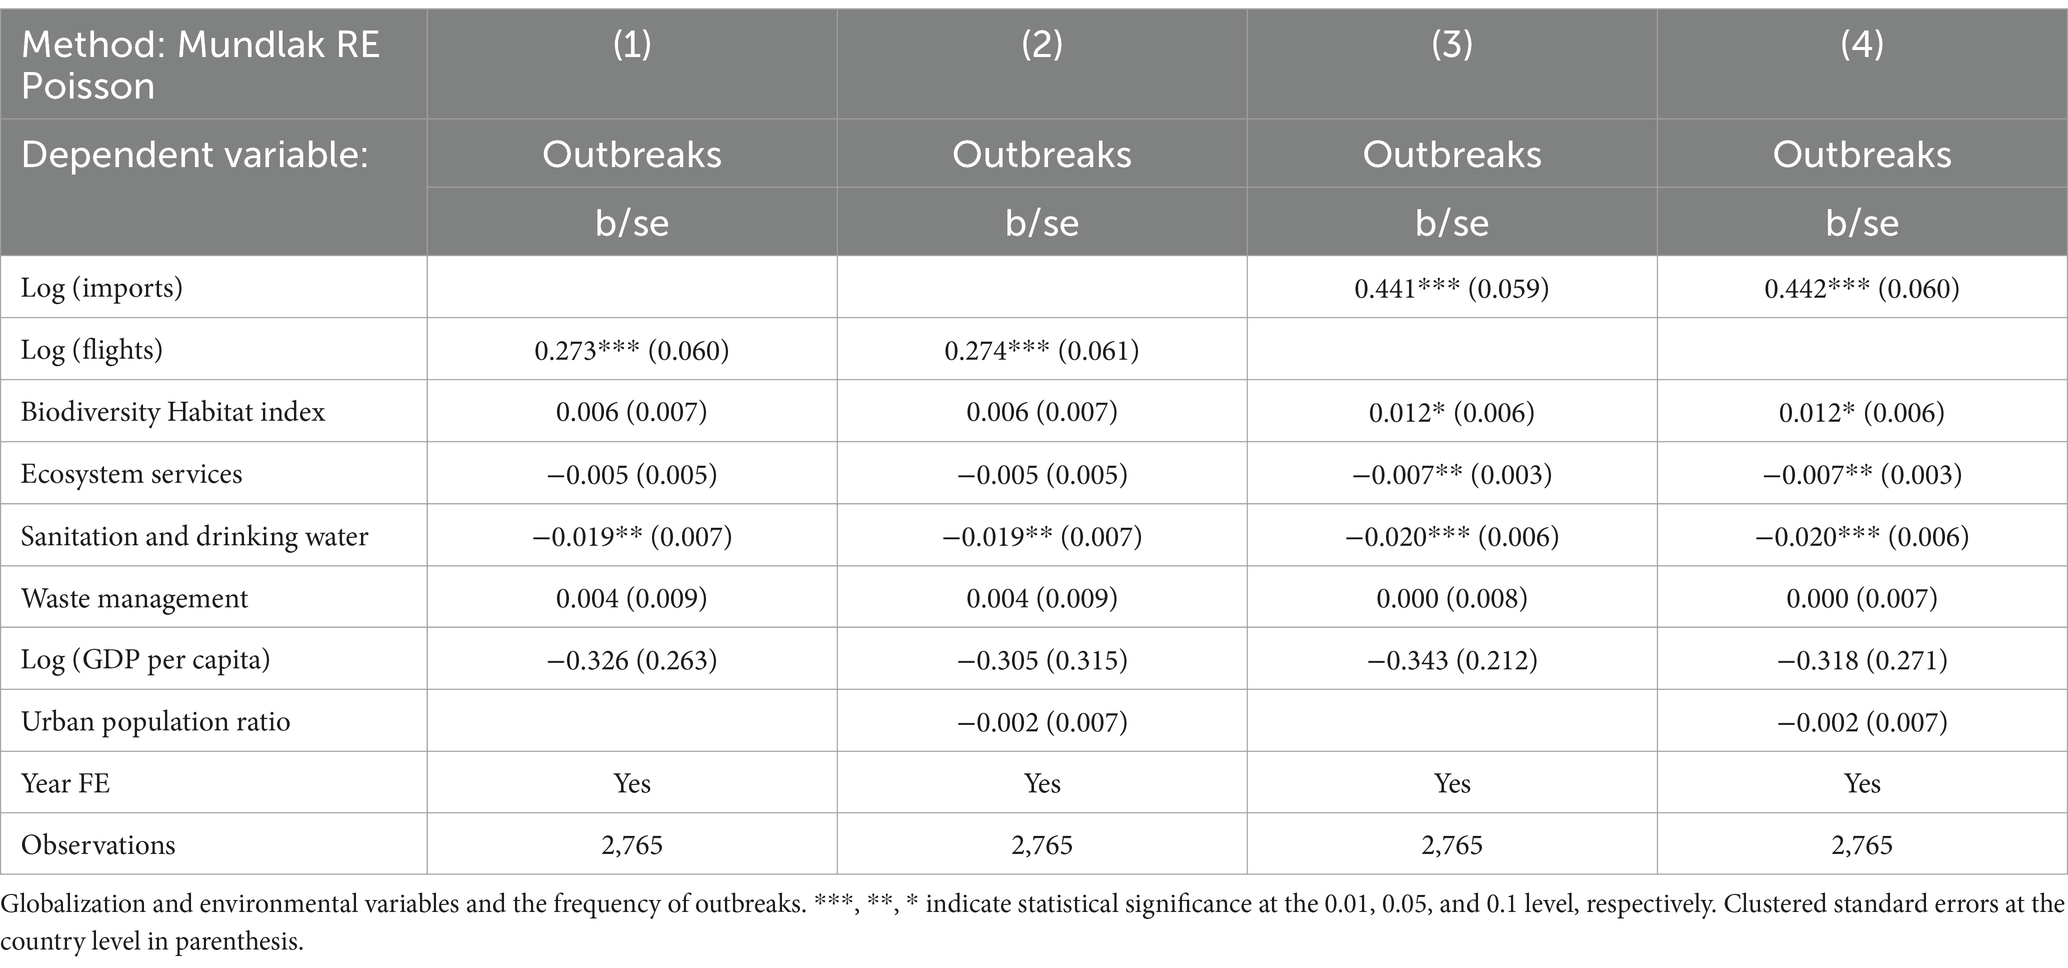
Table 3. Random effects Poisson estimations.
In terms of estimated magnitudes, an increase in the “Sanitation and drinking water” index by 1 percentage point (pp) is associated, ceteris paribus (c.p.), with a decrease of about 0.02 in the frequency of outbreaks according to results in columns (1)–(4). Moreover, an increase in international flights by 1% is associated, c.p., with an increase in the frequency of outbreaks by 0.27% in models (1) and (2), whereas the same proportionate increase in imports correlates with an increase in the frequency of outbreaks by 0.44% in models (3) and (4). Richer countries (in terms of GDP per capita) are expected to observe less disease outbreaks. Statistically, we cannot distinguish this association from being zero (at the 10% significance level), which likely reflects the high collinearity between GDP per capita and sanitation levels that inflates standard errors.
We present several robustness checks in the Supplementary Material. First, as an alternative model, we estimated the above-mentioned Mundlak-RE model that allows for potential correlation of the unobserved heterogeneity with the explanatory variables. Results are presented in Table A2 and confirm the relevant correlation with sanitation and drinking water conditions. In this augmented model, the positive parameter estimate for biodiversity habitat index is statistically significant in all four columns, while the association between disease outbreaks and imports does not appear to be robust.
Second, we perform between-group regressions to analyze the cross-sectional relationship between the variables (Greene, 2003). We therefore regress the time-averaged frequency of outbreaks on the time-averaged explanatory variables. The results of these regressions can be found in Table A3. The results are qualitatively similar to the main results presented in Table 3. Specifically, our sanitation and drinking water variable is negatively associated with the frequency of outbreaks while international flights and imports are positively associated. All these coefficient estimates are statistically significant.
Next, Table A4 shows the results obtained with alternative proxies for globalization, capturing economic and interpersonal globalization. While none of these globalization indices are statistically significant, the results concerning other globalization variables and ecological variables remain robust. Finally, in Table A5 we present estimations results from an alternative modeling strategy. Given the excess of zeroes in our dependent variable, the disease outbreaks, we have estimated a zero-inflated Poisson model. The model contains two parts: the first part models the determinants of the number of outbreaks and the second estimates the determinants of the existence of an outbreak using a logit model. As explanatory variables in the logit model we have considered waste management, urban population ratio, unsafe drinking water, air quality, and wastewater treatment. The model includes income-groups fixed effects and year fixed effects to control for unobserved heterogeneity. The results validate the key findings obtained in our main models.15
The growing importance of epidemic outbreaks, documented in this paper (see Figure 1), calls for new research on the determinants of those outbreaks at a global level. Whereas different disciplines have carefully evaluated specific factors, investigations that simultaneously include ecological, globalization, and economic variables are scarce. To fill this gap in the existing literature, we analyze key factors associated with epidemic and pandemic outbreaks in this paper using a sample of 195 countries and covering around 70 infectious diseases over the period 1996–2020. The main results indicate that the frequency of outbreaks is negatively correlated with improvements in sanitation and drinking water conditions but positively associated with a higher number of international flights and, possibly, international trade flows. Additional follow-up research is needed to substantiate clear policy conclusions, but several implications appear prudent to minimize the risk of future outbreaks considering our results. First, many local authorities should invest more in better sanitary conditions to prevent pandemic outbreaks, particularly in low and low-middle-income countries, since they have a big gap of potential improvement in this matter. Second, international aid directed to sanitation policies should be provided to these countries; hence, this is an uttermost relevant challenge for high-income countries and their development cooperation agencies since a reduction in the probability of future pandemics would benefit the world as a whole. Third, policies to restrict international flights should be considered palliative policies once outbreaks have been detected in their original location since the potential effects of reducing the international contagion are large, according to the results in this paper. Finally, concerning international trade, the data has acknowledged and supported that a slowdown in globalization trends has been in place in the last decade. Particularly after the Covid-19 outbreak, a restructuring of global value chains is emerging towards a more regionalized pattern. The findings suggest that this decreasing speed in the globalization process could be associated with a decrease in the transmission rate of global epidemics.
The data analyzed in this study was obtained from Yale Center for Environmental Law and Policy—YCELP—Yale University, and Center for International Earth Science Information Network—CIESIN—Columbia University (2020), the International Civil Aviation Organization (https://www.icao.int/sustainability/pages/eap-statistics-programme.aspx), UN COMTRADE database (https://comtradeplus.un.org/), United Nations Trade and Development Data Hub (https://unctadstat.unctad.org/datacentre/), the KOF Globalisation Index (https://kof.ethz.ch/en/forecasts-and-indicators/indicators/kof-globalisation-index.html), and the global dataset of pandemic and epidemic-prone diseases outbreaks (Torres Munguía et al., 2022) (https://data.humdata.org/dataset/global-pandemic-and-epidemic-outbreaks).
IM-Z: Supervision, Validation, Writing – review & editing. CB: Supervision, Validation, Writing – review & editing. LD: Formal analysis, Investigation, Methodology, Writing – original draft. JT: Data curation, Formal analysis, Investigation, Methodology, Writing – original draft. KW: Supervision, Validation, Writing – review & editing.
The author(s) declare that financial support was received for the research and/or publication of this article. All authors received funding from Entlight and Inmaculada Martínez-Zarzoso is grateful for the financial support received from the Generalitat Valenciana (project CIPROM/2022/50), the University Jaume I (project UJI-2023-30) and the Spanish Ministry of Science and Innovation (PID2023-147397NB-I00).
We acknowledge support by the Open Access Publication Funds of the Göttingen University, the Project Enlight ANR-20-GURE-0006 and GPR HOPE.
The authors declare that the research was conducted in the absence of any commercial or financial relationships that could be construed as a potential conflict of interest.
The author(s) declare that no Gen AI was used in the creation of this manuscript.
All claims expressed in this article are solely those of the authors and do not necessarily represent those of their affiliated organizations, or those of the publisher, the editors and the reviewers. Any product that may be evaluated in this article, or claim that may be made by its manufacturer, is not guaranteed or endorsed by the publisher.
The Supplementary material for this article can be found online at: https://www.frontiersin.org/articles/10.3389/fclim.2025.1504804/full#supplementary-material
1. ^Yale Center for Environmental law and Policy—YCELP—Yale University, and Center for International Earth Science Information Network—CIESIN—Columbia University (2020).
2. ^In terms of preventing GDP and live losses.
3. ^The net benefit under other scenarios is: 11.5 trillion dollars in the 50th percentile mortality forecast and 15.8 trillion dollars in the 97.5th percentile mortality forecast.
4. ^Available at https://data.humdata.org/dataset/global-pandemic-and-epidemic-outbreaks.
5. ^World Bank classification (Fantom and Serajuddin, 2016).
6. ^Therefore, it is considered as a time-invariant variable and has been excluded from the robustness analysis.
7. ^Our approach differs from the one in Agliardi et al. (2015), who constructed environmental indicators based on stochastic dominance.
8. ^These flights correspond to the total flights that enter and exit the countries.
9. ^Varies between 0 and 100.
10. ^Varies between 0 and 100.
11. ^The data are derived from Containerization International Online (until 2015) and MDS Transmodal (from 2016 onwards). It is not shown in the figure because it was only available for a few years and it is not used in the empirical analysis. The index takes values between 0.483 and 163.8. Since the original index is provided in quarterly frequency, we use the yearly average. It is not shown in the figure because it was only available for a few years and it is not used in the empirical analysis.
12. ^With imports in millions of US dollars and flights in millions of passengers.
13. ^The correlation coefficient between international flights and imports is 0.878.
14. ^Also known as the Mundlak or correlated RE approach (Wendling et al., 2020).
15. ^We would like to thank an anonymous referee for suggesting this estimation strategy.
Agliardi, E., Pinar, M., and Stengos, T. (2015). An environmental degradation index based on stochastic dominance. Empir. Econ. 48, 439–459. doi: 10.1007/s00181-014-0853-3
Dobson, A. P., Pimm, S. L., Hannah, L., Kaufman, L., Ahumada, J. A., Ando, A. W., et al. (2020). Ecology and economics for pandemic prevention. Science 369, 379–381. doi: 10.1126/science.abc3189
Fantom, Neil James, and Serajuddin, Umar, The World Bank's Classification of Countries by Income (2016). World Bank Policy Research Working Paper No. 7528, Available at SSRN: https://ssrn.com/abstract=2741183 (January 4, 2016)
Faust, C. L., McCallum, H. I., Bloomfield, L. S. P., Gottdenker, N. L., Gillespie, T. L., Torney, C. J., et al. (2018). Pathogen spillover during land conversion. Ecol. Lett. 21, 471–483. doi: 10.1111/ele.12904
Fawell, J., Bailey, K., Chilton, J., Dahi, E., Fewtrell, L., and Magara, Y. (2001). Water quality: guidelines, standards & health. World Health Organization.
Greene, W. H. (2003). Econometric analysis. Pearson education. Inc., Upper Saddle River, New Jersey, 7458.
Gygli,, Savina,, Haelg, F., Potrafke, N., and Sturm, J-E. (2019). The KOF Globalisation Index – Revisited. Rev. Intern. Organiz. 14, 543–574. doi: 10.1007/s11558-019-09344-2
Hufnagel, L., Brockmann, D., and Geisel, T. (2004). Forecast and control of epidemics in a globalized world. Proc. Natl. Acad. Sci. 101, 15124–15129. doi: 10.1073/pnas.0308344101
International Civil Aviation Organization. (2024). Aviation Data. Available at: https://www.icao.int/sustainability/pages/eap-statistics-programme.aspx
Mari, L., Bertuzzo, E., Righetto, L., Casagrandi, R., Gatto, M., Rodriguez-Iturbe, I., et al. (2012). Modelling cholera epidemics: the role of waterways, human mobility and sanitation. J. R. Soc. Interface 9, 376–388. doi: 10.1098/rsif.2011.0304
Mnasri, A., and Nechi, S. (2019). New approach to estimating gravity models with heteroscedasticity and zero trade values. MPRA Paper 93426,. Germany: University Library of Munich.
Sforza, A., and Steininger, M. (2020). Globalization in the time of COVID-19. CESifo Working Paper No. 8184. Available at: https://papers.ssrn.com/sol3/papers.cfm?abstract_id=3567558
Silva, J. S., and Tenreyro, S. (2006). The log of gravity. Rev. Econ. Stat. 88, 641–658. doi: 10.1162/rest.88.4.641
Tollefson, J. (2020). Why deforestation and extinctions make pandemics more likely? Nature 584, 175–176. doi: 10.1038/d41586-020-02341-1
Torres Munguía, J. A., Badarau, F. C., Díaz Pavez, L. R., Martínez-Zarzoso, I., and Wacker, K. M. (2022). A global dataset of pandemic-and epidemic-prone disease outbreaks. Sci. Data 9:683. doi: 10.1038/s41597-022-01797-2
UN COMTRADE. (2024). UN Comtrade Database. Available at: https://comtradeplus.un.org/
United Nations Conference on Trade and Development (UNCTAD). (2024). United Nations Trade and Development Data Hub. Available at: https://unctadstat.unctad.org/datacentre/
Watson, J. T., Gayer, M., and Connolly, M. A. (2007). Epidemics after natural disasters. Emerg. Infect. Dis. 13, 1–5. doi: 10.3201/eid1301.060779
Weiss, R. A., and McMichael, A. J. (2004). Social and environmental risk factors in the emergence of infectious diseases. Nat. Med. 10, S70–S76. doi: 10.1038/nm1150
Wendling, Z. A., Emerson, J. W., de Sherbinin, A., Esty, D. C., Block,, and Sebastián,. (2020). Environmental performance index. New Haven, CT: Yale Center for Environmental Law & Policy. Available online at: https://epi.yale.edu/
Wooldridge, J. M. (2019). Correlated random effects models with unbalanced panels. J. Econ. 211, 137–150. doi: 10.1016/j.jeconom.2018.12.010
Wooldridge, J., (2021). Two-way fixed effects, the two-way Mundlak regression, and difference-in-differences estimators. Working Paper. Available at SSRN 3906345.
Keywords: COVID-19, epidemics, pandemics, outbreaks, sanitation, water, biodiversity, globalization
Citation: Martínez-Zarzoso I, Badarau C, Díaz Pavez LR, Torres Munguía JA and Wacker K (2025) Pandemics and environmental performance in a globalized world. Front. Clim. 7:1504804. doi: 10.3389/fclim.2025.1504804
Edited by:
Zahid Butt, University of Waterloo, CanadaReviewed by:
Federico Carril Caccia, University of Granada, SpainCopyright © 2025 Martínez-Zarzoso, Badarau, Díaz Pavez, Torres Munguía and Wacker. This is an open-access article distributed under the terms of the Creative Commons Attribution License (CC BY). The use, distribution or reproduction in other forums is permitted, provided the original author(s) and the copyright owner(s) are credited and that the original publication in this journal is cited, in accordance with accepted academic practice. No use, distribution or reproduction is permitted which does not comply with these terms.
*Correspondence: Inma Martínez-Zarzoso, aW1hcnRpbkBnd2RnLmRl
Disclaimer: All claims expressed in this article are solely those of the authors and do not necessarily represent those of their affiliated organizations, or those of the publisher, the editors and the reviewers. Any product that may be evaluated in this article or claim that may be made by its manufacturer is not guaranteed or endorsed by the publisher.
Research integrity at Frontiers
Learn more about the work of our research integrity team to safeguard the quality of each article we publish.