 Ann Rigmor Nerheim
94% of researchers rate our articles as excellent or good
Learn more about the work of our research integrity team to safeguard the quality of each article we publish.
Find out more
ORIGINAL RESEARCH article
Front. Clim., 27 January 2025
Sec. Climate Detection and Attribution
Volume 7 - 2025 | https://doi.org/10.3389/fclim.2025.1495611
This paper presents new temperature data from a location on the northwest coast of Norway from the period 1880–1930. The data are based on diary notes of weekly temperature ranges. Maximum and minimum temperatures have been investigated, as well as weekly, monthly, and yearly average temperatures. The data indicate a decreasing yearly average temperature trend during the period from 1880 to 1930. Due to the origin of the data, the accuracy of the thermometer and readings are unknown.
This paper is based on data collected from the diaries of my great-grandfather Kristen Fagervik (1855–1942). He was a farmer in Fagervik, Tresfjord, on the northwest coast of Norway (62°N, 7°E, ref. Figure 1). Around the year 1870, he started writing a diary with weekly summaries describing the weather, activities on the farm, events in the village, and news from Norway and abroad. From April 1880 he also added temperature data in his notes and continued writing the diary until 1930. In general, he wrote down the temperature range per week. This is given as the week's minimum and/or maximum temperature, and sometimes only the “dominant” temperature.
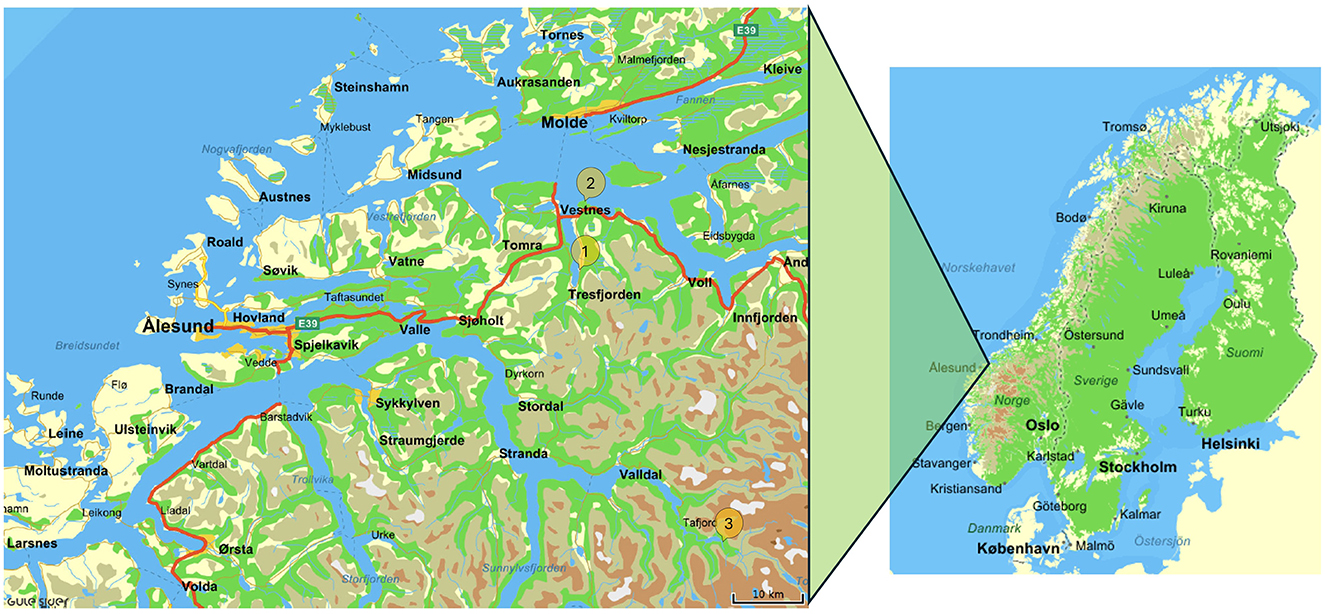
Figure 1. The temperature data in the diaries were collected in Fagervik (1). Map from GuleSider (2024).
Although these notes were never meant to be used as scientific data, I believe they are of high enough quality to contribute to our understanding of temperature trends in this region of Norway. From this area, I have not found any other temperature data from as far back as the 1880s and continuing for so long. Furthermore, it was not possible to find temperature data overlapping with the diary data and extending up to our time, from this region. Similar studies with data collected from diaries have been done in Switzerland for the period 1708–1873 (Brugnara et al., 2020) and in Greenland, for the period 1767–1792 (Przybylak et al., 2024). However, these registrations were undertaken for meteorological purposes, and are therefore more systematic concerning e.g. time of reading the temperature. According to Camuffo and Bertolin (2012), the first known systematic temperature observations were performed in 1654-1670 in an international network of 11 stations in Italy, France, Austria, and Poland. Since then, both the instruments and methodology for temperature measurements have developed.
Temperature data from the time before the establishment of official meteorological stations are scarce and may be incomplete, but can nonetheless add valuable information about the historical natural variation in temperature and trends in the average temperatures. For Norway, there is little temperature data available prior to 1930. The objective of this work was therefore to digitalize the diary data and use it to investigate the air temperature variations prior to 1930 and extending over a long period of time. The goal was to find out if the local air temperature has changed over time, and/or if it fluctuates more or less than before.
Since these diaries and data were never intended for other than my great-grandfather's own use, there is no explanation of how the temperatures were measured. Hence, there is no description of the type of thermometer, whether it was replaced at any point during the 50 years, its location, screening (sun, shadow), or time of reading.
Geographical details of the farm location are shown in the map in Figure 2. The main building of the farm is located close by the fjord on the west side, and close to a steep hillside on the east side. During the diary period, there were no trees around the house that could affect the local climate and the temperature readings. The exact siting of the thermometer is not known. However, the most probable location is by the door on the east side of the old house shown in Figure 3.
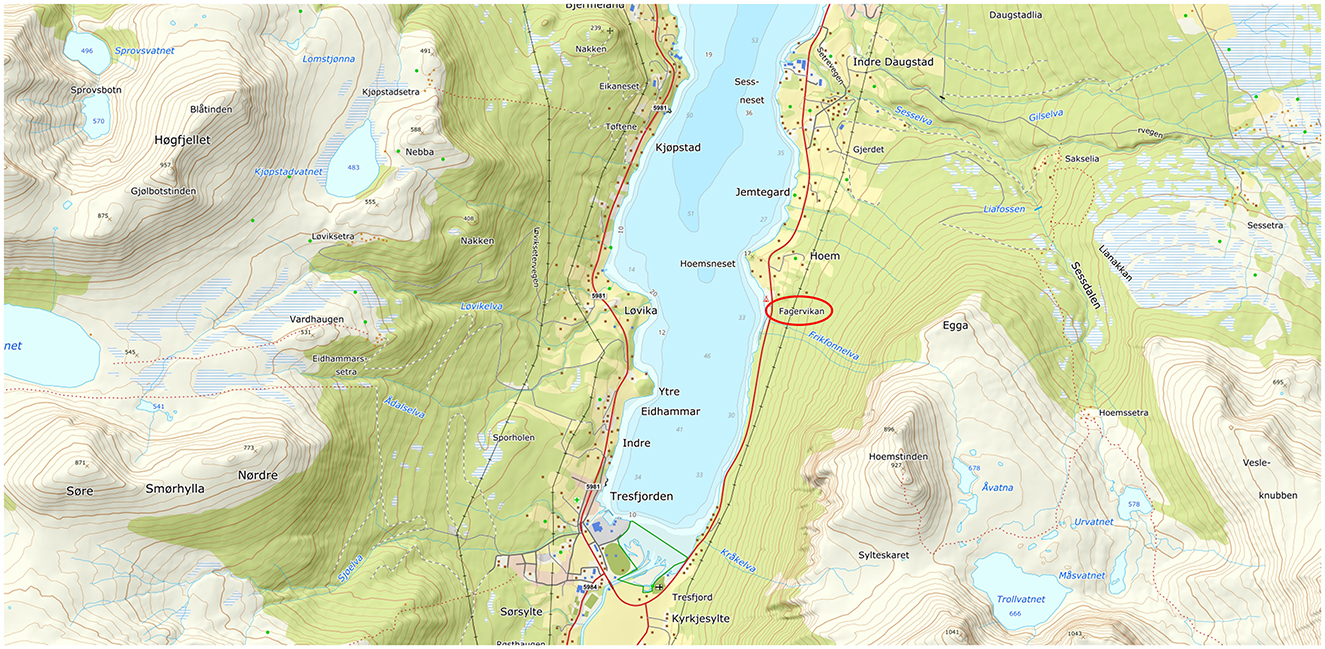
Figure 2. The farm is located with the fjord on the west side and a steep hillside on the east side of the house. Map from Kartverket (2024).
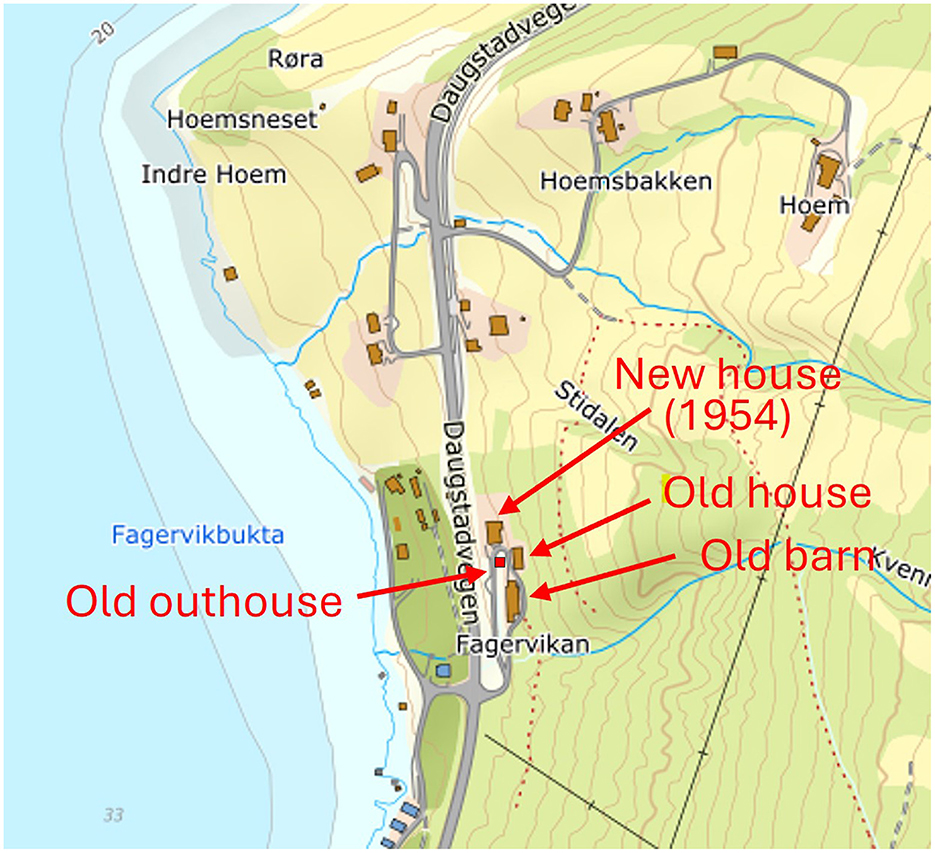
Figure 3. During the period of the diary, the farm consisted of the old farmhouse, the old barn, and an outhouse. Map from Kartverket (2024).
The temperatures in the diary are given as a temperature interval per week. Sometimes, individual notes are given on some of the weekdays, and sometimes minimum and/or maximum temperatures are specified. The temperature intervals must therefore be treated as his individual observation of the “typical” temperature range of the week. When digitizing the data, this temperature range has been divided into a “minimum” and “maximum” temperature.
Furthermore, the temperature data are not necessarily systematically collected at the same time each day. The data may therefore to some degree have been affected by subjective perception and memory at the end of the week when the weekly summary was written. However, the notes on the temperature ranges are believed to be representative of the week and are therefore used as the basis for the current analyses. Since the data were collected by the same person at the same location from 1880 to 1930 the quality of the data is believed to be sufficient to identify potential temperature trends.
In the diary, the weeks start on Sunday. However, the official week numbers start on Monday. When week numbers are referred to in various graphs, the week number for Monday–Sunday is used with the data for Sunday–Saturday. This bias is avoided when using the average temperature per month.
All temperature data in the diary are given in °R, but there are no further descriptions of the unit or the instrument used. At the time of the start of the diary, several different temperature scales were in use in Norway. These were Fahrenheit, Rankine, Reaumur, and Rømer, which in theory all could have been used. Since the temperatures are denoted °R it is unlikely that Fahrenheit was used. The correct temperature scale can be identified by evaluating the reported temperature ranges in the diary, as illustrated in Figure 4 using conversion formulas from Metric Conversions (2024). In the region where the data were collected, normal air temperatures typically vary between +25°C in summer to –10°C in winter, and sometimes down to –20°C in extreme cold weather. The minimum temperature in the diary is –17°R. Using the Rømer scale –17°R corresponds to –47°C, and using the Rankine scale gives –283°C, which are both unrealistic. The Reaumur scale converts –17°R to –21.25°C, which is realistic. Hence, it was concluded that the scale used in the diaries is Reaumur, which is defined by the freezing point of water (0°R) and the boiling point of water (80°R). The conversion of °R to °C is given by Equation 1, where TC is the temperature in °C and TR is the temperature in Reaumur, °R.
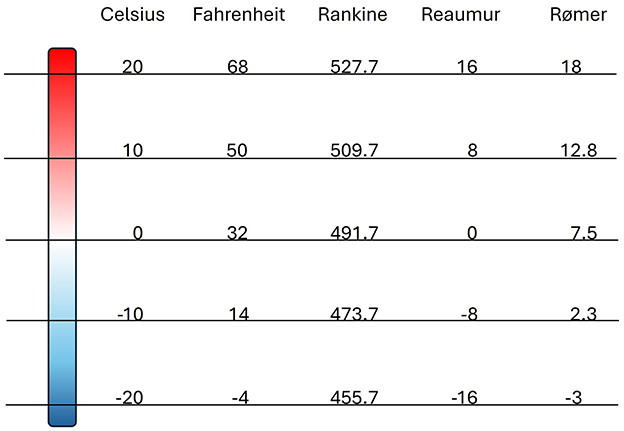
Figure 4. Comparison of different temperature scales. Conversions from Metric Conversions (2024).
In the diary, some weeks are only given a maximum or a minimum temperature. For these weeks the average weekly temperature has not been calculated. Other entries in the diary give only a “mean” temperature for the week, i.e., the subjective dominant temperature of the week. This is included as a weekly average temperature together with the other calculated averages. Since there is no information about the thermometer the accuracy is unknown. For the same reason, no data calibration has been attempted, other than converting from Reaumur to Celsius scale.
For investigating long-term trends it was desirable to compare the present data with other data sources up to 2024, and overlapping the diary data e.g., from 1920 to 1930. The north-west coast of Norway is famous for its high mountains and deep fjords. This landscape makes the weather vary significantly over relatively short distances due to local weather effects. A comparable data source should therefore be located in the same area as the farm. One such data source has been found at Gjermundnes, approximately 11 km from Fagervik. The data may be downloaded from the website of the Norwegian Centre for Climate Services (2024). Unfortunately, the data from Gjermundnes are only from June 1934 to June 1972 and do not overlap with the diary data.
From the same website temperature data are also available for Molde, a town near Fagervik. Molde is located on the north side of the Romsdalsfjord and could be similar to Fagervik in climate. However, these data are from three time series from three different locations and do therefore not fit the purpose of validation here (Norwegian Centre for Climate Services, 2024).
Andalsnes is another nearby station but does not have long enough records. The station in Tafjord has records from July 1930 and is still operating (Norwegian Centre for Climate Services, 2024). However, Tafjord is located far away from Fagervik, further into the fjords, and therefore may have a different climate. The same holds for the stations in Ona and Alesund, which both may have long records but have a very different local climate. Both these stations are located further out on the coast to the North Sea, and more distant from the mountains. Hence, they have more wind, milder winters, and colder summers. Because of the lack of data from the same period and the nearby area, only the diary data will be presented here.
Due to the uncertainty of the time of day of temperature measurements, the diary data must be analyzed with care. Since the data have been read by the same person and in the same location, the most interesting analysis is to look for trends within the dataset. Such trends can be investigated by analyzing the registered maximum and minimum temperatures and the calculated average temperatures.
In addition to the minimum and maximum temperatures, the average temperature per week, month, and year have been used in the analyses. The average temperature per week, TAv−w, has been calculated as the average of the minimum and maximum temperatures observed for the given week, as given in Equation 2, where Tmin is the minimum temperature in °C and Tmax is the maximum temperature in °C for a given week.
The monthly (TAv−m) and yearly (TAv−y) average temperatures have been calculated, as described by Equations 3, 4, where N equals 4 or 5 depending on the month. For analysing the variation in the spread of the data, the standard deviation (STDEV.P) has been calculated as given by Equation 5.
The temperature ranges given in the diary were converted into maximum and minimum temperatures, and thereafter the weekly, monthly, and yearly average temperatures were calculated according to Equations 2–4.
Maximum temperatures per week are plotted in Figure 5 and minimum temperatures per week are plotted in Figure 6. Sometimes temperature data were not recorded for a week, or the data was unclear. This is the reason for the discontinuities in the graphs. The lowest single temperature registered is –21.3°C (–17°R), in week 9 in 1881, i.e. in the change of month from February to March. During this week, the temperature rose to 15°C (12°R), giving a weekly average temperature of –3.1.
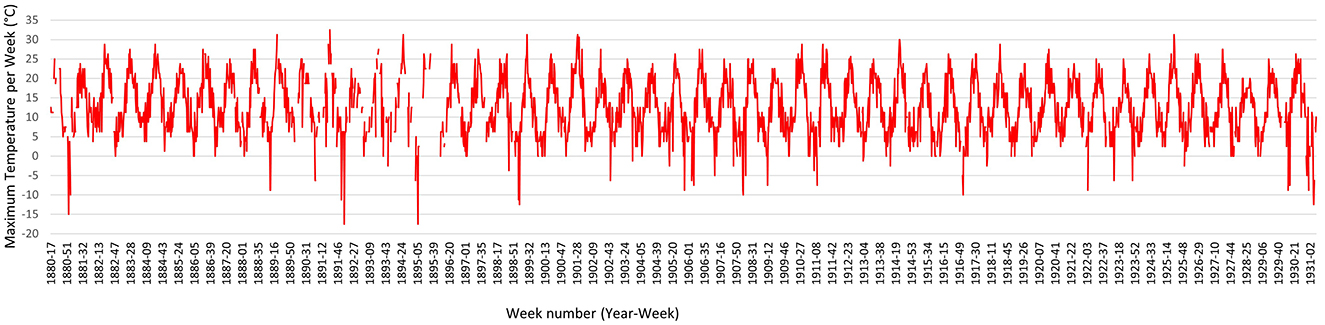
Figure 5. Registered maximum temperatures (°C) at location Fagervik from 1880 to 1931.
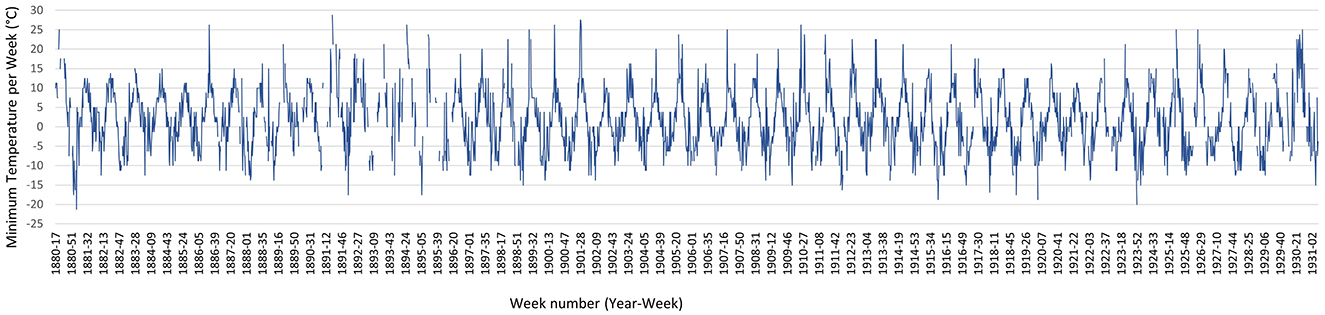
Figure 6. Registered minimum temperatures (°C) at location Fagervik from 1880 to 1931.
The highest single temperature registered is 32.5°C (26°R) in week 29 in 1891, i.e. the week between July 12 and 18. For this registration, a minimum temperature is not given in the diary. Hence, the average weekly temperature has not been calculated for this week.
Figure 7 shows the calculated weekly average temperatures. The lowest weekly average temperature is –17.5°C (–14°R) in week 7 in 1892 and week 6 in 1895. For these weeks the diary only gives the dominant weekly temperature. Hence, these temperatures are not calculated from a minimum and maximum temperature for the given week. The highest weekly average temperature calculated is 29.1°C in week 29 in 1901, where the temperature varies from 27.5°C to 30.6°C (22–24.5°R).
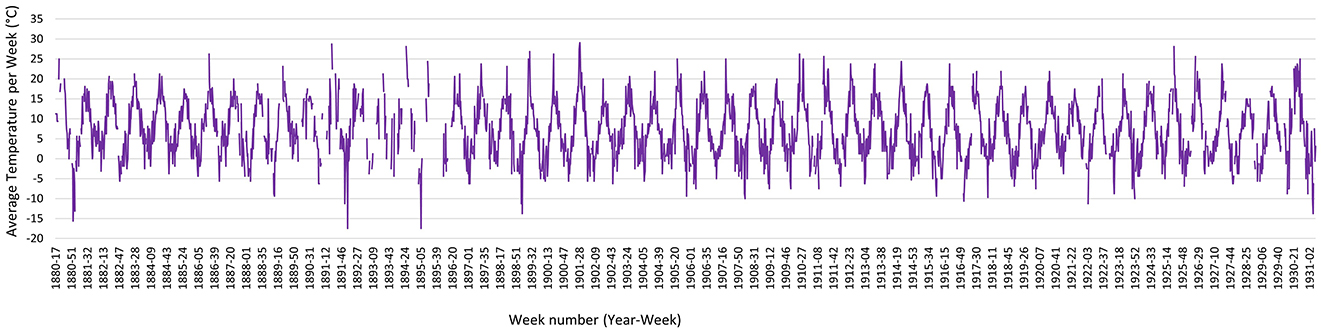
Figure 7. Weekly average temperatures (°C) at location Fagervik from 1880 to 1930.
Temperature measurements may be biased by poor siting, which exposes the thermometer to e.g., seasonal effects from vegetation and paved surfaces (Mahmood et al., 2006). Studies have shown that such bias can lead to overestimation of minimum temperature trends and underestimation of maximum temperature trends, while average temperature trends are relatively unaffected (Fall et al., 2011). Since there is no information about the exact siting of the thermometer used for the diary data, monthly average temperatures may therefore be the preferred basis in this work.
In Figure 8 the monthly average temperatures are plotted as one time series for the whole period 1880–1930. The figure shows that the average monthly temperature normally varies between –5 to 20°C during the year, with some seemingly random spikes. The variations in monthly average temperature are illustrated in Figure 9, where the horizontal axis shows the months (1–12) and the vertical axis shows the monthly average temperature in °C. Temperatures higher or lower than the mean have been marked with a label with the year number. This indicates that the highest monthly average temperature was registered in July 1901, but high temperatures above 20°C in June–August were also registered in 1880, 1891, 1893, 1894, 1895, 1926, and 1930.
Figure 8. Average temperature per month (°C). The horizontal axis shows Year-Month from 1880 to 1930.
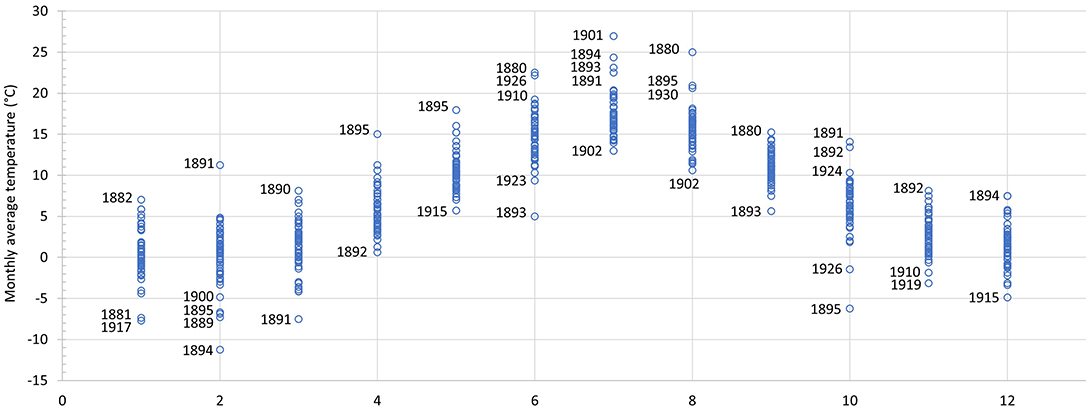
Figure 9. Average temperature per month for the whole diary dataset. The horizontal axis shows the month (1–12) and the vertical axis shows the monthly average temperature (°C) from 1880 to 1931.
Yearly average temperatures are shown in Figure 10, where the dotted line shows the result of a regression analysis. As shown in the figure, the R-value is low, which means poor fitting of the data to the function. Therefore, the fitted line should only be used to observe rough trends in the data. Here, the data show a declining trend for the period 1880–1930, i.e., decreasing yearly average temperature.
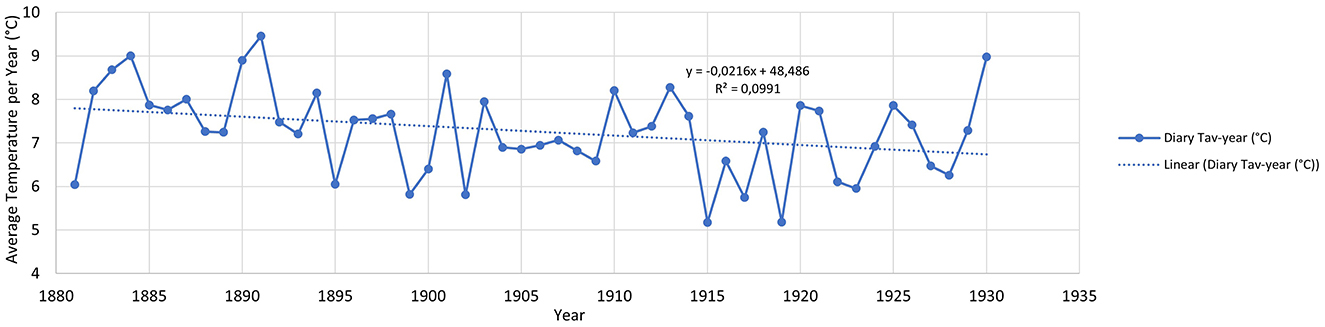
Figure 10. Average temperature per year (°C). The dotted line shows simple linear curve fitting of the data series.
In Figure 11 the standard deviation of the data is given over a 10-year period. The standard deviation was calculated based on data from 10 years (9 years for Jan, Feb., and March, since the first data records are from April 1880). February, March, and October show significantly higher standard deviation in the period 1890–1899 than in the other periods. The largest variation in standard deviation is for February, which varies between 1.8 and 5.6. Except for June and July, the plotted standard deviation shows a declining or stable trend from 1890 to 1930.
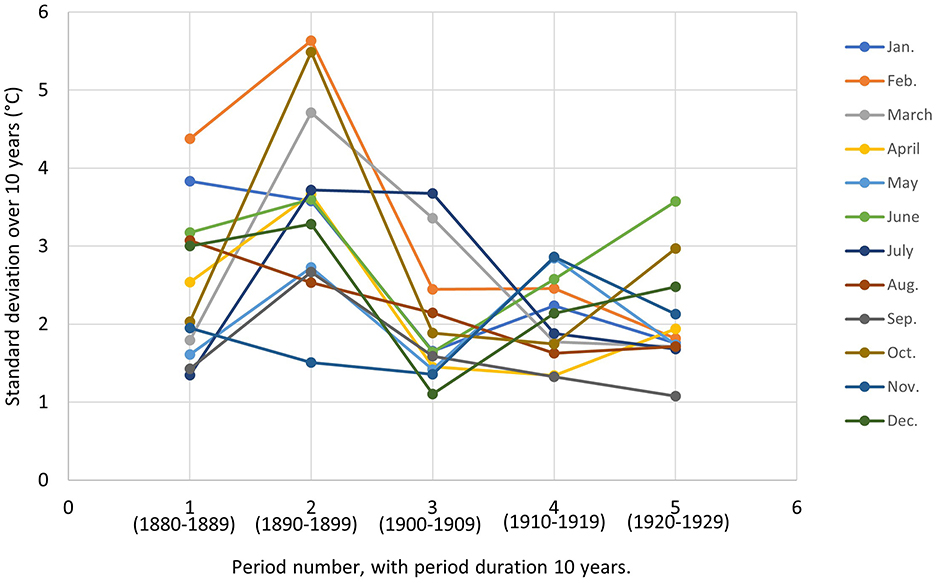
Figure 11. Standard deviation of temperature data per month for 10-year periods, starting from 1880. All data are from the diaries.
To investigate the variation in standard deviation, the average monthly temperatures for all months are plotted in Figures 12–15, together with linear curve fitting. The curve-fitting formula and R-values are shown as labels in the graphs. For some years, the average temperatures of some months are missing due to a lack of data. This applies to June 1889, July 1895, November 1895, and December 1929.
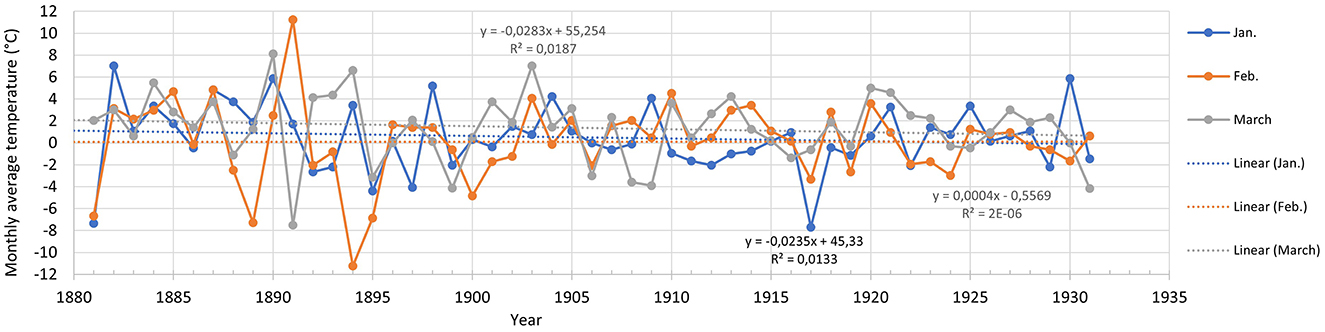
Figure 12. Average temperature (°C) of January, February, and March based on data from the diaries. The dotted lines show simple linear curve fitting of the data series.
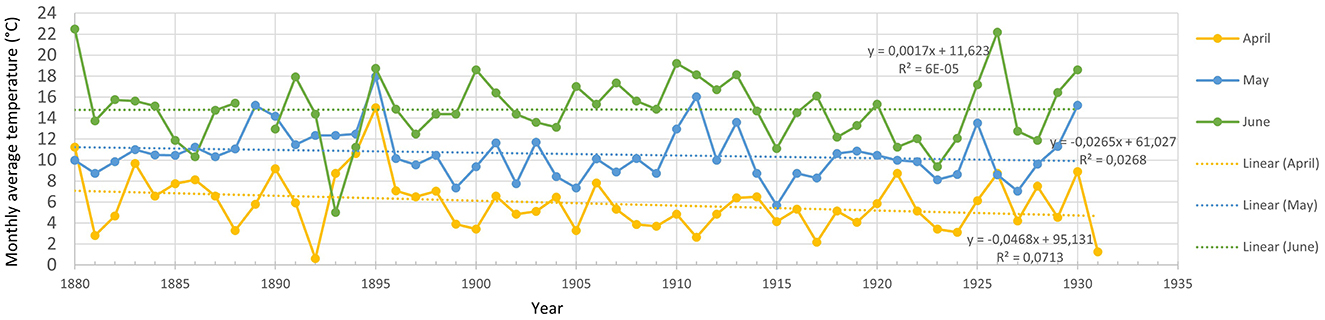
Figure 13. Average temperature (°C) of April, May, and June based on data from the diaries. The dotted lines show simple linear curve fitting of the data series.
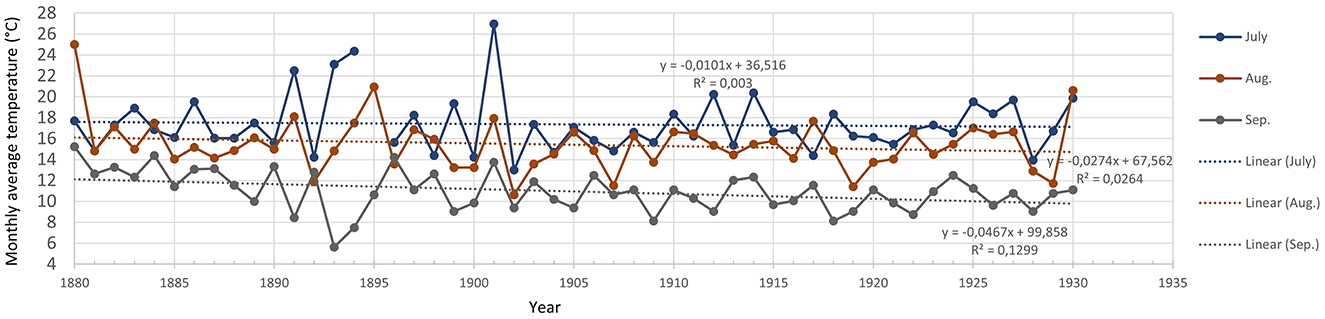
Figure 14. Average temperature (°C) of July, August, and September based on data from the diaries. The dotted lines show simple linear curve fitting of the data series.
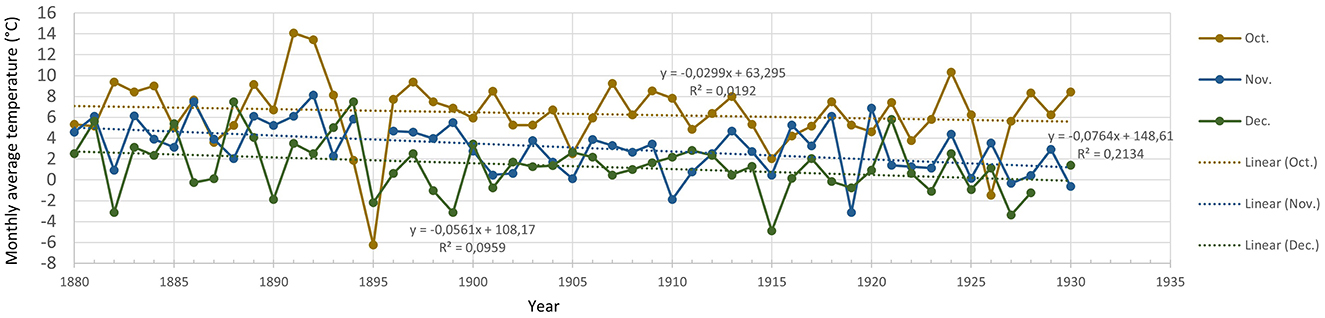
Figure 15. Average temperature (°C) of October, November, and December based on data from the diaries. The dotted lines show simple linear curve fitting of the data series.
Figure 12 shows that the large deviations in the February data in Figure 11 are most likely due to the high temperature in 1891 and the low temperatures in 1881, 1889, 1894, and 1895. The linear curve fitting resulted in a nearly horizontal line at 0°C, indicating a stable trend for average temperatures of February. However, the R-value of the linear curve fitting is low, as shown in the figure, and the resulting trend line is therefore highly uncertain.
As shown in Figures 12–15, the curve fitting is in general poor for all months. The highest R-value is 0.2 for November. This month is also the one with the largest negative slope (–0.08), giving a temperature reduction of 4°C over the period 1880–1930. Except for February and June, the curve fitting gave a negative slope for all months. For February and June, the R-value is significantly lower than for the rest of the graphs. The other 10 trend lines all have higher R-values, and all give a negative slope, i.e., a temperature reduction over the given period. Hence, the trends for these 10 individual months all show a negative trend, similar to the trendline of the yearly average temperatures of Figure 10, but all with different slopes.
The results indicate that the observed decrease in yearly average temperatures is due to a decrease in monthly average temperatures in all months except February and June. However, this result could also be affected by the potential degradation of the thermometer used. The Reaumur thermometer was made of glass material filled with alcohol diluted with water (Wright, 2016). A description of the development of the Reaumur thermometer and the challenges with its calibration is given by Camuffo (2020). Literature on the long-term accuracy of the thermometer has not been found. It is reasonable to believe that damage to the glass, such as small cracks, could cause systematic changes in the measured temperature, but the rate of such changes is uncertain. Also, the stability of the liquid in the thermometer is unknown to the author. The possible causes for a potential degradation of the thermometer and the effects of these must be further investigated to draw any conclusions.
Temperature data from one location on the Northwest coast of Norway has been collected from private diaries from the period 1880 to 1930 and digitalized. It was not possible to find other relevant temperature data from the same time period and geographical area to compare the diary data against. The data in the diaries consist of temperature ranges given per week. Based on these data, weekly, monthly, and yearly average temperatures have been calculated, as well as the standard deviation for 10-year periods. The standard deviation showed a stable or declining trend, indicating that the temperature fluctuations were stable or decreasing from 1880 to 1930.
The data show that both warm and cold spikes occur randomly, without any pattern. When plotting the yearly average temperatures from 1880 to 1930, regression analysis showed a declining temperature trend. Declining trends were also found for the monthly average temperatures during the period, except for February and June. However, the curve-fitting quality for all the graphs was coarse, and the evidence for the trends is therefore weak.
Since the data series in this work is collected from diaries, and based on manual registration of temperature measurements of unknown accuracy, the data must be treated with care. However, since the measurements were undertaken by the same person in the same location throughout the period, the reliability of the data is considered to be sufficient to detect trends. There is no information about the thermometer accuracy, and it was most probably not re-calibrated during the whole period. Potential degradation of the thermometer could also have influenced the readings and led to a systematic change in temperature levels. Possible measurement errors should therefore be investigated further.
The raw data supporting the conclusions of this article will be made available by the authors, without undue reservation.
AN: Conceptualization, Data curation, Formal analysis, Investigation, Methodology, Project administration, Resources, Software, Supervision, Validation, Visualization, Writing – original draft, Writing – review & editing.
The author(s) declare that no financial support was received for the research, authorship, and/or publication of this article.
I am grateful to my great-grandfather for his efforts and endurance in collecting weather data over 50 years and making it available for future generations through his diaries.
The author declares that the research was conducted in the absence of any commercial or financial relationships that could be construed as a potential conflict of interest.
All claims expressed in this article are solely those of the authors and do not necessarily represent those of their affiliated organizations, or those of the publisher, the editors and the reviewers. Any product that may be evaluated in this article, or claim that may be made by its manufacturer, is not guaranteed or endorsed by the publisher.
Brugnara, Y., Pfister, L., Villiger, L., Rohr, C., Isotta, F., and Brönnimann, S. (2020). Early instrumental meteorological observations in Switzerland 1708–1873. Earth Syst. Sci. Data 12, 1179–1190. doi: 10.5194/essd-12-1179-2020
Camuffo, D. (2020). Key problems in early wine-spirit thermometers and the true Reaumur thermometer. Clim. Change 163, 1083–1102. doi: 10.1007/s10584-020-02910-3
Camuffo, D., and Bertolin, C. (2012). The earliest temperature observations in the world: the medici network (1654–1670). Clim. Change 111, 335–363. doi: 10.1007/s10584-011-0142-5
Fall, S., Watts, A., Nielsen-Gammon, J., Jones, E., Niyogi, D., Christy, J. R., et al. (2011). Analysis of the impacts of station exposure on the u.s. historical climatology network temperatures and temperature trends. J. Geophys. Res 116:146. doi: 10.1029/2010JD015146
GuleSider (2024). Tresfjord map. Available at: https://www.gulesider.no/
Kartverket (2024). Map. Available at: https://www.kartverket.no/
Mahmood, R., Foster, S. A., and Logan, D. (2006). The geoprofile metadata, exposure of instruments, and measurement bias in climatic record revisited. Int. J. Climatol. 26, 1091–1124. doi: 10.1002/joc.1298
Metric Conversions (2024). Reaumur to Celcius. Available at: https://www.metric-conversions.org/temperature/reaumur-to-celsius.htm
Norwegian Centre for Climate Services (2024). Observations and Weather Statistics. Available at: https://seklima.met.no/days/mean(air_temperature
Przybylak, R., Singh, G., Wyszynski, P., Araźny, A., and Chmist, K. (2024). Air temperature changes in sw Greenland in the second half of the 18th Century. Clim. Past 20, 1451–1470. doi: 10.5194/cp-20-1451-2024
Keywords: air temperature, Norway, temperature trend, average temperature, Reaumur thermometer
Citation: Nerheim AR (2025) Early temperature records from a Norwegian coastal farm (1880–1930). Front. Clim. 7:1495611. doi: 10.3389/fclim.2025.1495611
Received: 12 September 2024; Accepted: 03 January 2025;
Published: 27 January 2025.
Edited by:
Matthew Collins, University of Exeter, United KingdomReviewed by:
Ronan Connolly, Center for Environmental Research and Earth Sciences, United StatesCopyright © 2025 Nerheim. This is an open-access article distributed under the terms of the Creative Commons Attribution License (CC BY). The use, distribution or reproduction in other forums is permitted, provided the original author(s) and the copyright owner(s) are credited and that the original publication in this journal is cited, in accordance with accepted academic practice. No use, distribution or reproduction is permitted which does not comply with these terms.
*Correspondence: Ann Rigmor Nerheim, YW5uLnIubmVyaGVpbUBudG51Lm5v
Disclaimer: All claims expressed in this article are solely those of the authors and do not necessarily represent those of their affiliated organizations, or those of the publisher, the editors and the reviewers. Any product that may be evaluated in this article or claim that may be made by its manufacturer is not guaranteed or endorsed by the publisher.
Research integrity at Frontiers
Learn more about the work of our research integrity team to safeguard the quality of each article we publish.