 Subhash Anand
 Aarti
Aarti Anju Singh2†
94% of researchers rate our articles as excellent or good
Learn more about the work of our research integrity team to safeguard the quality of each article we publish.
Find out more
ORIGINAL RESEARCH article
Front. Clim. , 25 February 2025
Sec. Climate Services
Volume 7 - 2025 | https://doi.org/10.3389/fclim.2025.1492260
Variation in rainfall patterns has profound impacts on fragile ecosystems and people’s lives. The Upper Kumaon area is highly sensitive to current climatic variation. This study attempted to identify yearly, seasonal, and monthly rainfall trends in four districts of the Upper Kumaon Region (UKR), i.e., Almora, Bageshwar, Champawat, and Pithoragarh, for a period of 68 years (1950–2018). Long-term gridded daily rainfall data were used for parametric regression analysis and variability analysis to examine historical trends. The analysis showed a continuous decrease in annual precipitation across all districts, with the most significant decrease seen at Bageshwar (−3.88 mm/year). Seasonal trends showed significant decreases in monsoon rainfall, especially in Almora (−3.28 mm/year), whereas spatial variability analysis depicted increasing variability in recent times. Lower-altitude districts (i.e., Champawat) exhibit higher variability compared to high-altitude districts such as Pithoragarh. Therefore, the findings of this study emphasize the need to implement policies to address the increasing variability in rainfall and its effects on agricultural practices, water resource management, and disaster preparedness in this sensitive environment.
Climate change has become a globally significant area of scientific research (Preenu et al., 2017). Worldwide, the influence and exposure of climate change to humans are increasing. A suitable and adaptable environment is accountable for life on earth. Minor changes in climatic patterns and their distribution can cause adverse events for wealth and life (Aldughairi, 2025; Rocha et al., 2022). Climate change is indeed a phenomenon and is the biggest crisis of this era (Singh and Gurjar, 2011). The climate change crisis originated from the high emission of greenhouse gasses by anthropogenic and natural activities (Revadekar et al., 2012). Natural and human activities are responsible for modifying the movement of energy in the atmosphere, cooling, and warming the earth by disturbing its heat balance. Greenhouse gasses are the primary cause of climate change. As a result of their high efficiency in trapping heat in the atmosphere, the greenhouse effect occurs (Stocker et al., 2013). Changes in climatic variables such as rainfall, temperature, and natural resources are evident. It is important to understand the climatic change situation to reduce its adverse impact on the environment.
The varying rainfall patterns require insistent and appropriate interest because they affect the entire environmental and human life cycle in any geographical region (Dore, 2005). Precipitation is the main dynamic force; its pattern variability and seasonality can impact available water resources in a particular area. Variability in rainfall distribution and the amount stimulates changes in the spatial–temporal distribution of soil moisture, runoff, and groundwater and could change the frequencies of floods and droughts. Mountain regions stand at the forefront of climate change impact. Mountains occupy approximately 25% of the surface of the earth. Approximately 26% of the world’s population (about 1.5 billion) lives in mountain ecology (Kapos et al., 2000; Meybeck et al., 2001). Mountains are sources of freshwater, and they are also known as water towers. The lives and livelihoods of more than 40% of people, directly or indirectly, depend on mountain resources.
Mountains are among the most vulnerable ecosystems and are more prone to rapid change than other planetary habitats (Beniston, 2006). Climate change poses a significant threat to mountain ecosystem services and the populations that rely on them. Glaciers are receding because of escalating temperatures, indicating the impact of climate change. The factors that make these hilly regions most vulnerable are their fast-growing population, depletion of resources, unplanned road construction activities, deforestation, high dependency of the population on climate-sensitive sectors like agriculture and forestry, lack of agricultural land (Macchi, 2010), livelihood insecurity, high malnutrition, and an unskilled population. Changes in rainfall patterns, variability, and seasonal distribution affect water availability (surface and groundwater) (Sharma et al., 2013; Singh and Kumar, 2014), the frequency of disasters, cropping patterns, agricultural productivity, vegetation cover (Singh and Mal, 2012), and hydropower generation (Field et al., 2014). Studies show that the Himalayan region is experiencing frequent climate change-related phenomena such as drought, cloudbursts, extreme rainfall, and landslides.
Agriculture in the Kumaon region depends on seasonal rainfall, which supports the livelihoods of locals. The challenging terrain, combined with delicate ecosystems, makes the region vulnerable to the opposing impacts of climate variability, such as water scarcity, flash floods, and landslides. The research area has become more crucial as it nourishes provincial water resources and is home to various rivers, springs, and streams that work for both local and downstream communities. Changing rainfall patterns can disrupt such hydrological systems and reduce water availability for irrigation, drinking, and hydropower generation. Given these vulnerabilities, the research area is suitable for examining long-term rainfall trends and variability. This research evaluates spatial and temporal variations in rainfall and their implications to directly address the urgent need for sustainable water management and disaster readiness in the region.
This research investigates the changes in rainfall patterns over the Upper Kumaon Region, which is considered vulnerable to climate change. The long-term variations in annual, seasonal, and monthly rainfall trends were observed for 68 years (1950–2018) to check the degree of variability and spatial variations between the four districts of Pithoragarh, Champawat, Almora, and Bageshwar.
As this mountain region relies on monsoon precipitation to sustain its agriculture-based economy, understanding its decreasing and increasing variability is critical for sustaining livelihoods and ensuring food security. Spatial disparities also highlighted that climate variability impacts regions of different altitudes differently, especially low-altitude and high-altitude areas, and therefore calls for adaptation strategies specific to districts. The author believes that the findings of this research enhance the scientific understanding of regional climate dynamics. This will also provide a basis for policymakers and stakeholders to design targeted interventions to promote climate resilience in the study area. The present study also establishes a basis for further research into hydrological sustainability and adaptive strategies to adapt to changing climatic conditions.
The Upper Kumaon Region includes four districts: Pithoragarh, Champawat, Almora, and Bageshwar. This study area is located between 290 33′–300 00′ North latitudes and 790 65′–800 33′ East longitudes. The total geographical area is 14,241 sq. km with a population of 16, 25,491 (Directorate of Economic and Statistics, 2016).
Trans-Himalaya is the northern boundary of the region and is also the international border with China (Tibet) and Nepal by the eastern side (Figure 1). The southern side of the study area is bound by the Nainital district. This area spreads from the foothills up to the snow-covered Himalayan peaks, thereby constructing the Indo-Tibetan boundary. This region mostly lies in a long arc area of the Himalaya and creates an intermediate zone between the dry and sub-humid west Himalaya and per-humid east Himalaya. The average population density is highest in Almora (205 per sq. km) and lowest in Pithoragarh (69 per sq. km). More than 80% of the population is literate in this region, and it is primarily an agrarian economy with more than 75% of the population depending on agriculture and forestry (Pande et al., 2016).

Figure 1. Geographical overview of the study area.
Most IITM-Pune (India) data from the observatories are limited by large data gaps. Therefore, the rainfall records of the study area (Pithoragarh) were downloaded from the Climate Research Unit (CRU) TS2.1 dataset, Tyndall Centre for Climate Change Research, School of Environmental Sciences, University of East Anglia in Norwich (UK), and from the website of India Water Portal (India Water Portal, 2017). The proposed method obtains district-level rainfall observations. In addition, data from the Global Weather Data for SWAT (2020) (USA) and the India Meteorological Department (2019) were used to analyze rainfall variability in the region (Table 1).
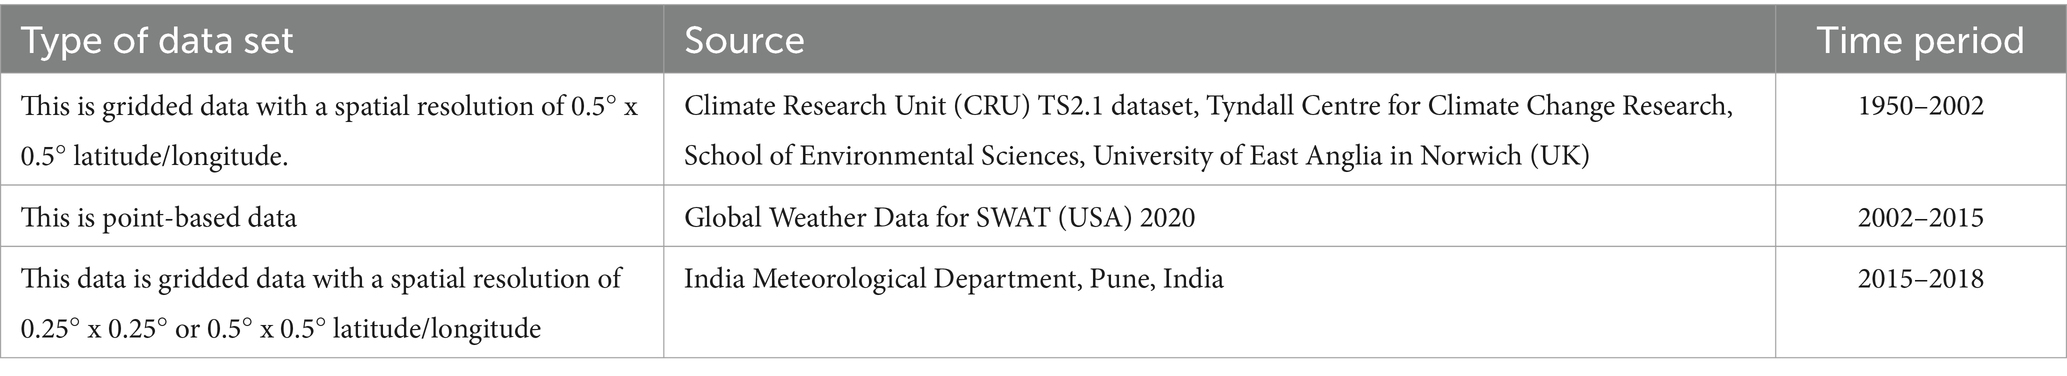
Table 1. Data sources.
The trend analysis was performed annually, seasonally, and monthly. This was achieved using linear regression analysis. The linear trend line of the yearly rainfall, monthly rainfall, and seasonal rainfall was computed by the slope value from the linear regression analysis performed (Dash and Hunt, 2007; Kothawale and Rupa Kumar, 2005). A detailed representation of the outcomes was provided using the trend line on each graph (Siraj et al., 2013; Addisu et al., 2015). The confidence level (CI) was also evaluated at 95%.
From an analysis perspective, the whole year is divided into four seasons: pre-monsoon seasons (March–May), monsoon season (June–August), post-monsoon season (September–November), and winter season (December–February).
The seasonality of the rainfall was computed using the ratio-to-moving average method. The following process was applied to compute seasonality (Dash and Hunt, 2007).
The seasonal and monthly variability was evaluated using the coefficient of the variance process (Guhathakuta et al., 2020).
The coefficient of variability is calculated as follows:
The distribution of rainfall in the Upper Kumaon Region is very different. The annual mean rainfall among districts of the Upper Kumaon Region received from 1950 to 2018 was highest in Pithoragarh District (1511.97 mm/year) and lower in Almora (1072.07 mm/year), whereas the average annual rainfall in the Champawat district was 1230.70 mm/year and in the Bageshwar district was 1136.41 mm/year. The average monthly rainfall over the years of 1950–2018 varies from as low as 89.34 mm/month in Almora to as high as 126.00 mm/month in Pithoragarh. The rainfall shows the seasonal trends over the years in the region during the rainy season (mostly from June to September), when most of the rainfall happened. During the rainy season, Champawat district experiences a maximum rainfall of 281.34 mm/month, whereas Almora experiences a minimum rainfall of 241.42 mm/month during this season. In winter, the Pithoragarh district received the maximum rainfall, while the Champawat district received the minimum rainfall. The monthly average for the Champawat district is extremely high, with a maximum of 356.91 mm/month and a minimum of 3.84 mm/month.
The trend analysis of the 69-year rainfall in the Upper Kumaon Region reflects variations in the rainfall pattern. The trend of linear regression analysis is decreasing with the highest rate of −3.88 mm/year in Bageshwar, followed by Almora (−3.33 mm/year) and Pithoragarh (−2.06 mm/year). Champawat has an increasing trend rate of 0.149 mm/year due to the heavy rainfall in the recent past, and the R2 value is 0.00006. This shows that 0.006% of the lowest change in rainfall occurred over a change of 69 years. The highest percentage of change was noted in Bageshwar (6.85%), followed by Almora (4.58%) and Pithoragarh (1.55%) over the change of 69 years. The moving average was also computed, which also indicates the rapidly decreasing trend among all three districts (Figure 2). Kumar et al. (2023) observed the same decreasing trends in Kumaon Himalaya. Reduced rainfall further develops water scarcity, thus impacting livelihoods that are dependent on agriculture. In comparison to Champawat, the region experienced a minor increase in annual rainfall of +0.15 mm/year due to dispersed extreme events. This brings some relief, but amplified variability creates difficulties in effective planning.
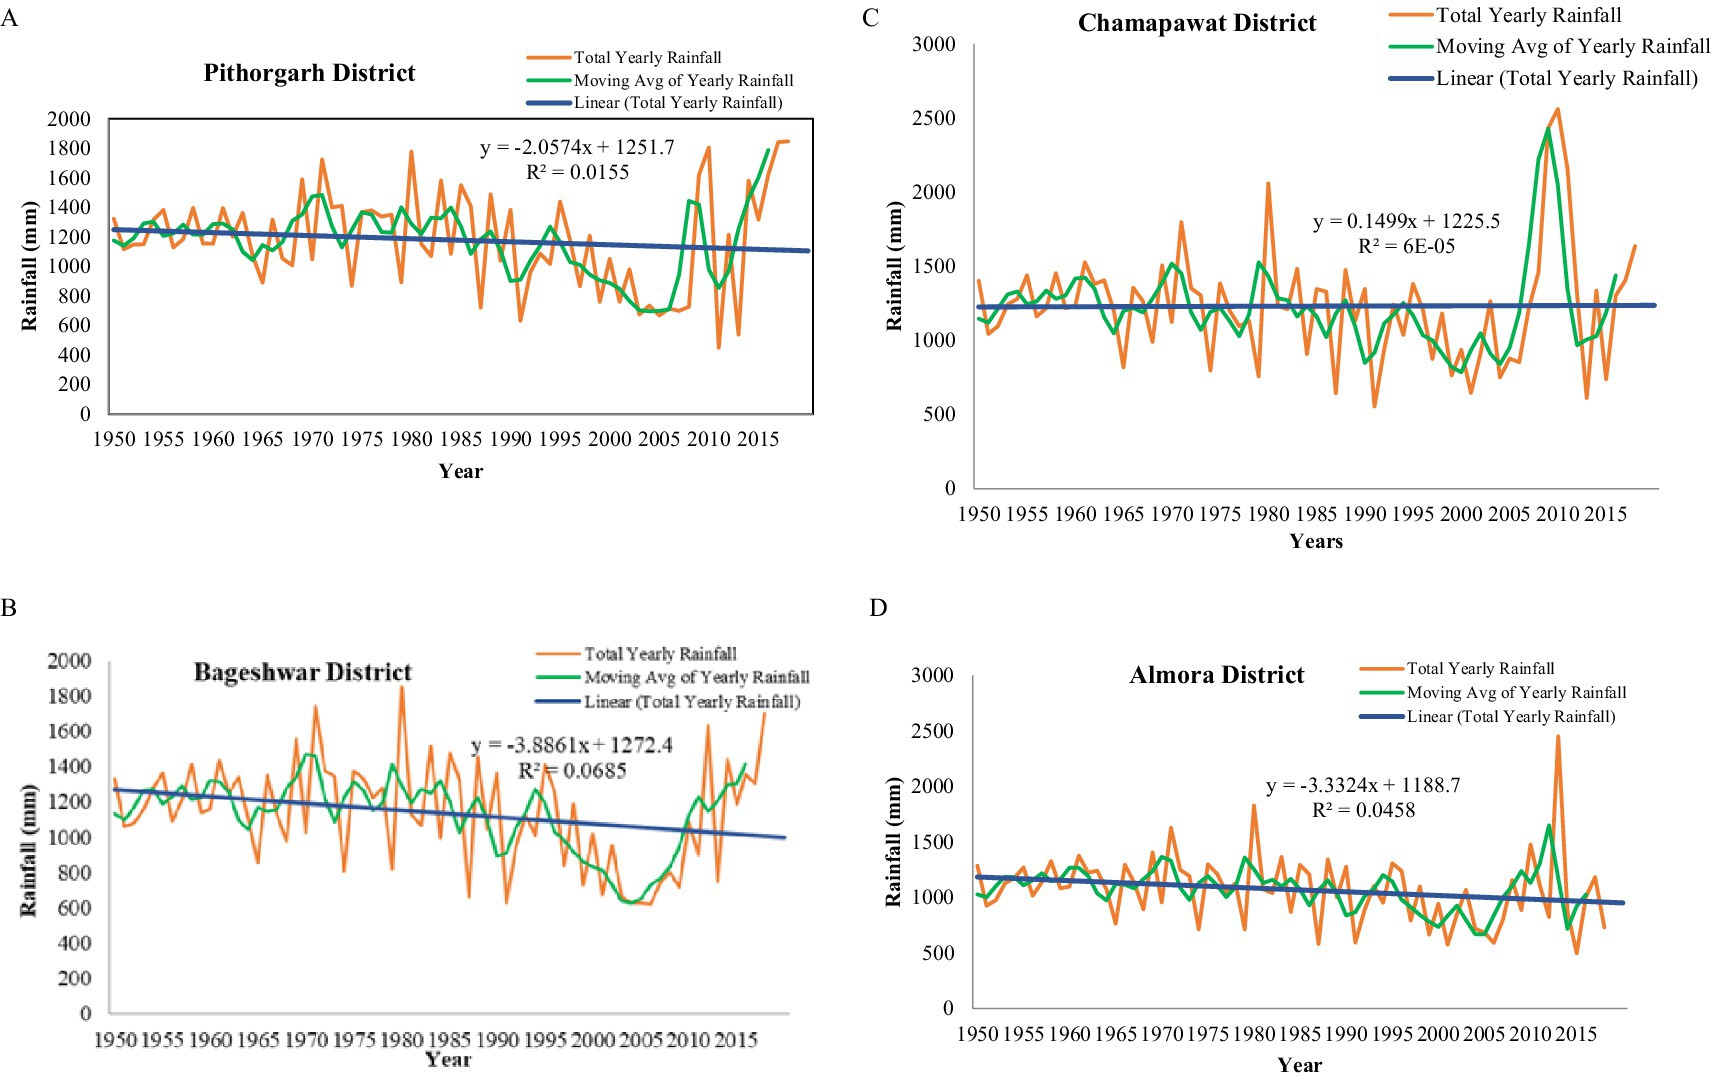
Figure 2. Trends of annual rainfall in the Upper Kumaon Region (1950–2018). (A) Pithoragarh, (B) Bageshwar, (C) Champawat, (D) Almora. Source: calculated from CRU-TS2.1 data; Global Weather Data for SWAT and IMD.
Based on seasonal rainfall trends in the Upper Kumaon Region, seasonal rainfall trend analysis in the Almora district demonstrated (Table 2) that the monsoon season, i.e., June–August, had the most decreasing trend of −3.28 mm/year. However, from the observations of the trend analysis of the two halves (1950–1984 and 1985–2018), it has been observed that there has been an enormous decrease in the monsoon season in the last 34 years (1985–2018) at a rate of −2.37 mm/year. These findings agree with those of earlier studies reporting reduced monsoonal rainfall in the study area (Yadav et al., 2013). One study found that the number of rainy days decreased in the Almora district during the 1992–2003 time. The seasonal deviation was highest during the monsoon, with a deviation of 476.42 mm (Banerjee et al., 2020). In the district of Champawat, seasonal analysis revealed that the monsoon season, i.e., June to August, had the most decreasing trend of 0.78 mm/year. However, from the observation of the trends of the two halves, it has been observed that there has been a huge upsurge in the monsoon season in the last 34 years (1985–2018) with the rate of 8.16 mm/year. The deviation in seasonal rainfall was highest during the monsoon, with a deviation of 343 mm. This increase was due to heavy rain during the monsoon in the recent past. In the district of Bageshwar, seasonal analysis shows that the monsoon season, i.e., June to August, had the most decreasing trend at 2.27 mm/year. However, from the observation of the trends of the two halves, it has been observed that there has been an increase in the monsoon season in the last 34 years (1985–2018) with the rate of 2.63 mm/year. The seasonal deviation was highest during the monsoon period, with a deviation of 232.41 mm from 1950 to 2018. In the district of Pithoragarh, seasonal analysis shows that the post-monsoon season, i.e., September to November, had the most decreasing trend at 1.41 mm/year (Table 2). However, from the observation of the trend analysis of the two halves, it has been observed that there has been an increase in the monsoon season in the last 34 years (1985–2018) with the rate of 5.96 mm/year. The seasonal deviation was highest during the monsoon season with a deviation of 247.28 mm from 1950 to 2018. Overall, a negative trend in monsoon rainfall enhances the risk of water scarcity. Winter rain is steady, but there is a slight positive trend in Almora (+0.09 mm/year) and Champawat (0.50 mm/year), which hardly offer any relief during the season. In comparison, during post-monsoon rainfall, there were sharp negative trends in Almora (−0.94 mm/year) and Pithoragarh (−1.41 mm/year), hence hindering crop growth and soil moisture. Such trends require adaptive approaches to counter such consequences.
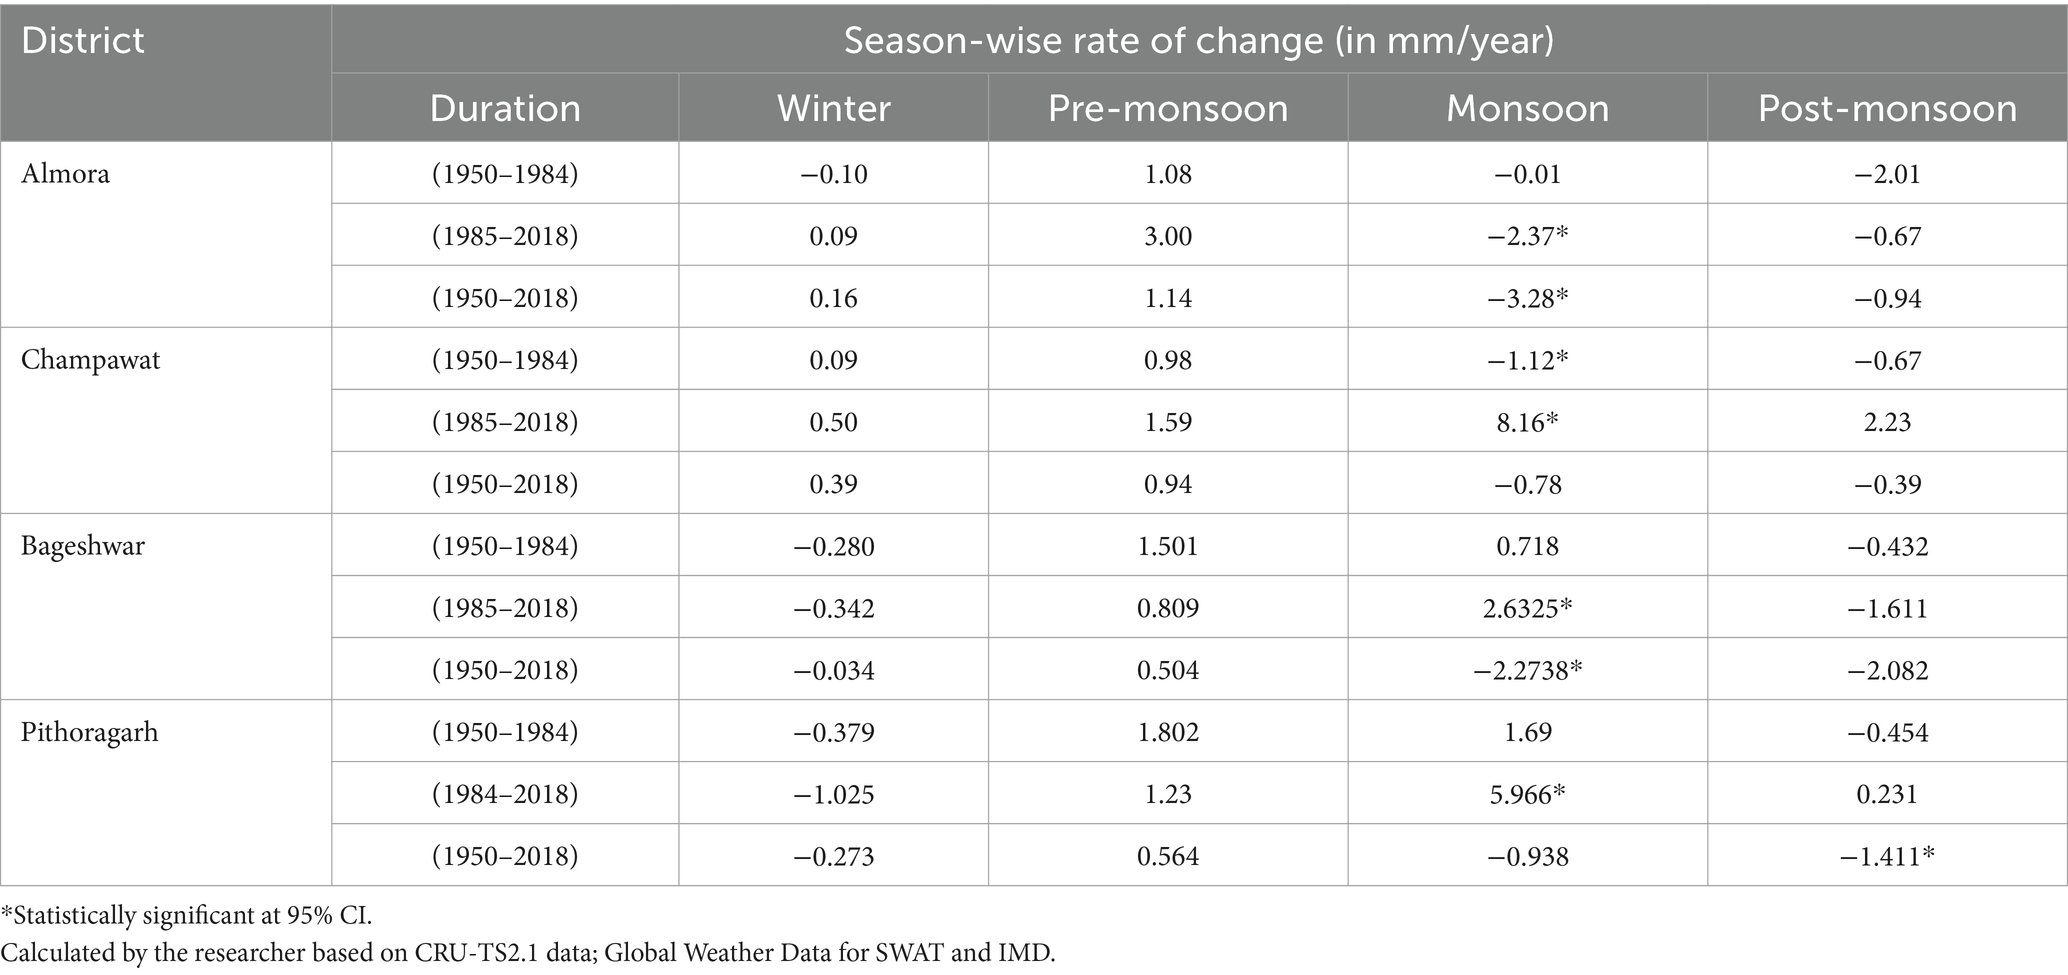
Table 2. District-wise trends of seasonal rainfall in the Upper Kumaon Region (1950–2018).
According to monthly trends, August in Almora experienced a decreasing monthly rainfall trend of 2.49 mm/year. The total change from 1950 to 2018 was highest in July (256.11 mm). Moreover, the deviation was highest in July (133 mm). Although May exhibits a maximum increasing trend of 0.825 mm/year, the total change and deviation were not significant. In the district of Champawat, the month of October had the maximum decreasing monthly trend (0.427 mm), but the total change from 1950 to 2018 was high in the month of August (234.86 mm). Moreover, the deviation is highest in August. The trends show growing rainfall variability and reduced rainfall in July–August affecting agriculture, and lower in October rainfall delaying water recharge. Minor increases in April–May offer little relief, but crucial adaptive actions are required for agricultural resilience and water management (155.44 mm) (Table 3). Although April and May demonstrated a slight increasing trend, the total change and deviation also exhibited a slight increase. In the district of Bageshwar, it has been observed that August has a decreasing monthly rainfall (1.45 mm/month). The total change from 1950 to 2018 was highest in August (256 mm). Moreover, the deviation was highest in July (142.2 mm). Although April and May exhibited a slight increasing trend, the total change and deviation also exhibited a slight increase. For the Pithoragarh district, October had a decreasing monthly trend of 0.94 mm/month. The total change from 1950 to 2018 was the highest in July (242.72 mm). Moreover, the deviation was highest in July (133.19 mm). Although April and May exhibited a slight increasing trend, the total change and deviation also exhibited a slight increase (Table 3). The study concludes that these declining trends in rainfall patterns are indicative of long-term climatic changes impacting regional precipitation. These findings are similar to those of Yadav et al. (2013), who also recorded extreme decreases in rainfall in the Kumaon Himalaya.
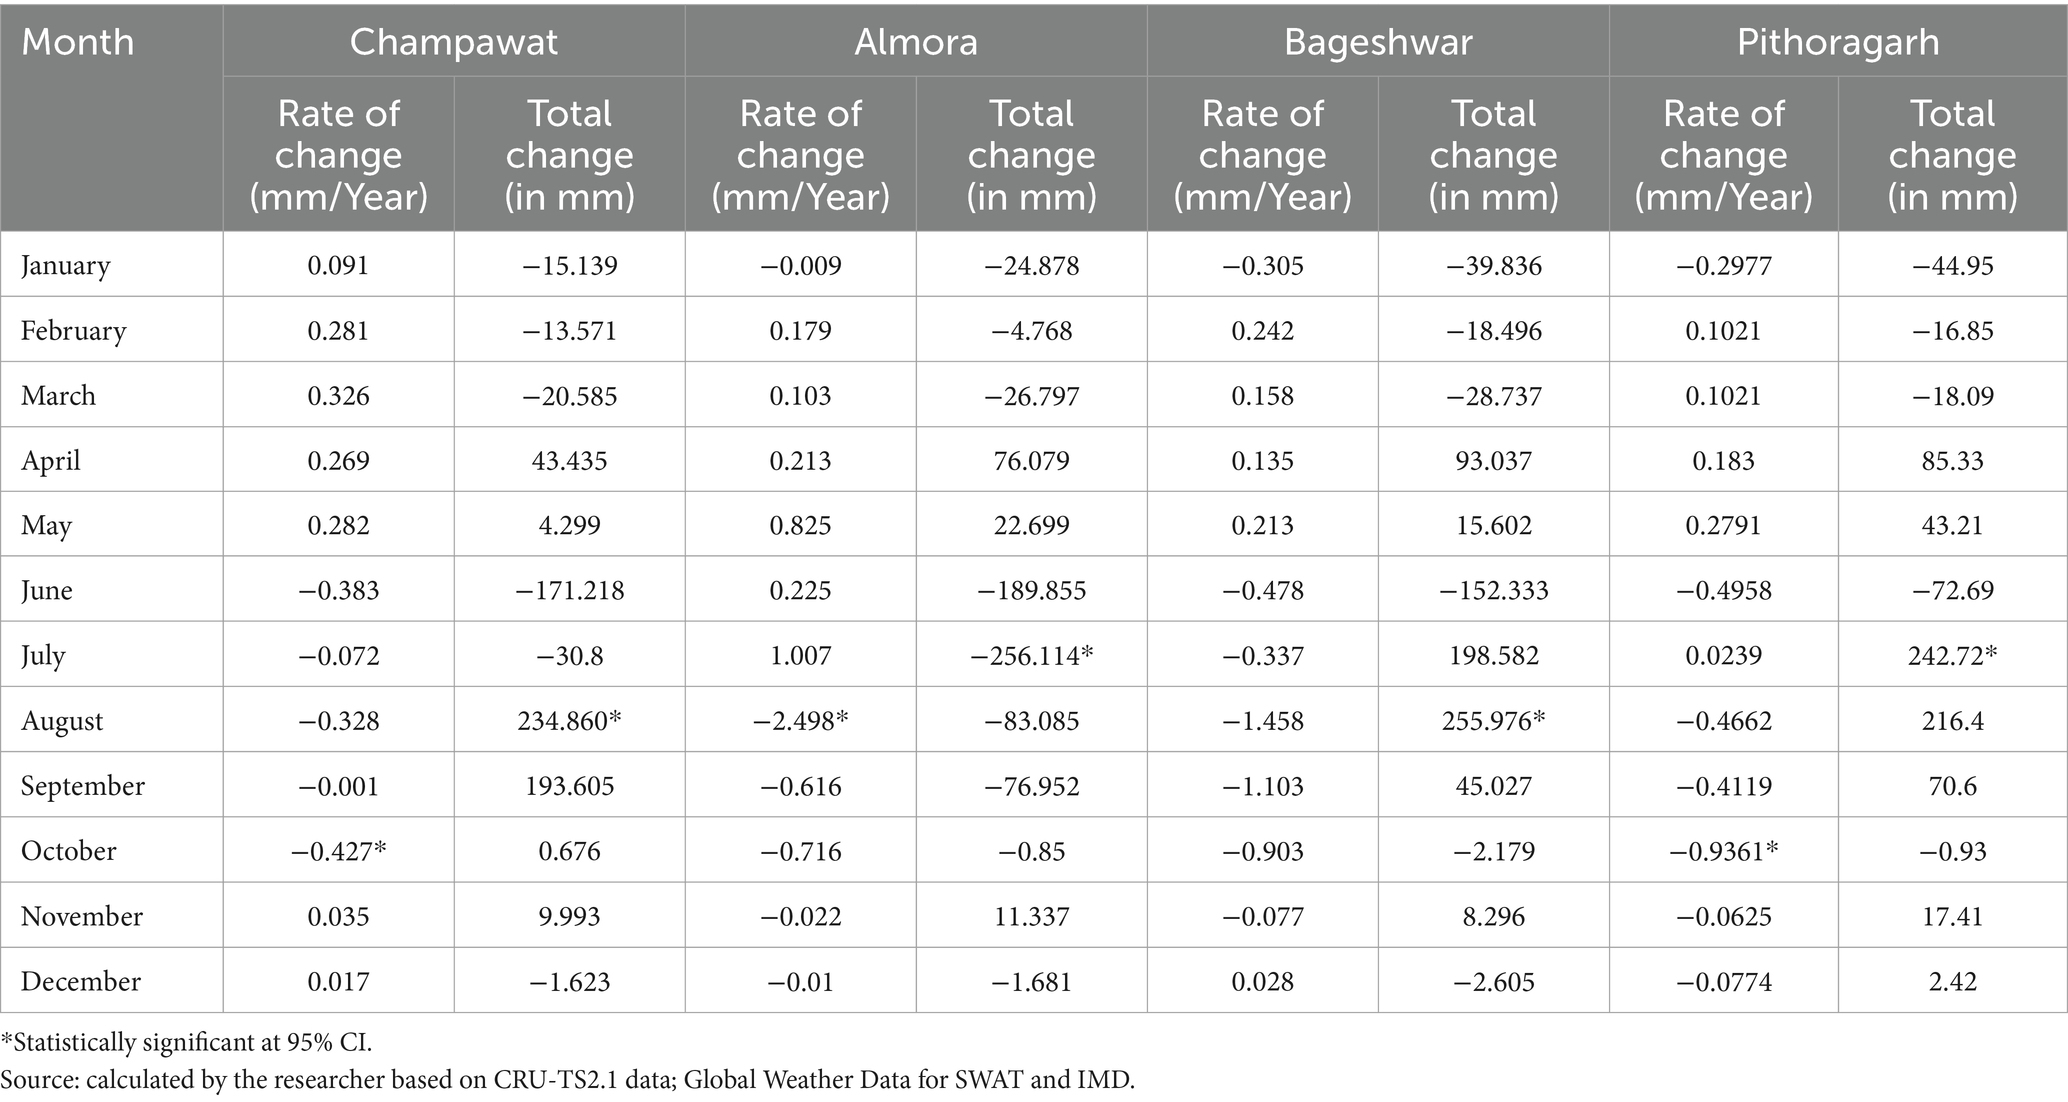
Table 3. Trend analysis of mean monthly rainfall in the Upper Kumaon Region (1950–2018).
The seasonal rainfall analysis revealed the in-depth district-wise variability of the rainfall in the Upper Kumaon Region. The district-wise analysis of variability in the three consecutive periods (1950–1984, 1985–2018, and 1950–2018) elaborates more insights into the seasonal variability of rainfall over the years. It clearly demonstrated that the monsoon season, i.e., June to August, had the least variability throughout. In the last 34 years (1985–2018), the variability was highest in the monsoon season (65.51%). Similarly, the post-monsoon season (i.e., September to November) exhibits the highest variability among the three periods. Moreover, variability is influenced by variations occurring in the last 35 years (1950–1984). The variability of seasonal rainfall is comparatively higher in the second half (1985–2018) duration than the first duration (1950–1984) in all the districts (Table 4). This reflects the increase in rainfall variability in the recent past in the Upper Kumaon Region, which has further influenced human life.
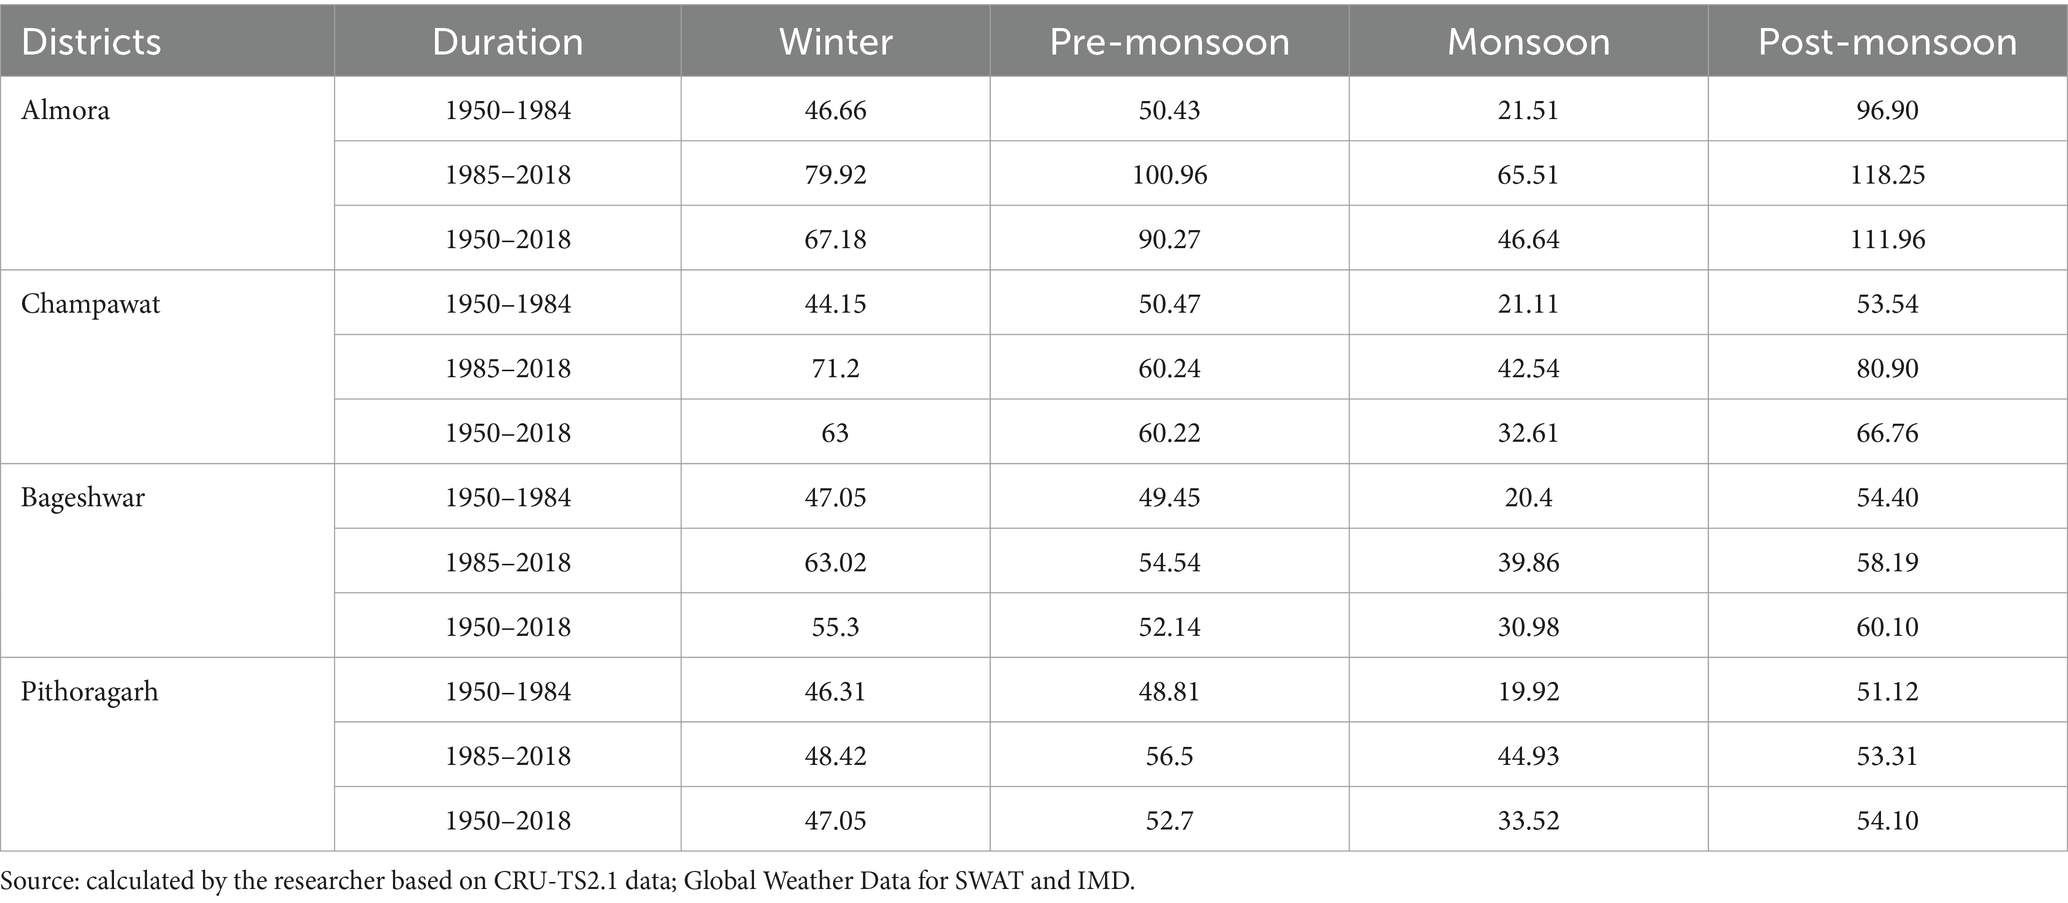
Table 4. Seasonal rainfall variability analysis of the Upper Kumaon Region (in percent).
As per the variability analysis of monthly rainfall, it has been found that all the districts are representing higher variability in the months of November and December, and the lowest variability has been observed in the months of July and August. The variability of monthly rainfall is comparatively higher in the second half (1985–2018) duration than in the first duration (1950–1984) in all the districts (Table 5; Figure 3). It reflects that rainfall variability increased in the recent past in the Upper Kumaon Region, which further influences human life.

Table 5. District-wise monthly rainfall variability analysis of the Upper Kumaon Region during 1950–2018 (in percent).
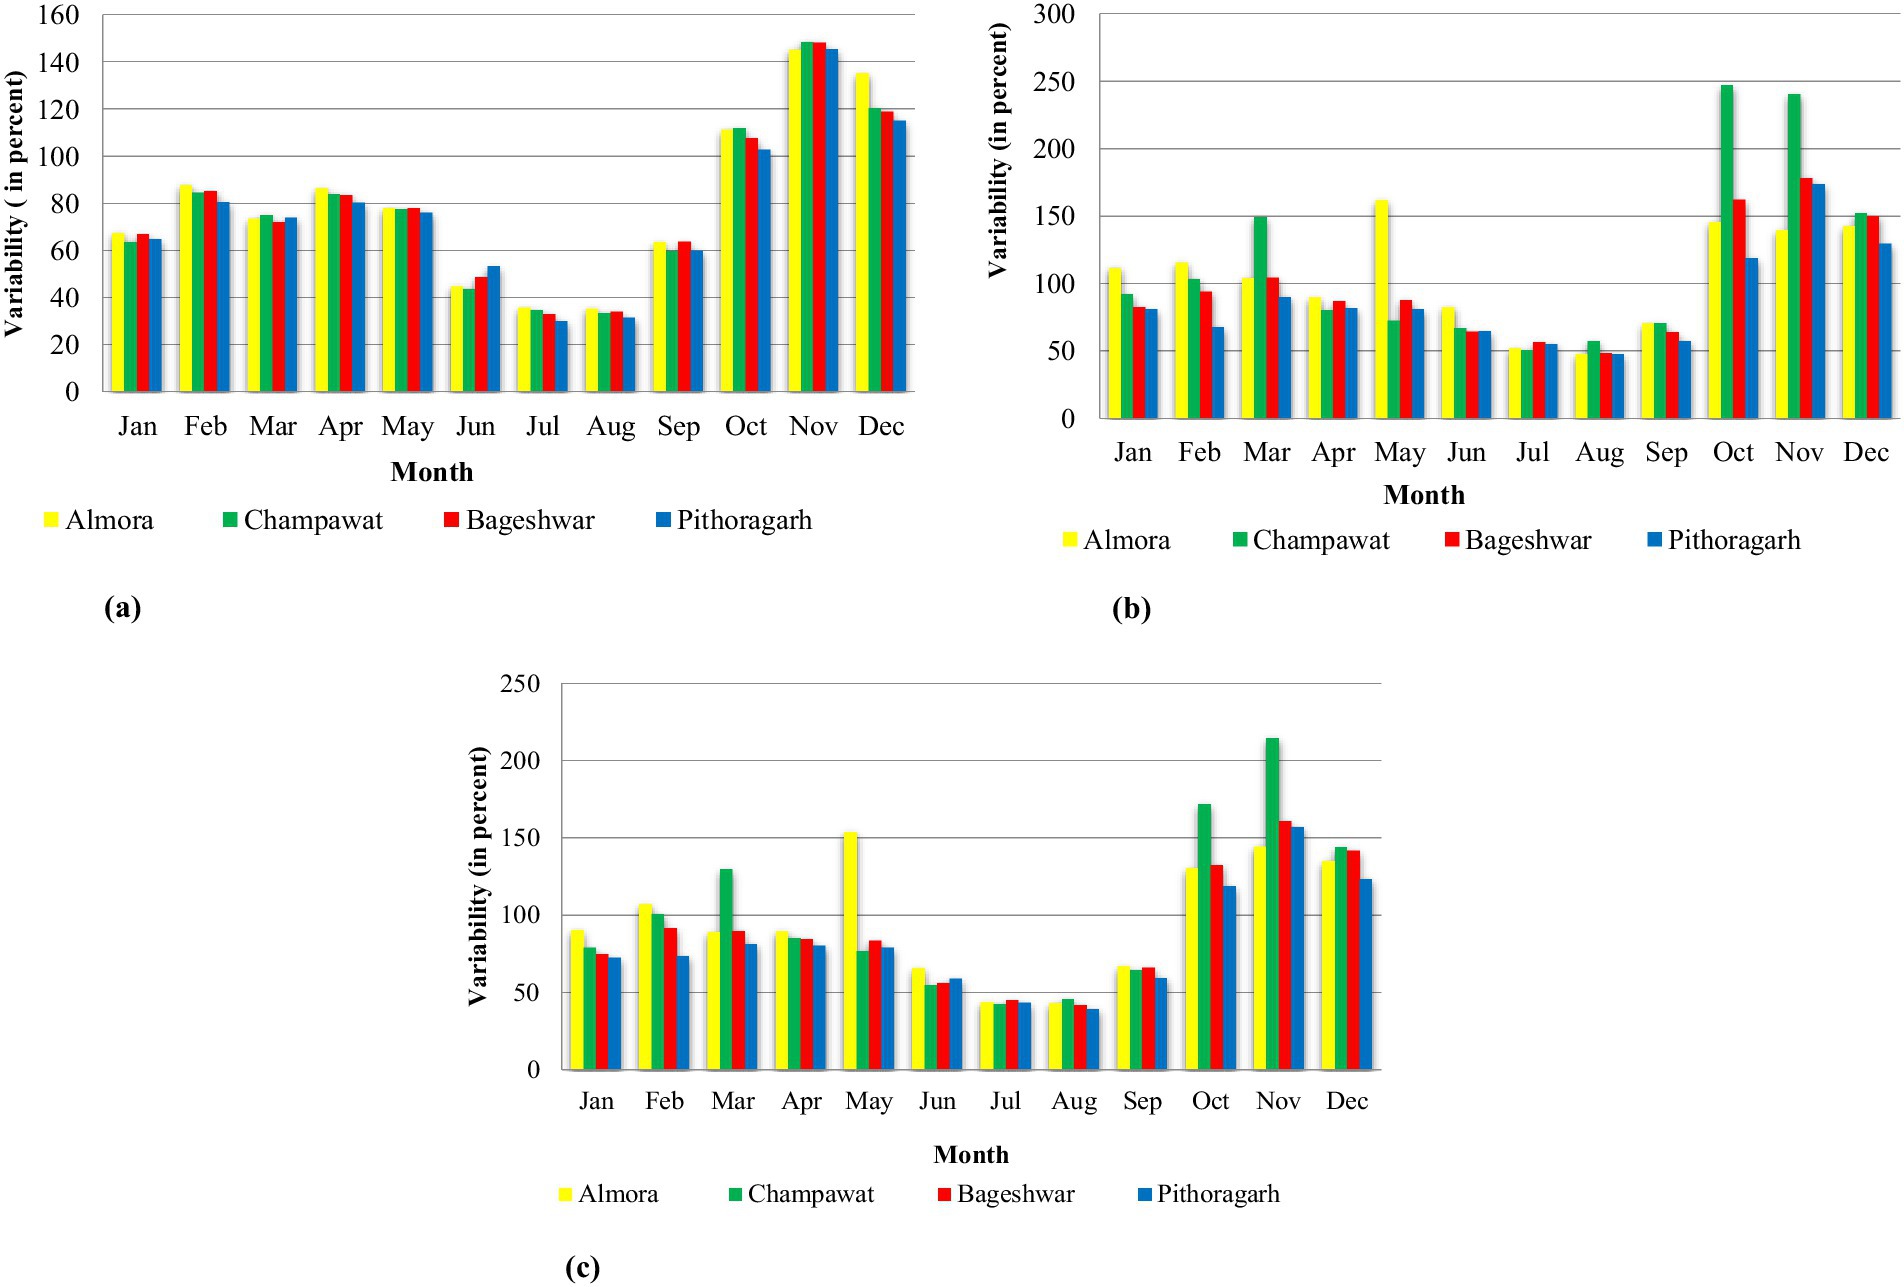
Figure 3. Variability analysis of monthly rainfall in the Upper Kumaon Region. Source: calculated from CRU-TS2.1 data; Global Weather Data for SWAT and IMD, Pune, India. (A) Variability in monthly rainfall (1950–1984); (B) variability in monthly rainfall (1985–2018); (C) variability in monthly rainfall (1950–2018).
Banerjee et al. (2020) also observed the declining rainfall and increasing variability, indicating the collective trigger of climate change in the Himalayan region. The Champawat district has the highest monthly rainfall variability among the districts. Pithoragarh has the least rainfall variability. This means that the low-altitude district (Champawat) is more prone to rainfall variability during the monsoon and post-monsoon periods than the high-altitude district (Pithoragarh) in the Upper Kumaon Region (Table 5; Figure 3). The study area is susceptible to extreme events such as droughts and floods. The minimum variability was observed at Pithoragarh, but minor changes in the high-altitude areas can generate a ripple effect in delicate ecosystems. Month-wise variability was most definite in November and December, demonstrating uneven post-monsoon precipitation that distresses the renewal of surface and groundwater resources. Sati (2024), in the study on the Western Himalaya, observed that seasonal variability of rainfall is high in the monsoon and winter seasons in the western Himalayas. A short rainfall span and shift in the rainfall season are observed.
Over the years, various parts of the world have experienced abrupt changes in seasonal phenomena because of climate change. The Upper Kumaon Region also faces similar circumstances, with variations in rainfall and temperature annually, seasonally, and monthly. This study showed significant declines in rainfall in the Upper Kumaon Himalaya over 68 years (1950–2018), with the highest drop occurring in Bageshwar. The amount of monsoon rain, critical for agriculture, has decreased significantly in Almora but with increasing variability at lower altitudes, such as Champawat. The findings of this study highlight the importance of investigating the impact of climate change on the local climate in a region. In addition, the rainfall regime of the Kumaon region, with more rainfall station data, and the potential implications of climate change must be fully understood for water planning and management in the future. As the present research scope was limited to studying the rainfall trends in study area, expanding future research by incorporating general climatic variables such as temperature and wind patterns would add more value to the findings of regional climate dynamics. Predictive modeling and socioeconomic studies can also be used to predict rainfall trends and their potential impacts on livelihoods and ecosystems.
The datasets presented in this study can be found in online repositories. The names of the repository/repositories and accession number(s) can be found in the article/supplementary material.
SA: Supervision, Writing – original draft, Writing – review & editing. Aarti: Conceptualization, Formal analysis, Investigation, Methodology, Writing – original draft. AS: Writing – review & editing.
The author(s) declare that no financial support was received for the research, authorship, and/or publication of this article.
The authors would like to acknowledge the following sources for providing the necessary data and prompt assistance in this research: www.indiawaterportal.org, UK; Global Weather Data for SWAT, USA, and India Meteorological Department, Pune, India. We also acknowledge the use of software packages such as ArcGIS and MS office to create graphs for this article. We also appreciate their free downloads and tutorials. We also thank the Ratan Tata library and computer center facilities at the University of Delhi for their quick response and resource availability.
The authors declare that the research was conducted in the absence of any commercial or financial relationships that could be construed as a potential conflict of interest.
All claims expressed in this article are solely those of the authors and do not necessarily represent those of their affiliated organizations, or those of the publisher, the editors and the reviewers. Any product that may be evaluated in this article, or claim that may be made by its manufacturer, is not guaranteed or endorsed by the publisher.
Addisu, S., Selassie, Y. G., Fissha, G., and Gedif, B. (2015). Time series trend analysis of temperature and rainfall in Lake Tana sub-basin, Ethiopia. Environ. Syst. Res. 4, 1–12. doi: 10.1186/s40068-015-0051-0
Aldughairi, A. A. (2025). Climate change assessment in middle and northern Saudi Arabia: alarming trends. DYSONA 6, 60–69. doi: 10.30493/das.2024.477412
Banerjee, A., Chen, R., Meadows, E., Singh, R., Mal, S., and Sengupta, D. (2020). An analysis of long-term rainfall trends and variability in the Uttarakhand Himalaya using Google earth engine. Remote Sens. 12:709. doi: 10.3390/rs12040709
Beniston, M. (2006). Mountain weather and climate: a general overview and a focus on climatic change in the Alps. Hydrobiologia 562, 3–16. doi: 10.1007/s10750-005-1802-0
Dash, S. K., and Hunt, J. C. R. (2007). Variability of climate change in India. Curr. Sci. 93, 782–788.
Directorate of Economic and Statistics (2016). Uttarakhand socio-economic mirror. Directorate of economic and statistics. Department of Agriculture and Farmers Welfare, vol. 1, 5–32.
Dore, M. H. (2005). Climate change and changes in global precipitation patterns: what do we know? Environ. Int. 31, 1167–1181. doi: 10.1016/j.envint.2005.03.004
Field, C. B., Barros, V. R., Mastrandrea, M. D., Mach, K. J., Abdrabo, M. K., Adger, N., et al. (2014). “Summary for policymakers. Climate change 2014: impacts, adaptation, and vulnerability” in Part a: Global and sectoral aspects. Contribution of working group II to the fifth assessment report of the intergovernmental panel on climate change. Eds. C. B. Field, V. R. Barros, D. J. Dokken, K. J. Mach, M. D. Mastrandrea, and T. E. Bilir, et al. Intergovernmental Panel on Climate Change (Cambridge, United Kingdom and New York, NY, USA: Cambridge University Press), 1–32.
Global Weather Data for SWAT. (2020). USA: Soil and water assessment Tool-SWAT. Available at: https://globalweather.tamu.edu/. (Accessed on 20 January 2020).
Guhathakuta, P, Bandger, A, Menon, P, Prasad, S.K, Stable, S.T, and Sangwan, N (2020) Observed rainfall variability and change over Uttarakhand state. India meteorological department. India: 2021 is Ministry of Earth Science, Government of India, 1–29.
India Meteorological Department (2019). Available at: https://mausam.imd.gov.in/. (Accessed on 20 August 2019).
India Water Portal (2017). Available at: https://www.indiawaterportal.org/met_data/. (Accessed on 2 Jan 2018).
Kapos, V., Rhind, J., Edwards, M., Price, M. F., and Ravilious, C. (2000). Developing a map of the world's mountain forests. Forests in sustainable mountain development: a state of knowledge report for 2000. In M. F. Price and N. Butt (eds.) Forests in sustainable mountain development: A state-of knowledge report for 2000. CAB International, Wallingford, 4–19. doi: 10.1079/9780851994468.0004
Kothawale, D. R., and Rupa Kumar, K. (2005). On the recent changes in surface temperature trends over India. Geophys. Res. Lett. 32:L18714. doi: 10.1029/2005GL023528
Kumar, S., Singh, A., Singh, R. B., Mal, S., and Kumar, P. (2023). Long Term Climate Change Assessment During 1907 - 2015 in the Kumaun Himalaya, Uttarakhand. Int. J. Ecol. Environ. Sci. 49, 201–215. doi: 10.55863/ijees.2023.2625
Macchi, M. (2010). Mountains of the world–ecosystem Services in a Time of global and climate change: seizing opportunities-meeting challenges. Kathmandu, Nepal: International Centre for Integrated Mountain Development (ICIMOD) Government of Nepal.
Meybeck, M., Green, P., and Vörösmarty, C. (2001). A new typology for mountains and other relief classes. Mt. Res. Dev. 21, 34–45. doi: 10.1659/0276-4741(2001)021[0034:ANTFMA]2.0.CO;2
Pande, P. C., Vibhuti Awasthi, P., Bargali, K., and Bargali, S. S. (2016). Agro-biodiversity of Kumaon Himalaya, India: a review. Curr Agri Res J 4, 16–34. doi: 10.12944/CARJ.4.1.02
Preenu, P. N., Joseph, P. V., and Dinesh Kumar, P. K. (2017). Variability of the date of monsoon onset over Kerala (India) of the period 1870-2014 and its relation to sea surface temperature. J Earth Syst Sci 126, 1–19. doi: 10.1007/s12040-017-0852-9
Revadekar, J. V., Kothawale, D. R., Patwardhan, S. K., Pant, G. B., and Kumar, K. R. (2012). About the observed and future changes in temperature extremes over India. Nat. Hazards 60, 1133–1155. doi: 10.1007/s11069-011-9895-4
Rocha, J., Oliveira, S., Viana, C. M., and Ribeiro, I. A. (2022). Climate change and its impacts on health, environment and economy. Elsevier, 253–279.
Sati, V. P. (2024). Rainfall variability and changes and its impact on Western Himalaya. Earth Sci. Malaysia 8, 70–78. doi: 10.26480/esmy
Sharma, V., Mishra, V. D., and Joshi, P. K. (2013). Implications of climate change on streamflow of a snow-fed river system of the northwest Himalaya. J. Mt. Sci. 10, 574–587. doi: 10.1007/s11629-013-2667-8
Singh, R. B., and Gurjar, A. K. (2011). Climate change vulnerability of agriculture in arid region of Rajasthan. Annals of NAGI 30, 22–38.
Singh, R. B., and Kumar, P. (2014). “Geographic and socio-economic realities of Himachal Pradesh, northwestern Himalaya” in Livelihood Security in Northwestern Himalaya. Advances in Geographical and Environmental Sciences. eds. R. Singh and R. Hietala (Tokyo: Springer), 27–40.
Singh, R. B., and Mal, S. (2012). Influence of climate change on Nanda Devi biosphere reserve (Delhi, India: Department of Geography, Delhi School of Economics, University of Delhi) PH.D. Thesis.
Siraj, K. T., Mohammed, A., Bam, S., and Addisu, S. (2013). Long years comparative climate change trend analysis in terms of temperature, coastal Andhra Pradesh, India. J. Res. Sci. Technol. 2, 2277–1174.
Stocker, T. F., Qin, D., Plattner, G. K., Alexander, L. V., Allen, S. K., Bindoff, N. L., et al. (2013). “Technical summary” in Climate change 2013: The physical science basis. Contribution of working group I to the fifth assessment report of the intergovernmental panel on climate change (Cambridge, United Kingdom and New York, NY, USA: Intergovernmental Panel on Climate Change, Cambridge University Press), 33–115.
Keywords: climate change, rainfall variability, seasonality, Upper Kumaon Region, Himalayan region, trend analysis
Citation: Anand S, Aarti and Singh A (2025) Investigation of the trends and variability in rainfall pattern in the Upper Kumaon Himalayan region. Front. Clim. 7:1492260. doi: 10.3389/fclim.2025.1492260
Edited by:
Viviana Maggioni, George Mason University, United StatesReviewed by:
Ridwana Binte Sharif, George Mason University, United StatesCopyright © 2025 Anand, Aarti and Singh. This is an open-access article distributed under the terms of the Creative Commons Attribution License (CC BY). The use, distribution or reproduction in other forums is permitted, provided the original author(s) and the copyright owner(s) are credited and that the original publication in this journal is cited, in accordance with accepted academic practice. No use, distribution or reproduction is permitted which does not comply with these terms.
*Correspondence: Subhash Anand, c2FuYW5kcHZzQGdtYWlsLmNvbQ==
†ORCID: Anju Singh, https://orcid.org/0000-0003-2058-4587
Disclaimer: All claims expressed in this article are solely those of the authors and do not necessarily represent those of their affiliated organizations, or those of the publisher, the editors and the reviewers. Any product that may be evaluated in this article or claim that may be made by its manufacturer is not guaranteed or endorsed by the publisher.
Research integrity at Frontiers
Learn more about the work of our research integrity team to safeguard the quality of each article we publish.