- 1CMCC Foundation - Euro-Mediterranean Center on Climate Change, Lecce, Italy
- 2Inter-Departmental Research Centre for Environmental Science (CIRSA), University of Bologna, Ravenna, Italy
- 3Department of Physics and Astronomy, University of Bologna, Bologna, Italy
This research seeks to categorize and ascertain the primary marine climatic indicators within the complex Adriatic Sea area. Employing subregional climate downscaling models with resolution on the scale of a few kilometers, incorporating atmospheric, oceanic, and hydrological coupled models, the study scrutinizes historical baseline simulations (from 1992 to 2011) and future projections (from 2031 to 2050) under the RCP8.5 scenario. The chosen climate indicators are related to Sea Surface Temperature (SST), Marine Heat Waves (MHWs), Brunt–Väisälä frequency, Sea Level Rise (SLR), and Ocean Heat Content (OHC). The main results show the positive trend in SST and its correlation to circulation structures. It is noticeable that the historical period reveals a greater trend compared to the projection period, being 0.04°C/year and 0.022°C/year, respectively. The OHC shows the expected positive trend with a maximum increase in the southern Adriatic Gyre. The stability of the water column, as identified by the Brunt–Väisälä frequency values, is decreased in the shallow northern Adriatic due to the river discharge decrease while it is increased in the mid-depth water column of the central and southern regions. The number and amplitude of MHW increases especially if referenced to the historical period and finally the rate of total sea level rise shows a consistent decrease in the projection period due to compensating effects between warming and salting and the changing water budget.
1 Introduction
Climate change [Intergovernmental Panel on Climate Change (IPCC), 2019] is having a significant impact on ocean ecosystem health at both global and local scales. As society recognizes the importance of integrating adaptation into our response to climate change, there is a growing need to make available science based information for policy decisions. This underscores the importance of creating climate indicators with multiple functions, from detecting critical changes to monitoring the effectiveness of adaptation strategies.
While the global-scale impact of climate change is increasingly understood and documented, the effects on marine and coastal ecosystems at regional and local scales is still not well described. In 2017, the European Environmental Agency (EEA) (2017) distinguished between “global climate change” and “regional climate change” to differentiate between indicators used to monitor changes in the global climate system and those utilized to assess and manage climate risks at the regional level.
Von Schuckmann and Le Traon (2011), utilizing data from ARGO profiling floats, illustrate the challenges associated with computing climate indicators from in situ data, primarily due to the lack of ideal spatial and temporal coverage to capture long-term climate signals effectively. They demonstrate the high interannual variability of certain global indicators, such as global salinity content, highlighting the necessity to multi-decadal long time series to extract significant trends. Additionally, to reduce error in trend estimation, these data are aggregated into grids at low resolution, thereby compromising the computation of these indicators at regional scales.
Numerical models and improved nested downscaling techniques offer the potential to gain better insights into the impacts of climate change at regional and local scales (Fox-Kemper et al., 2019). Numerical climate downscaling has been predominantly focused on the atmosphere with little attention to the marine environment. Nagy et al. (2021) present a downscaled ocean climate model focused on the shelf waters off southwest Ireland, demonstrating that fine-scale resolution and improved representation of river discharge are important factors to reproduce the present and past structure of the marine environment, building trust in the capability of the model to compute realistic projections. Storto et al. (2023) emphasize the necessity to use downscaled numerical models to replicate extreme events in the Mediterranean Sea region. Additionally, Verri et al. (2018) illustrated the positive impact of incorporating realistic river discharge in numerical models, producing a realistic representation of upper-ocean salinity in the Adriatic Sea region, confirming the pivotal role of rivers in Adriatic overturning circulation and dynamics.
In this context, climate downscaling in the Adriatic Sea aims to bridge the gap between large-scale climate models and local climate impacts, focusing on the region’s complex ocean dynamics. The Adriatic, located in the northern Eastern Mediterranean, has highly variable bathymetry, with shallow northern waters deepening towards the central and southern regions. It also accounts for nearly 30% of the Mediterranean’s total runoff, leading to a partially positive water budget (Artegiani et al., 1997; Verri et al., 2018). Additionally, the Adriatic is a key area for dense water formation, contributing to the Mediterranean’s deep waters. Its unique thermohaline circulation and diverse climates make it a climate hazard hotspot under global warming.
This paper focuses on providing and analyzing regional marine climate indicators for the Adriatic Sea Basin, based on Verri et al. (2024) climate downscaling results. Among the various Marine Climate Indicators, Sea Surface Temperature (SST), Ocean Heat Content (OHC), Marine Heat Waves (MHWs), Brunt–Väisälä frequency, and Sea Level Rise (SLR) will be the focus of the study.
SST is a crucial essential ocean variable that is related to ocean heat exchanges with the atmosphere and monitors ocean warming trends (Gittings et al., 2018). OHC represents the total amount of heat stored by the oceans, and, like SST, is connected to sea level and ecosystem alteration. MHWs are extreme anomalies in SST that last days to weeks, and changes in their characteristics or frequency can have a profound impact on the marine ecosystems (Hobday et al., 2016; Oliver et al., 2021). The Brunt–Väisälä frequency is the main indicator of vertical stability and indirectly of mixing of the water column and it has been chosen as a good environmental status indicator (Fratianni et al., 2016). SLR can affect human activities in low-laying coastal areas, increase the salt intrusion in estuaries and nearby underground aquifers. Higher sea levels also make coastal infrastructures more vulnerable to storms damage (Almaliki et al., 2023; Eliawa et al., 2023). For the first time we will evaluate these climate marine indicators for the present time period (1992–2011) and the future RCP8.5 downscaled scenario to the Adriatic Sea for the period 2031–2050.
The study area and the downscaling methodology and validation are described in Section 2. The marine climate indicators are analysed in Section 3. Concluding remarks and insights are offered in Section 4.
2 Model data set
The model used in this study is described in detail in Verri et al. (2024) and here we will give only summary of the key modelling characteristics. The first component of the system is an atmospheric-land-hydrological model (CALH) which is then used to force an ocean model. The CALH uses WRF model (Skamarock et al., 2008) implemented in central Mediterranean area (Figure 1), with a horizontal resolution of 6 kilometers. This atmospheric model was coupled online with a land surface NOAH model (Niu et al., 2011), and with a hydrological model, WRF Hydro (Gochis et al., 2020), both sharing the same computational domain as the atmospheric model, with a horizontal resolution of 6 km, refined to 600 m along the river networks. The CALH is nested within a MedCordex projection output (Ruti et al., 2016), which also provide the initial conditions. The outputs of CALH were used to force the surface of the ocean general circulation model that uses the NEMO code (Madec and Team, 2017; Verri et al., 2024) and that covers the area of Figure 1. Although the absence of atmosphere–ocean coupling in the model results could be important for capturing feedback mechanisms between these systems, the use of an offline approach still allows for a reliable and detailed investigation of oceanic processes. It is important to note that the wind intensity fields, 2 m temperature, and precipitation produced by the WRF model of the CALH system were bias-corrected using the quantile mapping method (Boé et al., 2007; Villani et al., 2015), considering as reference two different reanalyses: UERRA (Ridal et al., 2017) and ERA5 (Hersbach et al., 2020). The near-surface bias correction can significantly impact the results by improving the accuracy of key atmospheric variables, which are crucial for ocean–atmosphere interactions. By assuming that the bias remains constant between the historical and projected periods, the correction enhances model reliability, though it is important to acknowledge that this approach simplifies the temporal dynamics of bias evolution, a factor that may influence long-term projections. The ocean model horizontal resolution is 2 kilometers and in the vertical there are 120 unevenly spaced levels. To solve the surface heat fluxes, the bulk formulae of Pettenuzzo et al. (2010) were used, and the bathymetry was interpolated from EMODnet Bathymetry Consortium (2018). The oceanic initial and boundary conditions were again obtained from the MedCordex output.
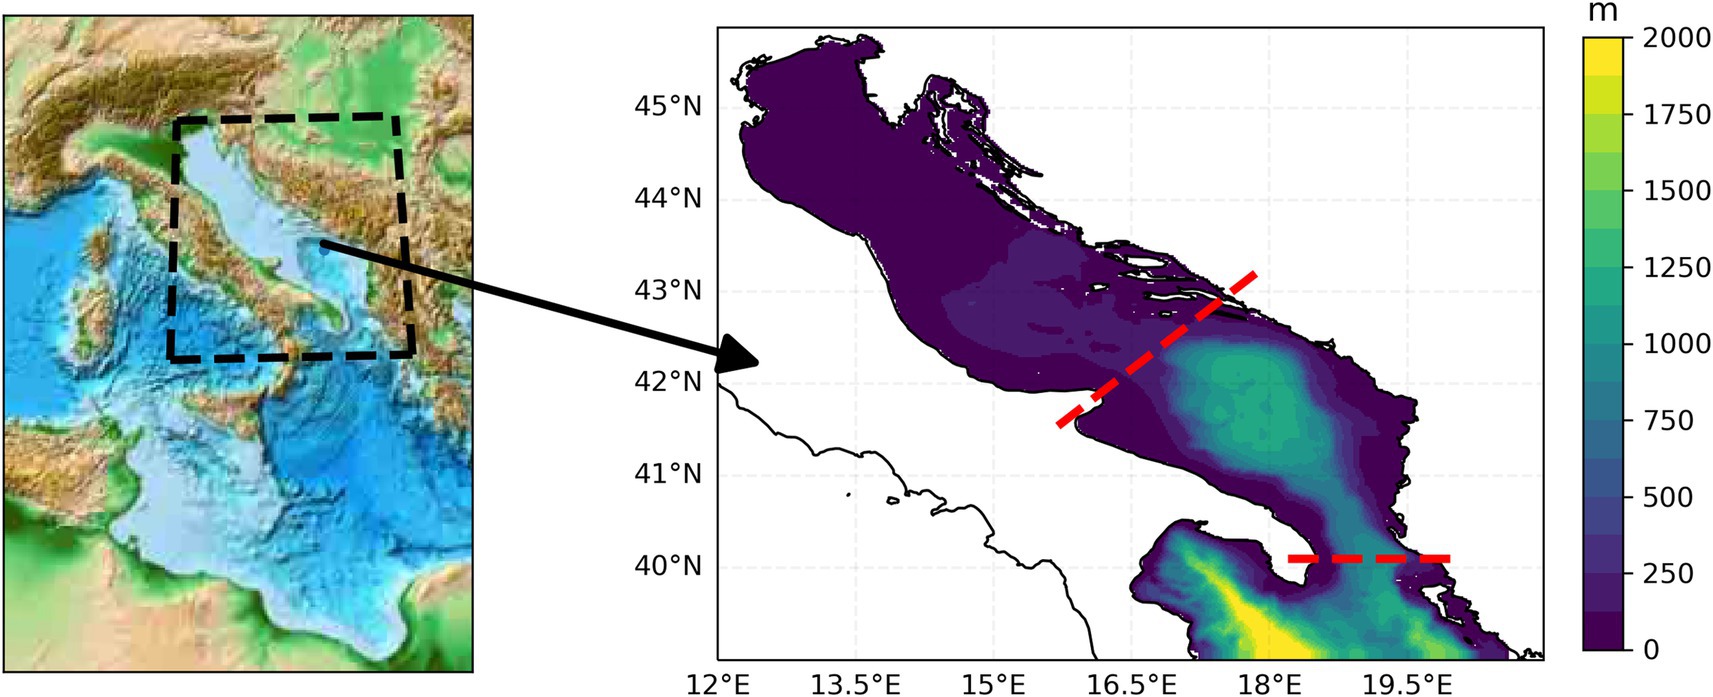
Figure 1. Left panel—WRF, NOAH, and WRF-Hydro models’ computational domains. The black lines indicate the boundaries of the NEMO oceanic model domain; Right panel: NEMO model domain and bathymetry. The red lines define the southern and northern analysis regions of the Adriatic.
Using this approach, a climate simulation has been carried out from 1992 to 2050 under the high-emission pathway RCP8.5. Two slices were considered here to provide the data necessary to calculate the marine climate indicators. The historical range, covering the period between 1992 and 2011, and the projection range (also referred to here as mid-term projection), covers the period from 2031 to 2050. Further information about the configuration of this simulation can be found in Verri et al. (2024).
In order to assess whether the model upon which we base our analyses produces results consistent with reality and enhances the understanding of the Adriatic Sea climate, we use the Copernicus reanalysis (Escudier et al., 2020) and the driving MedCordex RCM (Ruti et al., 2016) to compare with the historical simulation (1992 to 2011).
Average month of the year comparisons reveal good qualitative agreement between the experiments (Figure 2), with the most significant differences observed in surface salinity. Our historical simulation shows lower salinity than the benchmark for most of the year, except during the autumn months, while being more realistic than the driven RCM (Figure 2b). We argue that this discrepancy arises not only from the differing number of rivers considered in the climate model downscaling compared to the reanalysis, which incorporates only a few rivers in the Adriatic Sea (Escudier et al., 2020), but also from the long-term trends not captured by the reanalysis due to its use of climatological values. This is more evident during autumn, the period of highest discharge for the region’s main rivers. When comparing the total vertical mean temperature, our model consistently appears warmer than the benchmark, with maximum differences around 1°C in the autumn months (Figure 2c). This difference is reflected in the average density profile (Figure 2d), while the depth of the mixed layer (defined by a threshold density variation of 0.03 kg/m3) is quite well reproduced, with maximum differences of less than 5 m in winter months, with this once again presenting a much more realistic representation compared to the driven RCM (Figure 2e).
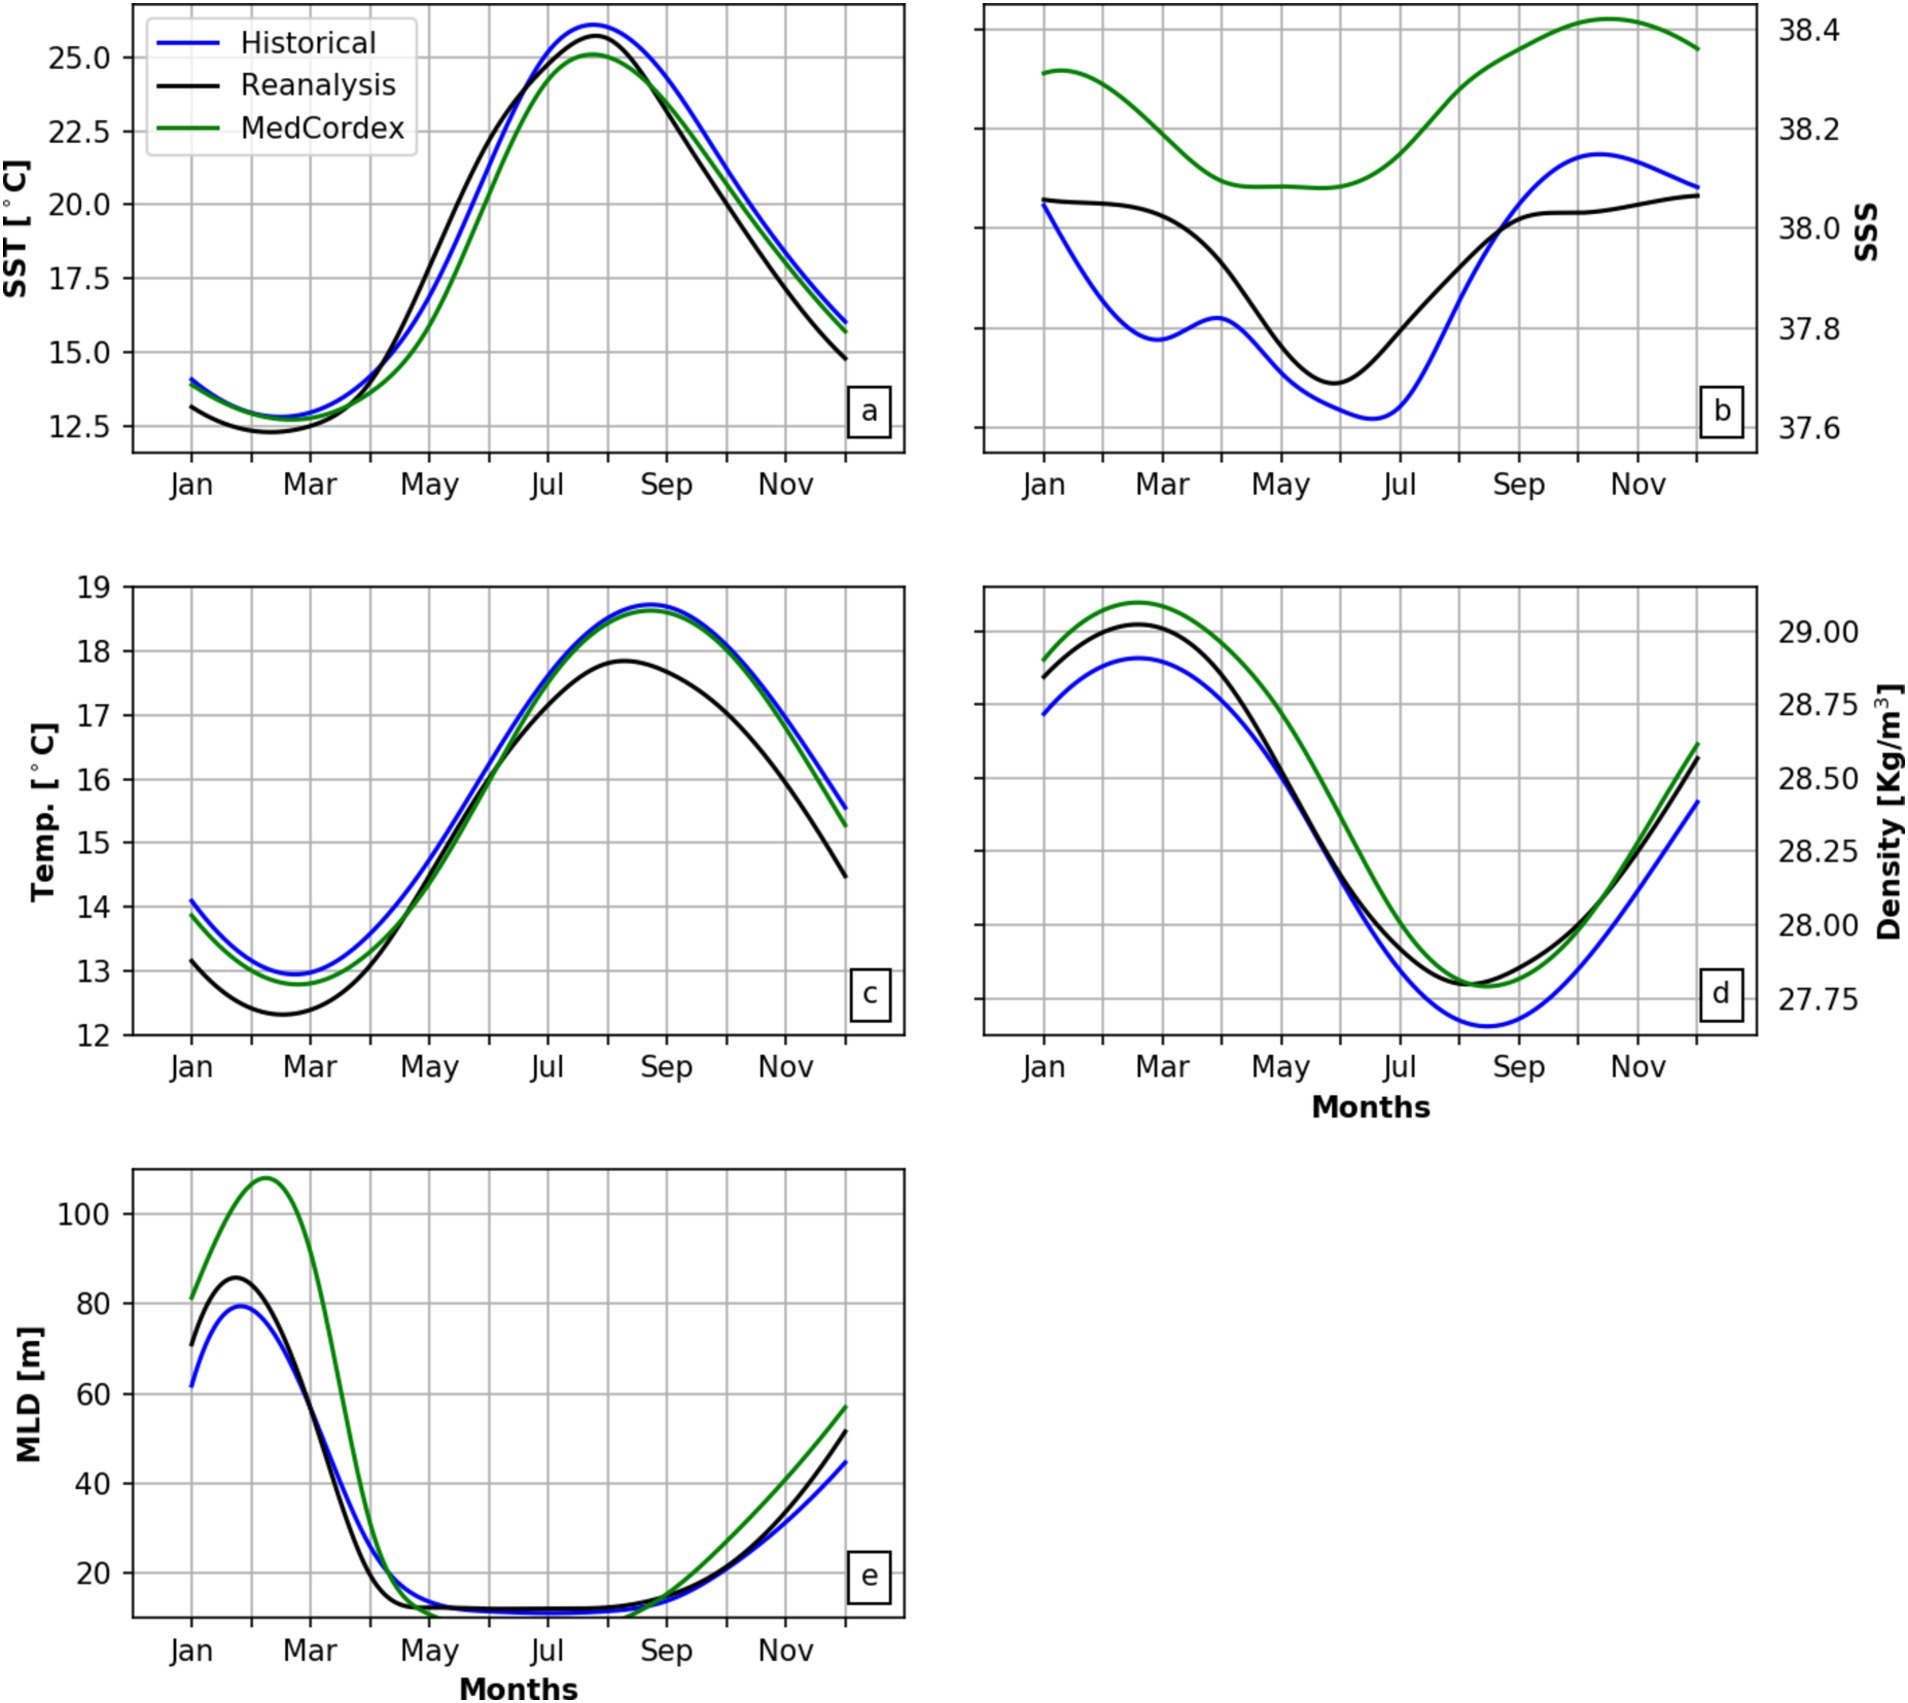
Figure 2. Average month of the year: comparison between the historical simulation (blue line), CMEMS reanalysis (black line) and driving MedCordex RCM (green line) of SST (a), SSS (b), volume averaged temperature (c), density (d), and mixed layer depth (e).
3 Marine climate indicators
3.1 Sea surface temperature
The analysis of Sea Surface Temperature (SST) plays a fundamental role in understanding climate change and is one of the most important physical indicators for monitoring the impacts of global warming. Table 1 overviews the Adriatic Sea mean SST statistical indicators.
The surface-averaged SST shows a difference of approximately 1°C between historical and projected periods (Table 1). However, this difference varies significantly both spatially and temporally. The warming trend in SST alters the surface seasonal cycle, leading to warmer summers and winters (Figures 3a,b). Despite this warming, a decrease of 0.2 ± 1.1°C is observed in the difference between the annual maximum and minimum temperatures. Although this decrease is not statistically significant, it contrasts with the findings of Liu et al. (2024), which reported an increase in amplitude on a global scale and of 0.16 ± 0.07°C for the Northern Hemisphere.
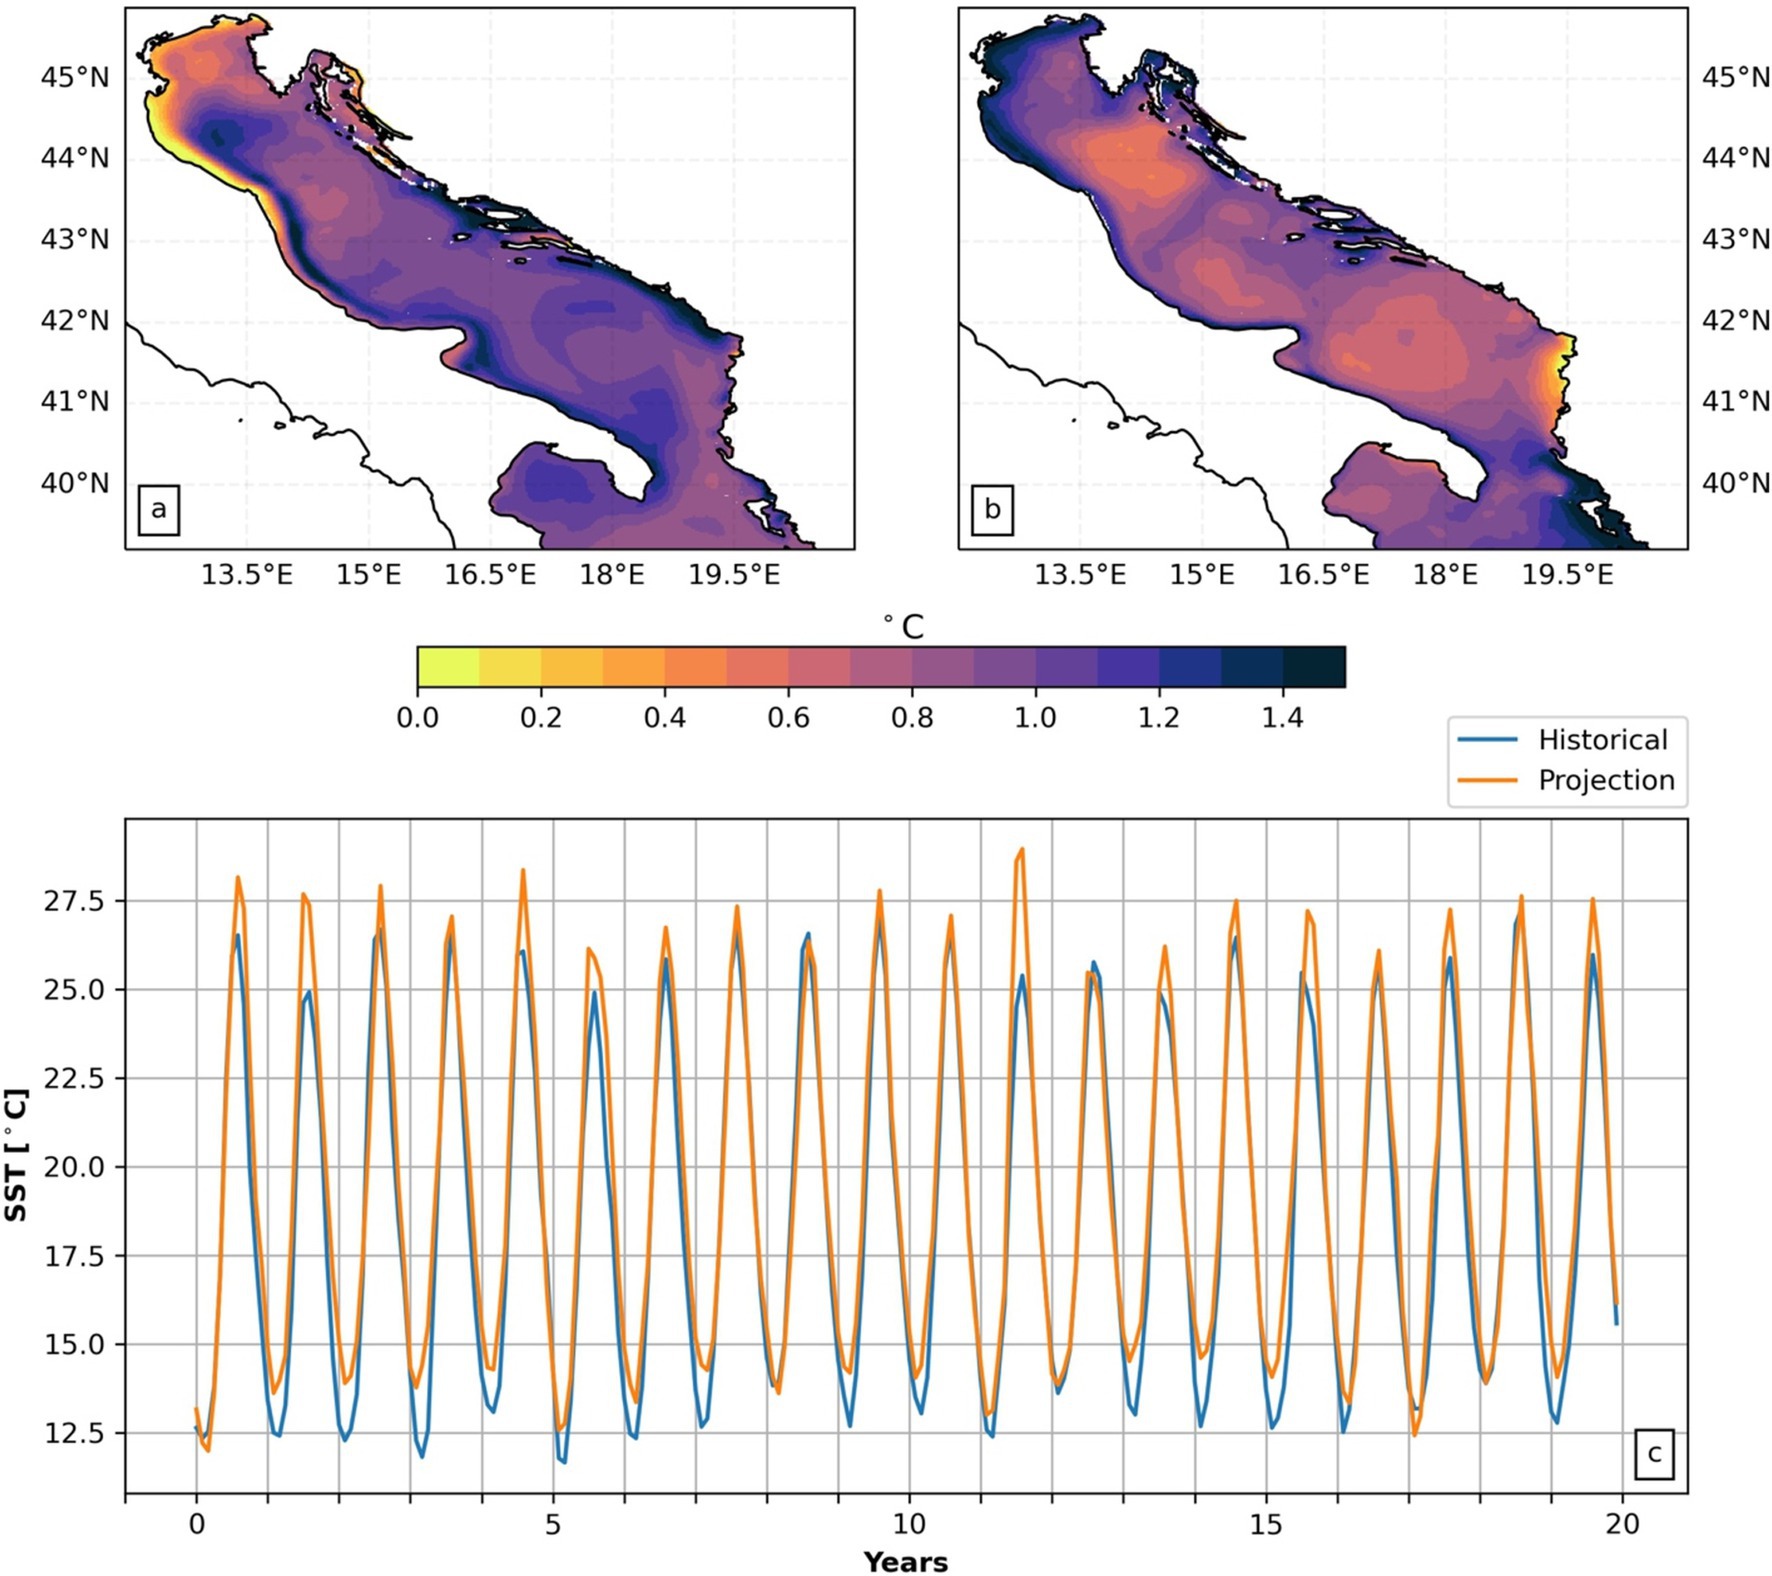
Figure 3. Maps showing the difference in SST between the projection and historical periods for the winter (a) and summer (b); (c) temporal evolution of the monthly averages for the historical period (blue line) and projection period (orange line).
A spatial pattern difference is also evident between the two seasons, with more pronounced warming in the northern Adriatic during summer (Figure 3b), and in the southern and central Adriatic during winter (Figure 3a). In the latter period, this warming trend is more pronounced along the areas occupied by the Western Adriatic Coastal Current (WACC) and the Eastern South Adriatic Current (E-SAd Current), with temperatures potentially rising by up to 1.5°C in these regions (Figure 3a). The cyclonic gyres that form the general circulation of the Adriatic Sea (Pinardi et al., 2015) show the smallest SST increase, particularly during summer (Figure 3b).
SST exhibits strong interannual variability, as shown in the time series (Figure 3c), with a stronger signal in summer for both historical and projected periods. The standard deviation of summer annual means is 0.68°C for the historical period and 0.87°C for the projection, compared to 0.52°C and 0.64°C for winter annual means.
Table 1 shows that the historical period exhibits a larger warming trend compared to the projection period, with rates of 0.04°C/year (about 0.8°C over 20 years) and 0.022°C/year (about 0.45°C over 20 years), respectively. This suggests a potential reduction in the warming rate for the region. This reduction could be linked to a decrease in stratification observed in the projection period, as will be further discussed in the analysis of the Brunt-Väisälä frequency. Additionally, it’s important to highlight that the projection period analyzed here is from 2030 to 2050. Parras-Berrocal et al. (2023) showed that around 2040 an abrupt change in the Adriatic Sea stratification index is expected, mainly associated with deep water formation.
3.2 Ocean heat content
The analysis and monitoring of Ocean Heat Content (OHC) is essential for understanding impacts of climate change on the marine environment. The rise in OHC can result in coral bleaching, species migrations, and disturbances in marine food webs, posing significant implications for biodiversity and fisheries. Ocean heat content (OHC) in Joules is defined as follows:
with z1 = 0 m to z2 = 700 m depth, a reference density ρ0 = 1,030 kg/m3, and a specific heat capacity of cp = 3,980 J/kg°C, where Tyr represents the annual mean temperature. The Anomaly Ocean heat content (aOHC) is defined as follows:
with Tclim the average yearly temperature over the analyzed period itself. In other words, we have a climatology for the historical period and another for the projection period.
It is noteworthy that the trend in the historical period closely matches the one from the reanalysis, with approximately 0.64 W/m2 for the historical period and 0.61 W/m2 for the reanalysis (Table 2; Figure 4A). These values are consistent with those presented by Storto et al. (2019) in the maps of ocean heat content in the Adriatic Sea region. Therefore, the OHC from downscaling is particularly representative of reality for the region in the historical period.
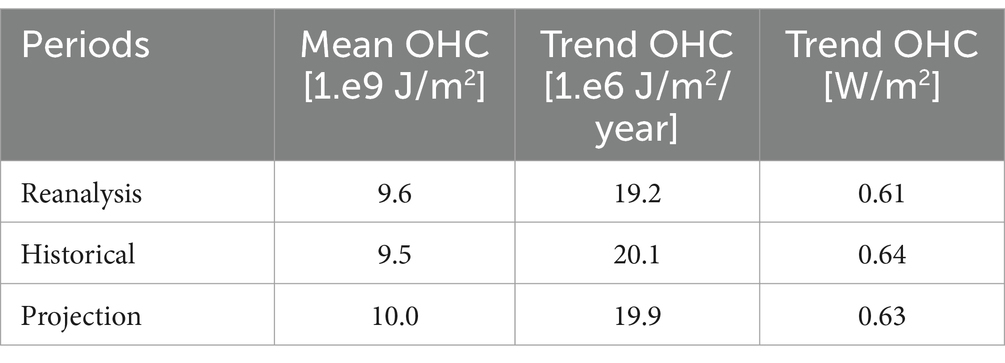
Table 2. Mean values and linear trend of the OHC in the first 700 m, derived from the reanalysis, historical and projected annual mean time series.
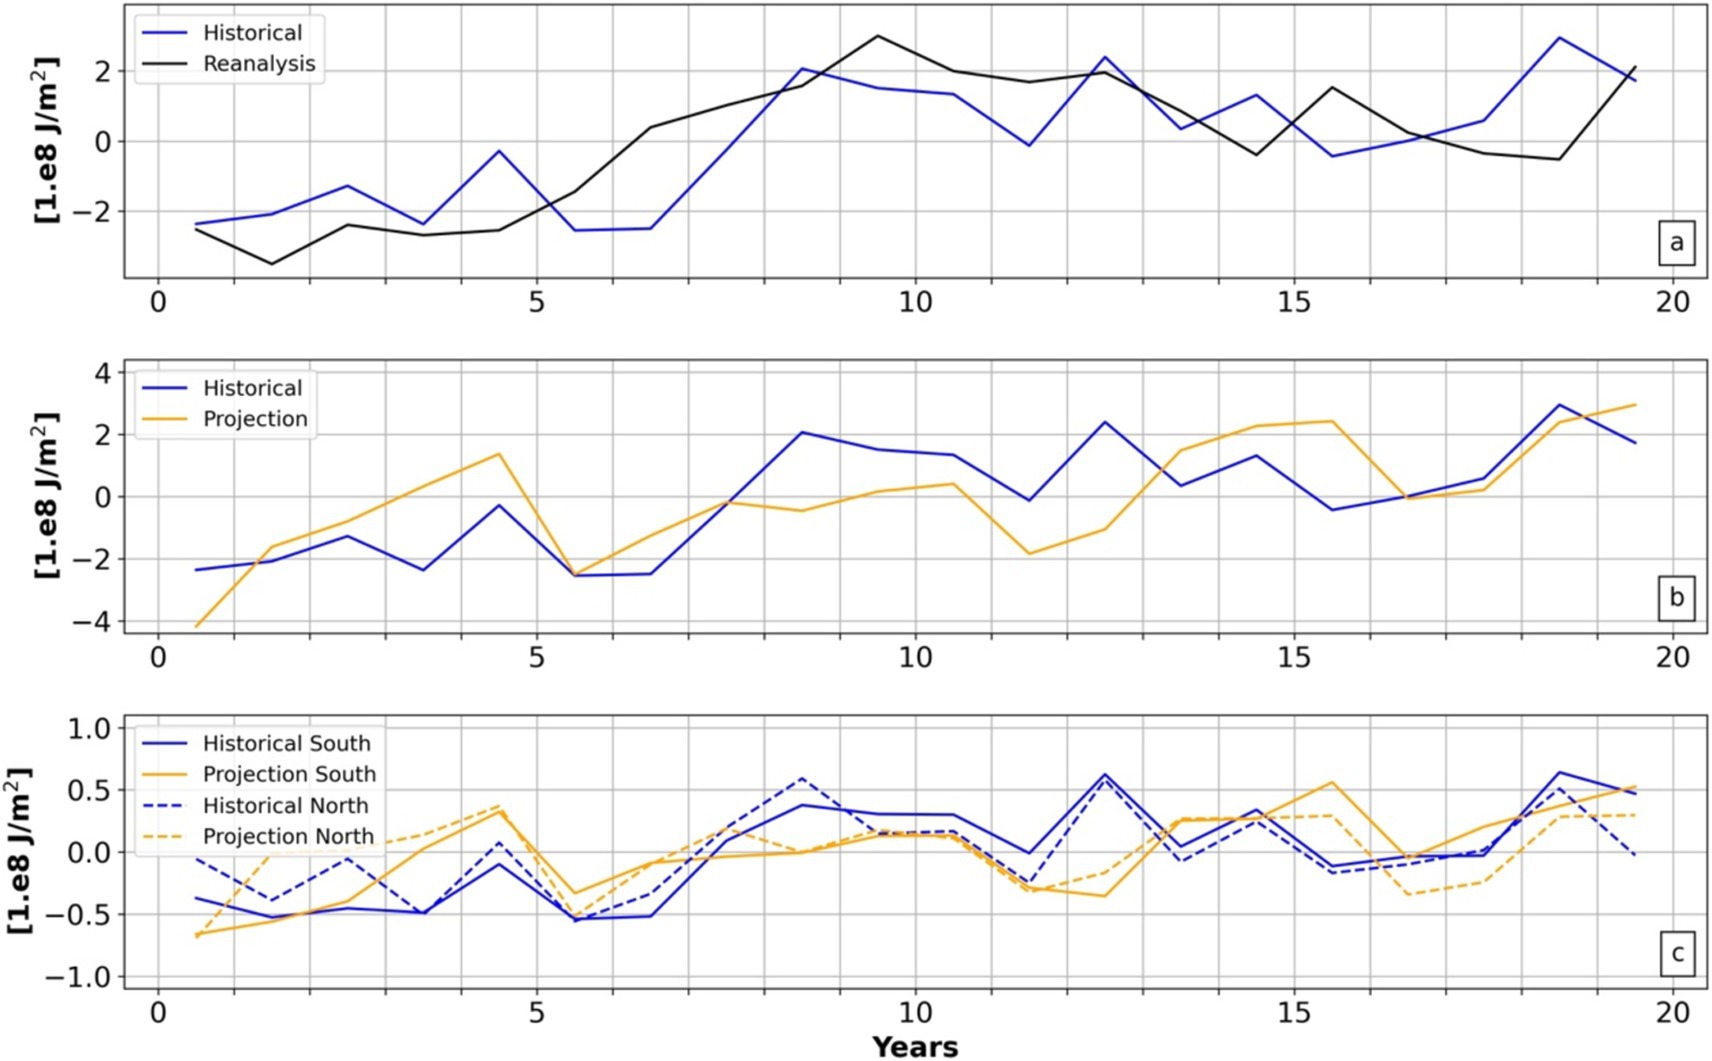
Figure 4. (a) Ocean heat content anomaly variation integrated up to 700 m (historical in blue line, CMEMS reanalysis in black line); (b) ocean heat content variation integrated up to 700 m (historical in blue line, projection in orange line); (c) ocean heat content anomaly variation integrated up to 100 m in the northern region (dashed line) and southern region (solid line).
By comparing with the projection period, an increase of approximately 400 MJ/m2 in OHC is noticeable, representing about 5% more than the historical period, which has an average of approximately 9.5 GJ/m2 (Table 2; Figure 4). The annual linear trends, approximately 0.64 W/m2 for the historical period and about 0.63 W/m2 for the projection period, provide further evidence of a potential warming slowdown in the basin.
As indicated by previous coarser resolution studies for the whole Mediterranean Sea (Storto et al., 2019), it is evident that this variation and warming trend is predominantly concentrated in the southern region of the Adriatic Sea (Figure 1), during both the historical and projection periods, accounting for nearly 70% of the overall variation (Figure 4c—here, the OHC was integrated up to 100 m to allow for an equitable comparison between the regions). This result highlights the southern region of the Adriatic Sea has having the major impacts from climate change in terms of the OHC indicator. This might result in an impact on the Southern Adriatic Sea meridional overturning circulation and in dense water mass formation rates (Verri et al., 2018).
3.3 Marine heatwaves
MHWs represent anomalous warm seawater events known for their disruptive effects on marine ecosystems (Oliver et al., 2021; Jacox et al., 2022). An MHW is defined as a discrete period of prolonged (more than 5 days) anomalous ocean temperatures surpassing a defined threshold in a specific ocean region. Climate change significantly influences the long-term trends of MHW characteristics, including frequency, intensity, and duration. Projections indicate that MHW frequency, intensity, and duration will persist under future emission scenarios, potentially leading to a permanent MHW state in much of the global ocean by the late twenty-first century (Oliver et al., 2021).
Due to substantial ocean warming, defining an appropriate baseline period becomes a crucial aspect of MHW analysis. Establishing a local, daily-based, upper-percentile (90th percentile) climatology of Sea Surface Temperature (SST) serves as the threshold for MHW detection (Hobday et al., 2016). The choice of the baseline period significantly affects the long-term trend in mean SST, thereby influencing the detection and characteristics of MHWs. Here, we not only present MHW characteristics using the baseline of the analyzed period (i.e., the climatological threshold for the historical period based on the historical period itself and for the projection period based on the projection period itself), but also, in the case of the projection period, characterize them in relation to the historical period baseline. The selection of the baseline is guided by specific research questions of interest (Oliver et al., 2021).
In the historical period, the MHW average duration for the entire Adriatic basin was 29 days, with approximately 1.2 events per year (Figures 5a,b). This aligns with findings by Dayan et al. (2023), who utilized 30 years (1987 to 2016) of the reanalysis. For the projection period, the average duration increases to 36 days, with an average of 1.7 events per year (Figures 5c,d). Spatially, we observe longer average MHW duration in the historical period (Figures 6a,b) than in the projection, particularly in the northern region. The difference in MHW events duration values when calculating the average over a region compared to pointwise calculations for the same region can be attributed to the spatial and temporal variability of SST. When averaging over a region, you aggregate temperatures from various locations within that region. This average might smooth out temporal and spatial variations, resulting in an average duration that may differ from pointwise calculations. This discrepancy underscores the importance of understanding spatial and temporal scales when analyzing events like MHWs, as local variations can significantly influence the results. However, higher average intensities are noted in the projection period for the southern and central regions of the Adriatic basin, whereas for the northern region and along the northeast coast, the MHW intensities are higher in the historical period (Figures 6c,d).
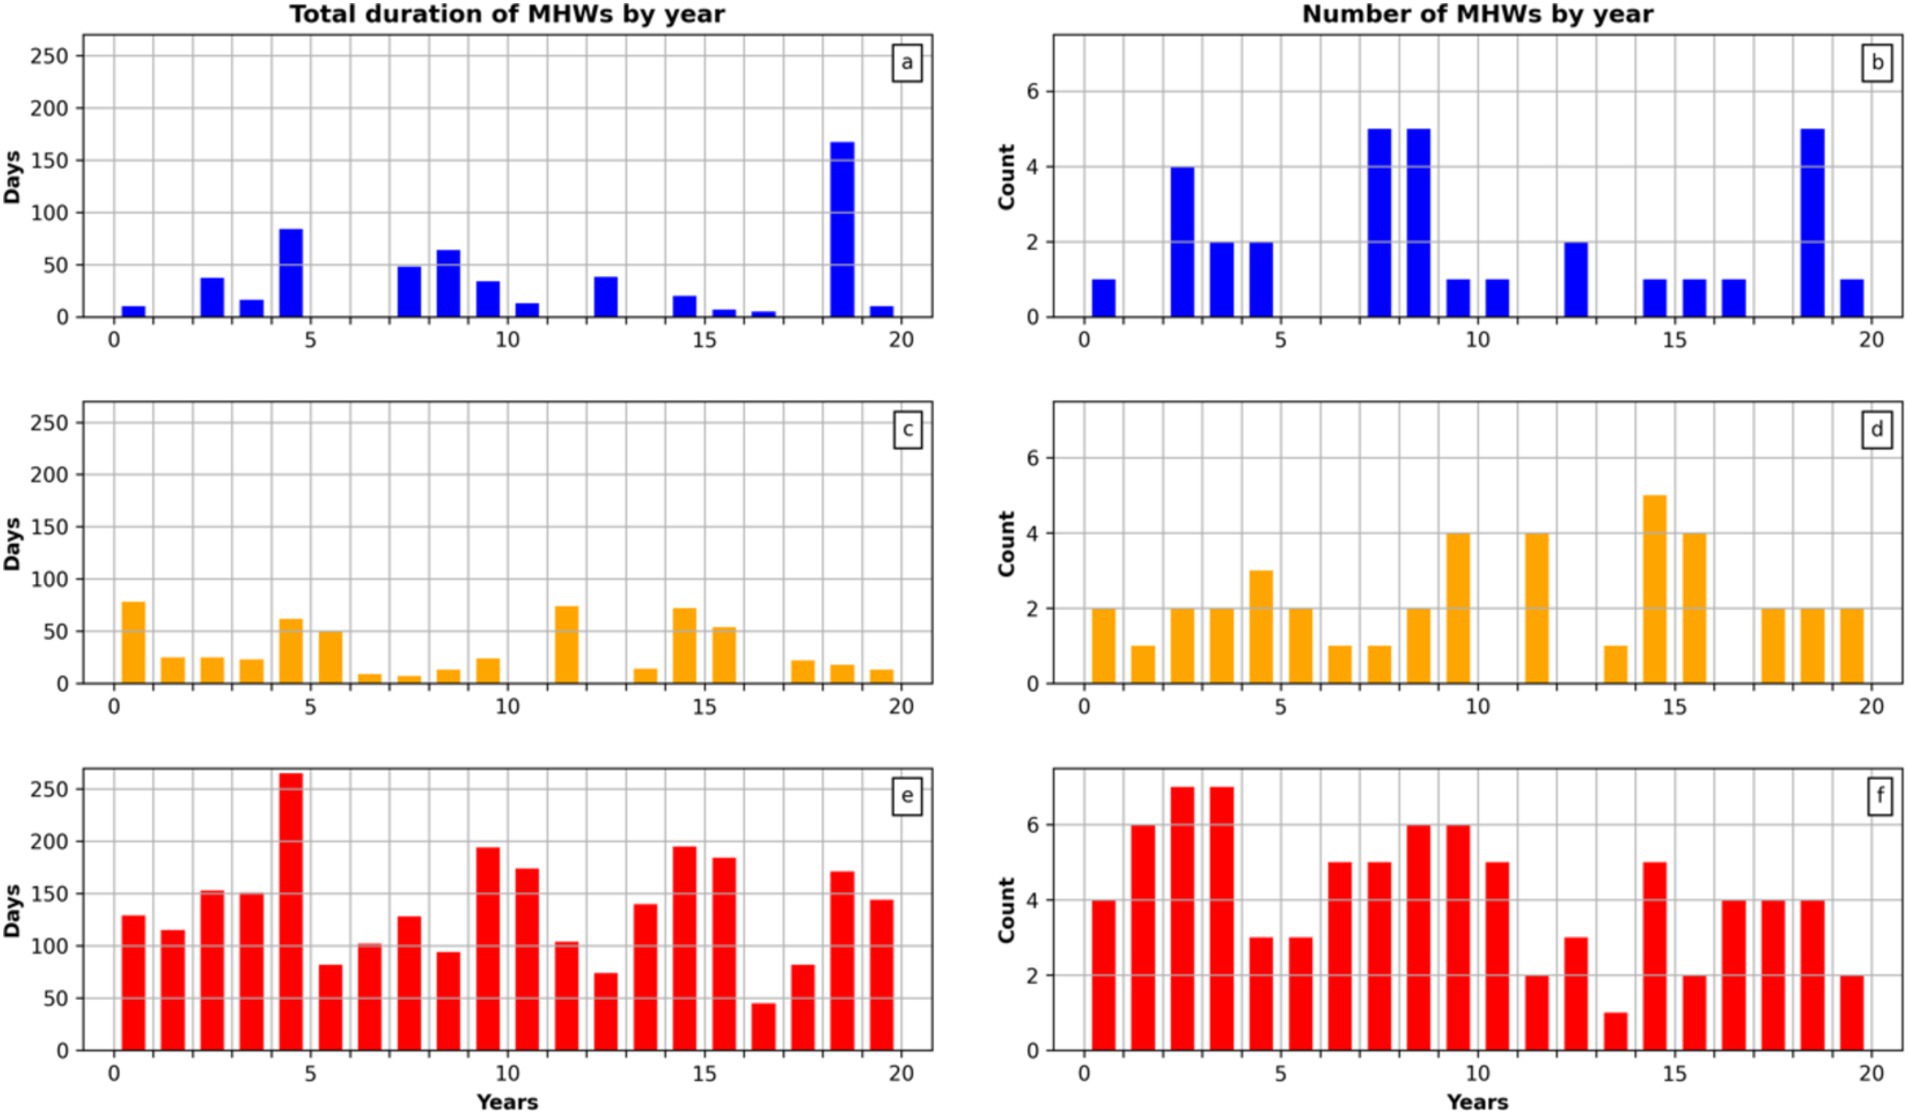
Figure 5. First column: the total duration of all MHW detected in each year of the time series averaged for the Adriatic basin region. Second column: the total number of MHW detected in each year of the time series averaged for the Adriatic basin region. The first row (a,b) corresponds to events from the historical period, the second row (c,d) represents events for the projection period, and the third row (e,f) indicates events calculated for the projection period but with the baseline climatology derived from the historical period.
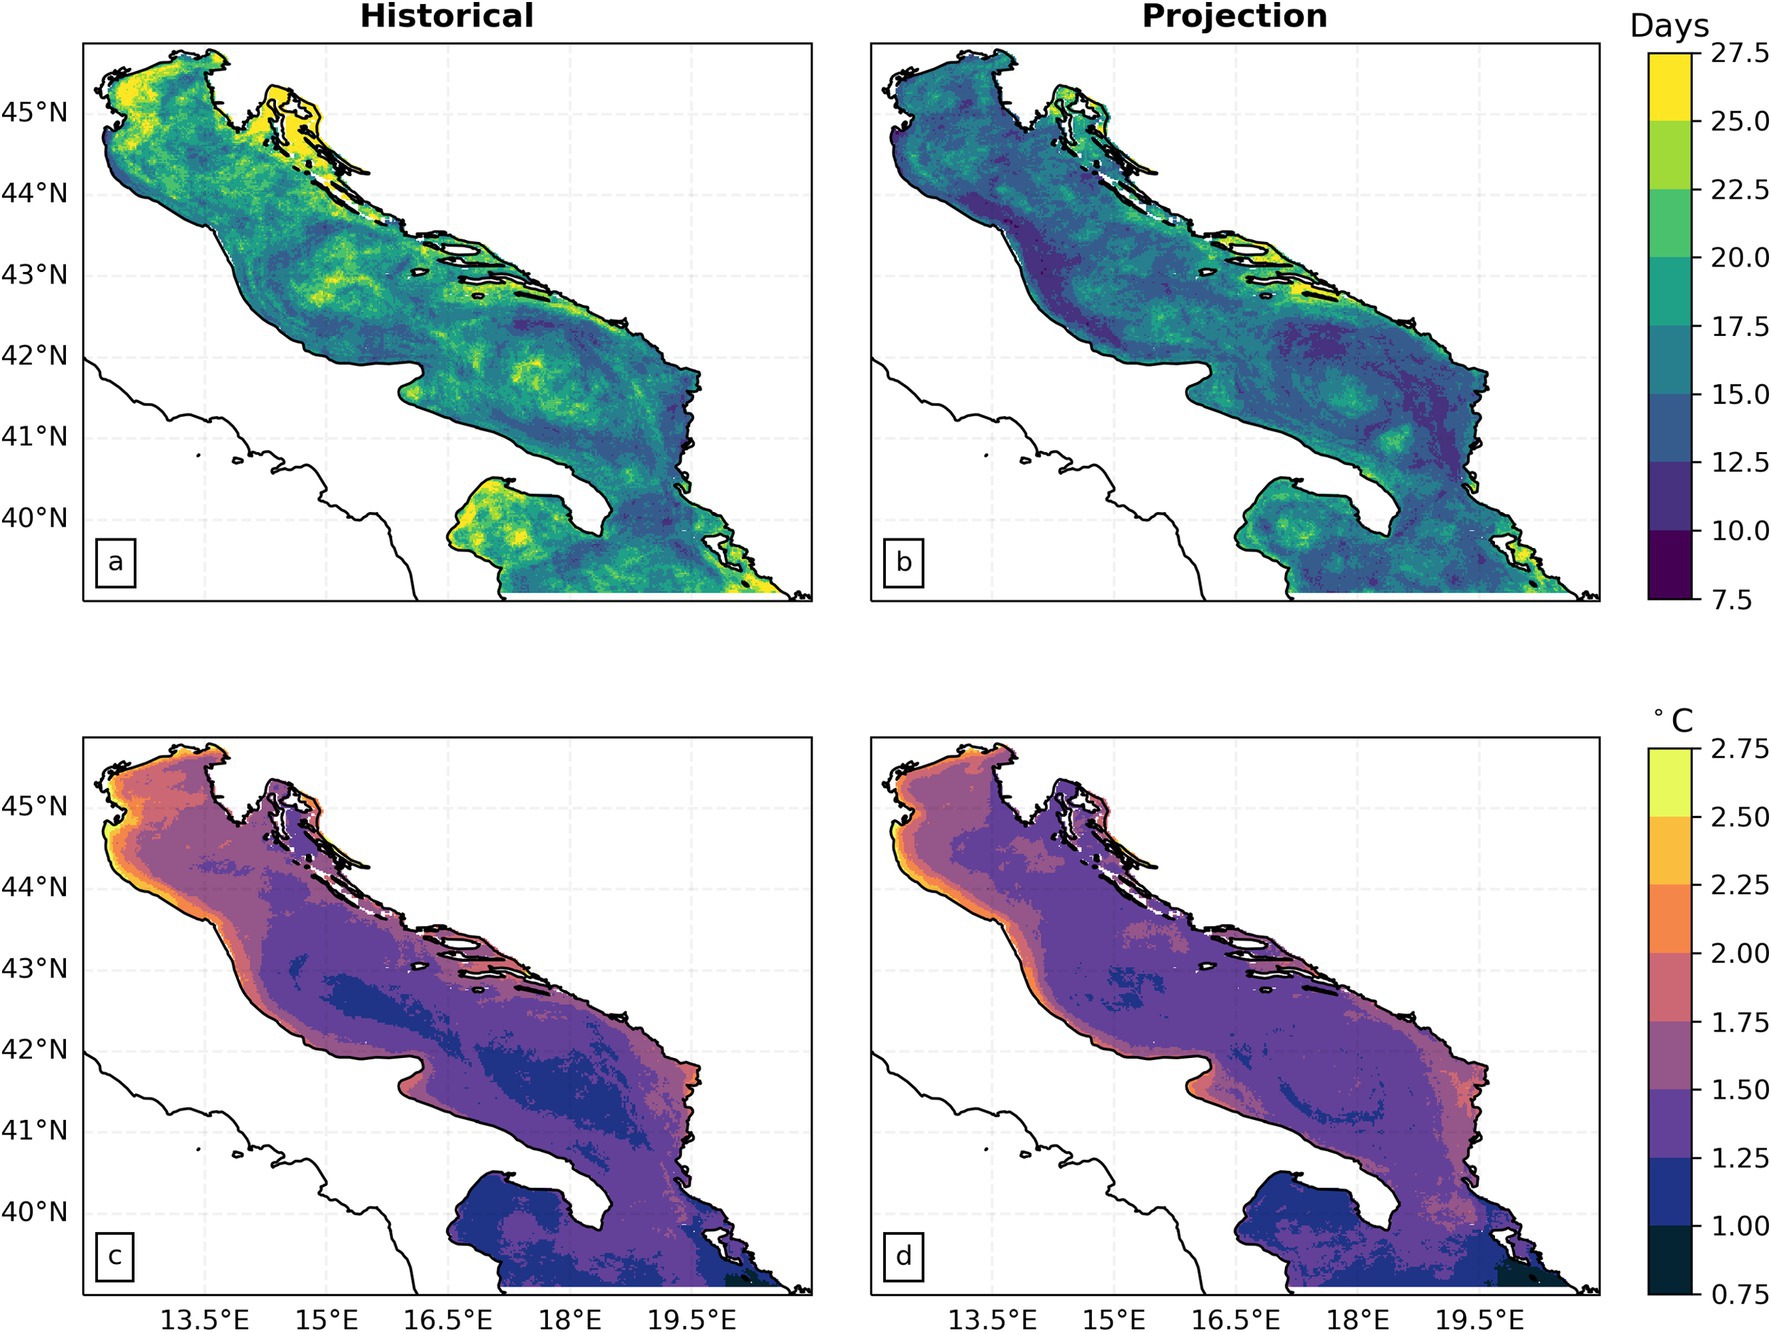
Figure 6. Maps of MHWs mean duration (a,b) and intensity (c,d) for the historical (first column) and projection periods (second column).
Using the historical period to construct the climatological threshold for detecting MHWs in the projection period reveals a substantial increase in the average event duration, exceeding 180 days, along with an almost 50% increase in the number of events, averaging 2.5 per year (Figures 5e,f). Obviously, the number of events per year does not increase as much, as we observe a significant increase in the duration of these events when compared to the MHW events calculated using the project period itself as the climatological threshold.
3.4 Vertical stability (Brunt-Väisälä frequency)
Changes in vertical stability can indicate alterations in ocean circulation, heat transport and vertical mixing, providing insights into regional climate impacts. The Brunt-Väisälä frequency (N) is related to the vertical stability of the water column. It is defined as:
where g is the gravitational acceleration, ρ0 is the reference seawater density and ∂ρ/∂z is the vertical density gradient. N represents the oscillation frequency of a vertically displaced fluid parcel in a statically stable environment. N can be considered a measure of ocean stratification. High N values indicate a highly stable and stratified ocean, while values around 0 indicate a nearly neutral environment. N is inversely related to turbulent mixing and it has been used to estimate mixing for marine good environmental state indicators, as prescribed in the Marine Strategy Framework Directive (Fratianni et al., 2016).
The historical period shows a maximum N of 6.5 cycles/h at a depth of around 16 m, while the scenario shows a maximum N of 5.5 cycles/h at a depth of 23 m (Figure 7a). In general, compared with the historical simulation, a noticeable decrease in N is observed in the upper levels of the scenario up to a depth of around 70 m. Below this depth, N increases with a maximum difference of around 0.35 cycle/h extending between 100 and 900 m. Below 900 m depth, the differences between the historical and projected periods are almost negligible (Figure 7a). The signature of buoyancy input due to main rivers is clearly visible in the northern Adriatic historical period and in other areas along the eastern Adriatic (Figure 7c). The projection period shows the general decrease in the maximum value of N in the runoff influenced areas because of the general decrease of discharge (Figure 7d). This is even more evident when looking at the difference map (Figure 7b), where it is shown that in coastal areas the N difference between projection and historical may reach and exceed −10 cycles/h.
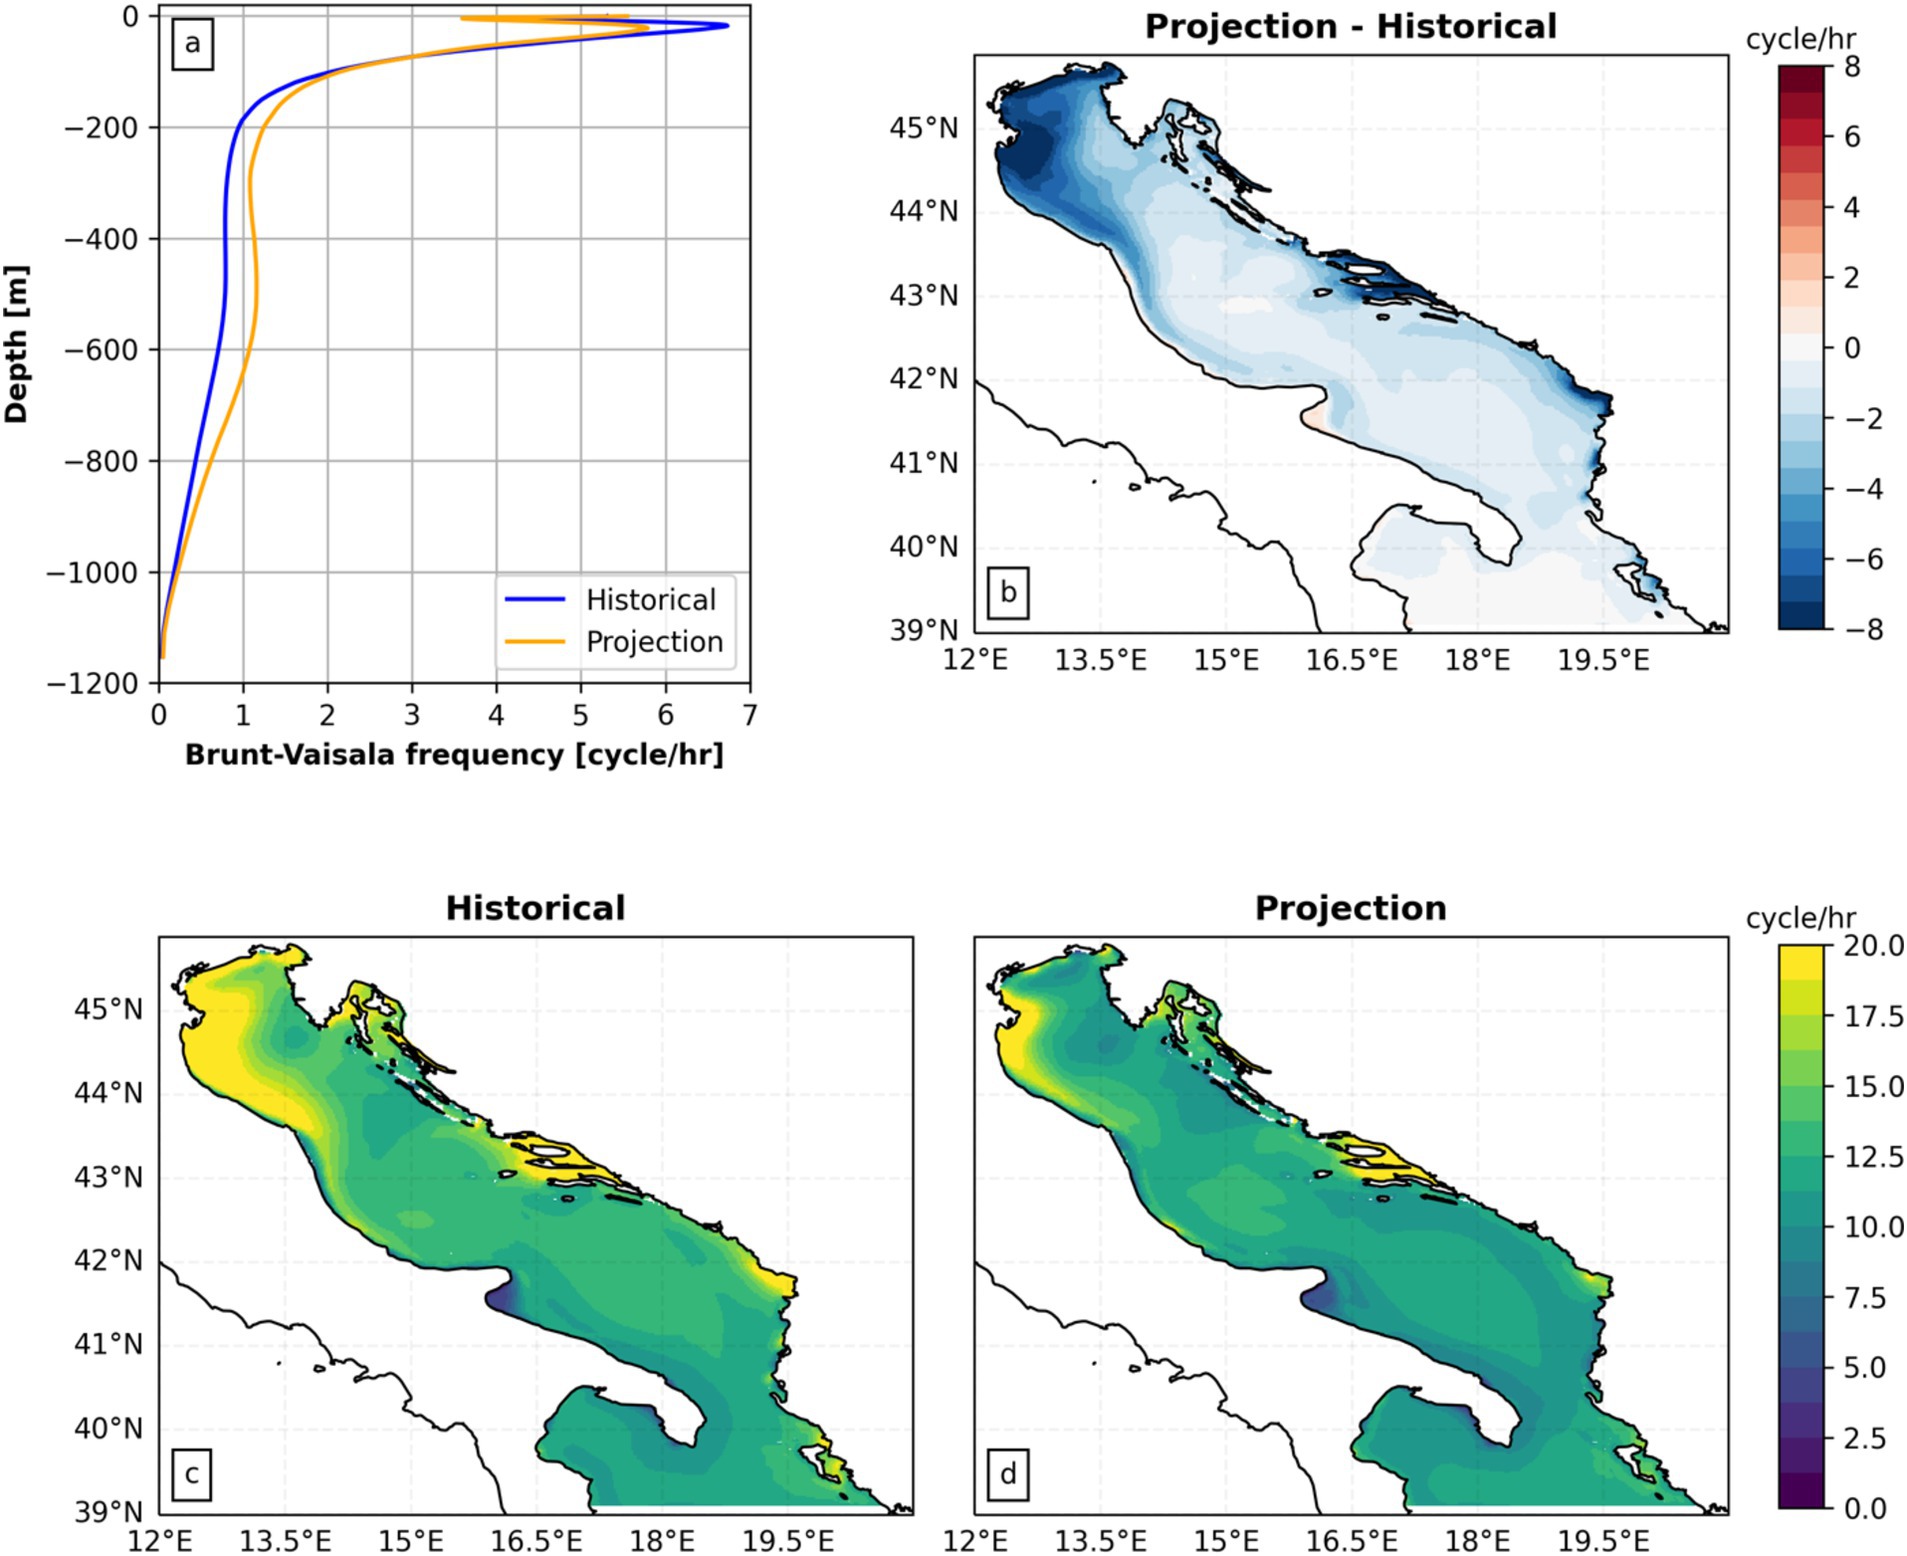
Figure 7. (a) Mean profile of Brunt-Väisälä frequency (N) for the historical period (blue line) and the projection period (orange line). (b) Map of the difference in maximum mean N between the projection and historical periods. (c) Map of the maximum mean N for the historical period. (d) Map of the maximum mean N for the projection period.
This Brunt-Väisälä frequency behavior is suggested to be the result of two effects. The decrease in river discharge in the mid-term projection is expected to lead to an increase in salinity (hence density increase), especially in the upper levels, with the tendency to destabilize the water column. On the other hand, the expected temperature increase (lower density) tends to increase stratification. Eventually, a destabilization of the water column (lower N values) is prevailing in the upper levels, in the freshwater influenced areas, where density variations are driven by the salinity increase. In the middle to lower levels, temperature effects on density are dominant, leading to a more stratified water column between 100 to 900 m. This again might have importance in the dense and deep water mass formation processes in the Southern Adriatic Sea, a phenomenon to be studied in the future.
3.5 Sea level rise
One of the most evident impacts of climate change at the coast is the sea level rise. Sea level change exhibits a distinct regional pattern, with certain areas experiencing significant deviations from the global mean change (Wang et al., 2021). Therefore, monitoring and projecting the mean sea level in regional climate models are essential to comprehend the impacts on coastal segments, devise effective adaptation measures, and anticipate extreme events associated with climate change. Both temperature and salinity changes can play a substantial role in sea level changes, altering the ocean volume through thermal expansion or haline contraction.
As an example, using satellite altimetry data, the global Mean Sea Level (MSL) rise rate from 1993 to 2017 has been measured at 3.2 ± 0.4 mm/year (Fox-Kemper et al., 2023). Conversely, for the Mediterranean Sea region during the same period, the growth rate has been calculated to be 2.5 ± 0.4 mm/year (Mohamed et al., 2019) for the period between 1993 and 2019 and Meli et al. (2023) obtained 2.1 ± 0.5 mm/year subtracting the Glacial Isostatic Adjustment (GIA) contribution. Therefore, understanding whether the Adriatic Sea follows the Mediterranean trend or exhibits significant variations due to the internal dynamics of the region is crucial.
The haline contraction and thermal expansion of the Adriatic water column act in opposite ways on sea level changes. The MSL is defined as the sum of the mass change components, resolved by the numerical model under the incompressible assumption, thereafter called MSSH, and the steric components that accounts for thermosteric and halosteric contributions (Pinardi et al., 2014). We have computed the Total Sea Level (TSL) addying the mass and steric components for the historical and projected periods.
Our results indicate that the Adriatic Sea Mean TSL (MTSL) increases in the mid-term (projection period) throughout the entire Adriatic Basin, changing an average value of approximately 0.10 m. It can be asserted that this increase is primarily due to the steric components, as area average SSH decreases over time (shown in Verri et al., 2024), possibly due to the lower runoff, and an increasing evaporation rate. Meli et al. (2023) calculate the contribution of the steric component to the MSL showing a partial compensation between thermosteric and halosteric contributions.
A noticeable change in the spatial variation pattern of sea level is observed, transitioning from a more homogeneous variation to a clear latitudinal variation, with a decrease towards the northeast of the Adriatic in the mid-term projection (Figures 8a,b). A local minimum is found in the core of the Southern Adriatic cyclonic gyre in both cases, becoming more intense in the projection due to gyre intensification. Additionally, higher sea level values are noted along the west coast.
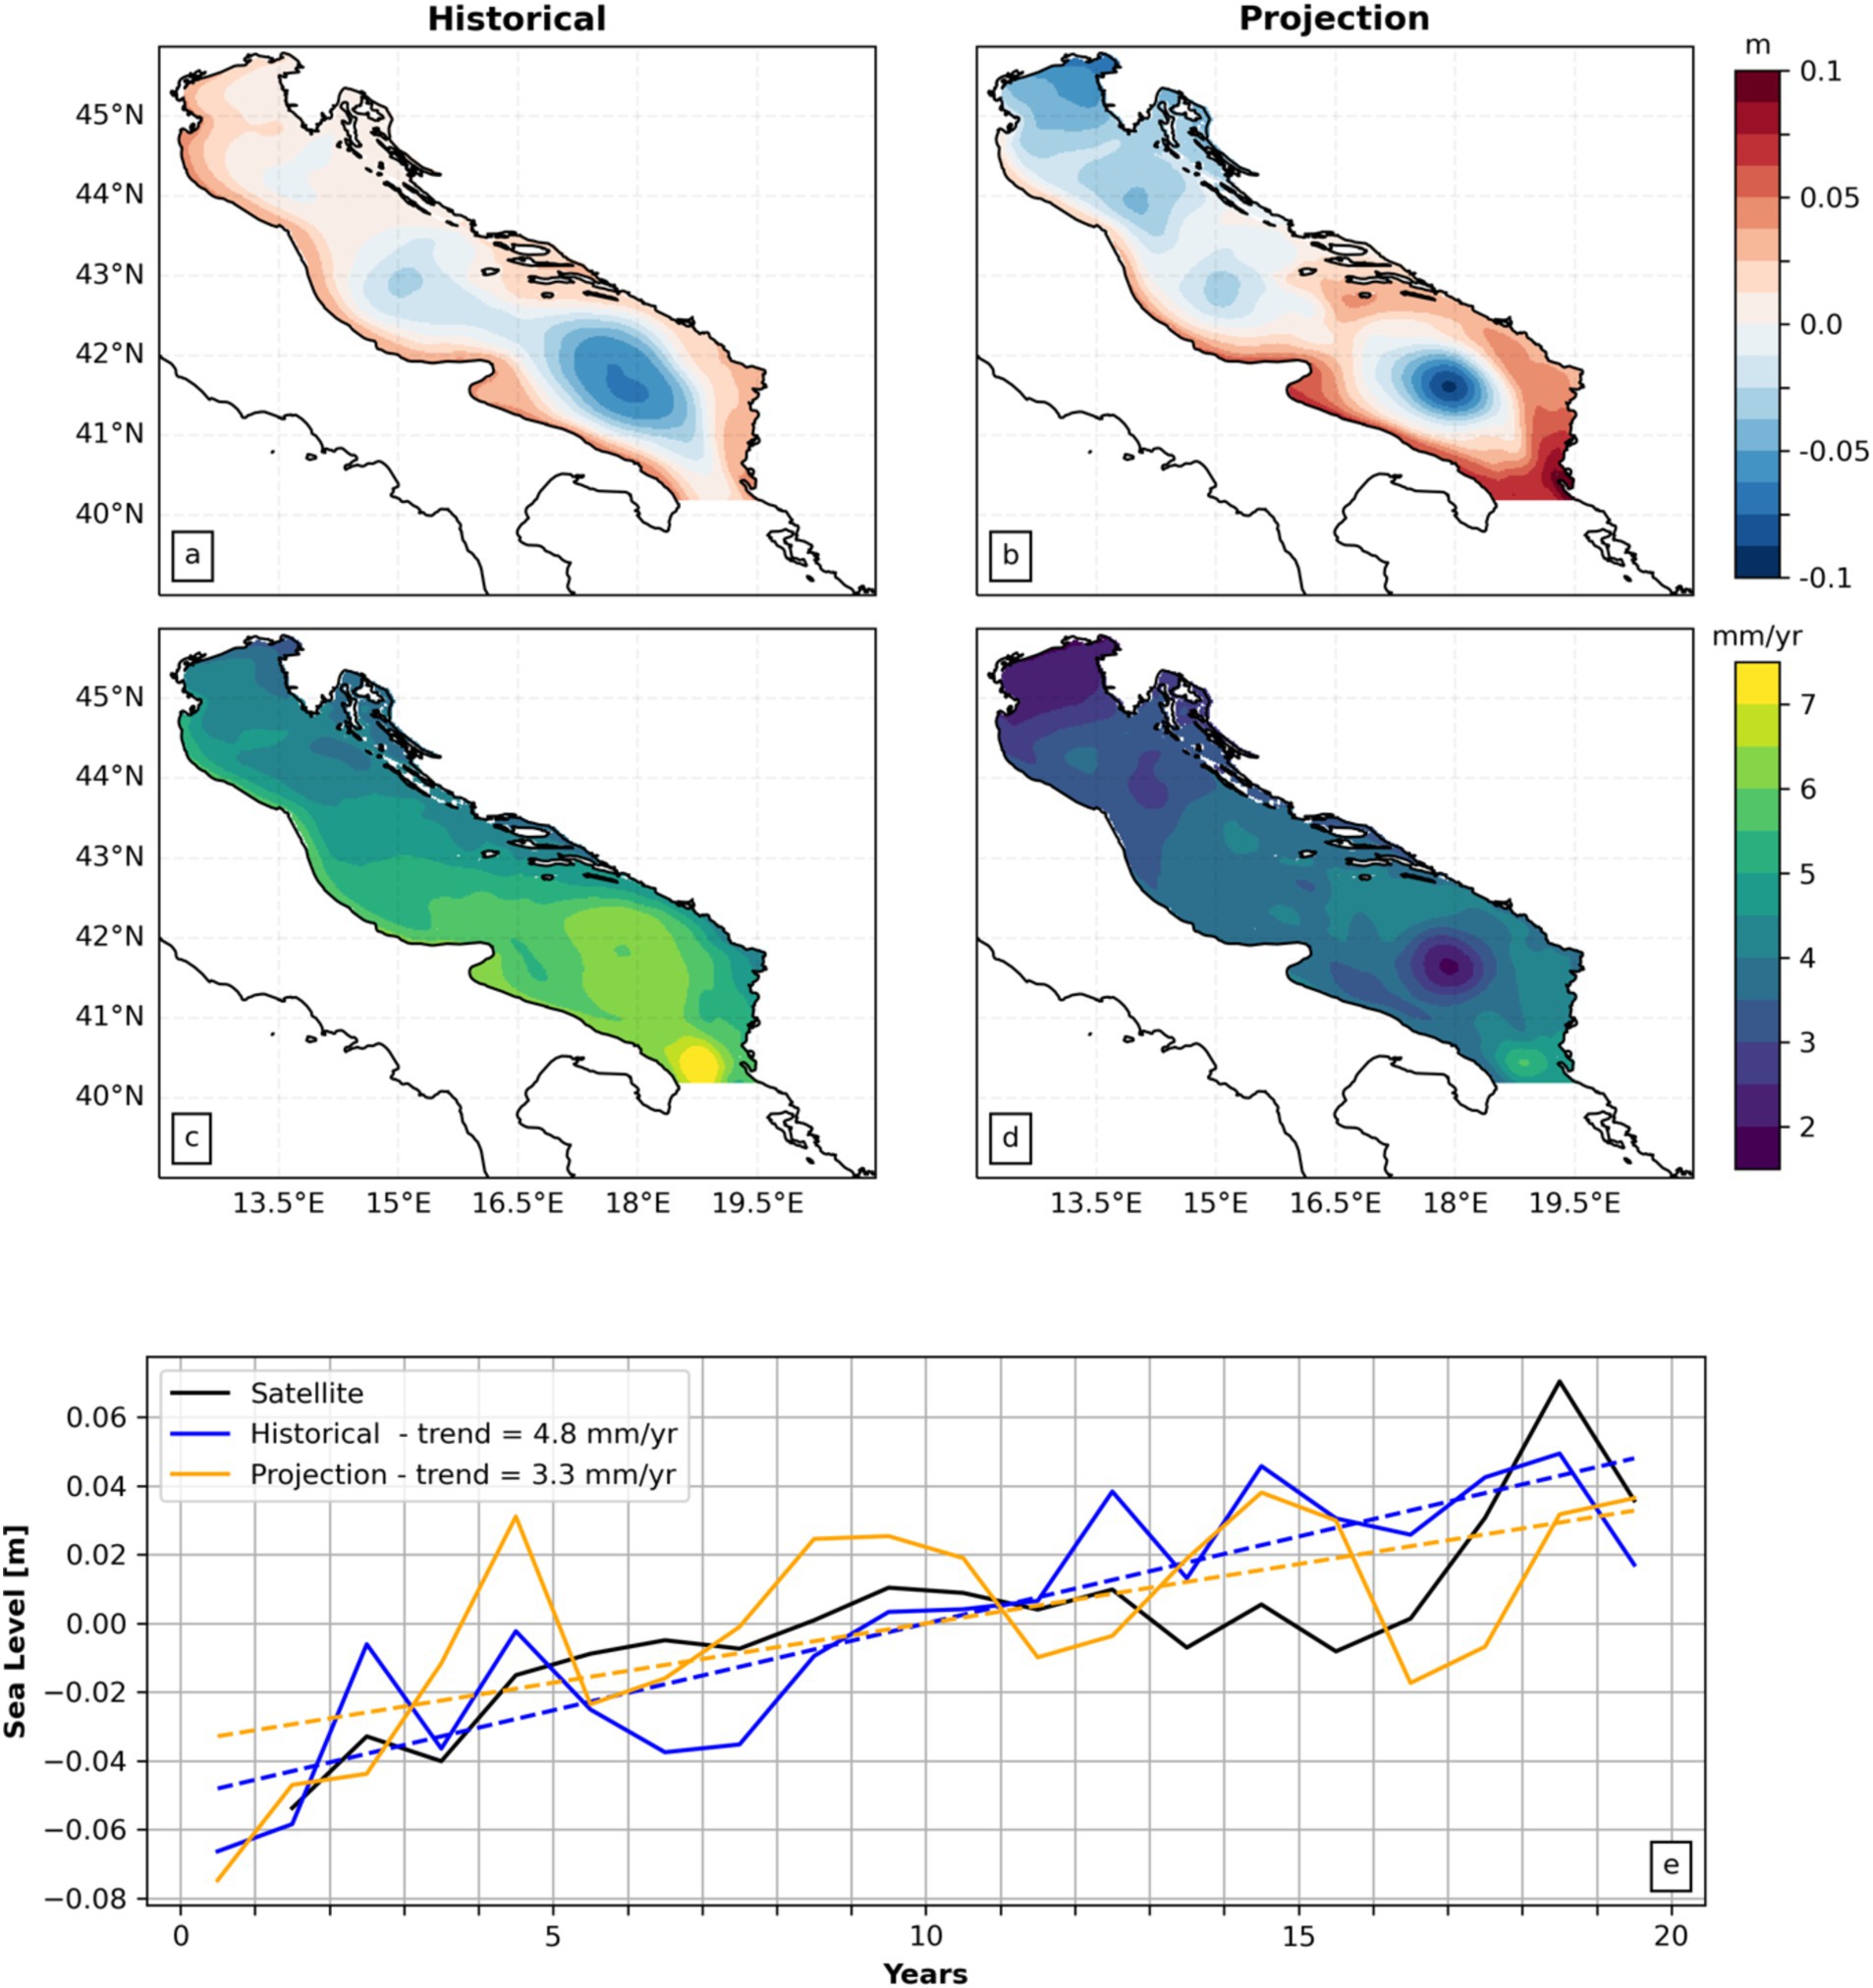
Figure 8. (a,b) Time average total sea level (the sum of SSH and steric effects) anomaly, for the historical and projection periods, respectively. (c,d) Linear trend of total sea level for the historical and projection periods, respectively. (e) Temporal variation of yearly average MTSL anomaly for the historical period (blue line) and the projection period (orange line). Dashed lines indicate the linear trend of the series. The black line represents the temporal variation of the annual mean MSL obtained from satellite altimetry data.
This latitudinal variation pattern of sea level, decreasing towards the northeast and higher values along the west coast, reflects the sea level trend fields from the historical period (Figure 8c). This indicates a increasing trend throughout the region in the historical period, with average values of +4.8 mm/year, representative of satellite altimetry observations (Figure 8e), but with more intense values in the Southern Adriatic region, exceeding +7.5 mm/year, and along the west coast, with values reach up to +5.5 mm/year in the Emilia-Romagna coast region.
The projections indicate a decrease in the sea level trend, with average values for the region dropping to +3.3 mm/year (Figure 8e), with values below +2 mm/year in the northern Adriatic region (Figure 8d). The reason for this decrease are the compensating effects between thermosteric and halosteric effects, as already shown by Meli et al. (2023) and the decrease in the water budget due to river discharge as shown in Verri et al. (2024).
4 Conclusion
This study has presented a set of marine climate indicators using a climate downscaling dataset for the RCP8.5 scenario in the Adriatic Sea. We have uncovered insights into Sea Surface Temperature (SST) trends, Ocean Heat Content (OHC) changes, Marine Heatwaves (MHWs) frequency and anplitude, Vertical Stability (Brunt-Väisälä Frequency), and Sea Level Rise for an historical reference period (1992–2011) and the projection period (2031–2050).
A warming trend in SST, particularly evident along the area occupied by the Western Adriatic Coastal Current, shows the relevant differences between various regions of the Adriatic Sea. The OHC indicator analysis shows that the south Adriatic region is a hotspot for heat accumulation. Both SST and OHC however show a trend slow down in the projection with respect to the historical reference period.
The Brunt-Väisälä frequency shows a decrease of vertical stability in the Northern, river discharge dominated areas due to the increasing salinity while the southern Adriatic shows a large vertical stability between 100 and 900 m depth. The intensification of MHWs in terms of both duration and intensity, especially in the projection period, serves as a poignant reminder of the impending ecological and socio-economic repercussions.
The Total Sea Level (TSL) analysis confirms a showdown of the rate of Mean TSL, especially in the Northern Adriatic, due a combination of effects, the compensation between growing temperature and salinity and the decreased river discharge. A specific analysis of this trend is being formalised in a companion paper for the satellite altimetry signal (Borile et al., 2024).
The dynamism of the Adriatic Sea, coupled with the evolving nature of climate change, necessitates continuous monitoring and refinement of models for heightened accuracy in future projections. In a parallel paper, Mentaschi et al. (2024) have shown that the changes in temperature, river discharge and vertical stability determine a decresing trend in the marine primary producer biomass and increased acidification. The cumulative impacts of these factors will significantly influence our ability to adapt to climate change. It is essential to present them collectively, especially when seeking solutions for adaptation.
Data availability statement
The datasets presented in this study can be found in online repositories. The names of the repository/repositories and accession number(s) can be found below: https://erddap-adriaclim.cmcc-opa.eu/erddap/index.html.
Author contributions
VC: Conceptualization, Data curation, Formal analysis, Funding acquisition, Investigation, Methodology, Software, Supervision, Validation, Visualization, Writing – original draft, Writing – review & editing. JA: Data curation, Formal analysis, Investigation, Software, Writing – original draft, Writing – review & editing. GV: Conceptualization, Data curation, Funding acquisition, Investigation, Project administration, Software, Supervision, Writing – original draft, Writing – review & editing. LM: Writing – original draft, Writing – review & editing. RG: Writing – original draft, Writing – review & editing. NP: Conceptualization, Data curation, Formal analysis, Funding acquisition, Investigation, Methodology, Resources, Software, Supervision, Validation, Writing – original draft, Writing – review & editing.
Funding
The author(s) declare financial support was received for the research, authorship, and/or publication of this article. This work has received funding from the AdriaClim project, Italy (climate change information, monitoring and management tools for adaptation strategies in Adriatic coastal areas; project ID 10252001). The authors would also like to thank the financial support from Spoke 4—ICSC–Centro Nazionale di Ricerca in High Performance Computing, Big Data and Quantum Computing, funded by European Union–NextGenerationEU; Project name: PNRR-HPC; Project number: CN00000013; CUP: C83C22000560007.
Acknowledgments
The authors are grateful to the AdriaClim project Coordinator Dr. Andrea Valentini and the leading Partner Agency for Prevention, Environment and Energy of Emilia-Romagna (Arpae). Thanks go also to Rita Lecci and Alessandro De Donno from ROFS Division of CMCC Foundation for the setting up and the maintenance of the AdriaClim Project repository on ERDDAP Server.
Conflict of interest
The authors declare that the research was conducted in the absence of any commercial or financial relationships that could be construed as a potential conflict of interest.
Publisher’s note
All claims expressed in this article are solely those of the authors and do not necessarily represent those of their affiliated organizations, or those of the publisher, the editors and the reviewers. Any product that may be evaluated in this article, or claim that may be made by its manufacturer, is not guaranteed or endorsed by the publisher.
References
Almaliki, A. H., Zerouali, B., Santos, C. A. G., Almaliki, A. A., Silva, R. M., Ghoneim, S. S. M., et al. (2023). Assessing coastal vulnerability and land use to sea level rise in Jeddah province, Kingdom of Saudi Arabia. Vaccine Rep. 9:e18508. doi: 10.1016/j.heliyon.2023.e18508
Artegiani, A., Paschini, E., Russo, A., Bregant, D., Raicich, F., and Pinardi, N. (1997). The Adriatic Sea general circulation. Part I: air– sea interactions and water mass structure. J. Phys. Oceanogr. 27, 1492–1514. doi: 10.1175/1520-0485(1997)027<1492:TASGCP>2.0.CO;2
Boé, J., Terray, L., Habets, F., and Martin, E. (2007). Statistical and dynamical downscaling of the seine basin climate for hydro‐meteorological studies. Int. J. Climatol. 27, 1643–1655. doi: 10.1002/joc.1602
Borile, F., Pinardi, N., Lyubartsev, V., Ghani, M. H., Navarra, A., Alessandri, J., et al. (2024). Mediterranean and Adriatic Sea mean sea level slowdown. Front. Clim.
Dayan, H., McAdam, R., Juza, M., Masina, S., and Speich, S. (2023). Marine heat waves in the Mediterranean Sea: an assessment from the surface to the subsurface to meet national needs. Front. Mar. Sci. 10:1045138. doi: 10.3389/fmars.2023.1045138
Eliawa, A., Numanoğlu Genç, A., Tora, H., and Maraş, H. H. (2023). Risk assessment of sea level rise for Karasu coastal area, Turkey. Hydrology 10:13. doi: 10.3390/hydrology10010013
EMODnet Bathymetry Consortium (2018). Available at: http://doi.org/10.12770/18ff0d48-b203-4a65-94a9-5fd8b0ec35f6
Escudier, R., Clementi, E., Omar, M., Cipollone, A., Pistoia, J., Aydogdu, A., et al. (2020). Mediterranean Sea physical reanalysis (CMEMS MED-currents) (version 1) set (Copernicus marine service: Copernicus monitoring environment marine service (CMEMS). Available at: https://doi.org/10.25423/CMCC/MEDSEA_MULTIYEAR_PHY_006_004_E3R1.
European Environmental Agency (EEA) (2017). Climate change, impacts and vulnerability in Europe 2016: An Indicator-based report. European Environment Agency. Publications Office of the European Union, Luxembourg, Available at: https://www.eea.europa.eu/publications/climate-change-impacts-and-vulnerability-2016 (424 pp). (Accessed 2020).
Fox-Kemper, B., Adcroft, A., Böning, C. W., Chassignet, E. P., Curchitser, E., Danabasoglu, G., et al. (2019). Challenges and prospects in ocean circulation models. Front. Mar. Sci. 6:65. doi: 10.3389/fmars.2019.00065
Fox-Kemper, B., Hewitt, H. T., Xiao, C., Aðalgeirsdóttir, G., Drijfhout, S. S., Edwards, T. L., et al. (2023). “Ocean, cryosphere and sea level change” in Climate Change 2021 – The Physical Science Basis: Working Group I Contribution to the Sixth Assessment Report of the Intergovernmental Panel on Climate Change. eds. V. Masson-Delmotte, P. Zhai, A. Pirani, S. L. Connors, C. Péan, and S. Berger (Cambridge, United Kingdom and New York, NY, USA: Cambridge University Press), 1211–1362.
Fratianni, C., Pinardi, N., Lalli, F., Simoncelli, S., Coppini, G., Pesarino, V., et al. (2016). Operational oceanography for the marine strategy framework directive: the case of the mixing indicator. J. Oper. Oceanogr. 9, s223–s233. doi: 10.1080/1755876X.2015.1115634
Gittings, J. A., Raitsos, D. E., Krokos, G., and Hoteit, I. (2018). Impacts of warming on phytoplankton abundance and phenology in a typical tropical marine ecosystem. Sci. Rep. 8:2240. doi: 10.1038/s41598-018-20560-5
Gochis, D., Barlage, M., Cabell, R., Casali, M., Dugger, A., FitzGerald, K., et al. (2020). The WRF- hydro modeling system technical description (Version5.2.0), vol. 108: NCAR Technical Note. Available at: https://ral.ucar.edu/sites/default/files/public/projects/wrf-hydro/technical-description-user-guide/wrf-hydrov5.2technicaldescription.pdf
Hersbach, H., Bell, B., Berrisford, P., Hirahara, S., Horányi, A., Muñoz-Sabater, J., et al. (2020). The ERA5 global reanalysis. Q. J. R. Meteorol. Soc. 146, 1999–2049. doi: 10.1002/qj.3803
Hobday, A. J., Alexander, L. V., Perkins, S. E., Smale, D. A., Straub, S. C., Oliver, E. C. J., et al. (2016). A hierarchical approach to defining marine heatwaves. Prog. Oceanogr. 141, 227–238. doi: 10.1016/j.pocean.2015.12.014
Intergovernmental Panel on Climate Change (IPCC) (2019). Special report on the ocean and cryosphere in a changing climate. Available at: https://www.ipcc.ch/srocc/
Jacox, M. G., Alexander, M. A., Amaya, D., Becker, E., Bograd, S. J., Brodie, S., et al. (2022). Global seasonal forecasts of marine heatwaves. Nature 604, 486–490. doi: 10.1038/s41586-022-04573-9
Liu, F., Song, F., and Luo, Y. (2024). Human-induced intensified seasonal cycle of sea surface temperature. Nat. Commun. 15:3948. doi: 10.1038/s41467-024-48381-3
Madec, G., and Team, N. (2017). Nemo ocean engine. Available at: https://zenodo.org/records/3248739 (Accessed October, 2024).
Meli, M., Camargo, C. M. L., Olivieri, M., Slangen, A. B. A., and Romagnoli, C. (2023). Sea-level trend variability in the Mediterranean during the 1993–2019 period. Front. Mar. Sci. 10:1150488. doi: 10.3389/fmars.2023.1150488
Mentaschi, L., Lovato, T., Butenschön, M., Alessandri, J., Aragão, L., Verri, G., et al. (2024). Projected climate oligotrophication of the Adriatic marine ecosystems. Front. Clim. 6:1338374. doi: 10.3389/fclim.2024.1338374
Mohamed, B., Abdallah, A. M., Alam el-Din, K., Nagy, H., and Shaltout, M. (2019). Inter-annual variability and trends of sea level and sea surface temperature in the Mediterranean Sea over the last 25 years. Pure Appl. Geophys. 176, 3787–3810. doi: 10.1007/s00024-019-02156-w
Nagy, H., Pereiro, D., Yamanaka, T., Cusack, C., Nolan, G., Tinker, J., et al. (2021). The Irish Atlantic CoCliME case study configuration, validation and application of a downscaled ROMS Ocean climate model off SW Ireland. Harmful Algae 107:102053. doi: 10.1016/j.hal.2021.102053
Niu, G.-Y., Yang, Z.-L., Mitchell, K., Chen, F., Ek, M., Barlage, M., et al. (2011). The community Noah land surface model with multiparameterization options (Noah-MP): 1. Model description and evaluation with local-scale measurements. J. Geophys. Res. 116:15139. doi: 10.1029/2010JD015139
Oliver, E. C. J., Benthuysen, J. A., Darmaraki, S., Donat, M. G., Hobday, A. J., Holbrook, N. J., et al. (2021). Marine heatwaves. Annu. Rev. Mar. Sci. 13, 313–342. doi: 10.1146/annurev-marine-032720-095144
Parras-Berrocal, I. M., Vázquez, R., Cabos, W., Sein, D. V., Álvarez, O., Bruno, M., et al. (2023). Dense water formation in the eastern Mediterranean under a global warming scenario. Ocean Sci. 19, 941–952. doi: 10.5194/os-19-941-2023
Pettenuzzo, D., Large, W. G., and Pinardi, N. (2010). On the corrections of ERA-40 surface flux products consistent with the Mediterranean heat and water budgets and the connection between basin surface total heat flux and NAO. J. Geophys. Res. 115:C06022. doi: 10.1029/2009JC005631
Pinardi, N., Bonaduce, A., Navarra, A., Dobricic, S., and Oddo, P. (2014). The mean sea level equation and its application to the mediterranean sea. J. Clim. 27, 442–447. doi: 10.1175/JCLI-D-13-00139.1
Pinardi, N., Zavatarelli, M., Adani, M., Coppini, G., Fratianni, C., Oddo, P., et al. (2015). Mediterranean Sea large-scale low-frequency ocean variability and water mass formation rates from 1987 to 2007: a retrospective analysis. Prog. Oceanogr. 132, 318–332. doi: 10.1016/j.pocean.2013.11.003
Ridal, M., Olsson, E., Undén, P., Zimmermann, K., and Ohlsson, A. (2017). Harmonie reanalysis report of results and dataset. Technical report, UERRA. UERRA deliverable D2.7. Available at: http://www.uerra.eu/publications/deliverable-reports.html
Ruti, P. M., Somot, S., Giorgi, F., Dubois, C., Flaounas, E., Obermann, A., et al. (2016). MED-CORDEX initiative for Mediterranean climate studies. Bull. Am. Meteorol. Soc. 97, 1187–1208. doi: 10.1175/BAMS-D-14-00176.1
Skamarock, W. C., Klemp, J. B., Dudhia, J., Gill, D., Barker, D., Duda, M., et al. (2008). A description of the advanced research WRF version 3 : NCAR Tech Note. TN 475 STR, 125. doi: 10.13140/RG.2.1.2310.6645
Storto, A., Hesham Essa, Y., de Toma, V., Anav, A., Sannino, G., Santoleri, R., et al. (2023). MESMAR v1: a new regional coupled climate model for downscaling, predictability, and data assimilation studies in the Mediterranean region. Geosci. Model Dev. 16, 4811–4833. doi: 10.5194/gmd-16-4811-2023
Storto, A., Masina, S., Simoncelli, S., Iovino, D., Cipollone, A., Drevillon, M., et al. (2019). The added value of the multi-system spread information for ocean heat content and steric sea level investigations in the CMEMS GREP ensemble reanalysis product. Clim. Dyn. 53, 287–312. doi: 10.1007/s00382-018-4585-5
Verri, G., Furnari, L., Gunduz, M., Senatore, A., Costa, V. S., De Lorenzis, A., et al. (2024). Climate projections of the Adriatic Sea: the role of river release. Front. Clim. 6:1368413. doi: 10.3389/fclim.2024.1368413
Verri, G., Pinardi, N., Oddo, P., Ciliberti, S., and Coppini, G. (2018). River runoff influences on the Central Mediterranean overturning circulation. Clim. Dyn. 50, 1675–1703. doi: 10.1007/s00382-017-3715-9
Villani, V., Rianna, G., Mercogliano, P., and Zollo, A. L. (2015). Statistical approaches versus weather generator to downscale RCM outputs to slope scale for stability assessment: a comparison of performances. Electron. J. Geotech. Eng. 20, 1495–1515. doi: 10.4090/juee.2014.v8n2.142154
von Schuckmann, K., and Le Traon, P. Y. (2011). How well can we derive Global Ocean indicators from Argo data? Ocean Sci. 7, 783–791. doi: 10.5194/os-7-783-2011
Keywords: climate change adaptation, Adriatic Sea dynamics, marine climate indicators, regional climate downscaling, climate change impact
Citation: da Costa VS, Alessandri J, Verri G, Mentachi L, Guerra R and Pinardi N (2024) Marine climate indicators in the Adriatic Sea. Front. Clim. 6:1449633. doi: 10.3389/fclim.2024.1449633
Edited by:
Ke Li, Nanjing University of Information Science and Technology, ChinaCopyright © 2024 da Costa, Alessandri, Verri, Mentaschi, Guerra and Pinardi. This is an open-access article distributed under the terms of the Creative Commons Attribution License (CC BY). The use, distribution or reproduction in other forums is permitted, provided the original author(s) and the copyright owner(s) are credited and that the original publication in this journal is cited, in accordance with accepted academic practice. No use, distribution or reproduction is permitted which does not comply with these terms.
*Correspondence: Vladimir Santos da Costa, dmxhZGltaXIuc2FudG9zZGFjb3N0YUBjbWNjLml0
 Vladimir Santos da Costa
 Jacopo Alessandri
 Giorgia Verri
 Lorenzo Mentaschi
 Roberta Guerra
 Nadia Pinardi