 Drew Resnick
 Walter Baethgen
 Peerzadi Rumana Hossain
 Sanketa Kadam1
94% of researchers rate our articles as excellent or good
Learn more about the work of our research integrity team to safeguard the quality of each article we publish.
Find out more
ORIGINAL RESEARCH article
Front. Clim., 10 September 2024
Sec. Climate Services
Volume 6 - 2024 | https://doi.org/10.3389/fclim.2024.1440671
Introduction: Interannual climate variability in the Asian mega deltas has been posing a wide range of climate risks in the aquaculture systems of the region. Water temperature variation is one of the key risks related to disease outbreak, fish health, and loss and damage in fish production. However, Climate information can improve the ability to predict changes in pond water quality parameters at the farm level using publicly available weather and climate data. Little research has been done to translate weather data into water temperature forecasts using mechanistic models in order to provide farmers with relevant forecasting information in the context of climate services.
Methods: The advantage of mechanistic models over statistical models is that they are based on physical processes and can therefore be used in a wider range of environmental conditions. In this study, we used an energy balance model to investigate its ability to simulate pond water temperature at daily and seasonal timescales in the southwest and northeast regions of Bangladesh. The model was able to adequately simulate pond water temperature at a daily timescale using publicly available weather data, and the accuracy of the model was lower at the study site with very heavy rainfall events.
Results: Sensitivity analyses showed that the model was also able to simulate the impact of air temperature cold and hot spells on the pond water temperature. Connecting the model with seasonal air temperature forecasts resulted in very small variations in the forecasted seasonal pond water temperature, in large part due to the low variability observed in water temperature at seasonal scale in the study sites.
Discussion: Climate information can improve the ability to predict changes in pond water quality parameters at the farm level using publicly available weather and climate data. Hence, these improved predictions are important to help fish-farmers make informed decisions for managing associated climate risks.
Global aquaculture continues to grow, at an average annual rate of 6.7% (FAO, 2020). In Bangladesh, aquaculture is one of the fastest growing sectors: it is the fifth most productive country in Asia, and it is a major source of income and food security in rural areas (Montes et al., 2022; FAO, 2020). Bangladesh has been identified as the second most climatically vulnerable country in Asia for freshwater aquaculture, and has a low adaptive capacity due to its high climate interannual variability and high frequency of extreme weather events (IPCC, 2021; Montes et al., 2021; Barange et al., 2018; Hossain et al., 2021; Siddique et al., 2022). Heat waves, cold spells, heavy rainfall events (flash floods), and dry spells have all been identified as key climatic phenomena which impact aquaculture (Hossain et al., 2021; Montes et al., 2022; Maulu et al., 2021; Hossain et al., 2021; Nhan et al., 2011; Faruque and Kabir, 2016; Siddiqua et al., 2019). Thermal stress on aquatic organisms can impact growth rate, reproduction, and can induce thermal stress at all stages of fish growth (Cathcart and Wheaton, 1987; Prapaiwong and Boyd, 2012; Siddique et al., 2022).
The ability to forecast and predict major extreme heat and cold events is important for helping farmers to take early action and to manage associated risks (Maulu et al., 2021). This information can be used to build decision frameworks that help farmers to anticipate major weather events and to understand their impacts on the farm in order to adjust decisions and reduce damages. Consequently, work is being conducted to test and improve the availability of climate data to establish early warning systems in regions where climate variability increases risks and causes uncertainty in aquaculture farms (Montes et al., 2022). Efforts are also being done to use climate data to build comprehensive decision frameworks to communicate climate risk information along with advisory services to fish-farmers (Hossain et al., 2021).
For instance, skillful forecast information of high temperatures for the coming week that exceeds the thresholds identified for a specific fish species can be communicated to aquaculture farmers. That information can be used with actionable water quality and/or feed management relevant advisory services such as: feed conversion ratio, application of lime, use of aerator, adding ground water to balance pH, dissolved O2 and water temperature along with reduced disease outbreak and mortality rate, and optimal growth of fish stock (Hossain et al., 2021). If fish-farmers access this information with a 5–7 days lead time, they will be able to manage the risks of fish mortality rand disease outbreak taking climate informed management decisions earlier to that specific climatic event (Montes et al., 2022).
The effectiveness of climate information for farmer decisions can be enhanced when it is embedded in a climate information services framework. Climate services involve the production, translation, transfer and use of climate information for decision-making and are increasingly viewed as critical to improve the capacity of farmers to adapt to climate variability and change (Vaughan et al., 2017). Thus, to make aquaculture systems sustainable, climate data such as air temperature must be translated into sector-relevant information such as pond-specific water-temperature variation, oxygen concentration and salinity (where applicable) in order to help fish-farmers adjust their management decisions and reduce stress on their fish and manage operational risks (Gao and Merrick, 1996; Culberson and Piedrahita, 1996; Cathcart and Wheaton, 1987; Béchet et al., 2011). Early warning systems that use climate information are often site specific, and typically include statistical models that use atmospheric data as predictors. Montes et al. (2022) developed an approach for seasonal forecasting to predict the number of warm days and number of heavy rain days at two sites in Bangladesh. Their research explored the relationship between maximum air temperature and water temperature, but the relationship is site specific and based on a linear regression which is not descriptive of the physical and environmental drivers of water temperature.
Our paper explores the implementation of the first stages of a climate information service for aquaculture (“generate” and “translate” climate knowledge) using a mathematical model which represents energy fluxes into and out of a pond via empirical and theoretical relationships (Gao and Merrick, 1996). Unlike statistical models which are site-specific, the type of generalizable models that we used in our research can be linked to climate and weather forecasts to build early warning systems for regions with a wide range of climatic and ecological conditions. Our research tested the ability of an energy flux-based model to simulate the variation of pond water temperature driven by observed air temperature. We then linked the model to a seasonal temperature forecast to explore the potential of establishing an early warning tool for fish-farmers. This research focuses on simulating only the pond water temperature, but the model used in our research can be used for simulating oxygen and salinity, and for exploring the impact of rainfall on pond temperature, oxygen, and salinity.
Bangladesh is characterized by a warm climate influenced by three circulations: pre-monsoon, monsoon, and post-monsoon which results in high mean annual rainfall. The rainy season in Bangladesh (April through September) coincides with the warmest months and the average total rainfall is about 2,200 mm, although some regions in the country experience as much as 5,000 mm. The mean temperature in July, the peak of the rainy monsoon season, is 28°C with minimum and maximum average temperatures of 26°C and 31°C, respectively. We used two study sites in this research for which there was available data on daily observed pond water temperature: (a) Khulna, in the SW with the highest average mean temperatures of the country, and annual rainfall that is similar to the average rainfall of the country, and (b) Sylhet, in the NE with the lowest average mean temperatures of the country and highest mean annual precipitation (The World Bank Group, 2021) and flooding is common in the region.
Climate data used to build and test the model were obtained from the NASA Langley Research Center (LaRC) POWER Project funded through the NASA Earth Science/Applied Science Program at a spatial resolution of resolution 0.50° × 0.625° (NASA, 2021). Data for the period 1990–2020 were downloaded for the latitude and longitude of Khulna, SW Bangladesh and Sylhet, NE Bangladesh (Table 1). Although observed climate data are available for the two study regions, we chose to use a publicly available dataset (NASA’s POWER) to explore the ability of the model to simulate water temperature in regions where no climate observations are available.
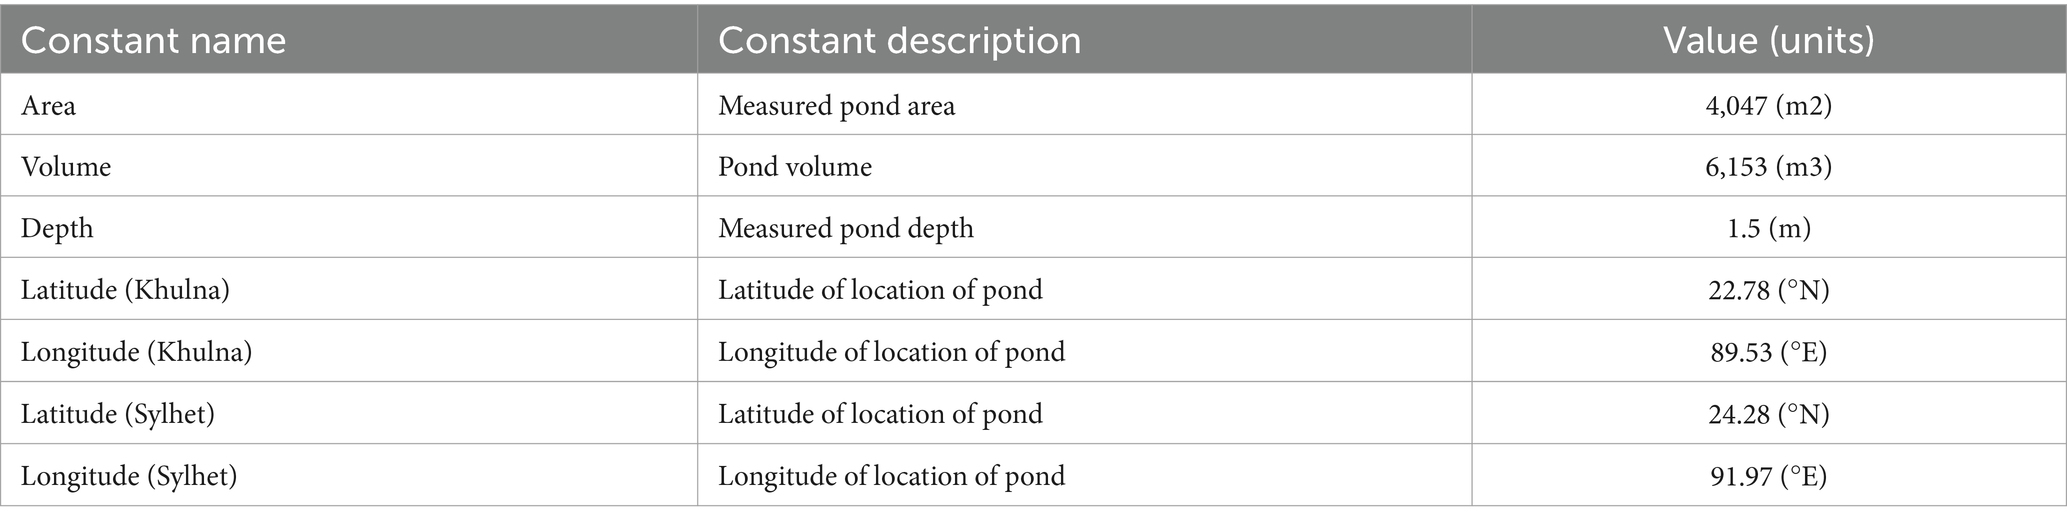
Table 1. Characteristics of the study sites.
We created a 30-year climatology dataset (1990–2020) and we calculated the daily averages for each input variable for each day of the year. We then estimated the 1st and the 99th percentiles of temperature values. Temperature values corresponding to the 1st and the 99th percentiles and the associated solar radiation were used to create artificial “cold spells” and “hot spells,” respectively, in the climatology datasets. The hottest and coldest periods of the year in Bangladesh were identified, and air temperature and solar radiation values within these hot and cold periods were edited to include the values corresponding to the 1st and 99th percentiles to simulate extreme hot and cold spells with durations of 4, 7, and 10 days.
The NASA POWER data were also used for creating the dataset used to test the ability to establish a seasonal water temperature forecast using a tercile-based air temperature seasonal forecast. We used the downloaded data for the years 1990–2020 and seasonal averages were computed for each year. These seasonal averages were then sorted for each season by temperature to define the terciles of above-, near-, and below-normal seasonal air temperatures.
These ranges created the temperature cutoff values used in the sampling method for testing seasonal predictability of water temperature. Two seasonal forecasts were tested with large departures from the climatological distribution of terciles (i.e., 33-33-33 distribution) in order to test the sensitivity of the model to contrasting expected seasonal conditions: 70% above-, 20% near-, 10% below- normal; and 10% above-, 20% near-, 70% below- normal.
Observed water temperature data were obtained at each study site in both Khulna and Sylhet. Pond water temperature was measured for 2 years (2018–2019) twice a day: in the morning (8.00–9.00 a.m.) and afternoon (4.30–5.30 p.m.) at an estimated depth of 0.15–0.25 m below the surface. Water temperature during morning hours was considered to reflect the minimum water temperature of the pond and afternoon hours to reflect the maximum temperature of a pond (Wax and Pote, 1990).
Pond water temperature simulations were created using a mathematical model based on theoretical and empirical relationships to numerically solve for different elements of energy exchange (Gao and Merrick, 1996, G&M model from now on). The model was built and run using Python Programming Language, and all of the code for running the model can be found in a public github repository (Van Rossum and Drake, 1995; Resnick and Kadam, 2021). The model was selected because it can be adapted to run at different timescales (e.g., hourly, daily), and because it requires minimal meteorological data (Table 2). It also makes assumptions that allow for a simplified application of the model, and it also allows the user to explore and apply further assumption.
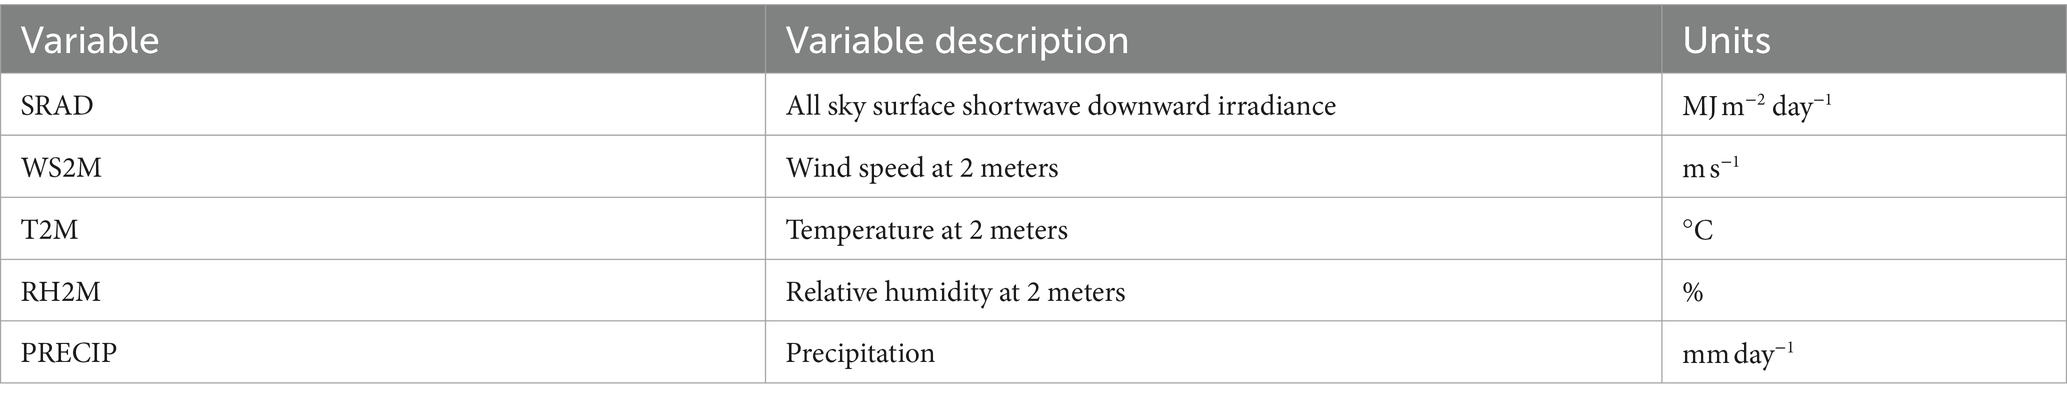
Table 2. Variables required as input data for the Gao-Merrick model.
The generalized equation used by the model is based on the fundamental heat energy balance equation which has been previously used to build energy flux models in aquaculture ponds (Béchet et al., 2011; Gao and Merrick, 1996):
Where phinet is the net energy flux, phisn is solar radiation, phiat is atmospheric radiation, phiws is water surface radiation, phie is evaporative heat loss, phic is sensible heat transfer due to convection and conduction, and phir is heat loss due to rainfall.
The model described in Gao and Merrick (1996) was created for a shallow, fully mixed marine pond and was built to run at an hourly time step. In our study we modified the model to run at a daily time step.
The following assumptions were made in our research for using the G&M model:
• The pond was assumed to be fully mixed with negligible stratification with depth.
• The pond was assumed to be unshaded.
• Variation in hourly solar radiation was not deemed a significant factor influencing daily pond temperature.
• Inflow and outflow heat exchange from water were deemed negligible and were omitted from the model.
• Water-sediment heat exchange was assumed to be negligible and was also omitted.
Outputs of the model were used to generate plots to visually assess simulated and observed water temperature data, as well as observed air temperature. Sensitivity analyses to hot and cold spells were also performed running each model using the modified climatology datasets as described in the data section of this paper. The sensitivity analysis was performed by running the G&M model for each study site, using climatology air temperature data and inserting 4, 7, and 10 day hot/cold spells to assess the model sensitivity to different spell lengths.
The method for applying a seasonal air temperature forecast expressed as tercile probabilities was used to explore the predictive ability of the water temperature model at seasonal timescale. A tercile-based climate forecast uses probabilities of departure from seasonal above-, below- and near-normal air temperature terciles. We used a seasonal climate forecast with high probability of warmer-than-normal seasonal air temperature (70% above - 20% normal - 10% below) and a seasonal climate forecast with high chance of colder-than-normal seasonal air temperature (10% above - 20% average - 70% below). The probability departures of these artificially created forecasts are much higher than the typical seasonal climate forecasts publicly available (e.g., from the IRI).1 We selected these extreme forecasts to test the sensitivity of the water temperature seasonal forecast: a low sensitivity of the water temperature model to such an extreme climate forecast would imply that the seasonal water temperature forecast will not be useful for informing decisions. The resulting seasonal average simulated water temperatures were sorted and used to define the terciles of above-, below- and near-normal pond water temperature. The tercile-based forecasts of seasonal water temperature were then generated by running the model 100 times, and resampling the runs following the probability of the forecast terciles. For example, for the 70-20-10 forecast, we resampled 70% of model runs that used values from the upper tercile of air temperatures, 20% of runs that used data from the near-normal tercile, and 10% of the runs that used data from the lower tercile (Han et al., 2019; Capa-Morocho et al., 2016). The results were then used to generate the probabilities of terciles of the forecasted simulated water temperature.
The G&M model simulated water temperature values closely resembled the observed data (Figure 1) as evidenced by the good fit of the regression analysis (R2 = 0.88 for Khulna; R2 = 0.70 for Sylhet). The slope was close to 1.0 and the intercept was close to 0.0, indicating a relationship close to a perfect fit (1:1 line) with the observed data (Figure 2). The performance of the G&M model was better in Khulna than in Sylhet. Two large negative spikes in water temperature observed in Sylhet resulted in both, a lower R2 value and a regression line which further deviated from the 1:1 line (Figure 2). A possible explanation to these results is related to the notably high rainfall which normally occurs in Sylhet. Episodes of very high rainfall increase runoff and floods which in turn results in high inflow and outflow of rainwater into and out of the aquaculture ponds, with a direct impact of reducing the pond water temperature. Also, large volumes of incoming water induce physical mixing of the pond water column which can further decrease the pond water temperature since deeper layers are colder than the surface layer.
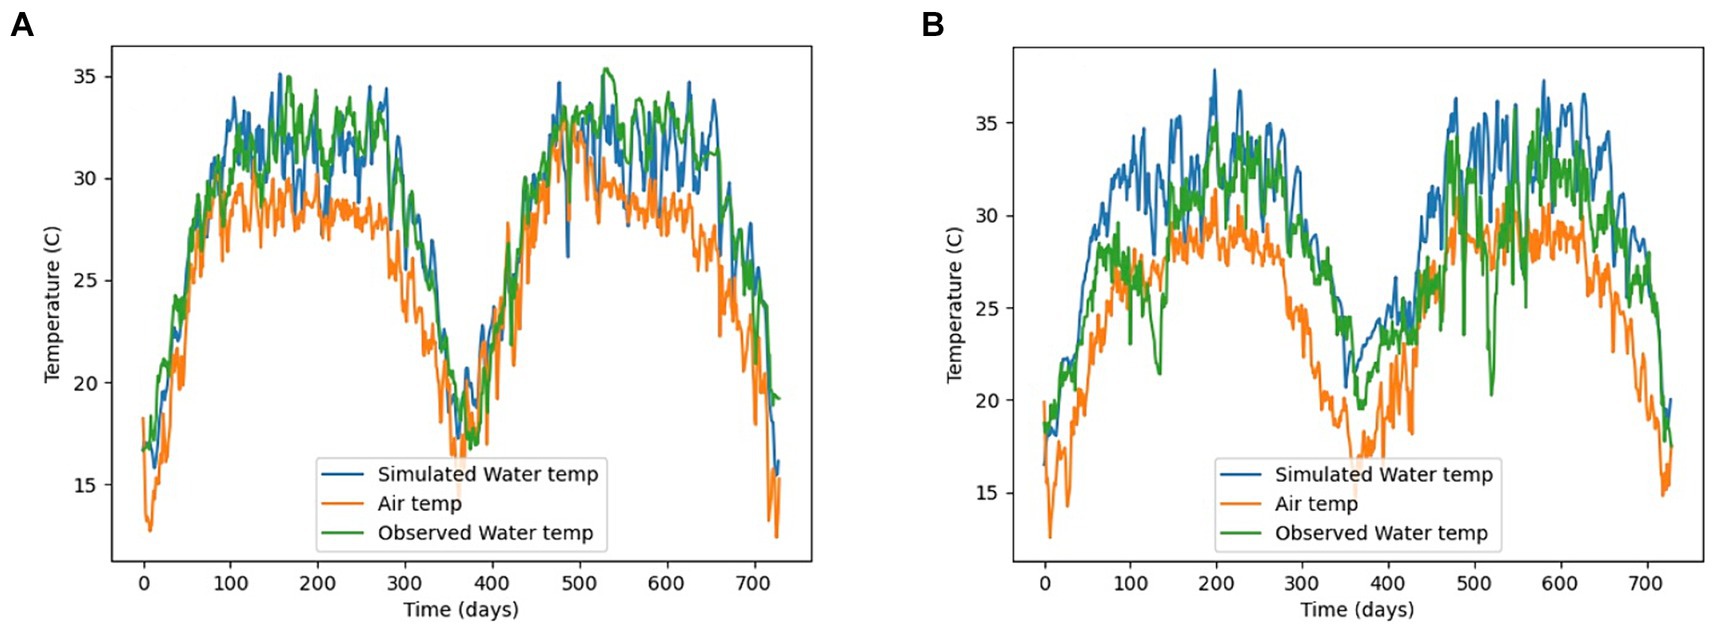
Figure 1. Time series plots for the two study sites showing observed and simulated water temperature, and air temperature using the Gao Merrick model in 2018–2019. Day 1 is 1 January 2018. (A) Khulna. (B) Sylhet.
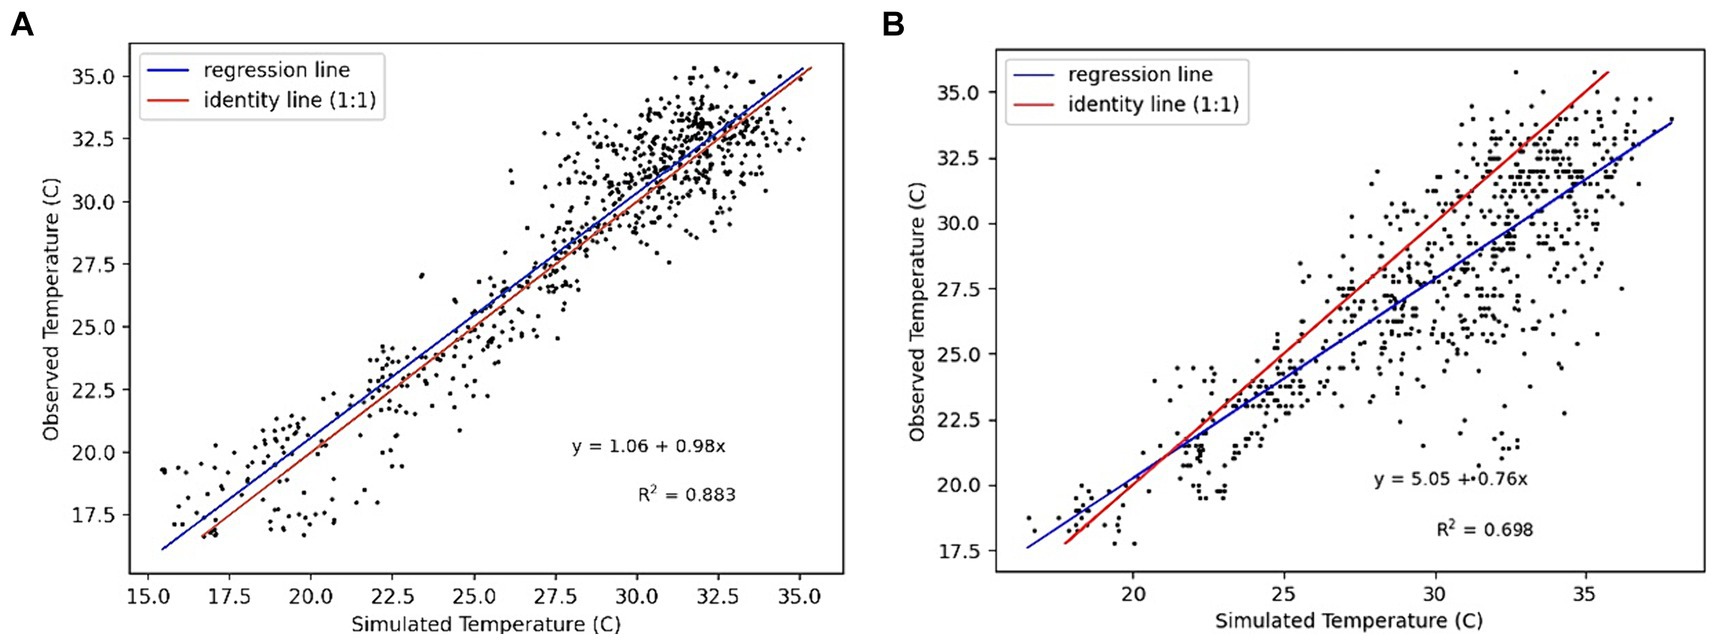
Figure 2. Regression plots for the model at (A) Khulna; and (B) Sylhet, of observed vs. simulated values for both locations (blue line). The red line is the 1:1 line.
When we simulated artificial mixing during the start of the rainy season in Sylhet, the model performance improved. In order to simulate the effect of flooding (influx) and mixing with deeper water levels, every time the accumulated rainfall in 3 days was higher than 40 mm in the first 2 months of the rainy season, we forced the model to lower the simulated water temperature by 5°C. While the methodology that we used for simulating this artificial mixing is arbitrary and only applicable to the conditions of our study, it suggests that in regions with very high rainfall like Sylhet, adding a mixing component will likely improve model performance and scalability (Figures 3, 4).
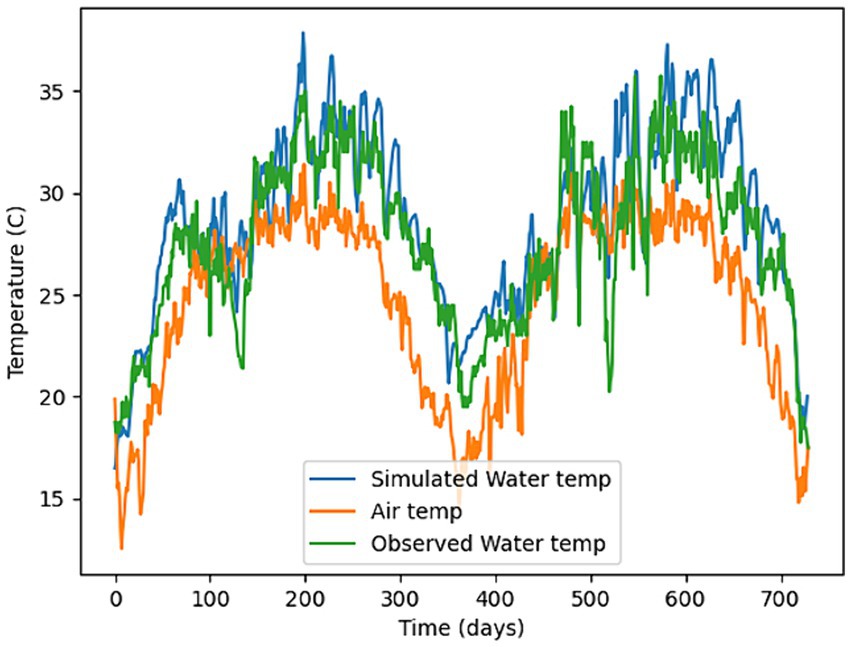
Figure 3. Time series for Sylhet when artificial mixing is used for time periods with high rainfall. Day 1 is 1 January 2018.
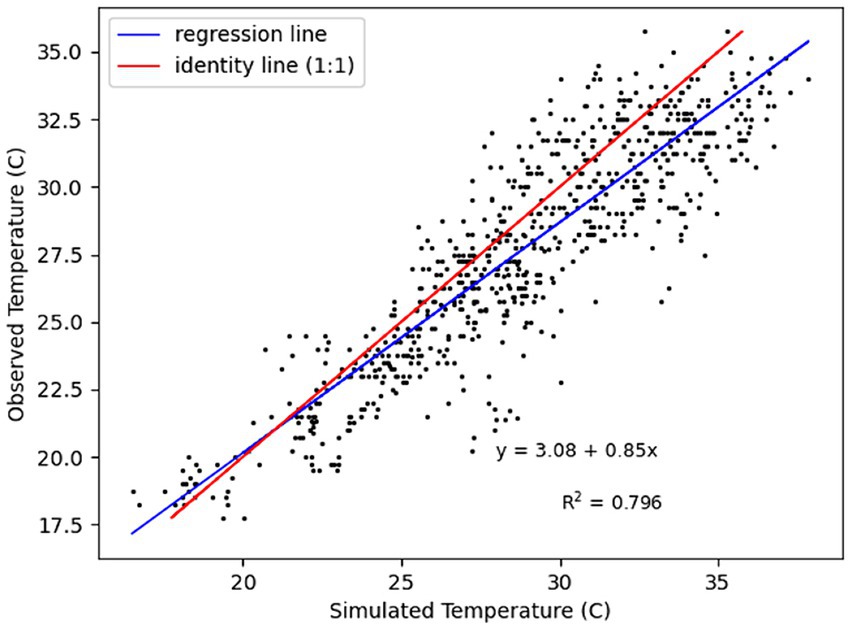
Figure 4. Regression line for the Gao Merrick model when artificial mixing is included for the Sylhet location (red), and 1:1 line (blue).
The G&M model showed high sensitivity to both, hot and cold spells of air temperature2 (Figure 5). This high sensitivity to positive and negative spikes in air temperature indicate that the model can be useful for generating early warnings of water temperature based on weather information. Thus, weather forecasts are usually skillful in predicting extreme air temperature events with a lead time of a few days, and the forecasted temperature values can be used in the G&M model to issue early warnings of potential problems in aquaculture production due to abrupt changes in pond water temperature. At higher temperatures, fish oxygen consumption increases while oxygen content decreases in pond water due to a lower saturation pressure, making oxygen a clear limiting factor. This is likely to affect fish health and growth. Moreover, high water temperatures and/or sudden temperature fluctuations exceeding the physiological tolerance level of fish species lead to disease outbreak, mortality and harvest losses (Hossain et al., 2021; Montes et al., 2022; Islam et al., 2024).
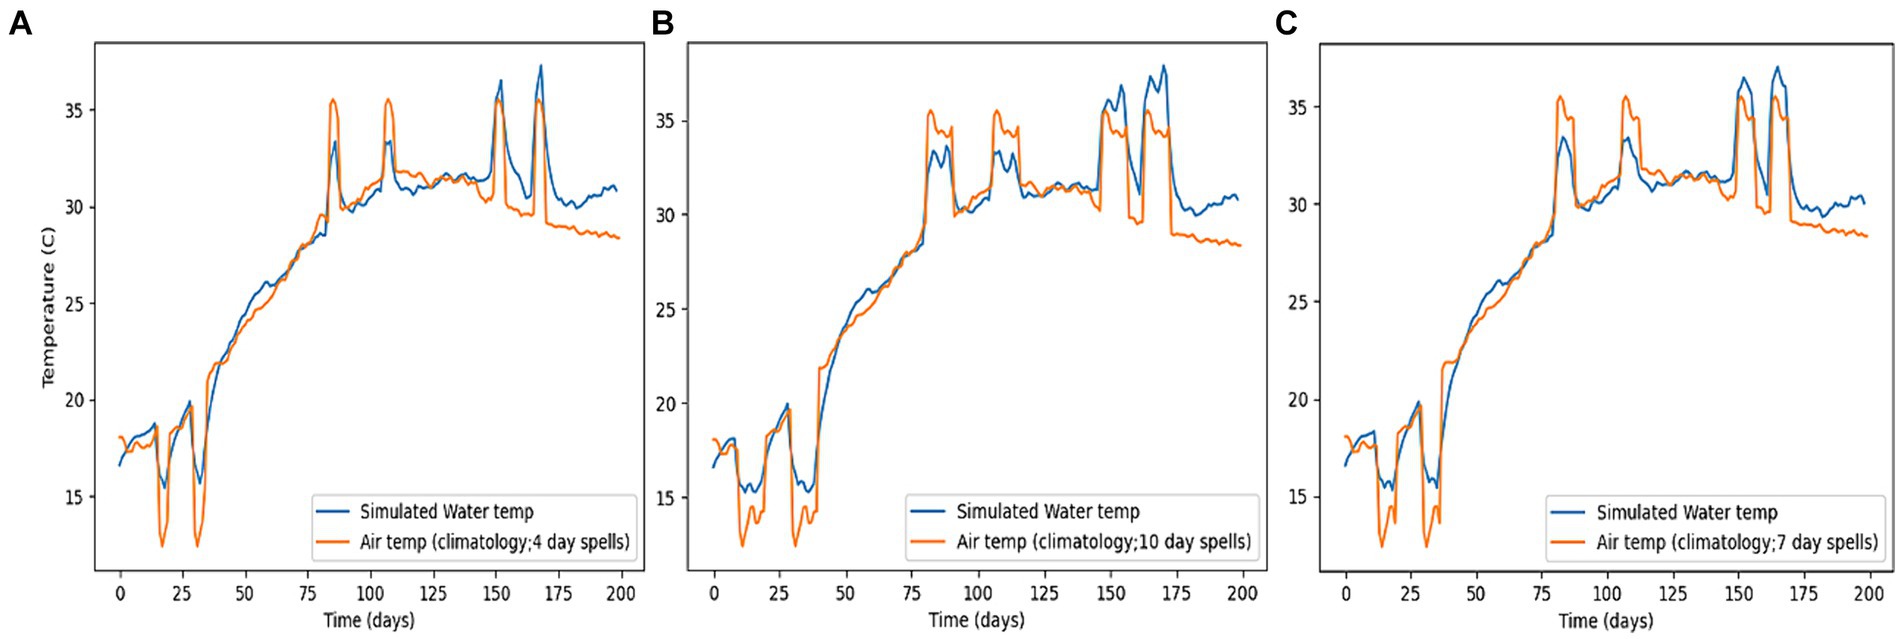
Figure 5. Simulated effect on pond water temperature of cold and hot spells of air temperature of: (A) 4 days, (B) 7 days, and (C) 10 days (Orange lines = air temperature, Blue lines = simulated water temperature).
The simulated water temperature was not sensitive to large changes in the probability of terciles of the seasonal air temperature forecasts (Figure 6). One possible reason for this lack of sensitivity is the very low variability observed in air temperature values: the maximum difference between the coldest and the warmest values of seasonal water temperature was less than 3°C. Therefore, cutoff values of each tercile (below, near or above normal) had a difference of less than 1°C. Therefore, even when the seasonal forecast of air temperature had very large shifts to warmer or colder than normal (70% instead of the climatological 33%), the seasonal forecast for water temperature was very close to climatology. These results suggest that seasonal air temperature forecasts would not be useful for informing decisions in aquaculture in this region.
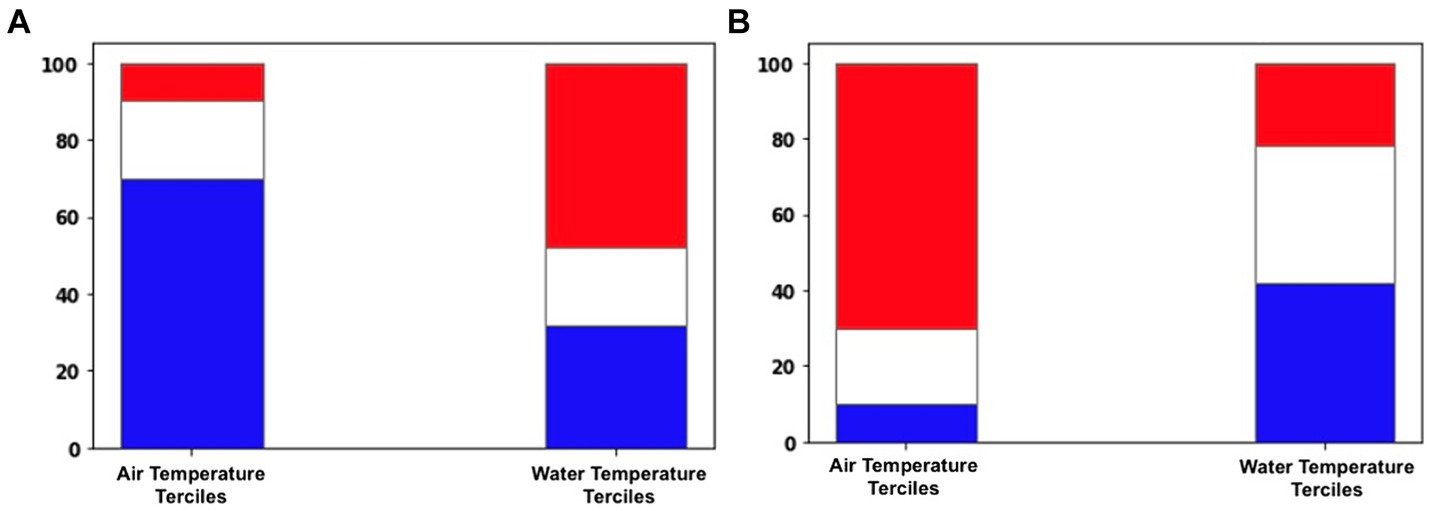
Figure 6. (A) Terciles of a forecast with very high chances of colder than normal seasonal air temperature (70% probability of Below Normal -blue, 20% probability of Normal -white, and 10% probability of Above Normal -red) and tercile distribution of corresponding seasonal water temperature based on the seasonal air temperature forecast. (B) Terciles of a forecast with very high chances of warmer than normal seasonal air temperature (10% probability of Below Normal -blue, 20% probability of Normal -white, and 70% probability of Above Normal -red) and tercile distribution of the corresponding seasonal water temperature based on the seasonal air temperature forecast. In both cases the seasonal forecast of water temperature was calculated with 100 runs of the GM model for the May–June–July (MJJ) season.
On the other hand, given the results discussed above of the impact of hot and cold air temperature spells on water temperature, three sources of climatic information could be relevant for decision making at the farm level: (a) seasonal forecasts of the expected frequency of extreme events (hot or cold spells), (b) subseasonal forecasts of those same extreme events (e.g., likelihood of extreme events in the next 2–4 weeks), and (c) weather forecasts (e.g., likelihood of extreme events in the next 2–7 days).
Aquaculture has been a source of food and nutritional security and income for small farmers at a global scale (FAO, 2020; Maulu et al., 2021). A vast majority of aquaculture practices greatly depend on the weather and climate of the environments in which they function (Siddique et al., 2022; Maulu et al., 2021; Faruque and Kabir, 2016). Given the increase in extreme weather events linked to climate change (IPCC, 2021) and their impacts on vulnerable populations, there is a need to implement early warning systems that use climate and weather information (Tall et al., 2018; Soares et al., 2018). There are also increasing evidences of the advantages of implementing climate information services that involve the generation, translation, transfer and use of climate knowledge to inform decisions and policies (Vaughan et al., 2017). Our study applied a model that can simulate pond water temperature at a daily time scale using publicly available climate information to fish-farms in Bangladesh (Equation 1). The goal of the research was twofold: to explore how a generalizable model can perform in predicting water temperature at different locations, and to explore the utility of connecting such a model with climate forecasts at different timescales. The use of such a model at various timescales can provide farmers with relevant information with enough lead time to adjust decisions and mitigate risks from adverse meteorological events. A generalizable model would allow the application of such a tool to farms across the globe, at a wide range of climatic conditions in order to contribute to improve the adaptive capacity to climate variability and change.
Our research suggests that the mechanistic model developed by Gao and Merrick (1996) can accurately simulate the temperature of pond water at a daily timescale. The application of the model in this research was based on several assumptions, including fully mixed water which could constrain the generalizability of the model. The model performed better at the study site in Khulna, where average rainfall (~1,700 mm year−1) is lower than the other study site, Sylhet which has exceptionally high levels of rainfall (~3,300 mm year−1). We suggest that the poorer skill of the G&M model in Sylhet is due to the frequent extreme rainfall events that cause heavy runoff that result in important inflow into the aquaculture ponds, with a direct impact on the incoming water temperature and the effect of mixing deeper (colder) layers of water with the surface (warmer) layers. We therefore suggest that the model can be improved by including a mechanism to simulate the mixing of the water column due to high inflow of water in high rainfall events.
At the seasonal timescale, the model did not provide useful forecast information of the water pond temperature. This is thought to be a result of the low variability in the observed seasonal values of water temperature in the study sites (maximum difference of less than 3°C between seasons). The low observed variability of water temperature at seasonal scale results in threshold values to define terciles that are very similar, and therefore, the shifts in water temperature caused by shifts in air temperature were erratic. While the application of such an approach may prove to be more useful in regions with higher climatic variability and higher water temperature variability, we suggest that in Bangladesh the current model would be most informative when connecting it to forecasts at shorter timescales (a few days to a few weeks), or to forecasts of extreme weather events at seasonal, subseasonal or weather time scales.
An important practical implication of this research is that we demonstrate that the G&M model was skillful using weather data that is publicly available in global datasets (in our case NASA-POWER). These global datasets are particularly useful in regions of developing countries where accessing observed climate data is a challenge. Although the ideal situation is to use observed weather data generated by the local meteorological institutes, our research shows that the G&M model can work well with global datasets where observed data is not available.
Our research aimed to test the ability of an energy balance model to simulate pond water temperature for aquaculture. While the study sites of this research are located in Bangladesh, mechanistic models such as the one we tested in this research can be used for pond farms in different regions of the world to establish early warning / early action systems, and in general to implement the climate services approach.
The results of this initial research evidenced that the G&M model performed well in simulating pond water temperature. The performance of the model was poorer in the site with very high rainfall (Sylhet, with more than 3,200 mm year−1in the study period). Although annual rainfall values of more than 3,000 mm are not common globally, modifying the G&M model to include physical mixing of water layers due to high rainfall or flooding events would likely improve the model’s skill in regions where high rainfall and runoff affect aquaculture.
The G&M model performed well in sensitivity analyses (hot and cold spells) and can therefore work well for linking it to weather forecasts and subseasonal forecasts of extreme meteorological events, and contribute to inform farmer decisions and implement early warning systems. However, given the small variability of observed water temperature values (maximum difference of less than 3°C) the model was not sensitive to using a tercile-based seasonal air temperature forecast.
The raw data supporting the conclusions of this article will be made available by the authors, without undue reservation.
The manuscript presents research on animals that do not require ethical approval for their study.
DR: Investigation, Methodology, Writing – original draft. WB: Investigation, Methodology, Writing – original draft, Conceptualization, Data curation, Supervision, Writing – review & editing, Formal analysis, Funding acquisition, Validation. PH: Conceptualization, Data curation, Funding acquisition, Investigation, Writing – review & editing, Writing – original draft. SK: Investigation, Writing – original draft, Writing – review & editing.
The author(s) declare that financial support was received for the research, authorship, and/or publication of this article. This research was supported by the CGIAR initiatives: Securing the Food Systems of Asian Mega-Deltas for Climate and Livelihood Resilience (AMD; https://www.cgiar.org/initiative/18-securing-the-asian-mega-deltas-from-sea-level-rise-flooding-salinization-and-water-insecurity/). This work was undertaken as part of the Columbia World Project, ACToday, funded by Columbia University in the City of New York.
The authors acknowledge BRAC and the Bangladesh Meteorological Department for providing data. The results of this research and ideas expressed in this paper should not be taken to represent those of the CGIAR Initiatives and shall not be used for advertising purposes.
The authors declare that the research was conducted in the absence of any commercial or financial relationships that could be construed as a potential conflict of interest.
All claims expressed in this article are solely those of the authors and do not necessarily represent those of their affiliated organizations, or those of the publisher, the editors and the reviewers. Any product that may be evaluated in this article, or claim that may be made by its manufacturer, is not guaranteed or endorsed by the publisher.
1. ^International Research Institute for Climate and Society, IRI, Columbia Climate School, Columbia University https://iri.columbia.edu.
2. ^Days 82–88, 107–113, 151–157, 164–170 for 4-day hot spells; days 14–20, 31–37, 332–338, 358–364 for 4-day cold spells.
Barange, M., Bahri, T., Beveridge, M. C., Cochrane, K. L., Funge-Smith, S., and Poulain, F. (2018). Impacts of climate change on fisheries and aquaculture. Rome: United Nations’ Food and Agriculture Organization ISSN: 2070-7010.
Béchet, Q., Shilton, A., Park, J. B. K., Craggs, R. J., and Guieysse, B. (2011). Universal temperature model for shallow algal ponds provides improved accuracy. Environ. Sci. Technol. 45, 3702–3709. doi: 10.1021/es1040706
Capa-Morocho, M., Ines, A. V. M., Baethgen, W. E., Rodríguez-Fonseca, B., Han, E., and Ruiz-Ramos, M. (2016). Crop yield outlooks in the Iberian Peninsula: connecting seasonal climate forecasts with crop simulation models. Agric. Syst. 149, 75–87. doi: 10.1016/j.agsy.2016.08.008
Cathcart, T. P., and Wheaton, F. W. (1987). Modeling temperature distribution in freshwater ponds. Aquac. Eng. 6, 237–257. doi: 10.1016/0144-8609(87)90021-5
Culberson, S. D., and Piedrahita, R. H. (1996). Aquaculture pond ecosystem model: temperature and dissolved oxygen prediction: mechanism and application. Ecol. Model. 89, 231–258. doi: 10.1016/0304-3800(95)00140-9
FAO (2020). “The state of world fisheries and aquaculture 2020” in Sustainability in action (Rome: FAO).
Faruque, H., and Kabir, A. (2016). Climate change effects on aquaculture: a case study from north western Bangladesh. Int. J. Fish. Aquat. Stud. 4, 550–556.
Gao, J., and Merrick, N. P. (1996). Simulation of temperature and salinity in a fully mixed pond. Environ. Softw. 11, –178. doi: 10.1016/S0266-9838(96)00026-3
Han, E., Baethgen, W. E., Ines, A. V. M., Mer, F., Soler Souz, J., Berterretche, M., et al. (2019). SIMAGRI: An agro-climate decision support tool. Comput. Electr. Agricult. 161, 241–251. doi: 10.1016/j.compag.2018.06.034
Hossain, P. R., Amjath-Babu, T. S., Krupnik, T. J., Braun, M., Mohammed, E. Y., and Phillips, M. (2021). Developing climate information services for aquaculture in Bangladesh: a decision framework for managing temperature and rainfall variability-induced risks. Front. Sustain. Food Syst. 5:677069. doi: 10.3389/fsufs.2021.677069
IPCC (2021). “Summary for policymakers” in Climate change 2021: The physical science basis contribution of working group 1 to the sixth assessment report of the intergovernmental panel on climate change (Cambridge, New York, NY: Cambridge University Press), 3. Chap. 10
Islam, S., Hossain, P. R., Braun, M., Amjath-Babu, T. S., Mohammed, E. Y., Krupnik, T. J., et al. (2024). Economic valuation of climate induced losses to aquaculture for evaluating climate information services in Bangladesh. Clim. Risk Manag. 43:100582. doi: 10.1016/j.crm.2023.100582
Maulu, S., Hasimuna, O. J., Haambiya, L. H., Monde, C., Musuka, C. G., Makorwa, T. H., et al. (2021). Climate change effects on aquaculture production: sustainability implications, mitigation, and adaptations. Front. Sustain. Food Syst. 5:609097. doi: 10.3389/fsufs.2021.609097
Montes, C., Acharya, N., Hossain, P. R., Amjath Babu, T. S., Krupnik, T. J., and Quamrul, H. S. M. (2022). Developing a framework for an early warning system of seasonal temperature and rainfall tailored to aquaculture in Bangladesh. Clim. Serv. 26:100292. doi: 10.1016/j.cliser.2022.100292
Montes, C., Acharya, N., and Krupnik, T. J. (2021). Quamrul, H.S.M. 2021. Intense precipitation events during the monsoon season in Bangladesh as captured by satellite-based products. J. Hydrometeorol. 22, 1405–1419. doi: 10.1175/JHM-D-20-0287.1
NASA . NASA Langley Research Center: NASA Prediction of Worldwide Energy Resources (NASA POWER). (2021). Available at: https://power.larc. nasa.gov/.
Nhan, D. K., Trung, N. H., and Van Sanh, N. (2011). “The impact of weather variability on rice and aquaculture production in the Mekong Delta” in Environmental change and agricultural sustainability.
Prapaiwong, N., and Boyd, C. E. (2012). Water temperature in inland, low-salinity shrimp ponds in Alabama. J. Appl. Aquacult. 24, 334–341. doi: 10.1080/10454438.2012.731479
Resnick, D., and Kadam, S.: Bangladesh Pond Temperature Model Repository. (2021). Available at: https://github.com/drewmresnick/PondModelBD.
Siddiqua, N. S., Uddin, M. S., Ahamed, G. S., Alam, M. T., and Dey, T. (2019). Livelihood status of fish farmers and aquaculture conditions in habigonj sadar upazila under habigonj district, Bangladesh. Int. J. Fish. Aquat. Stud. 7, 105–109.
Siddique, M. A. B., Ahammad, A. K. S., Mahalder, B., Alam, M. M., Hasan, N. A., Bashar, A., et al. (2022). Perceptions of the impact of climate change on performance of fish hatcheries in Bangladesh: an empirical study. Aust. Fish. 7:270. doi: 10.3390/fishes7050270
Soares, M. B., Alexander, M., and Dessai, S. (2018). Sectoral use of climate information in Europe: a synoptic overview. Clim. Serv. 9, 5–20. doi: 10.1016/j.cliser.2017.06.001
Tall, A., Coulibaly, J. Y., and Diop, M. (2018). Do climate services make a difference? A review of evaluation methodologies and practices to assess the value of climate information services for farmers: implications for Africa. Clim. Serv. 11, 1–12. doi: 10.1016/j.cliser.2018.06.001
The World Bank Group : Climate change knowledge portal. (2021). Available at: https://climateknowledgeportal.worldbank.org/country/bangladesh/climate-data-historical.
Van Rossum, G., and Drake, F. L. Jr. (1995). Python reference manual. Amsterdam: Centrum voor Wiskunde en Informatica.
Vaughan, C., Dessai, S., Hewitt, C., Baethgen, W., Terra, R., and Berterreche, M. (2017). Creating an enabling environment for investment in agricultural climate services: the case of Uruguay’s National Agricultural Information System. Clim. Serv. 8, 62–71. doi: 10.1016/j.cliser.2017.11.001
Keywords: climate risks, aquaculture, climate services, water-temperature, forecasting, modeling
Citation: Resnick D, Baethgen W, Hossain PR and Kadam S (2024) Exploration of a model driven by climate to simulate pond water temperature in aquaculture systems. Front. Clim. 6:1440671. doi: 10.3389/fclim.2024.1440671
Edited by:
Diriba Korecha Dadi, University of California, Santa Barbara, United StatesReviewed by:
Asaminew Teshome, National Meteorology Agency (NMA), EthiopiaCopyright © 2024 Resnick, Baethgen, Hossain and Kadam. This is an open-access article distributed under the terms of the Creative Commons Attribution License (CC BY). The use, distribution or reproduction in other forums is permitted, provided the original author(s) and the copyright owner(s) are credited and that the original publication in this journal is cited, in accordance with accepted academic practice. No use, distribution or reproduction is permitted which does not comply with these terms.
*Correspondence: Walter Baethgen, YmFldGhnZW5AaXJpLmNvbHVtYmlhLmVkdQ==
Disclaimer: All claims expressed in this article are solely those of the authors and do not necessarily represent those of their affiliated organizations, or those of the publisher, the editors and the reviewers. Any product that may be evaluated in this article or claim that may be made by its manufacturer is not guaranteed or endorsed by the publisher.
Research integrity at Frontiers
Learn more about the work of our research integrity team to safeguard the quality of each article we publish.