- 1Red Cross Red Crescent Climate Centre, The Hague, Netherlands
- 2Faculty of Geo-Information Science and Earth Observation, University of Twente, Enschede, Netherlands
- 3Department of Public Health, Faculty of Health Sciences, Copenhagen Center for Disaster Research, University of Copenhagen, Copenhagen, Denmark
- 4African Centre for Disaster Studies, North-West University, Potchefstroom, South Africa
- 5Gerald J. and Dorothy R. Friedman School of Nutrition Science and Policy, Tufts University, Boston, MA, United States
- 6Royal Netherlands Meteorological Institute, De Bilt, Netherlands
- 7International Research Institute for Climate and Society, Columbia Climate School, Columbia University, Palisades, NY, United States
This study investigates the potential of using OpenStreetMap (OSM) data to understand exposure and vulnerabilities to climate-related hazards of Sudan’s most vulnerable populations, such as internally displaced persons (IDPs) or refugees displaced by violent conflict. The rise of conflict in 2023 has triggered a surge in OSM mapping activities, including organized mapping events focused on supporting humanitarian efforts in conflict contexts. These mapping projects aim to address the heightened humanitarian needs driven by the conflict and to assist vulnerable populations impacted by violence. In this study, we conducted key-informant interviews to assess the suitability of using OSM data to enable impact-based forecasting (IbF) as part of Early Warning Early Action (EWEA) to climate-related hazards in data-scarce, conflict-affected regions of Sudan. Our study explores the perspectives of OSM data producers and users, focusing on crucial themes, such as data quality, ethics, user needs, and community inclusion. Our findings reveal that OSM data are perceived to be incomplete in Sudan due to numerous challenges, exacerbated by factors such as the lag in satellite imagery updates compared to the rapidly evolving population movements in conflict-affected areas. Despite various challenges, the overall lack of geospatial data paired with the urgent need to understand the exposure of vulnerable populations to climate-related hazards in the intersection of conflict highlights the usability of OSM as a tool to map high-risk areas to fill these crucial data gaps actively. To do so, addressing the communication gap between OSM producers and users is essential to ensure the effective utilization of collected data for its intended purpose. Moreover, community inclusion emerges as a significant concern, marked by gender disparities and accompanied by challenges in obtaining mapping permissions, as well as the impact of the digital divide. Based on these findings and recent changes in the mapping data landscape due to the escalation of conflict, we advocate for identifying high-risk, unmapped areas vulnerable to climate-related hazards in Sudan and increasing the frequency and spatial coverage of OSM mapping efforts in these regions. Emphasizing community empowerment and ethical data management will be essential to the success of these mapping initiatives.
1 Introduction
More than 30% of disasters due to natural hazards happen in conflict-affected countries (Kreyscher, 2022). Often, vulnerability to disasters is particularly severe due to the consequences of war, such as weak governance, destruction or decay of infrastructure, limited access to essential services, forced displacement, extended physical and mental health challenges, etc. (ICRC, 2020; Raju et al., 2022). Disaster Risk Reduction (DRR) and Climate Change Adaptation (CCA), including Early Warning Early Action (EWEA), also referred to anticipatory action (AA) efforts, are weak in these contexts (IPCC, 2022). Sauerhammer et al. (2024) analysed the challenges of DRR in conflict contexts and listed issues in long-term planning and funding due to political instability, lacking essential services, insecure and unsafe environments, complex logistics, corruption, and high operational costs. Violent conflict or its risk can hinder any DRR or related activity in its implementation. This is further amplified by limited operational and practical knowledge of DRR in conflict-affected areas in the context of do-no-harm and peace-building principles. The lack of tailored approaches for integrating DRR with conflict dynamics further complicates efforts. Mena (2023) further emphasizes that disasters are not natural, especially in conflict-affected areas, but a complex interplay of sociopolitical factors. To navigate this complexity, innovative, conflict-sensitive strategies that align with do-no-harm principles, ensuring DRR efforts that contribute positively to peace and conflict resolution are needed (Mena, 2023; Sauerhammer et al., 2024). One of the most critical challenges in assessing conflict, climate-related, and other hazards for the prioritization of DRR interventions by governments, non-governmental organizations (NGOs), and other stakeholders, as well as for communities in conflict-affected context, is the lack of a comprehensive and at scale exposure and vulnerability data. For example, in countries such as Sudan, geospatial data on critical and other infrastructure such as buildings, hospitals, water points, and schools, and their vulnerability conditions are constrained. For EWEA it is crucial to understand to what extent populations in certain areas of a given territory could be impacted by climate-related hazards. EWEA consists of a process whereby forecasts and risks analysis are applied to enable early action decision-making in the window of opportunity between a forecast and a shock (Coughlan De Perez et al., 2015). The goal is to reduce residual risks and prepare proactively for disaster response (GRC et al., 2020). In this study, we concentrate on understanding vulnerability and exposure to enable decision making. This process of deciding where to act early, before a disaster strikes, requires weather forecasts, knowledge of historical and future potential disaster impacts, as well as exposure and vulnerability data, which forms the basis of impact-based forecasting (IbF) (Harrowsmith et al., 2020). In other words, to predict what the weather will do rather than the traditional approach focused on predicting what the weather will be (WMO, 2021).
In this study, we explore the potential of OpenStreetMap (OSM)—the largest crowdsourced mapping dataset—to fill the gap in exposure and vulnerability data to enable IbF in countries affected by conflict. Our research aims to identify the needs of OSM data producers and users in conflict settings, comprehend mapping ethics, and assess the fitness for using OSM data in Sudan.
Crowdsourcing OSM data is already widely used for disaster response, including postdisaster needs assessments or emergency scenario planning, such as mapping evacuation routes and safe shelters or settlement mapping to plan and implement vaccine programs [e.g., OSM mapping is used to support COVID-19 response programs in Mali and South Sudan (HOT, 2022; Scholz et al., 2018)]. In Indonesia, OSM has been used as data input to geospatial risk and impact analysis software such as InaSAFE. InaSAFE is a freely available system, enabling accurate calculations and generating realistic scenarios of natural hazard impact analysis, allowing government agencies to enhance contingency planning and enable disaster risk financing instruments such as insurance (InaSAFE, 2023; Skovdal and Cornish, 2015). This development has been made possible by the rise of digital humanitarianism, as explored by Givoni (2016). This movement has expanded opportunities for global volunteer participation, harnessing the power of crowds to support innovative initiatives such as (IbF) through OSM mapping and data collection (Givoni, 2016). Various examples have shown that mapping can strengthen and empower communities. It allows to strengthen identity (e.g., mapping of cultural places), support accountability (e.g., mapping of schools or landfills to document their existence in informal settlements), or reduce gender-based violence (e.g., mapping of safe/unsafe areas by women) (Forghani and Delavar, 2014; Hagen, 2017; Kanthi and Purwanto, 2016). Furthermore, OSM mapping data can be actively utilized to support urban planning, DRR, and climate adaptation. Geospatial data can help to analyse, understand, and therefore reduce vulnerabilities such as food insecurity in geographic areas.
1.1 OSM data in Sudan
A review of OSM data and mapping activities in Sudan over the past decade reveals that international NGOs and organized mapping initiatives have primarily driven the mapping efforts, often focusing on specific regions in response to crisis events. Figure 1 shows the number of daily created, modified, and deleted nodes (A node is a single point in space defined by its latitude and longitude) in OSM for Sudan. The data patterns illustrate a notable surge in the creation of new nodes during the second half of 2023 and into 2024, following the escalation of conflict in Sudan in April 2023 (OSMstats, 2024).
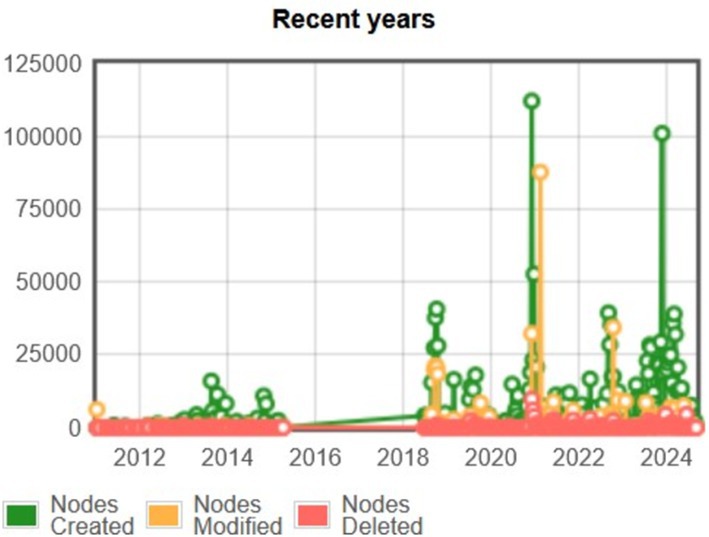
Figure 1. Daily edits of map nodes (created, modified, or deleted) in OpenStreetMap (OSM) in Sudan from 2012 to September 2024. Source: (OSMstats, 2024).
A similar trend is observed in the number of active mappers per day in Sudan (Figure 2). On 1 March 2024, the highest number of active mappers was recorded, with 119 mappers in 1 day. Notably, throughout the second half of 2023 and into 2024, there was not a single day without active mappers, in contrast to the previous years, where periods of inactivity alternated with spikes of high mapping activity (OSMstats, 2024).
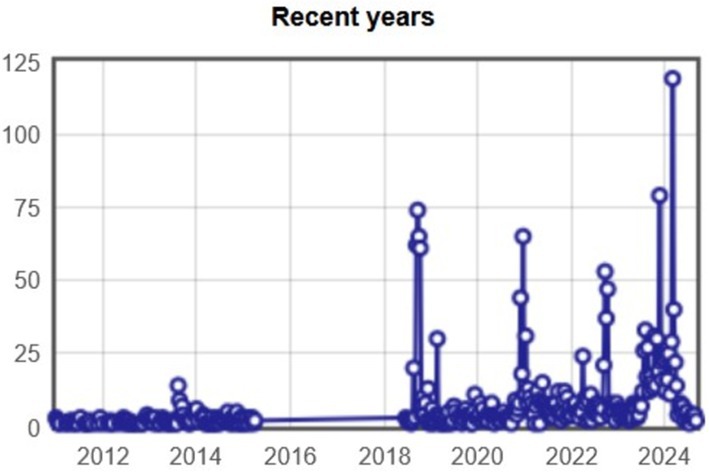
Figure 2. Number of daily active mappers in OpenStreetMap (OSM) in Sudan from 2012 to September 2024. Source: (OSMstats, 2024).
The surge in mapping activity since 2023 is also evident in the total number of buildings mapped in OSM across Sudan. Over the past decade, the number of mapped buildings increased from 28,300 on 21 August 2014 to 1,432,000 on 21 August 2024—showing a 4,958% growth rate (HeiGIT, 2024a). The most significant rise occurred between the second half of 2023 and 2024, following the escalation of conflict in April 2023, which drew attention to the unfolding humanitarian crisis in Sudan (Figure 3).
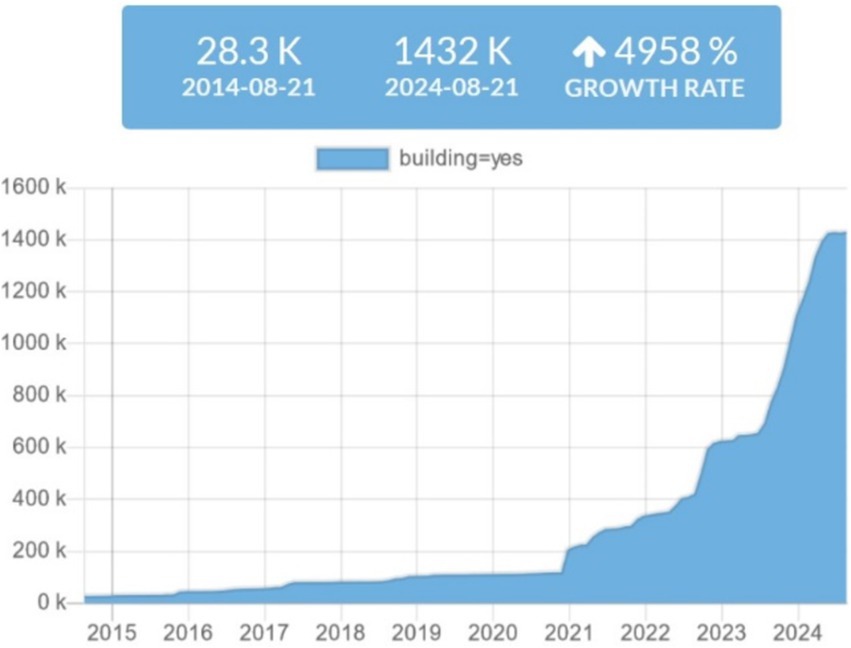
Figure 3. Total number of buildings mapped in OpenStreetMap (OSM) across Sudan from 21 August 2014 to 21 August 2024, showing a 4,958% growth rate. Source: (HeiGIT, 2024a).
A review of all organized mapping tasks on the Humanitarian OpenStreetMap Team (HOT) Tasking Manager (HOT, 2024a) reveals that a total of 51 mapping tasks have been set up in Sudan since 2013 (see Appendix A). Overall, OSM mapping tasks covered a variety of regions in Sudan. Key areas mapped frequently included Khartoum and surrounding areas, Blue Nile State, West Darfur (especially after 2023, indicating a higher focus on this area due to the ongoing conflict), El Geneina, Kassala, and refugee camps spread across the country. Areas mapped for flood-affected regions and refugee site mapping are common. Khartoum has been one of the most frequently mapped areas, with multiple projects dating back to 2013 related to postflood disaster mapping and continuing to more recent tasks in 2023 [e.g., North Khartoum (Missing Maps, 2023)]. The Blue Nile State stands out with four specific tasks across several years, reflecting a consistent interest in this region. Meanwhile, West Darfur became a focal point of mapping through 2023, primarily related to the conflict, showing 12 mapping tasks specifically in 2023 and 2024. The highest number of tasks per year, 13 in total, were published in 2023—all of which began in the months following the escalation of conflict in April 2023. These tasks focused on mapping areas in Khartoum (2 tasks), West Darfur (10 tasks), and Omdurman (1 task). In 2024, three additional tasks were initiated in West Darfur (2 tasks) and Omdurman (1 task).
Several key organizations and initiatives have been leading mapping efforts in various regions. Missing Maps has been involved in majority of the tasks after the escalation of conflict in April 2023, focusing on conflict zones such as West Darfur, Khartoum, and Omdurman, while Médecins Sans Frontières (MSF) has played a significant role in mapping Darfur (MSF, 2024). The Missing Maps initiative, founded by MSF, the British Red Cross, the American Red Cross, and the Humanitarian OpenStreetMap Team (HOT), aims to map the most vulnerable places in the world to improve crisis preparedness and response (Missing Maps, 2024). Tasks labelled with the hashtag #Missing Maps in the HOT Tasking Manager are typically collaborative efforts that benefit multiple humanitarian agencies, focusing on a broader range of topics. In contrast, tasks labelled with the hashtag #MSF typically indicate a focus on MSF’s specific operational priorities, directly supporting its field missions such as healthcare provision to displaced people or the enhancement of health infrastructure. CartONG contributed to earlier tasks before April 2023, including mapping refugee camps and the Blue Nile State. UN Mappers primarily worked on mapping roads, waterways, and villages in Abyei and Kassala. The Spanish Red Cross also mapped natural resources in areas such as Kassala and River Nile.
The prominent role of the Missing Maps initiative and MSF following the April 2023 conflict escalation is particularly evident when examining the number of OSM edits tagged with the hashtags #Missing Maps or #MSF through the ‘OhsomeNow Stats Dashboard’ (HeiGIT, 2024b). The hashtag #Missing Maps illustrates the volume of OSM edits in Sudan tagged with this label since 2014, showcasing the organization’s activity. The data reveals a noticeable increase in activity from 2016 to 2023, with a substantial surge beginning in the latter half of 2023 and continuing through 2024 (Figure 4).
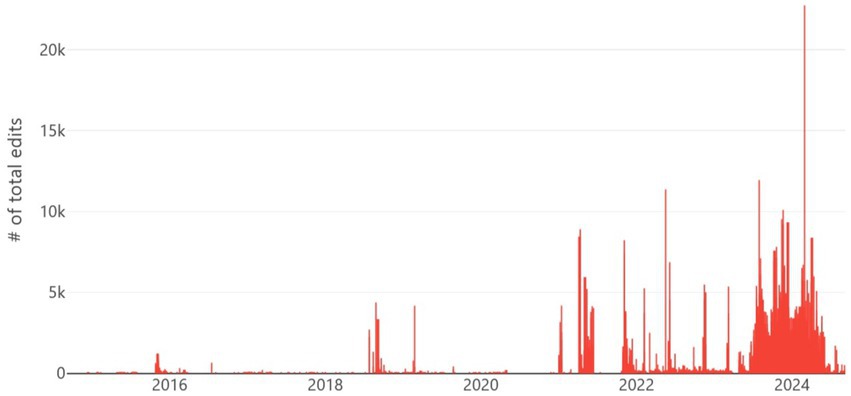
Figure 4. Timeline of edits in OpenStreetMap (OSM) across Sudan using the hashtag #Missing Maps from September 2014 to September 2024. The graph illustrates a notable surge in organized mapping activities following the escalation of conflict in Sudan in April 2023. Source: (HeiGIT, 2024b).
In contrast, the data-tagged pattern with the hashtag #MSF shows that MSF began its mapping activities in Sudan mainly in 2022. This activity initially declined during the latter half of 2022 and the early part of 2023 but shows a substantial increase starting in the summer of 2023 and through 2024 (Figure 5).
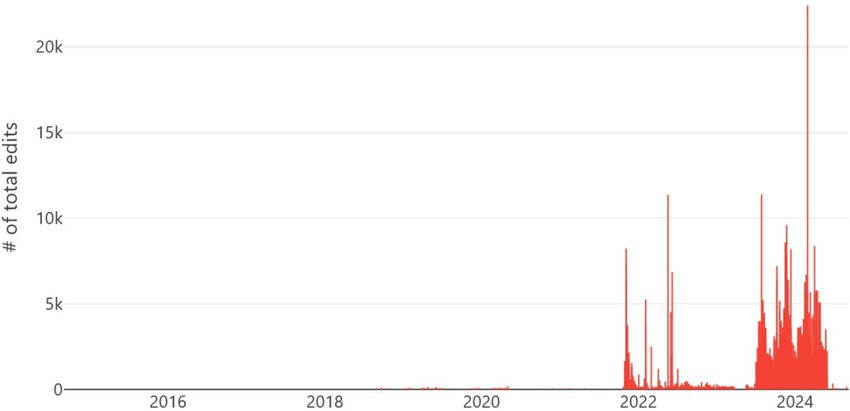
Figure 5. Timeline of edits in OpenStreetMap (OSM) across Sudan using the hashtag #MSF from September 2014 to September 2024. The graph illustrates a notable surge in organized mapping activities following the escalation of conflict in Sudan in April 2023. Source: (HeiGIT, 2024b).
An analysis of the currentness of OSM building data in Sudan indicates that a surge in mapping events since April 2023 has enormously improved the data’s currentness. Notably, 83% of all buildings mapped across Sudan were edited between August 2021 and August 2024 (Figure 6; HeiGIT, 2024a).
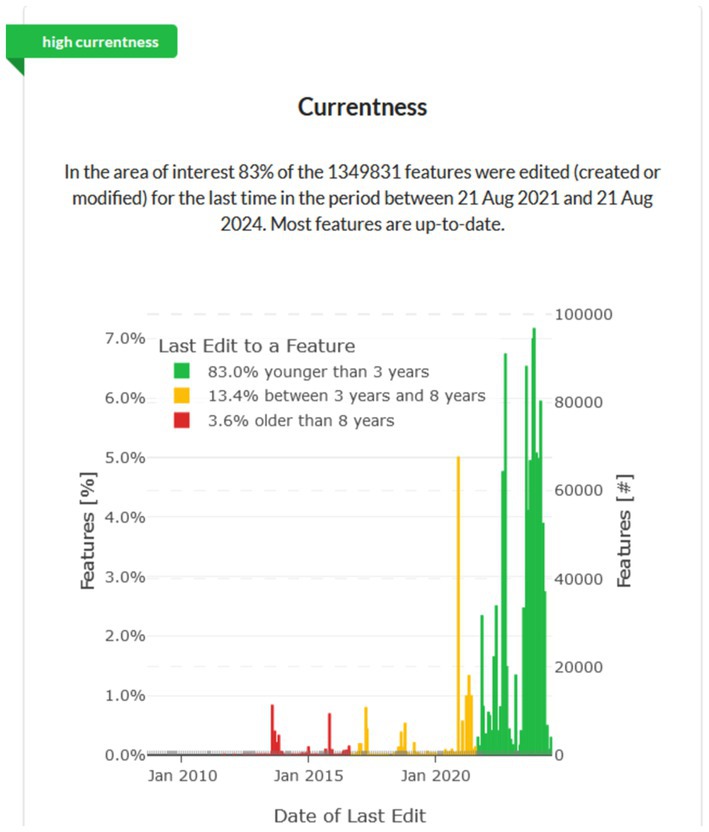
Figure 6. Currentness level of OpenStreetMap (OSM) building data in Sudan. High currentness is recorded, with 83% of all building features edited from August 2021 to August 2024. Source: (HeiGIT, 2024a).
The review of OSM data in Sudan reveals a critical intersection between escalating humanitarian needs driven by conflict and a surge of essential mapping data. This underscores the vital role of geospatial information in supporting humanitarian responses and highlights the potential of OSM to address these pressing demands. Hence, in this study, we present the case of Sudan, a country in which the recent escalation of the conflict in 2023 added to the already existing compound crisis generated over the last years through protracted conflict, displacement, disaster impacts, COVID-19 and other factors (Nzau, 2024). This compound crisis leaves the population exposed to climate variability and climate change impacts. The large scale of the crisis is further amplifying the challenges of EWEA for climate-related hazards, making it crucial to identify and prioritize those majority at risk and the locations they inhabit to effectively allocate limited humanitarian resources. Although significant progress has been made in recent years, vulnerability and exposure data are still scarce in Sudan. This creates significant challenges in the context of EWEA, as it is essential to understand who and what is more likely to be impacted by hazards to enable IbF.
2 Methods
We use qualitative methods to understand the opportunities and limitations of expanding OSM data in Sudan to enable IbF for early action decision-making, considering populations at risk of conflict and climate-related hazards.
2.1 Country selection
Three criteria of selection were applied to identify the case study country:
1. A country where the Red Cross Red Crescent was developing an anticipatory action system.
2. A country impacted by a compound crisis of climate and conflict.
3. A country extensively lacking geospatial exposure and vulnerability data.
Sudan was selected as the Sudanese Red Crescent Society started their first AA project in 2020. As presented in the introduction section, Sudan is a country historically impacted by conflict, currently experiencing a severe escalation in 2023 and simultaneously affected by floods, droughts, storms, extreme temperatures, and other hazards. Between January 2014 and August 2024, the Emergency Events Database (EM-DAT, 2024) documented 17 climate-related hazard events in Sudan. Floods were the most frequent, with 13 recorded incidents (Figure 7).

Figure 7. Number of hazard events and types recorded in Sudan between January 2014 and August 2024. Source: Own diagram, Hazard data: (EM-DAT, 2024).
However, the 2022 drought had the most severe impact on peoples’ lives, affecting approximately 11.8 million people across the country (Figure 8).
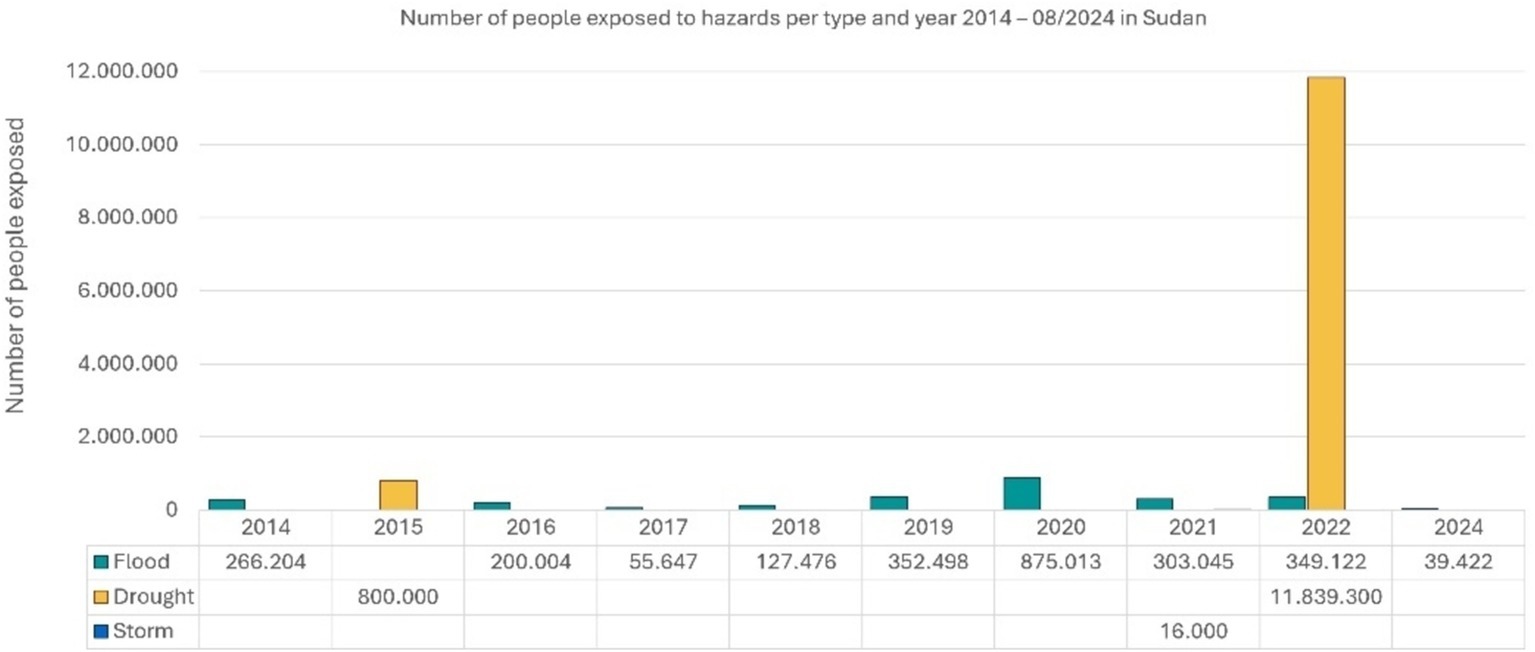
Figure 8. Number of people affected by hazards between January 2014 and August 2024 in Sudan. Source: Own diagram, Hazard data: (EM-DAT, 2024).
Since the independence of the Republic of Sudan in 1956, the country has faced significant challenges. The profound internal divide between the wealthier northern region and its less-developed southern region was among the most concerning. This divide played a significant role in the country’s two civil wars. The second Sudanese civil war (1983 to 2005) had significant impacts on the population, including famines, and led to an estimated two million casualties. In July 2011, Sudan’s southern territory split from the rest of the country and formed the Republic of South Sudan. Additionally, in 2003, the Darfur War broke out which would later be denounced as an act of genocide.
In April 2023, new waves of fighting for control of the state and its resources broke out in the Sudanese capital of Khartoum (Figure 9).
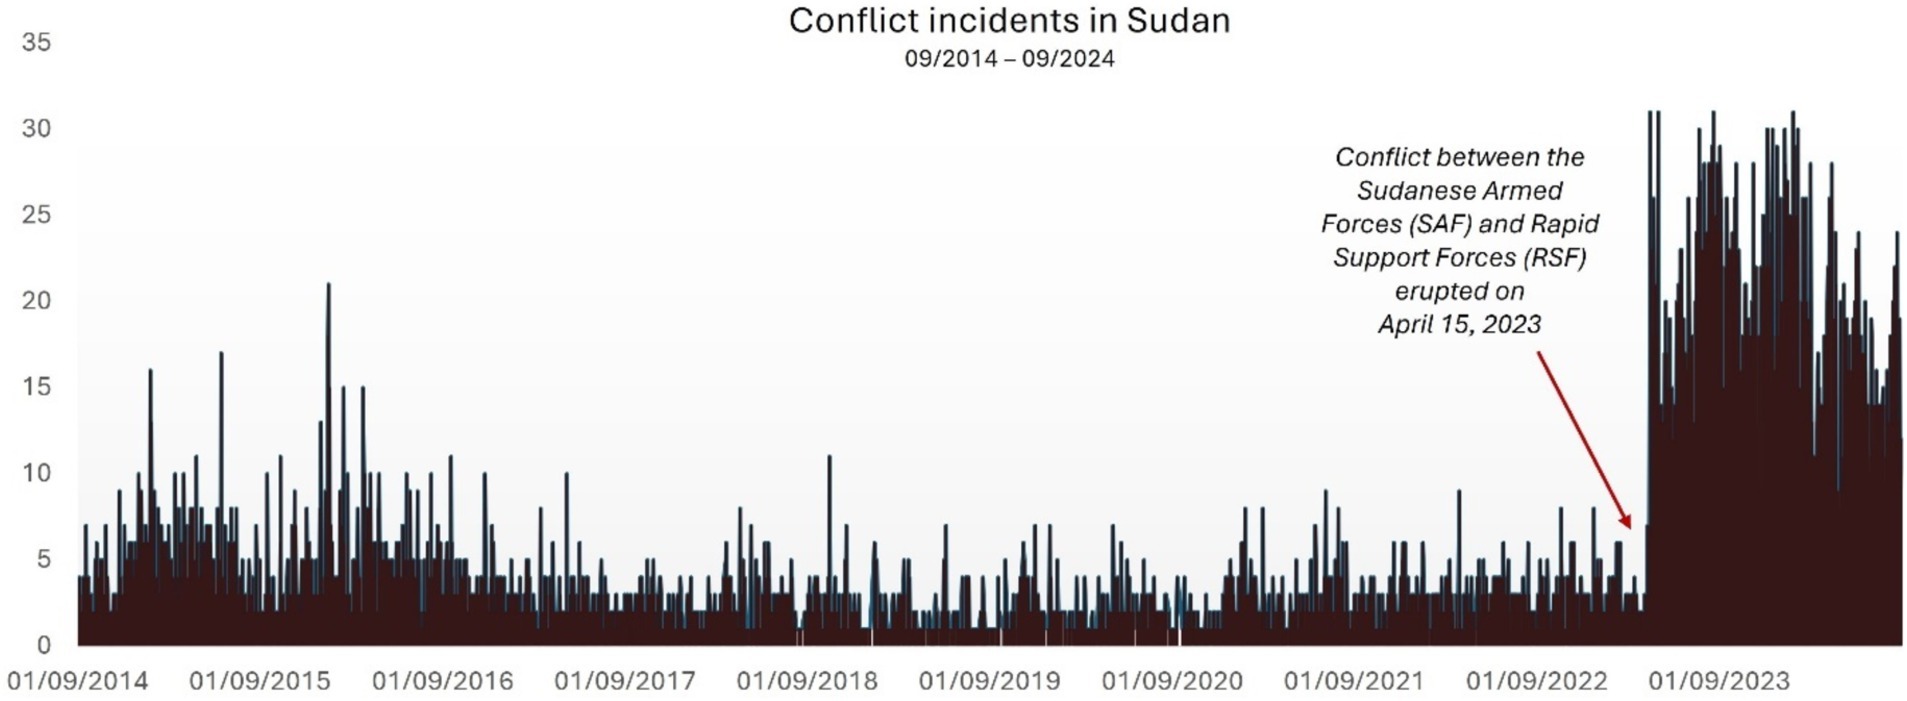
Figure 9. Number of daily conflict incidents in Sudan from September 2014 to September 2024. Conflict incident types include battles, explosions/remote violence, and violence against civilians. Source: Own diagram, Data: (ACLED, 2024).
The current state of the conflict in Sudan is the result of a legacy of historical grievances with ethnic dimensions, compounded by government failures, resource and military competition, and power struggles at the regional level (Nzau, 2024). This complex crisis escalated in April 2023, leading to an increase in repression, protests, and high levels of violence. The humanitarian situation is growing; according to OCHA, Sudan requires $2.7 billion to provide life-saving multicluster and protection assistance to 14.7 million people (OCHA, 2024). As of September 2024, violent conflict in Khartoum and across the country continues (Figure 10).
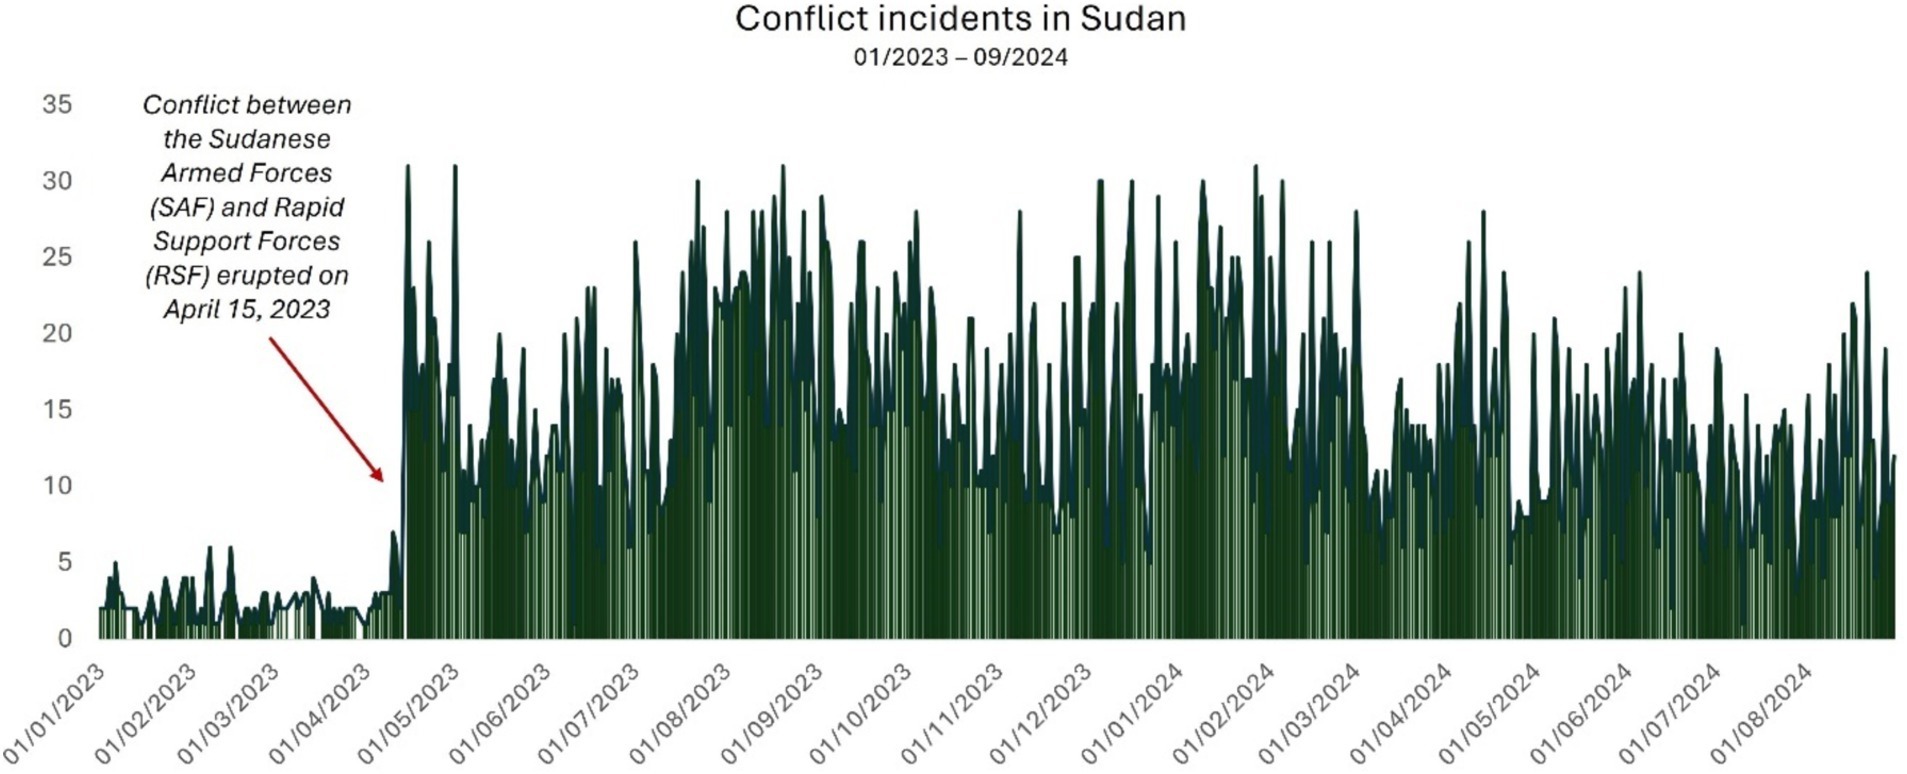
Figure 10. Number of daily conflict incidents in Sudan from January 2023 to September 2024. Conflict incident types include battles, explosions/remote violence, and violence against civilians. Source: Own diagram; Data: (ACLED, 2024).
Sudan ranks 15 on the list of most vulnerable countries to climate change by the Notre Dame Global Adaptation Initiative (ND-GAIN) index and 15 (also out of 191 countries) by the 2022 Inform Risk Index, an indicator of vulnerability. According to the 2022 Intergovernmental Panel on Climate Change (IPCC) report and the World Bank Climate Change Knowledge Portal (2021), Sudan is impacted by climate change due to extreme temperatures, changing precipitation patterns, and sea-level rise from the Red Sea.
In addition to challenges in access and food prices, the country’s food production is linked to rainfall, especially in rural areas which are home to 65% of the population. This coincides with conflict impacts such as market disruptions, including in the supply chain, as well as direct damage to critical infrastructure, such as hospitals and schools. In 2023, the number of internally displaced persons (IDPs) due to the conflict increased from 334.053 IDPs in April 2023 to 4.232.840 in September 2023 (IOM, 2023). By September 2024, 10.878.024 IDPs were displaced to 9.058 locations in 183 localities across all 18 states in Sudan (IOM, 2024). Over half (52%) of IDPs were reportedly children under the age of 18 years. Additionally, approximately 2.344.904 individuals have crossed into neighbouring countries since the conflict began in April 2023 (OCHA, 2024). IDPs who were forced to leave their homes due to conflict settle in informal settlements within areas particularly vulnerable to climate hazards such as flood impacts (Radio Dabanga, 2016a, 2016b). By March 2023, Sudan was hosting a total of 1.144.675 refugees from neighbouring countries (UNHCR, 2023), which often live alongside IDP populations. Through 2024, humanitarian organizations plan to provide humanitarian assistance to 14.7 million of the most vulnerable people in Sudan (OCHA, 2024). All these factors underscore the pressing need to prioritize efforts given the constraints of limited humanitarian resources.
Considering data scarcity, a 2021 study by OCHA’s Humanitarian Data Exchange (HDX) initiative found that Sudan (Figure 11) showed fairly good overall data completeness (67% complete on HDX), however by sub-categories showed extensive data gaps in geography, infrastructure, health, and education (OCHA, 2021).
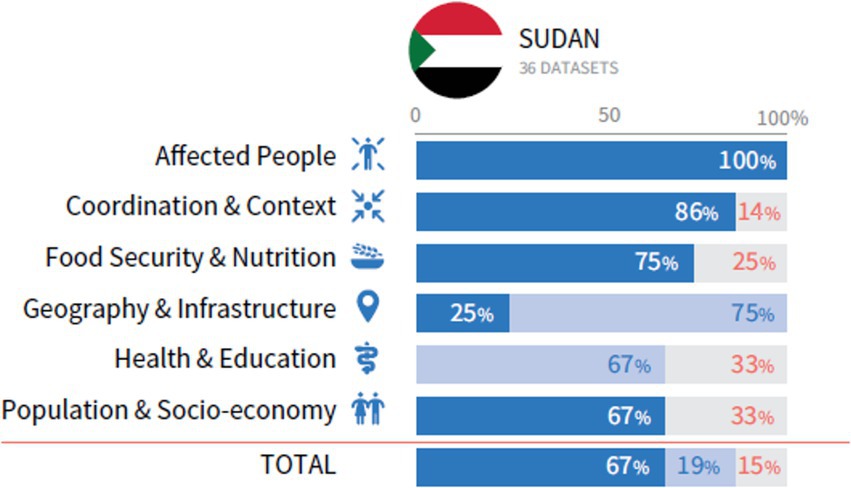
Figure 11. The state of available open humanitarian data of Sudan on HDX. Dark blue = complete; light blue = incomplete; grey = no data. Most notable are the low completeness of ‘Health and Education’ (includes vector data of locations of hospitals and schools) and ‘Geography and Infrastructure’ (includes vector data of administrative boundaries, populated places, roads, and airports). Source: (OCHA, 2021).
A comprehensive review of openly available geospatial datasets (including datasets of buildings, roads, rivers, water bodies, land use/cover, etc.) revealed a noticeable absence of data provision from national Sudanese authorities. Typically, these authorities collect, maintain, and share such data. At the Intergovernmental Authority on Development (IGAD) Climate Prediction and Application Center (ICPAC) geoportal (ICPAC, 2024) datasets are available of Sudan’s main roads, railway, main towns, and rivers as of 2014, which the government of Sudan provided through the Humanitarian Aid Commission (HAC) (Government of Sudan, 2014a, 2014b, 2014c, 2014d). However, these datasets have not been updated since 2014, and no other accessible datasets that were provided by the Sudanese government could be identified. Attempts to access such datasets from agencies’ official websites were unsuccessful (Last access attempt: September 2024). The websites of the responsible Sudanese authorities were unreachable, and the contact details provided were inactive, further highlighting the lack of accessible official geospatial data. The following Sudanese authorities were among the reviewed and inaccessible ones:
Role: Responsibility within the Sudanese Government to coordinate disaster management in the country.
Datasets, such as disaster and impact records, are usually provided.
• Sudanese Meteorological Authority
Role: Provision of quality weather and climate information and services to help decision-makers plan and take action to ensure food security, poverty reduction, and sustainable development.
Datasets such as weather and climate data, are usually provided.
• Sudanese Ministry of Agriculture and Forestry
Role: Development of agriculture to reduce poverty, increase economic growth, and achieve sustainable development in the country.
Datasets usually provided are agricultural production, food security, land use, and land change.
Role: The Ministry of Health focuses on providing equitable and quality health services that meet the Sudanese people’s expectations and needs.
Datasets usually provided are health indicators and health site locations.
• Sudanese Ministry of Irrigation and Water Resources
Role: Responsible for water, sanitation, and hygiene development.
Datasets are usually provided are river networks, hydrological and water body data, and water infrastructure.
• Sudanese Ministry of Science and Technology
Role: Responsible for supporting the construction of civilization by harnessing scientific research, science, and technology for developing natural resources.
Datasets usually provided are natural resource locations.
• Sudanese Remote Sensing Authority (RSA)
Role: Provision of satellite imagery and geospatial data, including land use and land cover datasets, to support projects related to agriculture, forestry, and urban planning.
Datasets usually provided are land use, land cover, and aerial images.
Many of these agencies are still listed by the United Nations Office for Outer Space Affairs (UN-SPIDER, 2024) as key partner institutions emphasizes the critical role they are expected yet currently lack to play in advancing Sudan’s data and digital infrastructure.
A broader review of geospatial data availability for Sudan revealed that much of the currently publicly accessible information has been collected and shared by international NGOs. However, these datasets are often outdated, as they were collected only once and usually lack regular updates or maintenance, limiting their actuality and long-term usefulness [e.g., Roads (WFP, 2021), Settlements (OCHA Sudan, 2020), Health facilities (HDX, 2019)]. The absence of official, up-to-date national datasets is especially significant for OSM data controls as accurate, regularly maintained national datasets are essential for assessing the accuracy and completeness of OSM data. In the absence of comprehensive Sudanese datasets, global resources such as Microsoft’s building footprint data (Microsoft, 2024), Map-X Sudan data platform (UNEP/GRID-Geneva, 2024), or FAO’s AQUASTAT (FAO, 2024) provide alternative datasets for assessing OSM data quality. These datasets allow for meaningful comparisons, helping to estimate OSM’s accuracy and completeness in mapping buildings, water bodies, and land use, particularly in areas where local data are scarce or unavailable.
2.2 Key-informant interviews: selection and analysis
Ten key interviews were conducted between 24 May 2021 and 14 June 2021 to understand the needs of OSM data producers and users in conflict settings, the ethical considerations of mapping in conflict settings, and the fitness to use OSM data in Sudan. The key informants were selected from a global pool of experts, and divided into three groups: OSM producer (three participants), OSM user (five participants), and OSM user/producer (two participants).
The selection criteria included people globally with humanitarian backgrounds and knowledge related to (1) Vulnerability and exposure data environment on a local level in Sudan. (2) Understanding of data gaps on a national or local level in Sudan. (3) Humanitarian practitioners with an understanding of early warning systems and the use of data for risk reduction. (4) Humanitarian practitioners with knowledge of Geographic Information Systems (GIS) application in conflict settings. The OSM producers included experts whose professional role included producing OSM data through direct editing or data quality monitoring in OSM and taking an active coordination role in organizing and managing volunteered mapping activities remote or in the field. Experts in this group have a strongly focus on ensuring data quality and validation of produced OSM data. The OSM users included experts who use open and crowdsourced mapping data to assess and plan humanitarian assistance. Experts of this group focus on the usability of existing open-access data for their work, including but not limited to OSM data.
While the number of key informants (KIs) is relatively small, their selection was highly strategic, focusing on gaining various insights across different roles within the OSM ecosystem. The selected participants represent diverse humanitarian organizations that either produce or rely heavily on OSM data for planning and assessments, reflecting a wide range of experiences and expertise relevant to the current mapping and humanitarian landscape. The KIs were selected for their ability to speak to critical issues, such as data quality, ethical considerations, usability, and the operational challenges of mapping in disaster or conflict-affected areas, thus providing valuable insights that are reflective of broader trends in OSM data use and production in humanitarian context in Sudan. This approach ensures that, while the sample size is limited, the selection captures a range of critical voices that align with the main dynamics of OSM in Sudan. This dataset provides a platform for cautious analytical generalizations. All interviews were conducted online and recorded (see Appendix B for the complete interview guide). All data collected in connection with the interviews conducted were stored on a password protected external hard drive. All recordings of interviews were deleted after transcribing and extraction of key messages. Consent forms were received via e-mail, which were deleted after reception, and consent forms were stored on the hard drive.
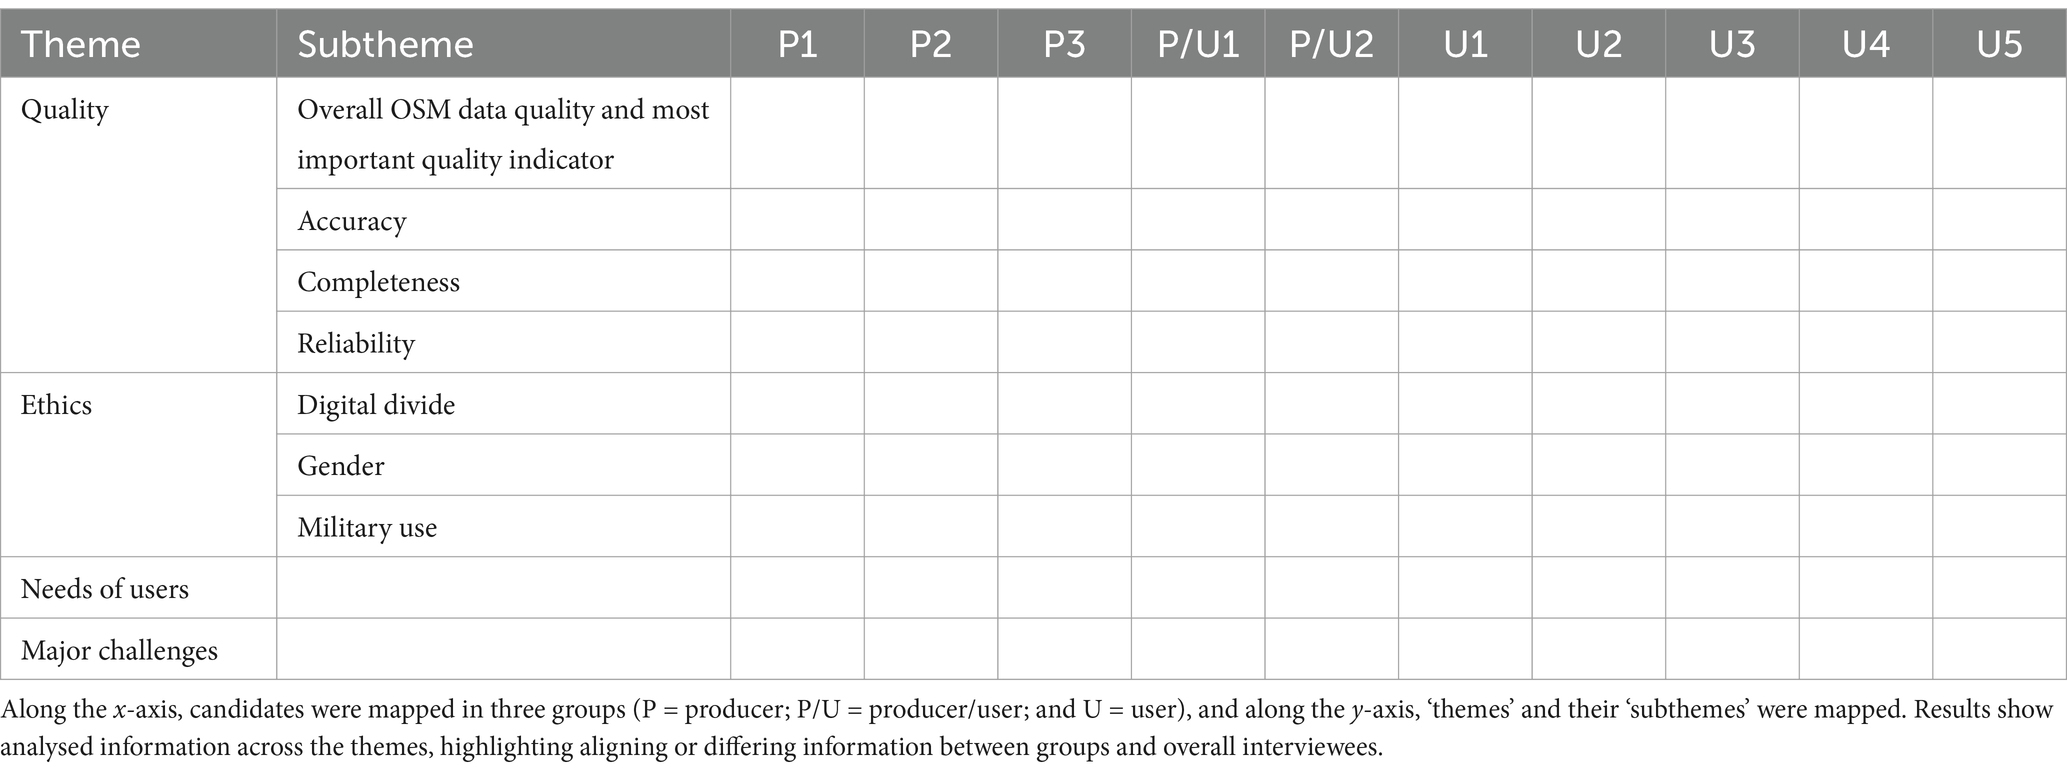
The analysis was conducted following Sinclair-Maragh’s and Simpson’s example of a deductive, thematic analysis that was first described by Braun and Clarke (2006). In this method, predefined themes are identified through a literature review conducted before the interviews. Then, a deductive, thematic analysis of interview data was applied, which was collected based on the predefined themes (Sinclair-Maragh and Simpson, 2021). This approach enabled a detailed content analysis based on the following predefined themes: (1) OSM quality, (2) Ethical considerations on the use of OSM data, (3) OSM user needs, and (4) Major challenges of OSM use. Additionally, we analysed six subthemes in relation to quality: (1) Accuracy; (2) Completeness; and (3) Reliability. For ethical considerations, we analysed the following: (1) Digital divide; (2) Gender; and (3) Military use. The interview themes were defined through previously identified knowledge gaps in the literature on topics and issues of OSM data collection and application in anticipatory action and conflict context. The interview data was organized in a matrix (y-axis ‘Themes’, x-axis ‘candidates in three groups’) (Table 1). DeepL Translator (2022 version, available at https://www.deepl.com) and ChatGPT (2023 version, available at https://chat.openai.com) were utilized for translation and for refining the phrasing in some sections of the text.
2.3 Limitations
Peer-reviewed literature on the specific use of OSM in the context of IbF and EWEA is very limited. Interviewees were contacted through gatekeepers, and all key informants were open data users, as no potential candidate strictly avoiding open data use could be identified. This could introduce a bias towards a positive perception of OSM data use. Additionally, although the number of participants is recognized as limited, they were strategically selected to ensure they represent diverse and relevant perspectives from both OSM producers and users. Data availability and accessibility for Sudan were highly limited, restricting the depth of insights into the geospatial landscape. Additionally, recent open high-resolution imagery of the areas studied was unavailable, which hampered the ability to assess the completeness, accuracy, and actuality of OSM building footprints compared to Microsoft’s building footprint data. The interviews were conducted in 2021, and since then, the escalation of conflict in Sudan in 2023 has spurred a surge in mapping activities, strongly altering the data landscape. The analysis of OSM data was extended to September 2024 to capture these changes, but due to the study’s resource constraints, no additional interviews were conducted to gather recent insights. Future research should address this gap by incorporating updated interviews to reflect the current state of OSM mapping use in recent conflict contexts in Sudan.
3 Results
In this section, we present the findings based on the interview themes on OSM data quality, ethical considerations, OSM user needs, and challenges in expanding OSM data in conflict areas. We explore how these topics enable or hinder expanding OSM mapping for IbF for early action in conflict settings.
3.1 OSM data quality in the humanitarian context
There is a growing global literature base analysing the accuracy and reliability of OSM data [e.g., quality of volunteered information (Haklay, 2010); quality indicators of road network data in Canada (Moradi et al., 2022)]. While these studies provide in-depth insights into the overall quality of OSM data, the analysis of our study focuses specifically on OSM data quality and OSM data fitness for use in humanitarian and conflict-related contexts. Our findings aim to fill knowledge gaps in this specific context and contribute to a holistic understanding of OSM data quality.
3.2 Accuracy and reliability
We found that the majority of interviewed OSM producers connected the overall accuracy of OSM maps to the performance of volunteers. Mapping data produced and validated through organized mapping events or by trained mappers has high accuracy, while the accuracy of data generated by inexperienced mappers tends to be low. The interviewed OSM users stated that spatial accuracy (how precisely the geographic locations in the dataset match their true positions on the Earth) is used to indicate the overall quality of mapping data in an area. Typically, existing data of the area is compared to the most recent satellite imagery. If the mapped information aligns with the imagery information, the map is considered accurate. Our analysis concludes that experts perceive already mapped OSM data in Sudan to be accurate spatially.
For example, recent mapping events focused on areas in Khartoum, such as ‘Missing Maps: Khartoum, Sudan – North Khartoum’ (Missing Maps, 2023). This mapping task was classified as moderate and restricted to intermediate or advanced-level mappers. The task was conducted in response to the intense violence that began in Sudan on 15 April 2023 with Khartoum being one of the areas most affected. The mapping and validation took place between 17 August 2023 and 22 October 2023, during which 43.385 buildings were mapped by 58 mappers and reviewed by 10 validators. Figure 12 shows the OSM building footprint mapped through the Missing Maps’ task (Missing Maps, 2023) compared to Airbus satellite imagery from April 2023, accessed through Google Earth Pro (Google, 2024). The comparison confirms the high accuracy, level of detail, and completeness of the mapped OSM data in the focus area.
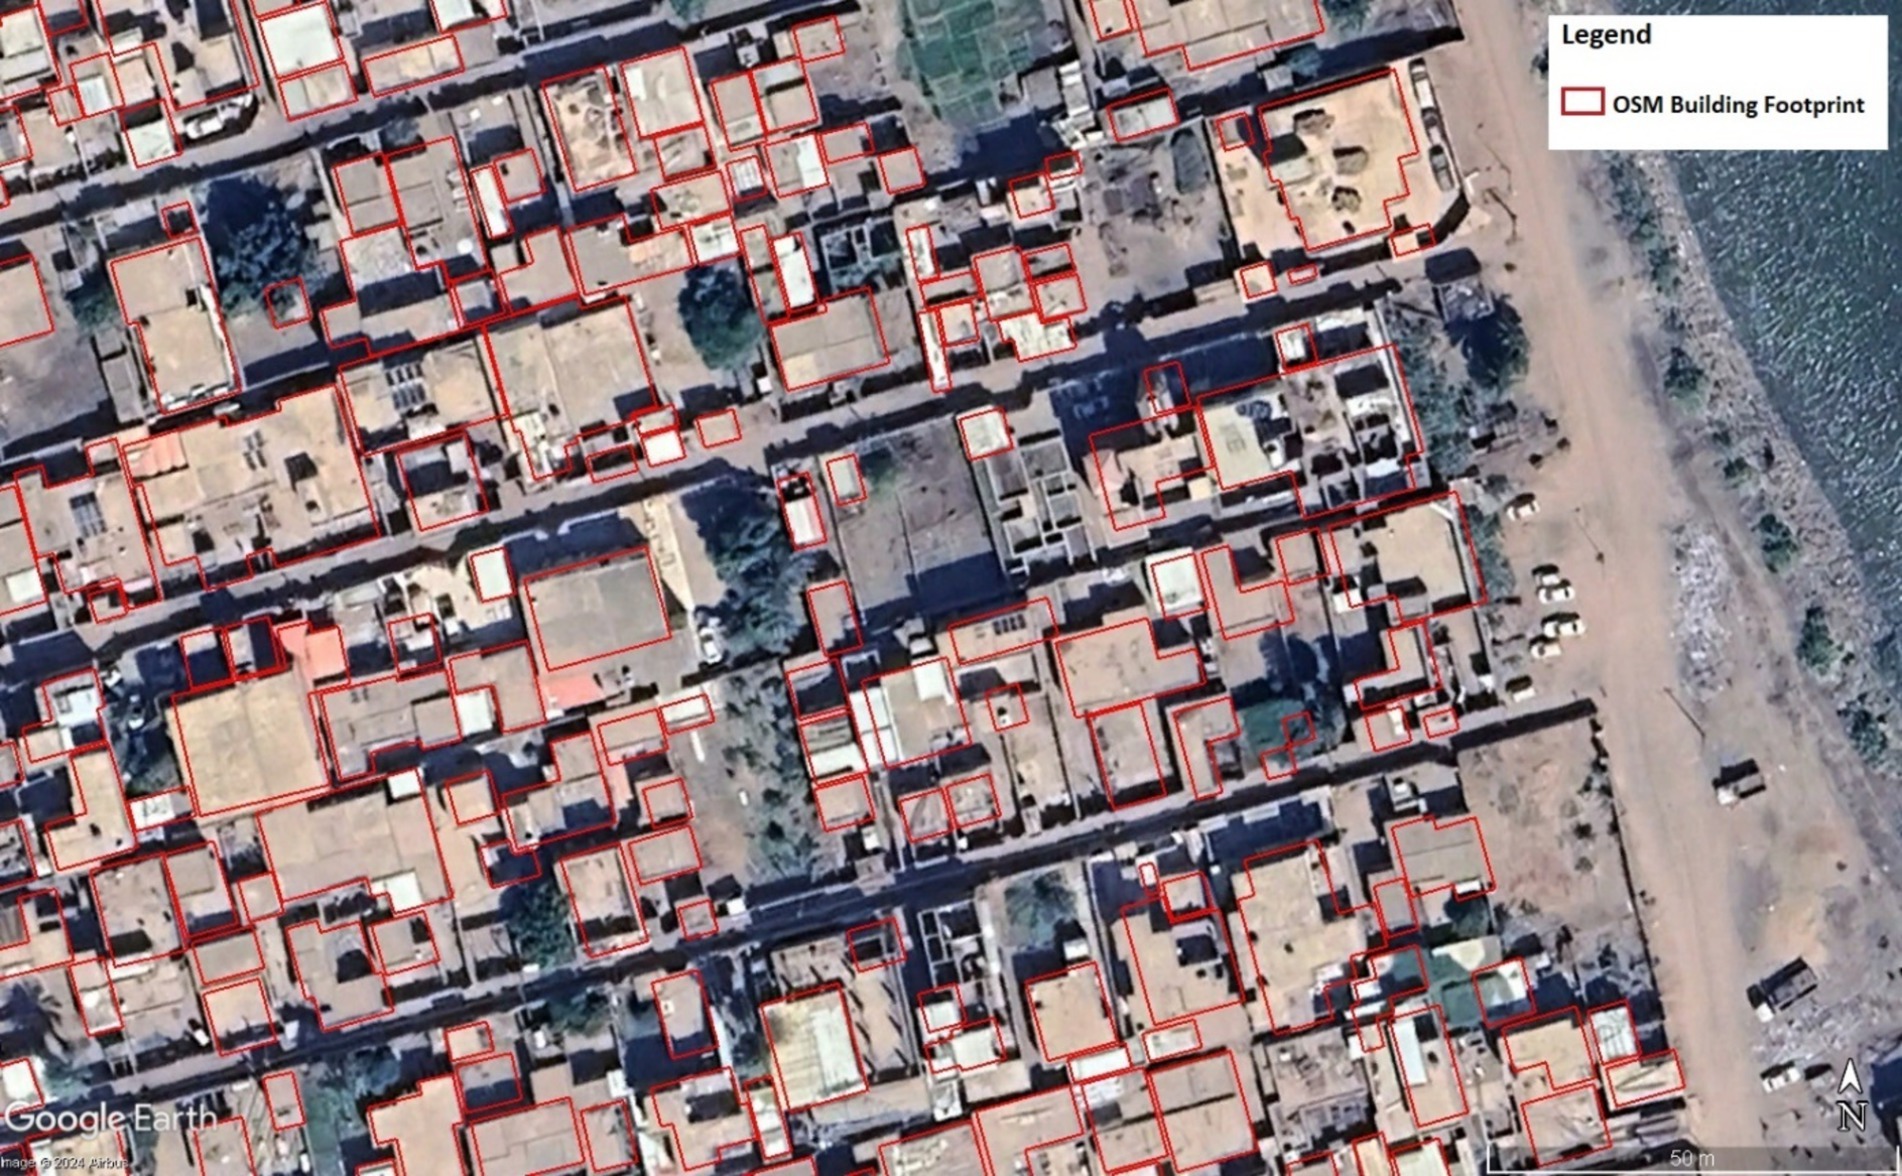
Figure 12. OSM building footprint (Location: 15°37′29.11”N, 32°30′27.16″E) mapped through the organized mapping event ‘Missing Maps: Khartoum, Sudan – North Khartoum’ (Missing Maps, 2023). Source: Own diagram; OSM data: (OSM Contributors, 2024); Imagery: (Airbus, 2024).
However, OSM users noted that evaluating attribute accuracy [the correctness of information about geographic features (e.g., building names)] is very challenging due to the limited on-the-ground access in conflict settings and the lack of official data for comparison.
Interviewees stated that the current percentage of coverage and completeness is very limited, as described in the following. All interviewed OSM producers stated that the reliability of OSM depends on the creator of the data, why it was when mapped, and by whom. The reliability of trained mappers is considered to be overall good to be good overall. One participant mentioned that only 40–50% of mapping data created by mappers without any training is often usable. OSM producers emphasized the importance of validation through experienced mappers of created data to ensure reliability. One participant mentioned a further concern about data reliability, particularly in a conflict context, that ongoing conflict is causing fast changes to the environment (e.g., building destructions), causing major challenges to keep mapping data up-to-date. Other interviewees pointed out that the long-term maintenance of mapping data is a general concern when using OSM. Participants mentioned as the further challenge of data validation and, therefore, reliability that ground validation of remotely mapped OSM data can be complex in conflict settings due to access and security concerns and deterioration or lack of physical infrastructure on the ground. This further hampers the inclusion of ground information into OSM.
All interviewed OSM users of mapping data stated that potential OSM data are assessed before use to check whether it is reliable. This happens through consulting experts in the field with knowledge of local ground truth or by an overall quality assessment of the mapping work. If OSM data in the area is considered reliable, it is used; if not, it is discarded, and alternative data sources are explored.
3.3 Completeness
All interviewees stated that the completeness of OSM data is very heterogeneous. In Sudan, OSM data completeness has been shown to be too low to be fit for use across large areas of the country (Figure 13 is showing examples from the incomplete OSM building footprint in the Abyei area).
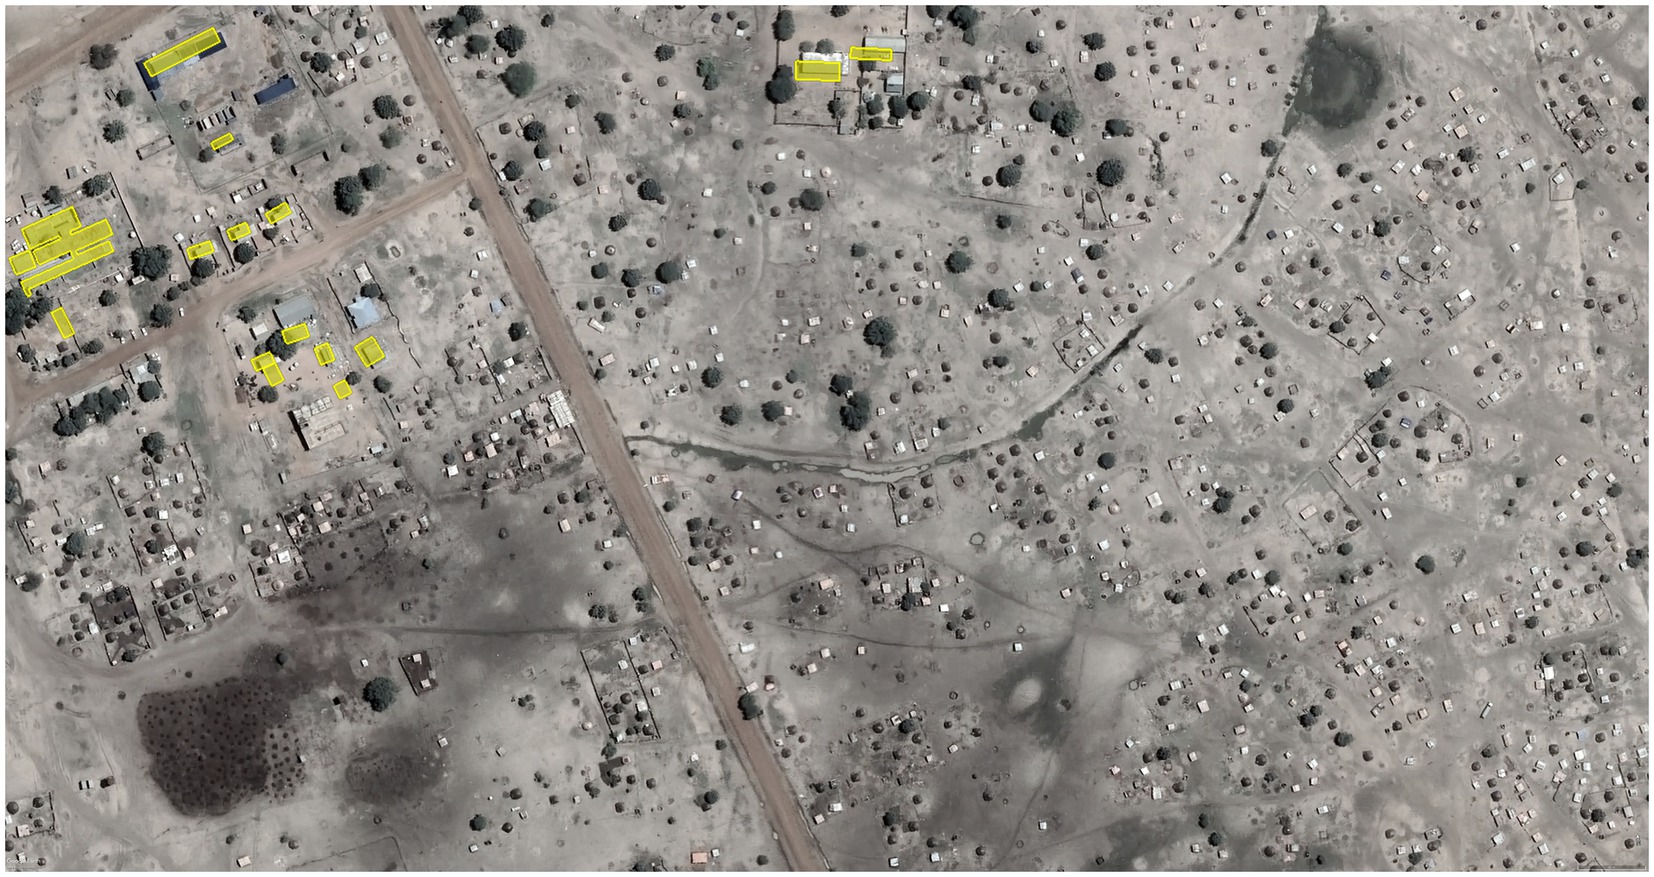
Figure 13. OSM building footprint (yellow shapes) compared to satellite imagery in Abyei (Location: 9°35’35.79”N, 28°26’15.07”E). The comparison highlights the incompleteness of building data in the area. Source: own diagram; building data: (OSM Contributors, 2024); imagery: (CNES & Airbus, 2024).
For example, the OSM History Explorer tool to assess OSM data quality shows that the completeness indicator ‘Completeness of Building Stock in Urban Areas’ lies below 20% across majority of the urban centres in Sudan. Meanwhile, urban centres such as Khartoum, Kassala, Nyala, or El Geneina, which have been the focus of recently organized mapping tasks, show >80% completeness (HeiGIT, 2024a). A review of changes in the number of mapped buildings mainly in the Khartoum area, until September 2024, shows a strong trend of increase in mapped buildings in the city and surrounding areas (Figure 14; HeiGIT, 2024a). The data highlight the start of mapping in the area in 2013 and a first spike in mapping activity starting in 2022, followed by a rapid growth curve in mid-2023. This trend mirrors the overall surge in mapping activity observed after the escalation of conflict in Khartoum in April 2023.
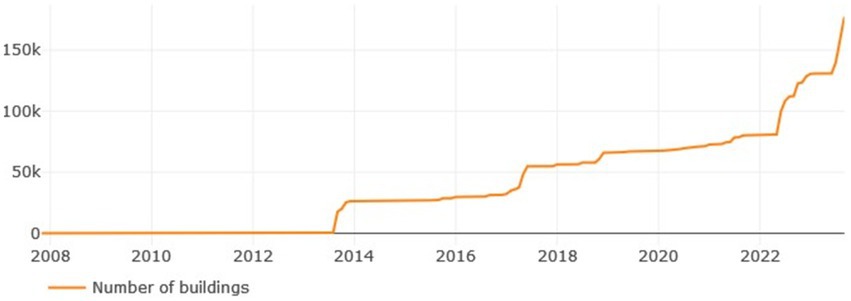
Figure 14. Number of buildings mapped in OpenStreetMap (OSM) in Khartoum and surrounding areas between 2008 and September 2023. Source: (HeiGIT, 2024a).
From a global perspective, the completeness of OSM data is strongly connected to the location and activity of OSM mapping in the area. Respondents stated that completeness is very high in ‘trendy areas’, which have been the focus of postdisaster response, with high media coverage, such as areas in Nepal affected by the earthquake in 2015. One of the users stated: ‘OSM data can be quite heterogenous. A strong impact has the interest of mapping volunteers in a certain event or context, resulting that ‘trendy’ areas with good media coverage and international interest are often very well mapped: e.g., many volunteers focused on mapping Nepal after the earthquake in 2015. Conversely, areas with comparatively less attention or events which are hardly known internationally often suffer from a lack of data in OSM.’
At the same time, areas of conflict had been mainly neglected by the mapping community before April 2023, leading to incomplete mapping data, especially in past conflict-affected areas. Figure 15 showcases an example of data heterogeneity in the Abyei area. In this case, the completeness of the building footprint varies substantially within the boundaries of the UNIFSA camp and areas outside.
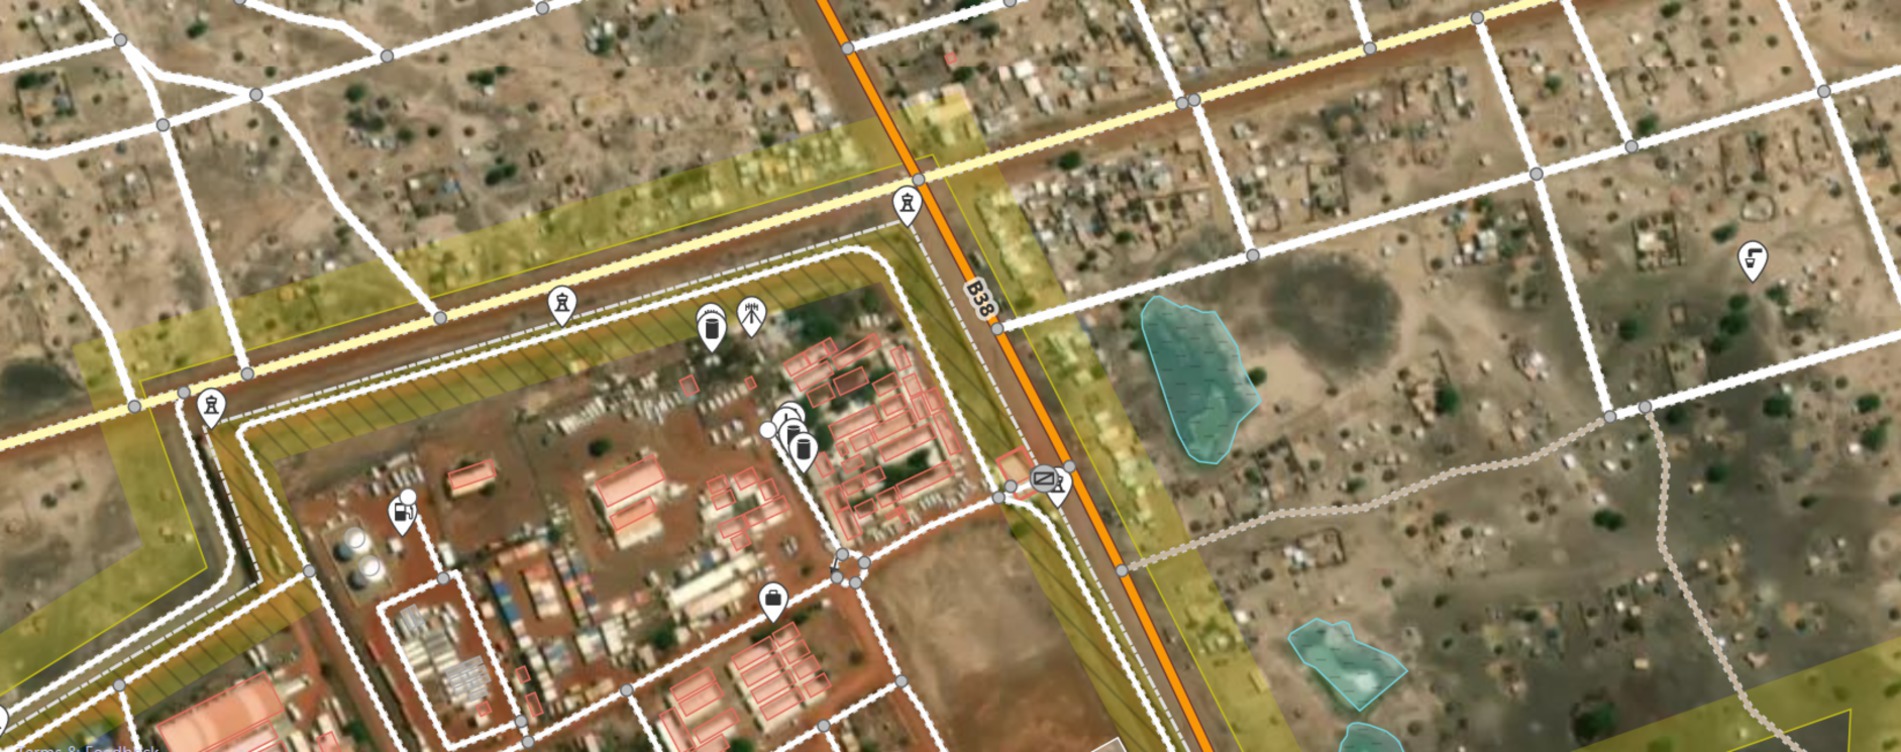
Figure 15. ‘In-browser OSM iD editor’ view of the north-eastern corner of the UNIFSA camp and surroundings in the Abyei area. This example shows the features mapped in OSM, highlighting how roads appear completely mapped (white and yellow line features) while building (transparent red shapes) completeness is much higher within the camp boundaries than outside. The comparison highlights the heterogeneity and incompleteness of OpenStreetMap (OSM) data in the area. Source: Own diagram, ‘In-browser OSM iD editor’ view available from www.openstreetmap.org, Data: (OSM Contributors, 2022).
The majority of the interviewees highlighted that all created mapping data, derived analysis, and future estimations can only be as good as the initial input dataset. Existing data always has limitations and is a snapshot of the past. For remote mapping, the data’s actuality depends on the availability of the most recent freely and openly available satellite or aerial images. While the imagery is often made freely available after significant disasters to support the response, this is not true in conflict settings. This is especially predominant in countries of long-term conflict like Sudan, with severe data scarcity (Meier and Leaning, 2009; Mohamed, 2006). Interviewed OSM users stated that OSM data completeness in an area is assessed by comparing it to an alternative dataset or satellite imagery [for example, Figure 16 shows OSM building footprint created through an organized mapping task (Missing Maps, 2023) compared to Airbus imagery from April 2023 in Khartoum (Google, 2024)]. One OSM user said that the map is considered complete enough for use if OSM data completeness for roads and buildings is higher than 80–90%. Majority of the issues of incomplete maps include the underestimation of affected people when building counts are used for impact assessments and the fact that incomplete road networks cannot be used for routing and operations planning.
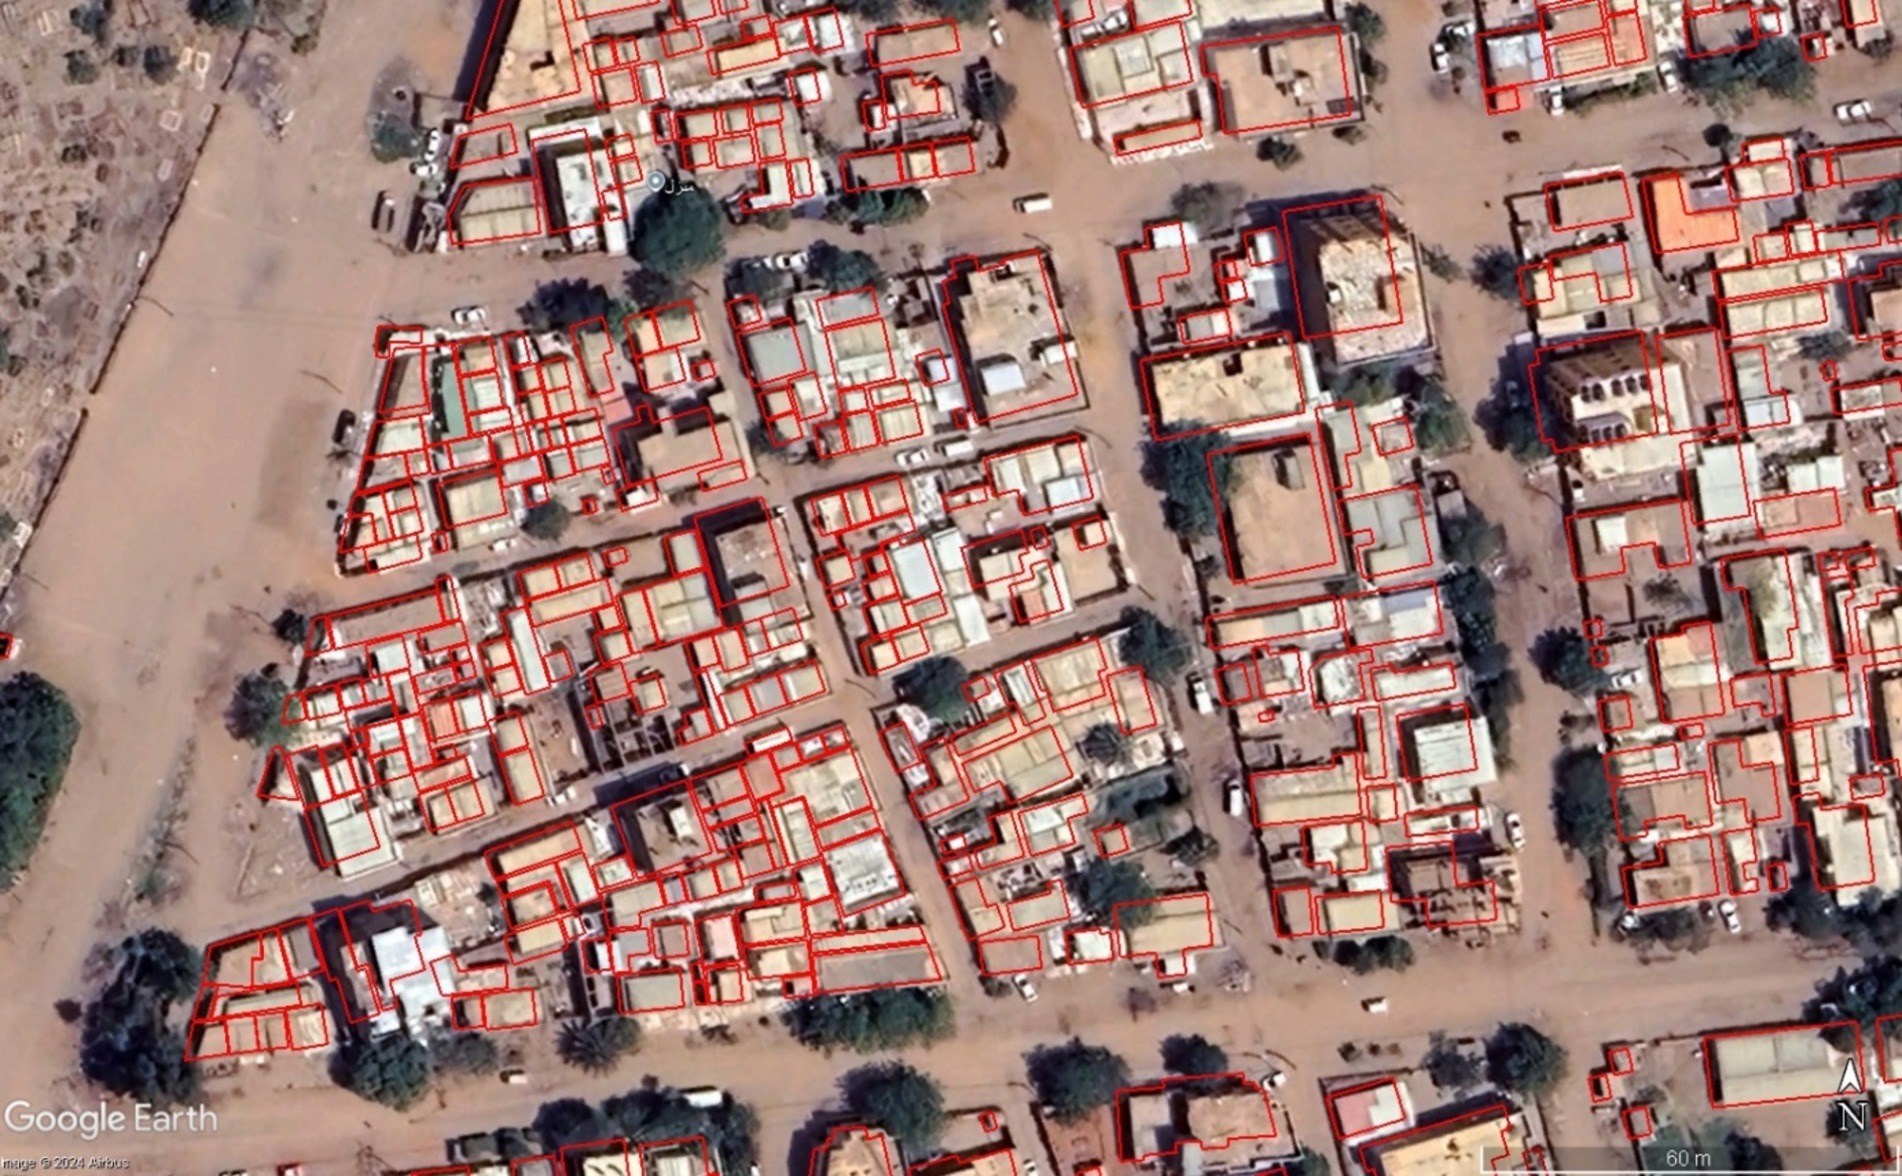
Figure 16. OSM building footprint (Location: 15°37′22.10”N, 32°31′30.10″E) mapped through the organized mapping event ‘Missing Maps: Khartoum, Sudan - North Khartoum’ (Missing Maps, 2023). Source: Own diagram; OSM data: (OSM Contributors, 2024); Imagery: (Airbus, 2024).
3.4 Ethical issues
All interviewees addressed ethical considerations as an essential part of OSM data and open data in general. The majority of OSM users stated that, in their opinion, the primary responsibility of taking ethical considerations of mapping in conflict-affected areas lies with the OSM producer. OSM users further mentioned that once OSM data are created and openly available, they are considered by the OSM users as ethically unproblematic and already approved for use by OSM producers without requiring further ethical considerations regarding the data itself from the OSM user side.
3.4.1 Digital divide
The digital divide and how to counteract it is a topic that has been little addressed by the interviewees. Two participants pointed out that lack of internet access hinders mapping from the bottom-up and inclusion of communities, which is an issue, especially in conflict-affected areas. In 2019, Sudan’s internet penetration was assessed as low, with only around 34% of households having internet access (ITU, 2021). One OSM user mentioned the importance of skills and data owned by the mapped communities. The participant sees the risk that with the current advancement of technology such as artificial intelligence (AI), countries in the global south might be left out in data generation, expanding the gap. This aligns with the comments of an OSM producer/user who discussed the importance of community involvement and empowerment through community mapping. Interviewees stressed the importance of involving local communities from the beginning to prevent or address any potential aversions or mistrust, especially in conflict contexts. One OSM producer gave an example where remote mappers mapped community areas to support, but by doing so, took the opportunity from community members to map their own environment and include what is most important to them.
3.4.2 Gender
One of the interviewed OSM producers supported the statements from the literature (Mooney et al., 2013; Neis and Zielstra, 2014) that OSM mapping is male-dominated, which is reflected in the mapped data, and gave an example of a recent OSM mapping event where 90% of the participants were male and only 10% female. This complements the findings of Hagen (2017), who analyzed the impacts of the Map Kibera project (Hagen, 2017). One focus of this project was to map safe and unsafe places for girls and women in the community through focus group discussions with girls aged 8–16 years (Hagen, 2017). Information such as this is lost or underrepresented if females are not integrated and represented well in the mapping process. As one of the barriers, two participants mentioned that women are especially prevented from engaging in ground mapping in conflict settings due to security concerns from family members. Furthermore, concerns were brought up on the mapping of information on Lesbian, Gay, Bisexual, Transgender, Queer, or Plus (LGBTQ+) communities (e.g., locations of LGBTQ+ community or information centres). An example which two interviewees mentioned is a project of mapping LGBTQ+ communities in Madagascar. The interviewees expressed concern about adding this information to OSM due to the potential exposure of vulnerable groups.
3.4.3 Military use
All interviewees stressed the importance of considering the potentially harmful use of OSM mapping data and assessing each potential mapping task in conflict settings regarding local context and potential impacts prior to mapping. Harmful use could, for example, include providing data for operational planning or creating records and exposing vulnerable groups’ locations. Three interviewees mentioned that they are under the impression that the advanced military already has much higher quality maps and geospatial data. Therefore, adding information to OSM would not benefit military use but only affected people in the area. One OSM producer mentioned that previous mapping events avoided ongoing -conflict areas because many organizations (humanitarians and others engaged in OSM mapping) do not want to be associated with any action within conflict areas. This accounts especially for ground mapping and validation activities. However, recent events since the escalation of conflict in April 2023 in Sudan highlight a surge of mapping activities aiding the response efforts [e.g., ‘Mapping El Geneina, a flashpoint in the Sudan conflict’ (MSF, 2024)]. These recent changes will provide an opportunity to gain further insights into mapping activities in a conflict context. All interviewees concluded that it is most important to assess each case individually and consult experts with local knowledge prior to mapping. In every case, it should be assumed that mapping might cause harm, and ways to avoid harm must be assessed. In this process, whether the area can be mapped and what information should or should not be included in OSM must be clarified. One OSM producer/user stated that a potential approach could be to restrict access to specific mapped data, though this conflicts with OSM’s open data policy.
3.5 Needs of users
We found similar and contrasting opinions between OSM users and OSM producers regarding data needs and the role of local knowledge. For example, the majority of interviewed OSM users stated that it is essential to them that the mapping data are complete in terms of buildings and roads in the area of interest. At the same time, OSM producers suggested that the most important quality indicator of OSM data is when the data were last edited. OSM users responded that one overall advantage of using OSM data is adding and validating local knowledge attributes, which is crucial information for assessments. OSM producers stressed that to generate valid OSM data, they need to receive information on the local context, the intended use of the data, and what data should or should not be included when mapping an area. To emphasize this communication’s impact, one OSM producer shared an experience where the local government wanted water points to be mapped in an area. The motivation for doing so was collecting taxes for those water points. Meanwhile, the local community wanted to map waste dumps in the area to hold the government accountable for waste disposal. This example highlights the importance of understanding the local context’s data usage and the potential impacts of mapping data locally.
OSM users, as well as OSM producers, outlined that significant opportunities of OSM use in conflict settings are the cost-efficient use of volunteered crowdsourcing to collect and analyse geospatial data and the independence from local physical infrastructure when collecting data through remote mapping. However, the majority of interviewees stated that accessing high-quality, up-to-date imagery needed for remote mapping is especially difficult in past and present conflict-affected areas. Two interviewees mentioned that commercial imagery is often made available in response to natural hazards disasters but that this is not the case in conflict-affected areas since organizations do not want to be associated with conflict. At the time of the analysis of interviews, open accessible satellite imagery of Sudan had shown to be at least 2 years old or older, which is not sufficient to create up-to-date map data (Maxar, 2021; USGS, 2021). A further challenge was mentioned by half of the interviewees, stating that OSM mapping is very resourceful and time-consuming. It is, therefore, not feasible to map a whole country at once. Sudan is extensively lacking data in OSM (OSM Contributors, 2024). Therefore, it is essential to identify and prioritize high-risk areas for mapping to use existing resources most efficiently. Identifying where people are most likely to be impacted by climate and conflict and their compounding impacts is, therefore, a key challenge. OSM users further stated that for the intended use of OSM data to enable IbF for early action in conflict settings, the following features should be included in the OSM data model and mapped: buildings, roads, health facilities, schools, gas stations, airports, seaports, administrative buildings, security centres (e.g., police stations) and land-use areas.
Half of the interviewees mentioned that gaining permission to map areas might pose a challenge in conflict settings. One OSM user stated that consent is not required to start OSM mapping but that the country’s government or authorities can request that existing OSM data of the country be removed if it is not approved or might cause security issues. Four interviewees stated that the correct terminology for undefined borders in conflict areas must be used, and the choice of mapping language must be assessed. Sudan has undefined borders in the north to Egypt (Mohyeldeen, 2021) and south to South Sudan around the Abyei Area (Political Geography Now, 2012), which need to be represented neutrally to avoid implying any political stance. By default, location names on OpenStreetMap.org are displayed in the area’s primary or local language—Arabic in Sudan. However, multiple languages can be added to features in the OSM database, enabling users to customize the display of names in other applications or GIS software when creating maps (OSM Contributors, 2024).
4 Discussion
In this study, we use the case of Sudan to highlight the complexities of OSM data in conflict-affected contexts. We discuss in the following these complexities and OSM’s potential to close the gap of exposure and vulnerability data to enable impact-based forecasting for early actions to climate-related hazards in countries affected by conflict.
4.1 Creating a credible dataset
The historical and current conflict in Sudan is exacerbating risks and vulnerabilities in the population. Combined with high risks of floods, drought, and other hazards, this increases the likelihood of compounding disaster impacts in the populations and systems around them. In Sudan, interviewees perceived OSM data as highly incomplete and often outdated across the majority of the country, which had not been the focus of organized mapping events. We argue that OSM is a suitable tool to collect and map crucial geospatial data in data-scarce areas. This information can play an essential role in enhancing IbF in Sudan. The understanding of who is more likely to be impacted due to their proximity to hazards and their vulnerabilities can be used by decision-makers to decide where to prioritize early action support to reduce risk and prepare for effective disaster response.
Givoni (2016) discussed that digital humanitarianism opens new possibilities for volunteers to engage and contribute to DRR and climate change adaptation from all over the world (Givoni, 2016). Interviewees described digital humanitarianism as a great opportunity and innovation in disaster volunteerism, as it allows volunteers to contribute from any location with an Internet connection. This allows linking digital humanitarianism with innovative humanitarian processes such as IbF. What strengthens trust in OSM data is the crowd’s intelligence, meaning that when many contributors create data together, errors an individual might make are detected and corrected by the crowd. This is also known as the ‘Linus law’ (Haklay et al., 2010). The more contributors’ information aligns, the more trustworthy the information becomes (De Albuquerque et al., 2016; Goodchild and Li, 2012). Analysis has shown that the highest OSM data quality is reached through organized mapping and validation tasks (De Albuquerque et al., 2016).
For example, a review of mapped buildings in OSM in Kassala and surrounding areas, including the Wad Sherifey Refugee Settlement, reveals a first spike in mapping activity at the end of 2020, followed by a second, more sustained spike at the end of 2021 (Figure 17). This growth has continued steadily, with a further increase observed starting in the second half of 2023 (HeiGIT, 2024a).
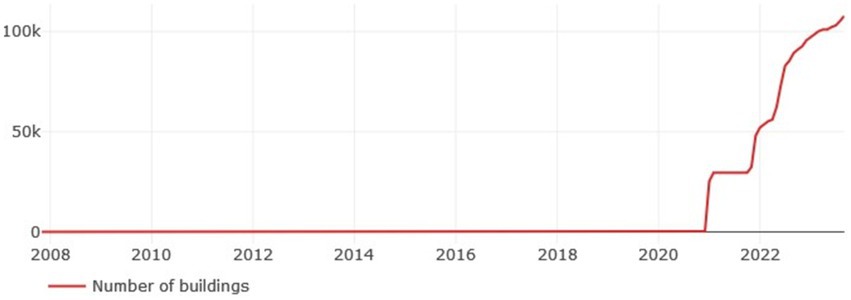
Figure 17. Number of buildings mapped in OpenStreetMap (OSM) in Kassala and surrounding areas, including the Wad Sherifey Refugee Settlement between 2008 and September 2023. Source: (HeiGIT, 2024a).
The second visible spike of November 2021 reflects data edits of the organized mapathon ‘Updating buildings in Wad Sherifey refugee camp, Sudan’, which took place in the first week of November and focused on mapping buildings of the Wad Sherifey Refugee Settlement (Missing Maps, 2021a). Figure 18 visualises the mapping area, task status, and the timeline of progress of mapped tasks (orange) and validated tasks (red). The task was created in the ‘HOT Tasking Manager’ on 22 October 2021, and a strong incline of mapped tasks on 2 November 2021 reflects the organized mapping event, followed by validation tasks. Through the mapathon, around 60% of mapping tasks were completed, and independent mappers completed the rest of the tasks. On 5 February 2022, all tasks had been mapped, and on 1 April, validated the tasks (Missing Maps, 2021a).

Figure 18. Humanitarian OpenStreetMap Team (HOT) Tasking Manager task of mapping buildings in Wad Sherife Refugee Settlement and the contribution timeline and progress of mapped (orange) and validated (red) tasks. Source: (Missing Maps, 2021a).
A second task focusing on the city of Kassala was published on the HOT Tasking Manager on 22 October 2021 (Missing Maps, 2021b). Unlike the first event, this task was not part of an organized mapping event. The contributions timeline reveals a slower but steady progress (Figure 19). An initial spike in mapping and validation tasks occurred in the first 2 weeks. By 26 May 2022, half of the tasks were completed, and 100% of the tasks were finalized by 8 August 2023. However, task validation stagnated at 40% by 11 October 2022 (Missing Maps, 2021b).

Figure 19. Humanitarian OpenStreetMap Team (HOT) tasking manager task of mapping buildings in Kassala and the contribution timeline and progress of mapped (orange) and validated (red) tasks. Source: (Missing Maps, 2021b).
The comparison between these two OSM mapping tasks highlights the strong impact that organized mapping events can have on the actuality, completeness, and overall quality of mapped data. The task associated with the mapathon focusing on Wad Sherife was completed and validated to 100% within 3 months. In contrast, the task focusing on Kassala city, which was not part of an organized event, exhibited much slower progress in mapping and validation. This underscores the effectiveness of structured mapping events in accelerating and ensuring the quality of OSM contributions (HOT, 2024b).
Considering the observed impacts of organized mapping events on OSM data quality, it is therefore recommended that the intended purpose of creating OSM data to support IbF in Sudan is to create OSM data through organized mapping events. This way, data quality, including completeness, accuracy, and actuality, is ensured to be sufficient for the intended use, and the needs of data users can be addressed and included from the beginning of the mapping process. However, in conflict settings, we found that critical considerations of the ‘do-no-harm’ approach must be considered before deciding to map an area.
4.2 Impact of conflict escalation on OSM mapping tasks
Following the conflict escalation in Sudan in April 2023, mapping tasks underwent a significant shift (see Table 2). Prior to 2023, efforts primarily focused on environmental challenges, natural hazards, refugee crises—particularly from the Tigray region—and natural resource management. However, post-April-2023, the focus has moved strongly towards recent conflict-affected areas such as West Darfur, El Geneina, and Khartoum (HOT, 2024a).

Table 2. Comparison of OpenStreetMap (OSM) mapping task details before and after the escalation of conflict in April 2023.
This shift, led by organizations such as MSF and the Missing Maps initiative, reflects an urgent response to the need for geospatial data to meet the humanitarian needs arising from the conflict. As displacement and urban crises have intensified, mapping efforts have increasingly concentrated on urban areas, refugee camps, and other high-risk zones. These tasks increased frequency and focus of these tasks highlight the vital role of OSM mapping in addressing the evolving humanitarian challenges in the conflict context in Sudan.
4.3 Challenges
Meier and Leaning (2009) argue that two significant challenges in conflict zones are access and security (Meier and Leaning, 2009). This statement aligns with the respondents’ views, who identified both these challenges and other significant challenges of mapping in conflict settings, such as political restrictions or the lack of governance due to protracted crisis. First, Meier and Leaning (2009) further argue that people’s access to the Internet or other Information and Communication Technology (ICT) is often limited due to a lack of infrastructure, political reasons, or limited economic development. This argument was confirmed for Sudan by the International Telecommunication Union (ITU), which found significant limitations of Sudanese households accessing telecommunications (ITU, 2021). This further aligns with the argument of interviewees, stating that majority of the Sudanese population is limited in participating in online data generation. Second, the authors argue that security is a significant issue of ICT and data collection in crisis settings. This statement has been supported by interviewees who stated that the security of mappers in the field is a major concern of OSM mapping in conflict settings.
Hoogeveen and Pape (2020) highlight factors such as lack of funding and capacity to collect and analyse data, poor physical and ICT infrastructure quality, and potential mistrust or hostility by local communities as challenges to data collection in conflict settings (Hoogeveen and Pape, 2020). These statements align with findings from the interviews, where interviewees stressed the challenges of infrastructure as well as the importance of engaging local communities from the beginning to avoid or overcome aversion. Furthermore, a review of openly available datasets in Sudan revealed a significant lack of data provision by the Sudanese government. The most recent official datasets for roads, towns, rivers, and railways (Government of Sudan, 2014a, 2014b, 2014c, 2014d) date back to 2014, rendering the information too outdated for quality control of mapped OSM data through comparison. Meanwhile, the official websites of government agencies responsible for providing these datasets remain offline and inaccessible, further complicating efforts to obtain reliable, up-to-date geospatial information. In this case, global datasets can substitute the lack of information while highlighting the crucial lack of up-to-date geospatial data in Sudan and the essential role OSM can play in filling these gaps. For example, Figure 20 visually compares the Microsoft Building Footprint, generated using machine learning (ML), and the OSM building footprint, created during an organized mapping event published on 17. August 2023 (Missing Maps, 2023). This comparison highlights the accuracy and completeness of OSM data. The OSM buildings are mapped with much finer detail, and their footprints closely match the actual on-the-ground structures. In contrast, the ML-generated data demonstrates high completeness but lower spatial and feature accuracy. Notably, round-shaped buildings are poorly recognized by ML, while the OSM data represents them precisely. Additionally, tall buildings are identified primarily by their roofs by ML, resulting in an offset from the true on-the-ground footprint. This example underscores the high accuracy and detail that OSM data can achieve through organized mapping efforts.
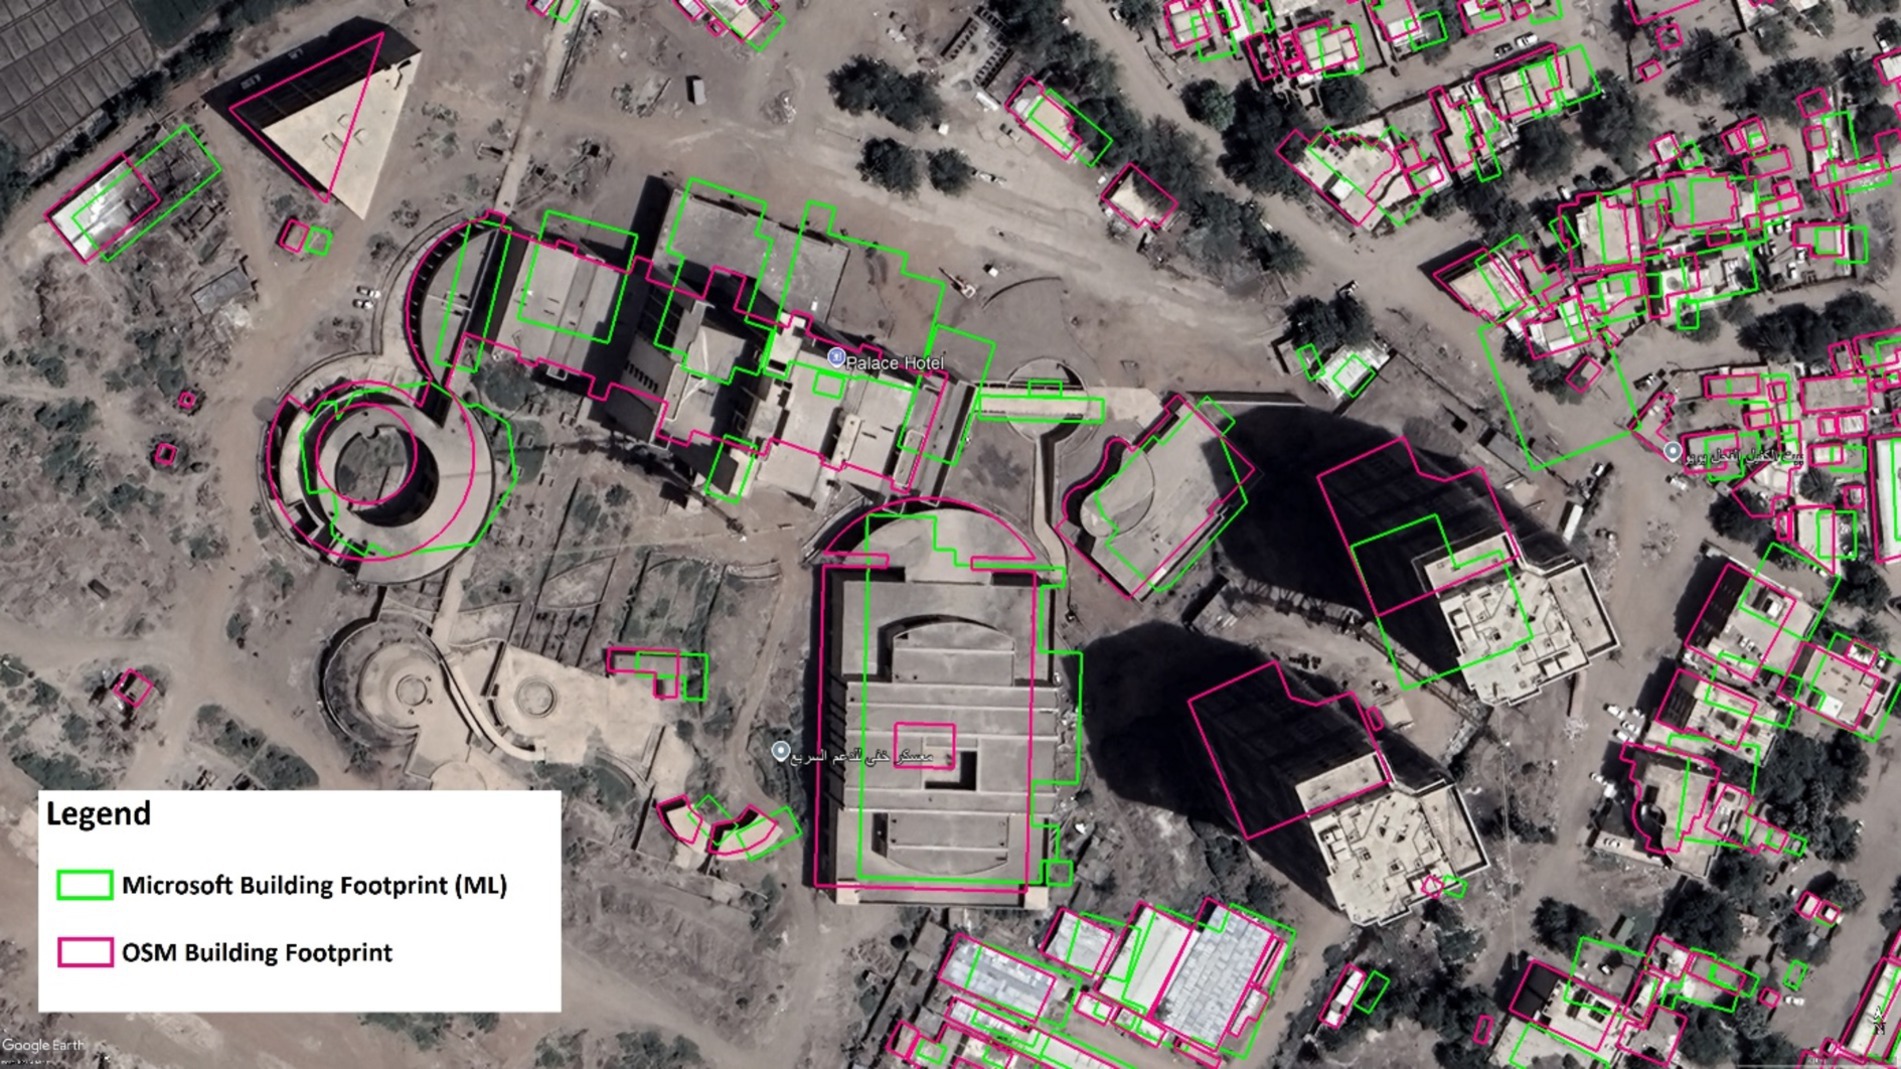
Figure 20. Comparison of Microsoft Building Footprint (green) and OpenStreetMap (OSM) building footprint (pink) (Location: 15°37′7.30”N, 32°31′20.60″E) mapped through the organized mapping event ‘Missing Maps: Khartoum, Sudan – North Khartoum’ (Missing Maps, 2023). Source: Own diagram; OSM data: (OSM Contributors, 2024); Microsoft Building Footprint: (Microsoft, 2024); Imagery: (Airbus, 2024).
Findings from our study show that OSM mapping provides potential solutions to some of the mentioned challenges. Challenges related to ICT infrastructure and the mistrust within local communities persist in OSM mapping, emphasizing the importance of including local Sudanese communities in the mapping process.
4.4 Ethical considerations
The example of Sudan has shown that ethical considerations in the context of conflict are diverse and challenging to address. Stottlemyre and Stottlemyre (2012) explored whether crowdsourced crisis mapping and Twitter postings could be considered military intelligence during the Libyan war. The authors conclude that some crisis mapping met the minimum criteria of military intelligence (Stottlemyre and Stottlemyre, 2012). Comparing those findings to the findings of the interviews in this study highlights one difference: OSM datasets are not continuously updated in real time but can only reflect information from the moment of creation. In the case of the Libyan war, military information (e.g., location of military personnel) was shared online in real time. OSM mapping allows the sharing of recent information, although its information is a snapshot of the past when mapping remotely, depending on the date of the imagery. Real-time information could be collected in situ but with at least some hours delay from collecting to uploading field data in OSM formats. Additionally, field data collection would not occur during periods of intense conflict due to ethical and security concerns, and therefore does not provide real-time information that could be utilized for military intelligence.
Mapping conflict-affected areas has often been avoided in general out of fear that data might cause harm and jeopardize the principle of impartiality. Interviewees are under the impression that while this is a valid concern, on a technical side, the military (in this case, it refers to the official armed forces of a country) has overall already higher quality data in terms of accuracy, granularity, and actuality, and knowledge of the area than OSM mapping could provide. However, each location and potential mapping task must be assessed carefully and discussed with experts of local knowledge to identify potential harm and minimize possible negative effects (Chamales and Baker, 2011). Recent changes in the trends of OSM mapping in Sudan caused by the escalation of conflict in April 2023 could provide valuable insights and a potential applied use case of the role of OSM mapping in complex crisis contexts, particularly when conflict and climate-related hazards overlap.
The ethical considerations raised by the interviewees align with recent discussions of the Humanitarian OpenStreetMap Team (HOT) on data ethics and security of OSM mapping in a conflict context. HOT stated that context and risks must be analysed prior to data collection in all cases, also in peaceful locations, to ensure consideration and mitigation of potential negative data use. However, the potential risks and required mitigation strategies are amplified in conflict. HOT is currently working towards strengthening its data protection policy and toolkit, including tackling issues of mapping in conflict context, which aims to provide support to navigate data collection in conflict context in the future safely (Uithol et al., 2022). This approach aligns with Mena (2023), emphasizing that disaster risk in a conflict context must be mitigated but under vital considerations of the ‘do-no-harm’ principles (Mena, 2023). Contrary to the risks, interviewees mentioned that mapping in conflict areas can provide opportunities to improve accountability. By mapping critical infrastructure (e.g., schools, hospitals), their location is publicly documented, avoiding the potential argument that they were ‘accidentally’ attacked due to an unknown location.
Interviewees stressed that when working with open mapping data, it is crucial always to consider geographical inequalities in crowdsourced datasets and be aware that they only represent a selective representation of the truth. This argument aligns with Schradie’s (2011) conclusion in his study on the digital divide, stating that views and perspectives of those with access to information technologies are overrepresented while the voices of those without are left out (Schradie, 2011). This corresponds with findings on challenges in Sudan due to the low internet access (ITU, 2021). There will always be technologically disconnected communities and people who are left off the map, and it is essential to ensure that those in need are considered and receive the services they require (Zook et al., 2010).
4.5 Opportunities and impacts of OSM mapping in Sudan
Findings from our interviews highlighted that open data such as OSM allows communities to engage, get involved, maintain data, or ideally, own the process and engage in mapping what is essential and of value to them. This aligns with the approach of ‘people-centred DRR’ described by Hicks et al. (2019). In this approach, it is the goal to empower people through tools such as OSM to improve long-term preparedness and development owned by themselves (Hicks et al., 2019). OSM mapping in Sudan can empower communities and state their existence on the maps of this world. However, the digital divide and poor infrastructure still hinder a large proportion of the population from actively contributing (ITU, 2021; Meier and Leaning, 2009). While Interviewees described the imbalance of overrepresentation of men as OSM contributors, OSM holds the opportunity to be a powerful tool in the hands of women (Hagen, 2017). Interviewees stressed that it is essential to provide women more opportunities to participate, support skills training and infrastructure development, and engage local communities by raising awareness of the power and influence mapping processes can have. One great opportunity currently arising is the establishment of a student-led Youth Mappers chapter in Sudan. Universities and students will participate and focus mapping efforts within their own country (Mutwalli, 2021).
As a key element for IbF, OSM data can be leveraged as a crucial input dataset for exposure and risk analysis to determine the percentage of assets and elements (critical infrastructure, agricultural land, etc.) exposed to climate-related and other hazards. For example, the custom hazard monitoring and early warning system PhilAWARE, was developed to support disaster preparedness in the Philippines. It combines hazard information, alerts, and OSM data for exposure to support disaster awareness and operational decision-making. Through its use in PhilAWARE, OSM data has proven its suitability in filling data gaps, building local capacity, and effectively supporting early actions to disasters in the Philippines (Houstan et al., 2021). For direct application, the open-source GIS software QGIS provides various plugins (e.g., ‘OSM Downloader’, ‘Quick OSM’) to import OSM data and integrate it into a geospatial analysis (QGIS, 2023). The InaSafe PlugIn, for example, allows for conducting exposure and impact analysis in QGIS, using OSM data as an input dataset. While the example from the Philippines is focused on DRR and natural hazards alone, exposure analysis of vulnerable populations proves especially crucial in changing environments of conflict settings. For example, populations displaced by violent conflict often settle within areas prone to climate-related hazards such as floods, as these lands are usually available and unclaimed. Figure 21 shows an example of a flood exposure analysis of the Wad Sherifey Refugee Settlement in the east of Sudan, which is home to many refugees displaced by conflict (UNHCR, 2021). The OSM building footprint used in the analysis was remotely mapped through organized mapping events (Missing Maps, 2021a). This information can identify the number and location of exposed buildings to inform IbF models.
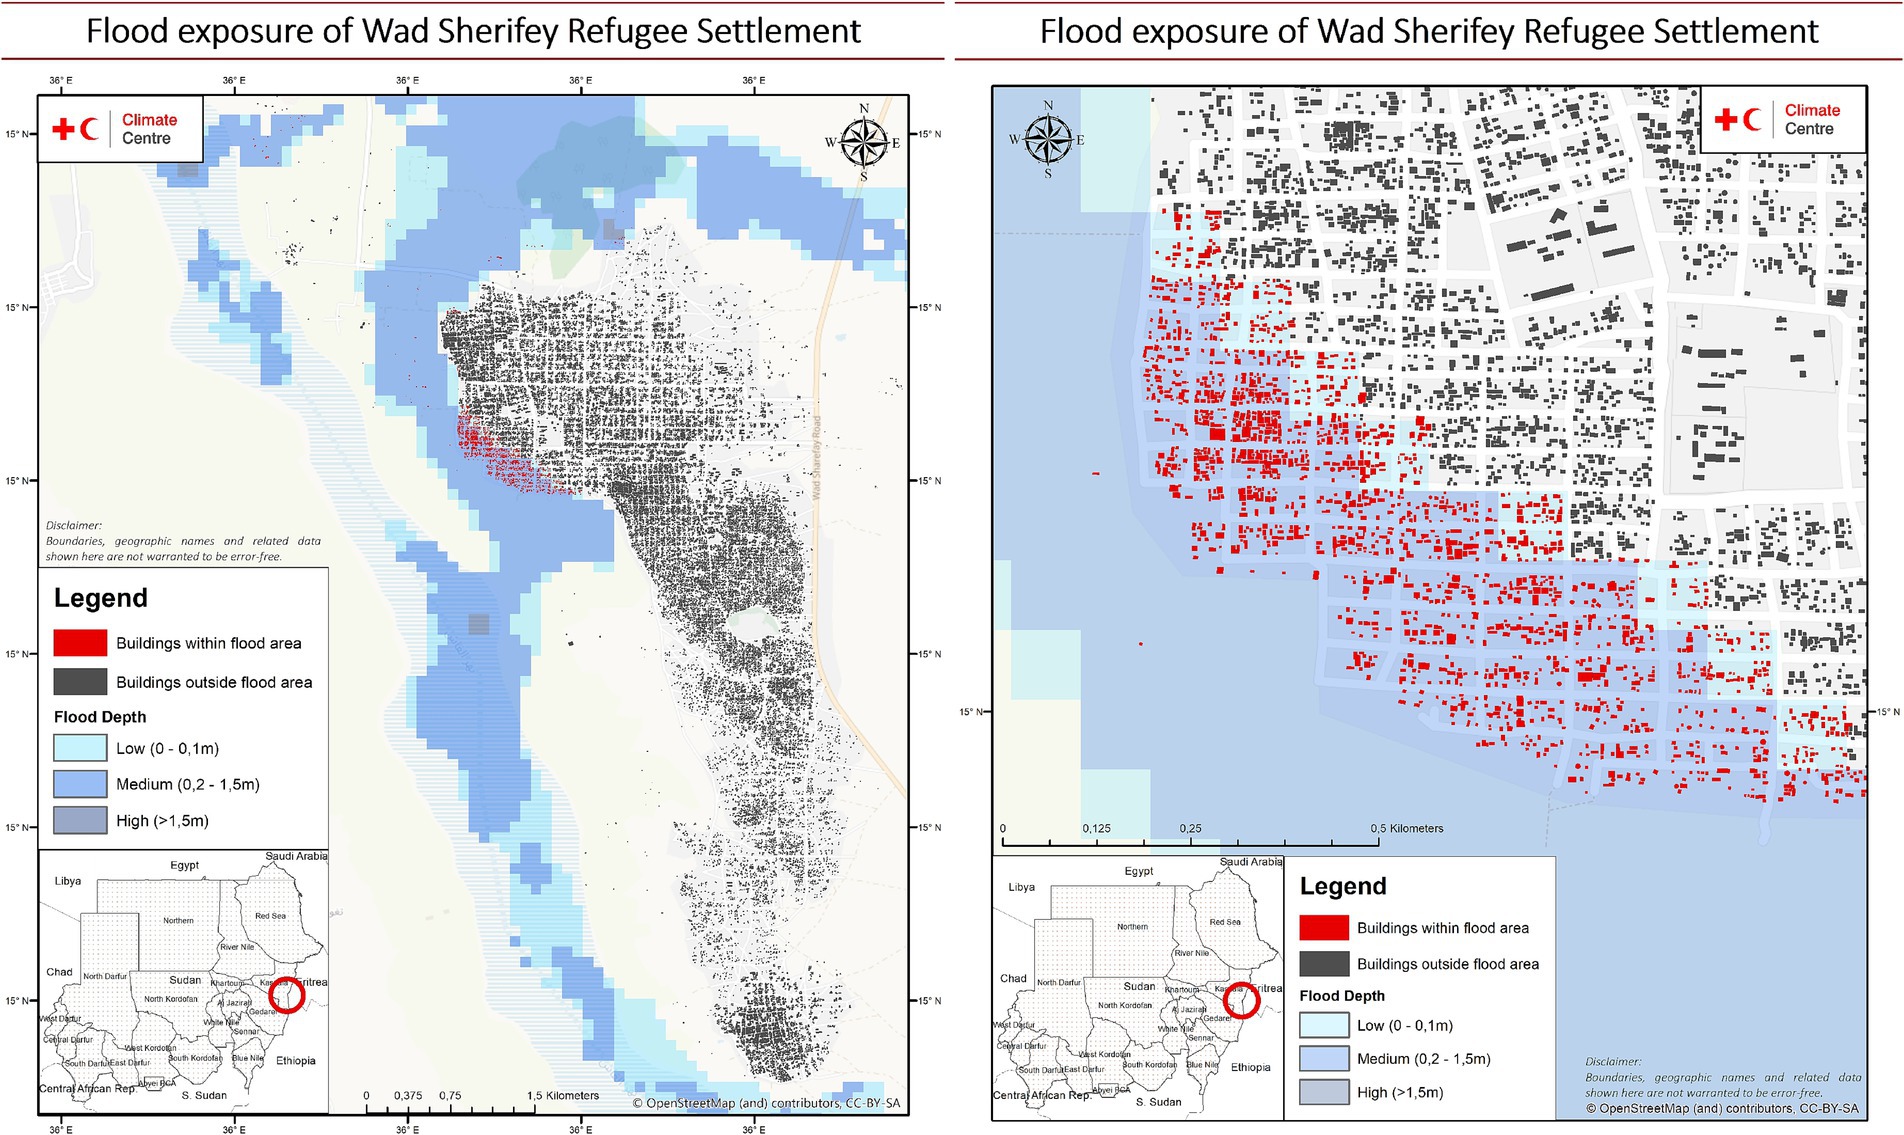
Figure 21. Flood exposure analysis of the Wad Sherifey Refugee Settlement in the east of Sudan, which is home to many refugees displaced by conflict (UNHCR, 2021). The OpenStreetMap (OSM) building footprint used in the analysis was remotely mapped through organized mapping events (Missing Maps, 2021a), supported by Médecins Sans Frontières (MSF) and hosted by the Red Cross Red Crescent Climate Centre and Netherland Red Cross Missing Maps Team in November 2021. Source: Diagram: (Red Cross Red Crescent Climate Centre, 2021); Flood hazard data: (“FATHOM,”, 2021); Building footprint: (OSM Contributors, 2021).
A further example of the technical use of OSM data is to create scenarios and visualizations. OSM building footprints and other feature data can be used to generate three-dimensional (3D) visualizations of the built environment and model flood exposure or other climate-related hazard scenarios.
5 Conclusion
This research investigated the potential of using OpenStreetMap (OSM) data in the intersection of climate risks and conflict settings to understand the exposure and vulnerabilities of Sudan’s most vulnerable population groups, such as refugees or IDPs displaced by violent conflict, to climate-related hazards. Despite inherent challenges in utilizing OSM in conflict-affected areas, our study concludes that OSM mapping is a suitable tool to close crucial data gaps and enable IbF for climate-related hazards in Sudan and places with similar settings. The emergence of digital humanitarianism has opened up new possibilities to enhance decision-making processes, enable IbF in data-scarce areas, and support Early Warning Early Action. However, the complexities of operating in conflict settings require careful attention to both the needs of data users and producers of OSM data. Despite these challenges, the pressing lack of geospatial data coupled with the urgent need to understand the exposure of vulnerable populations to climate-related hazards in the face of the escalated conflict highlights the usability of OSM as a pivotal tool for actively mapping OSM data to fill these crucial data gaps in the maps of Sudan.
Overall, we suggest the following
1. In Sudan, as in other countries affected by conflict, prioritization of efforts for Early Warning Early Action is crucial. To ensure the optimal use of resources, defining specific OSM data needs to be collected either remotely or through field mapping is recommended. Communication between OSM producers and OSM users to create the most useful OSM data is a key step when planning and implementing mapping efforts.
2. Further developing methods to use geospatial data to identify and prioritize unmapped, high-risk areas in the context of climate-related hazards in Sudan. This would improve IbF and support disaster risk management agencies to prioritize where to deploy early action support for the most vulnerable groups, such as refugees or IDPs displaced by violent conflict Setting the definition of ‘high-risk areas’ needs to be carried out in close collaboration with the end-users of created OSM mapping data.
3. Community leadership through mapping, once a specific location and task is set, can be supported through organized mapping events. Community inclusion and community mapping are essential during and after the remote mapping process. Raising awareness of local communities in Sudan on how to engage and use their data is necessary to counteract the digital divide and empower communities.
4. To understand the country and local context, it is essential to consult experts with country-specific and local knowledge when areas are prioritized for mapping on a national level. This ensures that data limitations and current and future trends are captured and included in the decision of where to focus mapping efforts.
5. Ethical considerations must be assessed, including potential military use, security of mappers in the field, mapping permission by the government or parties to the conflict, data access, and gender inclusion. This requires triangulation and consulting organizations with country experience and local actors with in-depth local knowledge of the areas concerned.
6. It is essential to strengthen collaboration with imagery providers since the lack of accessible, up-to-date, and high-resolution imagery is a significant hurdle in initiating mapping efforts in conflict settings. Providers of high-resolution imagery access need to be included in the mapping process along with highlighting the cause, positive impacts, and ethical considerations taken in mapping efforts.
7. Analysis of OSM data quality has shown that it is very high in areas that have been mapped through organized mapping and validation events. Therefore, it is recommended to create crucial OSM mapping data through organized volunteered mapping events (e.g., Mapathons).
8. Conduct follow-up research to explore the complex interplay between the recent surge in OSM mapping activities in Sudan and the escalation of conflict in April 2023. This research should investigate the impacts of the newly mapped geospatial data on the humanitarian response and assess whether the principles of “do-no-harm” were adhered to in the process.
Data availability statement
The raw data supporting the conclusions of this article will be made available by the authors, without undue reservation.
Ethics statement
Ethical approval was not required for the studies involving humans because conducting voluntarily key-informant interviews about the participants’ opinions on the topic with pre-obtained written consent did not provide any foreseeable risk of harm or discomfort to the participants. Participants were informed that given consent to participate can be revoked without reason anytime before, during or after the interviews. Only non-identifiable data records were collected. The studies were conducted in accordance with the local legislation and institutional requirements. The participants provided their written informed consent to participate in this study.
Author contributions
CS: Writing – original draft, Writing – review & editing. CJ: Writing – original draft, Writing – review & editing. ER: Writing – review & editing. EC: Writing – review & editing. MA: Writing – review & editing.
Funding
The author(s) declare financial support was received for the research, authorship, and/or publication of this article. Funds for this research and publications fees were provided by the Danish Red Cross funded by the Danish Minister of Foreign Affairs.
Conflict of interest
The authors declare that the research was conducted in the absence of any commercial or financial relationships that could be construed as a potential conflict of interest.
Publisher’s note
All claims expressed in this article are solely those of the authors and do not necessarily represent those of their affiliated organizations, or those of the publisher, the editors and the reviewers. Any product that may be evaluated in this article, or claim that may be made by its manufacturer, is not guaranteed or endorsed by the publisher.
Supplementary material
The Supplementary material for this article can be found online at: https://www.frontiersin.org/articles/10.3389/fclim.2024.1439940/full#supplementary-material
References
ACLED (2024). Armed Conflict Location & Event Data [WWW document]. Available at: https://acleddata.com/
Airbus (2024). Satellite image. Retrieved from Google Earth Pro [WWW Document]. Available at: https://earth.google.com/intl/earth/versions/ (Accessed September 21, 2024).
Braun, V., and Clarke, V. (2006). Using thematic analysis in psychology. Qual. Res. Psychol. 3, 77–101. doi: 10.1191/1478088706qp063oa
Chamales, G., and Baker, R. (2011). Securing crisis maps in conflict zones, In: 2011 IEEE Global Humanitarian Technology Conference. IEEE, pp. 426–430.
CNES & Airbus (2024). Satellite image. Retrieved from Google Earth Pro [WWW Document]. Available at: https://earth.google.com/intl/earth/versions/ (Accessed September 21, 2024).
Coughlan De Perez, E., Van Den Hurk, B., Van Aalst, M. K., Jongman, B., Klose, T., and Suarez, P. (2015). Forecast-based financing: an approach for catalyzing humanitarian action based on extreme weather and climate forecasts. Nat. Hazards Earth Syst. Sci. 15, 895–904. doi: 10.5194/nhess-15-895-2015
De Albuquerque, J. P., Herfort, B., and Eckle, M. (2016). The tasks of the crowd: a typology of tasks in geographic information crowdsourcing and a case study in humanitarian mapping. Remote Sens. 8:859. doi: 10.3390/rs8100859
EM-DAT (2024). Emergency Events Database [WWW Document]. Available at: https://www.emdat.be/ (accessed 9.2.24).
FAO (2024). AQUASTAT [WWW Document]. Available at: https://data.apps.fao.org/aquamaps/?lang=en (accessed 9.7.24).
FATHOM (2021). Sudan - Flood Hazard Data (1 in 20 years return period). Available at: https://www.fathom.global/product/global-flood-map/ (accessed 8.28.24).
Forghani, M., and Delavar, M. R. (2014). A quality study of the openstreetmap dataset for Tehran. ISPRS Int J Geoinf 3, 750–763. doi: 10.3390/ijgi3020750
Givoni, M. (2016). Between micro mappers and missing maps: digital humanitarianism and the politics of material participation in disaster response. Environ Plan D 34, 1025–1043. doi: 10.1177/0263775816652899
Goodchild, M. F., and Li, L. (2012). Assuring the quality of volunteered geographic information. Spat Stat 1, 110–120. doi: 10.1016/j.spasta.2012.03.002
Government of Sudan (2014a). Sudan Railway [WWW Document]. Available at: https://geoportal.icpac.net/layers/data0:geonode:railway (accessed 9.7.24).
Government of Sudan (2014b). Sudan Rivers [WWW Document]. Available at: https://geoportal.icpac.net/layers/data0:geonode:rivers (accessed 9.7.24).
Government of Sudan (2014c). Sudan Main Roads [WWW Document]. Available at: https://geoportal.icpac.net/layers/data0:geonode:main_roads_2 (accessed 9.7.24).
Government of Sudan (2014d). Sudan Main towns [WWW Document]. Available at: https://geoportal.icpac.net/layers/data0:geonode:main_towns (accessed 9.7.24).
GRC, Climate Centre, IFRC (2020). Forecast-based Financing Manual [WWW Document]. Available at: https://manual.forecast-based-financing.org/ (accessed 6.16.20).
Haklay, M. (2010). How good is volunteered geographical information? A comparative study of OpenStreetMap and ordnance survey datasets. Environ. Plann. B. Plann. Des. 37, 682–703. doi: 10.1068/b35097
Haklay, M., Basiouka, S., Antoniou, V., and Ather, A. (2010). How many volunteers does it take to map an area well? The validity of Linus’ law to volunteered geographic information. Cartogr. J. 47, 315–322. doi: 10.1179/000870410X12911304958827
Harrowsmith, M., Nielsen, M., Jaime, C., Sanchez, M. C., Uprety, M., Coughlan de Perez, E., et al. (2020). The future of forecast: Impact based forecasting for early action. Red Cross Red Crescent Climate Centre. doi: 10.13140/RG.2.2.12366.89920
HDX (2019). Health Facilities in Sub-Saharan Africa [WWW Document]. Available at: https://data.humdata.org/dataset/health-facilities-in-sub-saharan-africa (accessed 9.7.24).
HeiGIT (2024a). Ohsome - OSM History Analyzer - Heidelberg Institute for Geoinformation Technology [WWW Document]. Available at: https://dashboard.ohsome.org/ (accessed 9.12.24).
HeiGIT (2024b). ohsomeNow Stats - HeiGIT (Heidelberg Institute for Geoinformation Technology) [WWW Document]. Available at: https://stats.now.ohsome.org (accessed 9.15.24).
Hicks, A., Barclay, J., Chilvers, J., Armijos, M. T., Oven, K., Simmons, P., et al. (2019). Global mapping of citizen science projects for disaster risk reduction. Front. Earth Sci. 7:226. doi: 10.3389/feart.2019.00226
Hoogeveen, J., and Pape, U. (2020). “Fragility and innovations in data collection,” in Data collection in fragile states. eds. J. Hoogeveen and U. Pape (Cham: Palgrave Macmillan). doi: 10.1007/978-3-030-25120-8_1
HOT (2022). Disaster services - Humanitarian OpenStreetMap Team (HOT) [WWW Document]. Available at: https://www.hotosm.org/disaster-services/project_activations.html (accessed 7.23.21).
HOT (2024a). Activation Overview tool - Humanitarian OpenStreetMap Team (HOT) [WWW Document]. Available at: https://jarmokivekas.github.io/hotosm-collate/app/about (accessed 9.16.24).
HOT (2024b). OSM Tasking Manager - Humanitarian OpenStreetMap Team (HOT) [WWW Document]. Available at: https://tasks.hotosm.org/ (accessed 9.14.24).
Houstan, S., Lorenz, K., Redhead, C., and Lohr, S. (2021). Capturing opportunities for OpenStreetMap data to better support anticipatory action [WWW document]. Anticipation Hub. https://www.anticipation-hub.org/news/capturing-opportunities-for-openstreetmap-data-to-better-support-anticipatory-action/ (accessed 4.15.21).
ICPAC (2024). IGAD Climate Prediction and Applications Centre - Geoportal [WWW Document]. Available at: https://geoportal.icpac.net/ (accessed 9.7.24).
ICRC (2020). When rain turns to dust. Conflicts and the climate to the combined impact of armed understanding and responding and environment crisis on people’s lives.
InaSAFE (2023). InaSAFE - Home [WWW Document]. Available at: https://inasafe.org/ (accessed 12.19.23).
IOM (2023). Sudan - Displacement tracking matrix [WWW Document]. Available at: https://dtm.iom.int/sudan (accessed 12.23.23).
IOM (2024). DTM Sudan Mobility Update (07) [WWW Document]. Available at: https://dtm.iom.int/reports/dtm-sudan-mobility-update-07?close=true (accessed 9.20.24).
ITU (2021). Digital trends in the Arab states region 2021 : International Telecommunication Union (ITU). Available at: http://handle.itu.int/11.1002/pub/8184d626-en
Kanthi, N. S., and Purwanto, T. H. (2016). Application of OpenStreetMap (OSM) to support the Mapping Village in Indonesia. IOP Conf. Ser. Earth Environ. Sci. 47:012003. doi: 10.1088/1755-1315/47/1/012003
Maxar (2021). Earth Intelligence & Space Infrastructure [WWW Document]. Available at: https://www.maxar.com/ (accessed 6.30.21).
Meier, P., and Leaning, J. (2009). Applying technology to crisis mapping and early warning in humanitarian settings. Harvard Humanatarian Initiative Working Paper Series 1, 1–10.
Mena, R. (2023). Advancing “no natural disasters” with care: risks and strategies to address disasters as political phenomena in conflict zones. Disaster Preven. Manag. Int. J. 32, 14–28. doi: 10.1108/DPM-08-2023-0197
Microsoft (2024). Microsoft Building Footprints [WWW Document]. Available at: https://planetarycomputer.microsoft.com/dataset/ms-buildings (accessed 9.7.24).
Missing Maps (2021a). Missing Maps: MSF/RCRC, updating buildings in Wad Sherifey refugee camp, Sudan [WWW Document]. Available at: https://tasks.hotosm.org/projects/11685 (accessed 9.22.24).
Missing Maps (2021b). Missing Maps: MSF/RCRC buildings in Kassala, Sudan [WWW Document]. Available at: https://tasks.hotosm.org/projects/11682 (accessed 9.20.24).
Missing Maps (2023). Missing Maps: Khartoum, Sudan - North Khartoum [WWW Document]. Available at: https://tasks.hotosm.org/projects/15351 (accessed 9.20.24).
Missing Maps (2024). Missing Maps [WWW Document]. Available at: https://www.missingmaps.org/ (accessed 9.9.24).
Mohamed, M. S. D. (2006). Mapping and assessment of land use / land cover using remote sensing and GIS in North Kordofan state. Sudan Mohamed Salih: Dafalla.
Mohyeldeen, S. (2021). The Egypt-Sudan border: a story of unfulfilled promise - Carnegie endowment for international peace [WWW document]. Carnegie Middle East Center. Available at: https://carnegie-mec.org/2020/06/11/egypt-sudan-border-story-of-unfulfilled-promise-pub-81995 (accessed 6.30.21).
Mooney, P., Rehrl, K., and Hochmair, H. (2013). Action and interaction in volunteered geographic information: a workshop review. J. Locat. Based Serv. 7, 291–311. doi: 10.1080/17489725.2013.859310
Moradi, M., Roche, S., and Mostafavi, M. A. (2022). Exploring five indicators for the quality of OpenStreetMap road networks: a case study of Québec, Canada. Geomatica 75, 178–208. doi: 10.1139/geomat-2021-0012
MSF (2024). Mapping El Geneina, a flashpoint in the Sudan conflict - Médecins Sans Frontières [WWW Document]. Available at: https://www.doctorswithoutborders.org/latest/mapping-el-geneina-flashpoint-sudan-conflict (accessed 9.17.24).
Mutwalli, M. (2021). Governance programming overseas establishing YouthMappers chapter in Sudan [WWW document]. 500 words magazine. Available at: https://500wordsmag.com/science-and-technology/technology/governance-programming-overseas-establishing-youthmappers-chapter-in-sudan/ (accessed 7.22.21).
Neis, P., and Zielstra, D. (2014). Recent developments and future trends in volunteered geographic information research: the case of OpenStreetMap. Future Internet 6, 76–106. doi: 10.3390/fi6010076
Nzau, Mumo (2024). Politics and conflict in the republic of Sudan: a brief retrospective commentary.
OCHA (2021). The state of open humanitarian data 2021: Assessing Data Availability Across Humanitarian Crises. The Hague, Netherlands: United Nations Office for the Coordination of Humanitarian Affairs.
OCHA (2024). Sudan Humanitarian Needs and Response Plan 2024 [WWW Document]. Available at: https://reliefweb.int/report/sudan/sudan-humanitarian-needs-and-response-plan-2024-december-2023?_gl=1*13fz00m*_ga*MTQ4MTQ1ODQwMy4xNzI0MDcxMDg0*_ga_E60ZNX2F68*MTcyNjc3NzM5NC4yLjAuMTcyNjc3NzM5NC42MC4wLjA (accessed 9.20.24).
OCHA Sudan (2020). Sudan: Settlements [WWW Document]. Available at: https://data.humdata.org/dataset/sudan-settlement-26-july-2020 (accessed 9.7.24).
OSM Contributors (2021). OpenStreetMap [WWW Document]. Available at: https://www.openstreetmap.org/#map=5/16.474/27.510 (accessed 6.30.21).
OSM Contributors (2022). OpenStreetMap [WWW Document]. Available at: https://www.openstreetmap.org/#map=5/16.474/27.510 (accessed 12.23.22).
OSM Contributors (2024). OpenStreetMap [WWW Document]. Available at: https://www.openstreetmap.org/#map=5/17.91/26.46 (accessed 9.21.24).
OSMstats (2024). Edits of Sudan (by Pascal Neis) [WWW Document]. Available at: https://osmstats.neis-one.org/?item=countries&country=Sudan (accessed 9.15.24).
Political Geography Now (2012). Map: Sudan & South Sudan’s Disputed Territories - Political Geography Now [WWW Document]. Available at: https://www.polgeonow.com/2012/05/feature-sudan-south-sudan-border_26.html (accessed 6.30.21).
QGIS (2023). QGIS - A Free and Open Source Geographic Information System [WWW Document]. Available at: https://www.qgis.org/en/site/ (accessed 12.21.23).
Radio Dabanga (2016a). Rains in Sudan leave at least 17 dead [WWW Document]. Available at: https://www.dabangasudan.org/en/all-news/article/rains-in-sudan-leave-at-least-17-dead (accessed 8.4.21).
Radio Dabanga (2016b). Five children die in South Darfur camp deluge [WWW Document]. Available at: https://www.dabangasudan.org/en/all-news/article/five-children-die-in-south-darfur-camp-deluge (accessed 8.4.21).
Raju, E., Boyd, E., and Otto, F. (2022). Stop blaming the climate for disasters. Commun. Earth Environ. 3, 21–22. doi: 10.1038/s43247-021-00332-2
Red Cross Red Crescent Climate Centre (2021). Flood exposure analysis of the wad Sherifey refugee settlement. Sudan: Kassala.
Sauerhammer, L., Schillinger, J., Bolte, P., and Peters, L. (2024). Navigating fragility, conflict and violence to strengthen community resilience. Available at: https://preparecenter.org/resource/navigating-fcv-drr-handbook/.
Scholz, S., Knight, P., Eckle, M., Marx, S., and Zipf, A. (2018). Volunteered geographic information for disaster risk reduction-the missing maps approach and its potential within the red cross and red crescent movement. Remote Sens. 10:1239. doi: 10.3390/rs10081239
Schradie, J. (2011). The digital production gap: the digital divide and web 2.0 collide. Poetics 39, 145–168. doi: 10.1016/j.poetic.2011.02.003
Sinclair-Maragh, G., and Simpson, S.B. (2021). Heritage tourism and ethnic identity: a deductive thematic analysis of Jamaican maroons.
Skovdal, M., and Cornish, F. (2015). Qualitative research for development, Qualitative Research for Development: a guide for practitioners.
Stottlemyre, Steve, and Stottlemyre, Sonia, (2012). Crisis mapping intelligence information during the Libyan civil war: an exploratory case study.
Uithol, P., Pechmann, J., Benton, I.B., and Rehamtula, S.M. (2022). Mapping in conflict [WWW document]. Humanitarian OpenStreetMap Team. Available at: https://www.hotosm.org/updates/mapping-in-conflict/ (accessed 12.21.23).
UNEP/GRID-Geneva (2024). Map X - Sudan [WWW Document]. Available at: https://app.mapx.org/?project=MX-M5H-L8I-1AL-ZSQ-HXD&theme=color_light&language=en (accessed 9.7.24).
UNHCR (2021). Sudan - Refugee camps [WWW Document]. Available at: https://data.humdata.org/dataset/unhcr-refugee-camps (accessed 12.23.23).
UNHCR (2023). Overview of refugees and asylum seekers distribution and Internal Movement in Sudan [WWW Document]. Available at: https://data.unhcr.org/en/documents/details/102315 (accessed 12.19.23).
UN-SPIDER (2024). Office for Outer Space Affairs UN-SPIDER Knowledge Portal - Institutions [WWW Document]. Available at: https://www.un-spider.org/links-and-resources/institutions?title=&body_value=&taxonomy_vocabulary_45_target_id=Sudan+%28546%29 (accessed 9.22.24).
USGS (2021). EarthExplorer [WWW Document]. Available at: https://earthexplorer.usgs.gov/ (accessed 6.30.21).
WFP (2021). Sudan - Roads. World Food Programme (WFP) [WWW Document]. Available at: https://data.humdata.org/dataset/sudan-road-network (accessed 9.7.24).
WMO (2021). Guidelines on multi-hazard impact-based forecast and warning services part II: Putting multi-hazard IBFWS into practice. Geneva: World Meteorological Organization (WMO).
World Bank Climate Change Knowledge Portal (2021). [WWWDocument]. Available at: https://climateknowledgeportal.worldbank.org/country/sudan (Accessed June 7, 2024).
Keywords: OpenStreetMap, climate-related hazards, compound risks, anticipatory action, impact-based forecasting, Early Warning Early Action, conflict, displacement
Citation: Scholz C, Jaime C, Raju E, Coughlan De Perez E and van Aalst M (2024) Off the grid: utilizing OpenStreetMap for early warning and early action in conflict settings in Sudan. Front. Clim. 6:1439940. doi: 10.3389/fclim.2024.1439940
Edited by:
Jamon Van Den Hoek, Oregon State University, United StatesReviewed by:
Susanne Melde, International Organization for Migration, BelgiumAlessandro Sarretta, National Research Council (CNR), Italy
Copyright © 2024 Scholz, Jaime, Raju, Coughlan De Perez and van Aalst. This is an open-access article distributed under the terms of the Creative Commons Attribution License (CC BY). The use, distribution or reproduction in other forums is permitted, provided the original author(s) and the copyright owner(s) are credited and that the original publication in this journal is cited, in accordance with accepted academic practice. No use, distribution or reproduction is permitted which does not comply with these terms.
*Correspondence: Cornelia Scholz, c2Nob2x6QGNsaW1hdGVjZW50cmUub3Jn
 Cornelia Scholz
 Catalina Jaime
 Emmanuel Raju
 Erin Coughlan De Perez
 Maarten van Aalst