 Ariel L. Morrison
 Debanjali Pathak2
 James W. Hurrell
94% of researchers rate our articles as excellent or good
Learn more about the work of our research integrity team to safeguard the quality of each article we publish.
Find out more
ORIGINAL RESEARCH article
Front. Clim., 27 September 2024
Sec. Climate Action
Volume 6 - 2024 | https://doi.org/10.3389/fclim.2024.1426679
Introduction: Rapid reductions in Arctic sea ice in response to warming have led to increased interest in using the Arctic Ocean for commercial shipping. As the world warms, however, different strategies are being considered to stabilize or reduce surface temperatures in order to prevent critical climate change impacts. One such strategy is stratospheric aerosol injection (SAI), a form of solar climate intervention. Projected changes to Arctic sea ice under SAI with specific regards to shipping have not yet been assessed.
Methods: We compare output from two SAI simulations that have different global mean temperature targets with a non-SAI control simulation to provide the first assessment of Arctic Ocean navigability under potential SAI scenarios.
Results: We find that sea ice concentration and thickness quickly stabilize or increase after SAI deployment. When sea ice thickness stabilizes in response to SAI, the number of days when the Arctic Ocean is navigable remains fairly constant, but increasing sea ice thickness leads to reduced navigability compared to the non-SAI simulation. From 2035-2069, both the Northwest Passage and Northern Sea Route are accessible from July-November in all three simulations, but there are no navigable routes under either SAI scenario from April-June. When the Arctic is navigable, it can take 2-12 days longer to cross the Arctic Ocean in the SAI simulations than in the non-SAI control simulation, and there are large year-to-year variations in travel time.
Discussion: Overall, Arctic shipping may take longer and be more difficult in an SAI vs a non-SAI world because of relatively thicker sea ice, but the degree to which Arctic shipping may change in response to SAI is dependent on the particular climate intervention strategy.
Since the satellite record began, the Arctic has warmed nearly four times faster than the global average (Rantanen et al., 2022). As a result, sea ice is rapidly disappearing: since 1979, September sea ice extent has declined by nearly 50% (Parkinson and Digirolamo, 2021), summer sea ice volume has decreased by approximately 75% (Notz and Stroeve, 2018), and the past 15 years have seen the 15 lowest September sea ice extents on record (Meier and Stroeve, 2022). The Arctic Ocean is projected to be ice-free in September by 2050 (Notz and SIMIP Community, 2020). With the opening of the Arctic Ocean comes increased interest in commercial shipping between Atlantic and Pacific ports and increased interest in predicting when potential shipping routes may be open.
The strong interest in determining when and where the Arctic Ocean may be accessible for shipping stems from the relative distance covered by Arctic vs. lower-latitude routes. There are three general routes across the Arctic Ocean: the Northwest Passage (NWP), Transpolar Sea Route (TSR), and Northern Sea Route (NSR). Using the NSR to travel between London and Yokohama is 7,750 km shorter than via the Suez Canal and 13,950 km shorter than around the Cape of Good Hope (Schøyen and Bráthen, 2011). Similarly, traveling between New York City and Yokohama using the NWP is 3,060 km shorter than through the Panama Canal (Somanathan et al., 2009). Depending on a ship’s speed, using the Arctic Ocean instead of lower-latitude routes could save up to 14–20 travel days, translating to substantial cost savings (Lasserre, 2014).
Despite recent sea ice loss, the Arctic Ocean is still not commonly used for shipping because sea ice is not consistently thin enough for safe travel. When determining optimal routes across the Arctic, sea ice thickness and age are crucial concerns. A survey of 14 ice-class ship captains found that detecting and avoiding multi-year ice were the key issues for improving ship transportation across the high Arctic Ocean (Timco et al., 2005), and captains are likely to avoid multi-year ice even if it adds time and distance to the trip. Traversing thinner ice is faster and uses less fuel than breaking through thick ice, which reduces total trip costs (Schröder et al., 2017).
As the world continues to warm, it is becoming less likely that we will meet the Paris Agreement goal of keeping global mean temperatures below 1.5°C above pre-industrial levels (Matthews and Wynes, 2022; United Nations Environment Programme, 2023). Stratospheric aerosol injection (SAI) is a form of solar climate intervention that has been proposed as a way to stabilize global temperatures by blocking some incoming sunlight through the injection of highly reflective particles into the upper atmosphere (National Academies of Sciences, Engineering, and Medicine, 2021). If deployed, SAI could possibly prevent further sea ice loss and lead to sea ice recovery due to its effect on temperature (Notz and Stroeve, 2018).
Previous studies on SAI’s impact on Arctic sea ice show varying effects (Duffey et al., 2023). September sea ice almost disappears in the GeoMIP G3 and G4 scenarios despite reductions in Arctic temperature trends because the Arctic remains 3–4°C warmer than pre-industrial (Berdahl et al., 2014). In simulations with variable injection altitudes, annual mean sea ice loss slowed under SAI but did not completely stop (Jones et al., 2018). More recently, in the Geoengineering Large Ensemble [GLENS; Tilmes et al. (2018)] and Assessing Responses and Impacts of Solar climate intervention on the Earth system with stratospheric aerosols [ARISE-SAI − 1.5; Richter et al. (2022)] projects, September sea ice extent and thickness quickly stabilize after SAI deployment, but with a lot of interannual variability (Hueholt et al., 2023). When aerosols are injected at high northern latitudes in an effort to preserve the Arctic climate, September sea ice extent increases to nearly 5–12 times the extent in a non-SAI simulation over the same time period, depending on the volume of aerosols injected (Lee et al., 2023). SAI also reduces the seasonal cycle of sea ice compared to a baseline non-SAI climate but maintains sea ice extent close to the baseline values nearly every month compared to the non-SAI climate (Jiang et al., 2019).
Although many studies have investigated how Arctic Ocean shipping may change under different climate change scenarios (e.g., Aksenov et al., 2017; Bensassi et al., 2016; Chen et al., 2021; Min et al., 2022; Melia et al., 2016; Mudryk et al., 2021; Smith and Stephenson, 2013; Stephenson et al., 2011; Wei et al., 2020), none have yet attempted to quantify how shipping may change in the context of climate intervention. Here, we use simulations of two SAI scenarios with different temperature targets to assess how projected changes in Arctic sea ice conditions may affect Arctic Ocean navigability, optimal safe routes across the Arctic Ocean, and how long it takes to transit the optimal routes. To provide an assessment of future navigability with and without SAI, we directly compare changes in navigability after SAI to changes in navigability over the same time period in a future world without SAI.
To assess how sea ice conditions and Arctic navigability may differ with and without SAI deployment, we use output from two existing SAI simulations and one control, or non-SAI, simulation. All were run with the Community Earth System Model v2 (CESM2; Danabasoglu et al. (2020)). CESM2 uses the Whole Atmosphere Community Climate Model v6 (WACCM6; Gettelman et al. (2019)) as the atmosphere component, a modified version of the Parallel Ocean Program (POP) version 2 (Danabasoglu et al., 2012; Smith et al., 2010) as the ocean component, and CICE v5.1.2 (Hunke et al., 2015) as the sea ice component. WACCM6 is a stratosphere-resolving model, with 70 vertical levels and a model top at ~140 km, and importantly has a comprehensive sulfur cycle so it can resolve the chemistry of injecting sulfur dioxide into the stratosphere in SAI experiments (Gettelman et al., 2019). Sea ice is on the POP grid, which is a displaced pole grid with uniform zonal resolution and variable meridional resolution. We remap all sea ice data to the atmosphere grid’s resolution of 1.25°longitude by 0.9°latitude. To capture sea ice conditions along coasts, we use a bilinear interpolation to fill in only the missing pixels directly adjacent to coastlines.
CESM2-WACCM has been widely used in assessments of historical and future Arctic sea ice (e.g., Keen et al., 2021; Shen et al., 2021; Urrego-Blanco et al., 2017; Watts et al., 2021) and in assessments of future Arctic shipping due to its accurate representation of historical sea ice extent and thickness (e.g., Hunke et al., 2019; Li et al., 2021; Zhang et al., 2023). It closely matches historical Northern Hemisphere sea ice extent in the annual mean (DuVivier et al., 2020) and in March and September (Shen et al., 2021; Shu et al., 2020), although it tends to underestimate September sea ice concentration in the central Arctic Ocean (Shen et al., 2021). CESM2-WACCM accurately captures observed 2000–2014 sea ice thickness and age trends in the central Arctic (DuVivier et al., 2020) but exhibits some regional biases such as anomalously thick ice in parts of the Beaufort, Chukchi, and East Siberian Seas, and northern Canadian Archipelago in October (Henke et al., 2023).
SAI data were from the Assessing Responses and Impacts of Solar climate intervention on the Earth system with Stratospheric Aerosol Injection (ARISE-SAI) simulations, which were completed and described by Richter et al. (2022). We use the 35-year ARISE-SAI-1.5 and ARISE-SAI-1.0 (hereafter ARISE-1.5 and ARISE-1.0) simulations, which use both the Shared Socioeconomic Pathway scenario SSP2 − 4.5 (Riahi et al., 2017), a moderate climate and societal change scenario with a 4.5 W m−2 forcing pathway (O’Neill et al., 2016). In both simulations, sulfur dioxide (SO2) particles are injected into the stratosphere at ~21.5 km at 15°N/S and 30°N/S along 180°E each year from 2035 to 2069. The yearly SO2 injection amount is adjusted by a feedback controller algorithm (Kravitz et al., 2017; MacMartin et al., 2014) to maintain certain temperature goals. The three main temperature goals in ARISE-SAI are as follows: (1) to stabilize global mean surface temperature at 1.5°C (ARISE-1.5) or 1.0°C (ARISE-1.0) above pre-industrial levels; (2) to maintain the pole-to-pole temperature gradient; and (3) to maintain the Equator-to-pole temperature gradient. Each ARISE simulation has 10 ensemble members. In the ARISE-SAI simulations, the ensemble mean global mean temperature and inter-hemispheric temperature goals for each simulation are reached after the first year of SAI deployment. Global mean precipitation decreases slightly in ARISE-1.5 (Richter et al., 2022) but has not yet been assessed in ARISE-1.0.
We compare ARISE-SAI with a parallel control simulation without SAI and also run with the SSP2 − 4.5 scenario (hereafter SSP2-4.5). There are also 10 ensemble members for SSP2-4.5.
We use monthly mean sea ice concentration (AICE), sea ice fraction by ice thickness category (AICEN), and grid-cell mean sea ice thickness (SIT). We also use daily mean grid-cell mean sea ice thickness (SIT_D) and sea ice fraction by ice thickness category (AICEN_D). The monthly mean sea ice thickness is the total thickness of all sea ice in a grid cell averaged over the area of the cell. In CICE, there are five ice categories that are defined by the maximum thickness in each category: (1) 0.65 m, (2) 1.4 m, (3) 2.5 m, (4) 4.6 m, and (5) > 4.6 m (DuVivier, 2018). The closest ice age equivalent for each ice thickness category is shown in Table 1 (Transport Canada, 1998).
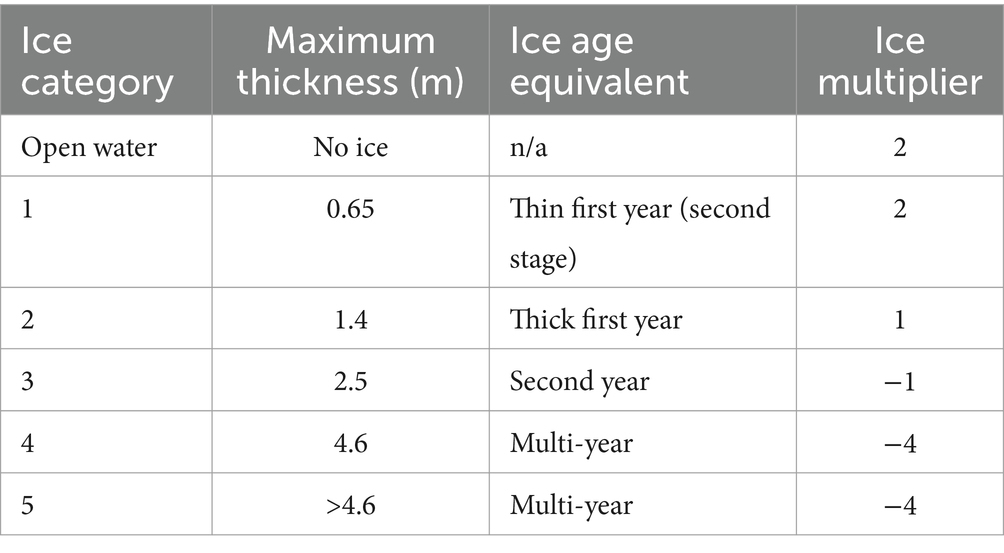
Table 1. Ice categories in CESM2 with each category’s maximum thickness, closest equivalent ice age, and ice multiplier for calculating the ice numeral in Equation 1.
Projected changes in sea ice conditions and navigability are assessed over the first and last 5 years of the simulations (2035–2039 and 2065–2069) to minimize the effects of interannual variability. Except where noted, the results are from each simulation’s 10-member ensemble mean.
We examine how changing sea ice conditions might impact navigability for Polar Class 6 (PC6) and open water (OW) vessels, which are categorized by their ice-breaking abilities. PC6 vessels are moderately ice-strengthened and can traverse medium first-year ice up to 120 cm. OW vessels generally lack ice-breaking capabilities and can travel through thin first-year ice up to 15 cm (Transport Canada, 1998; IMO, 2002). Based on these capabilities, we assess whether each vessel class can safely traverse a grid cell and determine the number of navigable days per year.
We calculate navigability using average daily grid-cell mean sea ice thickness and sea ice thickness categories in 2035–2039 and 2065–2069. If the daily mean sea ice thickness exceeds a particular ship’s ice-breaking capabilities, then the grid cell is not navigable on that day. If the daily mean sea ice thickness is thinner than a ship’s ice-breaking capabilities, then we further consider ice thickness categories. For OW vessels, a grid cell is navigable if the total ice concentration in thickness categories 2–5 (thick first-year to multi-year ice) is <0.5%. For PC6 vessels, the total concentration of ice in thickness categories 3–5 (second-year to multi-year ice) must be <0.5% for the grid cell to be navigable. We chose a 0.5% threshold for “thick” sea ice concentration to exclude cells with significant thick ice coverage while still considering potentially navigable cells with isolated blocks of thick ice.
We also consider the first date that a grid cell is persistently navigable, which we define as navigable for at least 30 consecutive days starting on that day. We begin on March 1, when sea ice is near its annual maximum extent, and go through February 28 of the following year. Given that the typical non-Arctic sea freight routes between China and Europe or the United States can take between 30 and 45 days (Maersk, 2023), a transit across the Arctic Ocean exceeding 30 days may prompt a shipping company to opt for more predictable lower-latitude routes. Where applicable, we therefore use a 30-day threshold to provide a first-order analysis of when, based on trip time alone, it may be advantageous for a ship to use an Arctic Ocean route instead of a lower-latitude route.
The Arctic Ice Regime Shipping System [AIRSS; Transport Canada (1998)] uses sea ice conditions to determine whether a region is safe for a ship to enter, and if so, how fast the ship can travel through the region. AIRSS calculates an ice numeral (IN) based on ship type and how much ice of a certain regime, or thickness, is in a region. Only, a non-negative IN means that the region is safe.
Following the methodology used to create the Arctic Transport Accessibility Model [ATAM; Stephenson et al. (2011)], we use monthly mean sea ice thickness categories to calculate an IN for each month in each grid box:
where TN is the concentration in tenths of each sea ice thickness category. For example, if the fraction of a grid cell covered by ice thickness category 1 is 0.3, then the concentration in tenths is 3. “Open water” is also an ice thickness category for the purposes of calculating IN. It is the concentration in tenths of a grid cell that is not covered by the remaining five ice thickness categories. IMN is the ice multiplier for each ice thickness category (Table 1). The ice multiplier table is adapted from AIRSS and Copland et al. (2021) for the sea ice thickness categories used in the ARISE-SAI and SSP2-4.5 simulations from CESM2. If the concentration in tenths of ice thickness category N is ≥ 6, IMN is reduced by 1 (Transport Canada, 1998).
Table 2 shows the maximum safe ship speed based on IN. Speed ranges from 0 nm hr.−1 (not safe to travel) to 11 nm hr.−1. We use the maximum safe speed in an algorithm to find the fastest route between Blanc-Sablon, Canada, or Rotterdam, the Netherlands, and the Bering Strait each month from January 2035 to December 2069. A route must follow “safe” grid cells with non-negative IN.
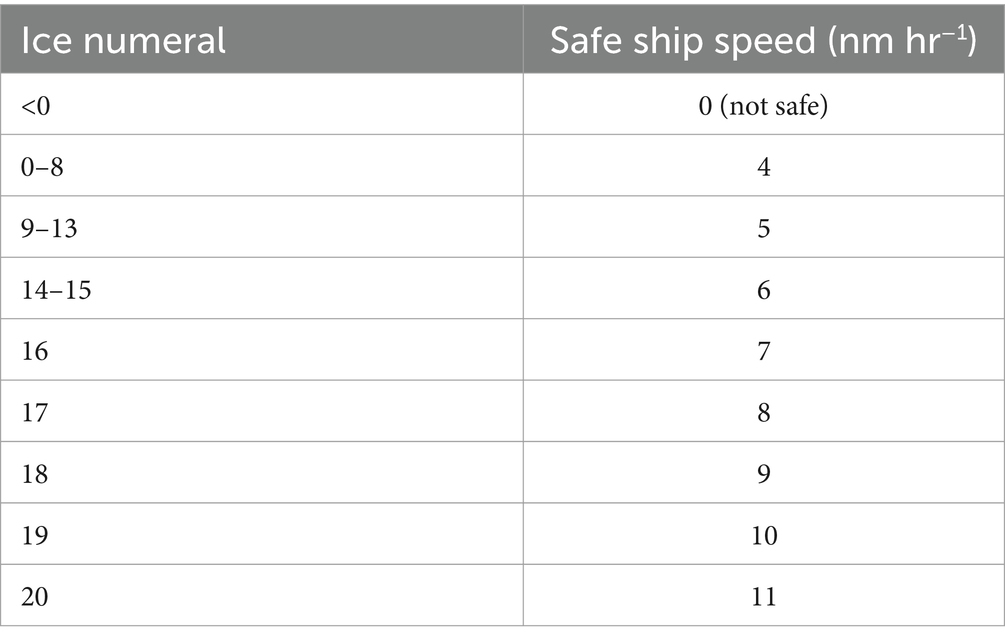
Table 2. The maximum safe ship speed based on ice numeral range (Transport Canada, 1998).
From the origin point, our algorithm checks all eight surrounding grid cells for “safe” cells and proceeds until it encounters an “unsafe” cell. Upon encountering an unsafe cell, the algorithm starts over from the origin. If a safe path is found between the origin and destination, then that path is logged. We log all safe paths and then find the shortest one by travel time.
To calculate the travel time, we find the geodesic distance in nautical miles between the mid-point of each grid cell along the path and divide by two to get the distance traveled in each cell. The time in hours to cross each cell is found by dividing the distance traveled by the safe shipping speed in that cell. The total trip time is the sum of the time to cross all cells along the route. We only calculate shipping speeds and navigable paths for PC6 vessels since OW vessels generally do not transit the entire Arctic Ocean (i.e., from the Atlantic to the Pacific or vice versa).
Projected annual mean sea ice concentration (SIC; Figure 1) is similar between SSP2-4.5 (Figure 1A), ARISE-1.5 (Figure 1D), and ARISE-1.0 (Figure 1G) for the first 5 years of SAI, from 2035 to 2039. The highest SIC is in the central Arctic and off the north coast of the Canadian Archipelago and diminishes toward the Russian coast. The location and amount of sea ice diverge between the three simulations over time. By 2065–2069, sea ice disappears nearly uniformly above the Arctic Circle in SSP2-4.5 (Figure 1B), and the 50% SIC threshold moves poleward. The Arctic Ocean-wide decrease in SIC is robust across SSP2-4.5 ensemble members (hatched regions in Figure 1C). In contrast, ARISE-1.5 (Figures 1E,F) shows only small changes to SIC (< 5%) across most of the Arctic Ocean between 2035–2039 and 2065–2069, and these changes are not robust across ensemble members, indicating that there is an increase in SIC in some members and a decrease in others. SIC increases almost everywhere in ARISE-1.0 (Figures 1H,I), with a 5–10% increase near the Barents and Kara Seas. As in SSP2-4.5, most of these increases are robust across ARISE-1.0 ensemble members.
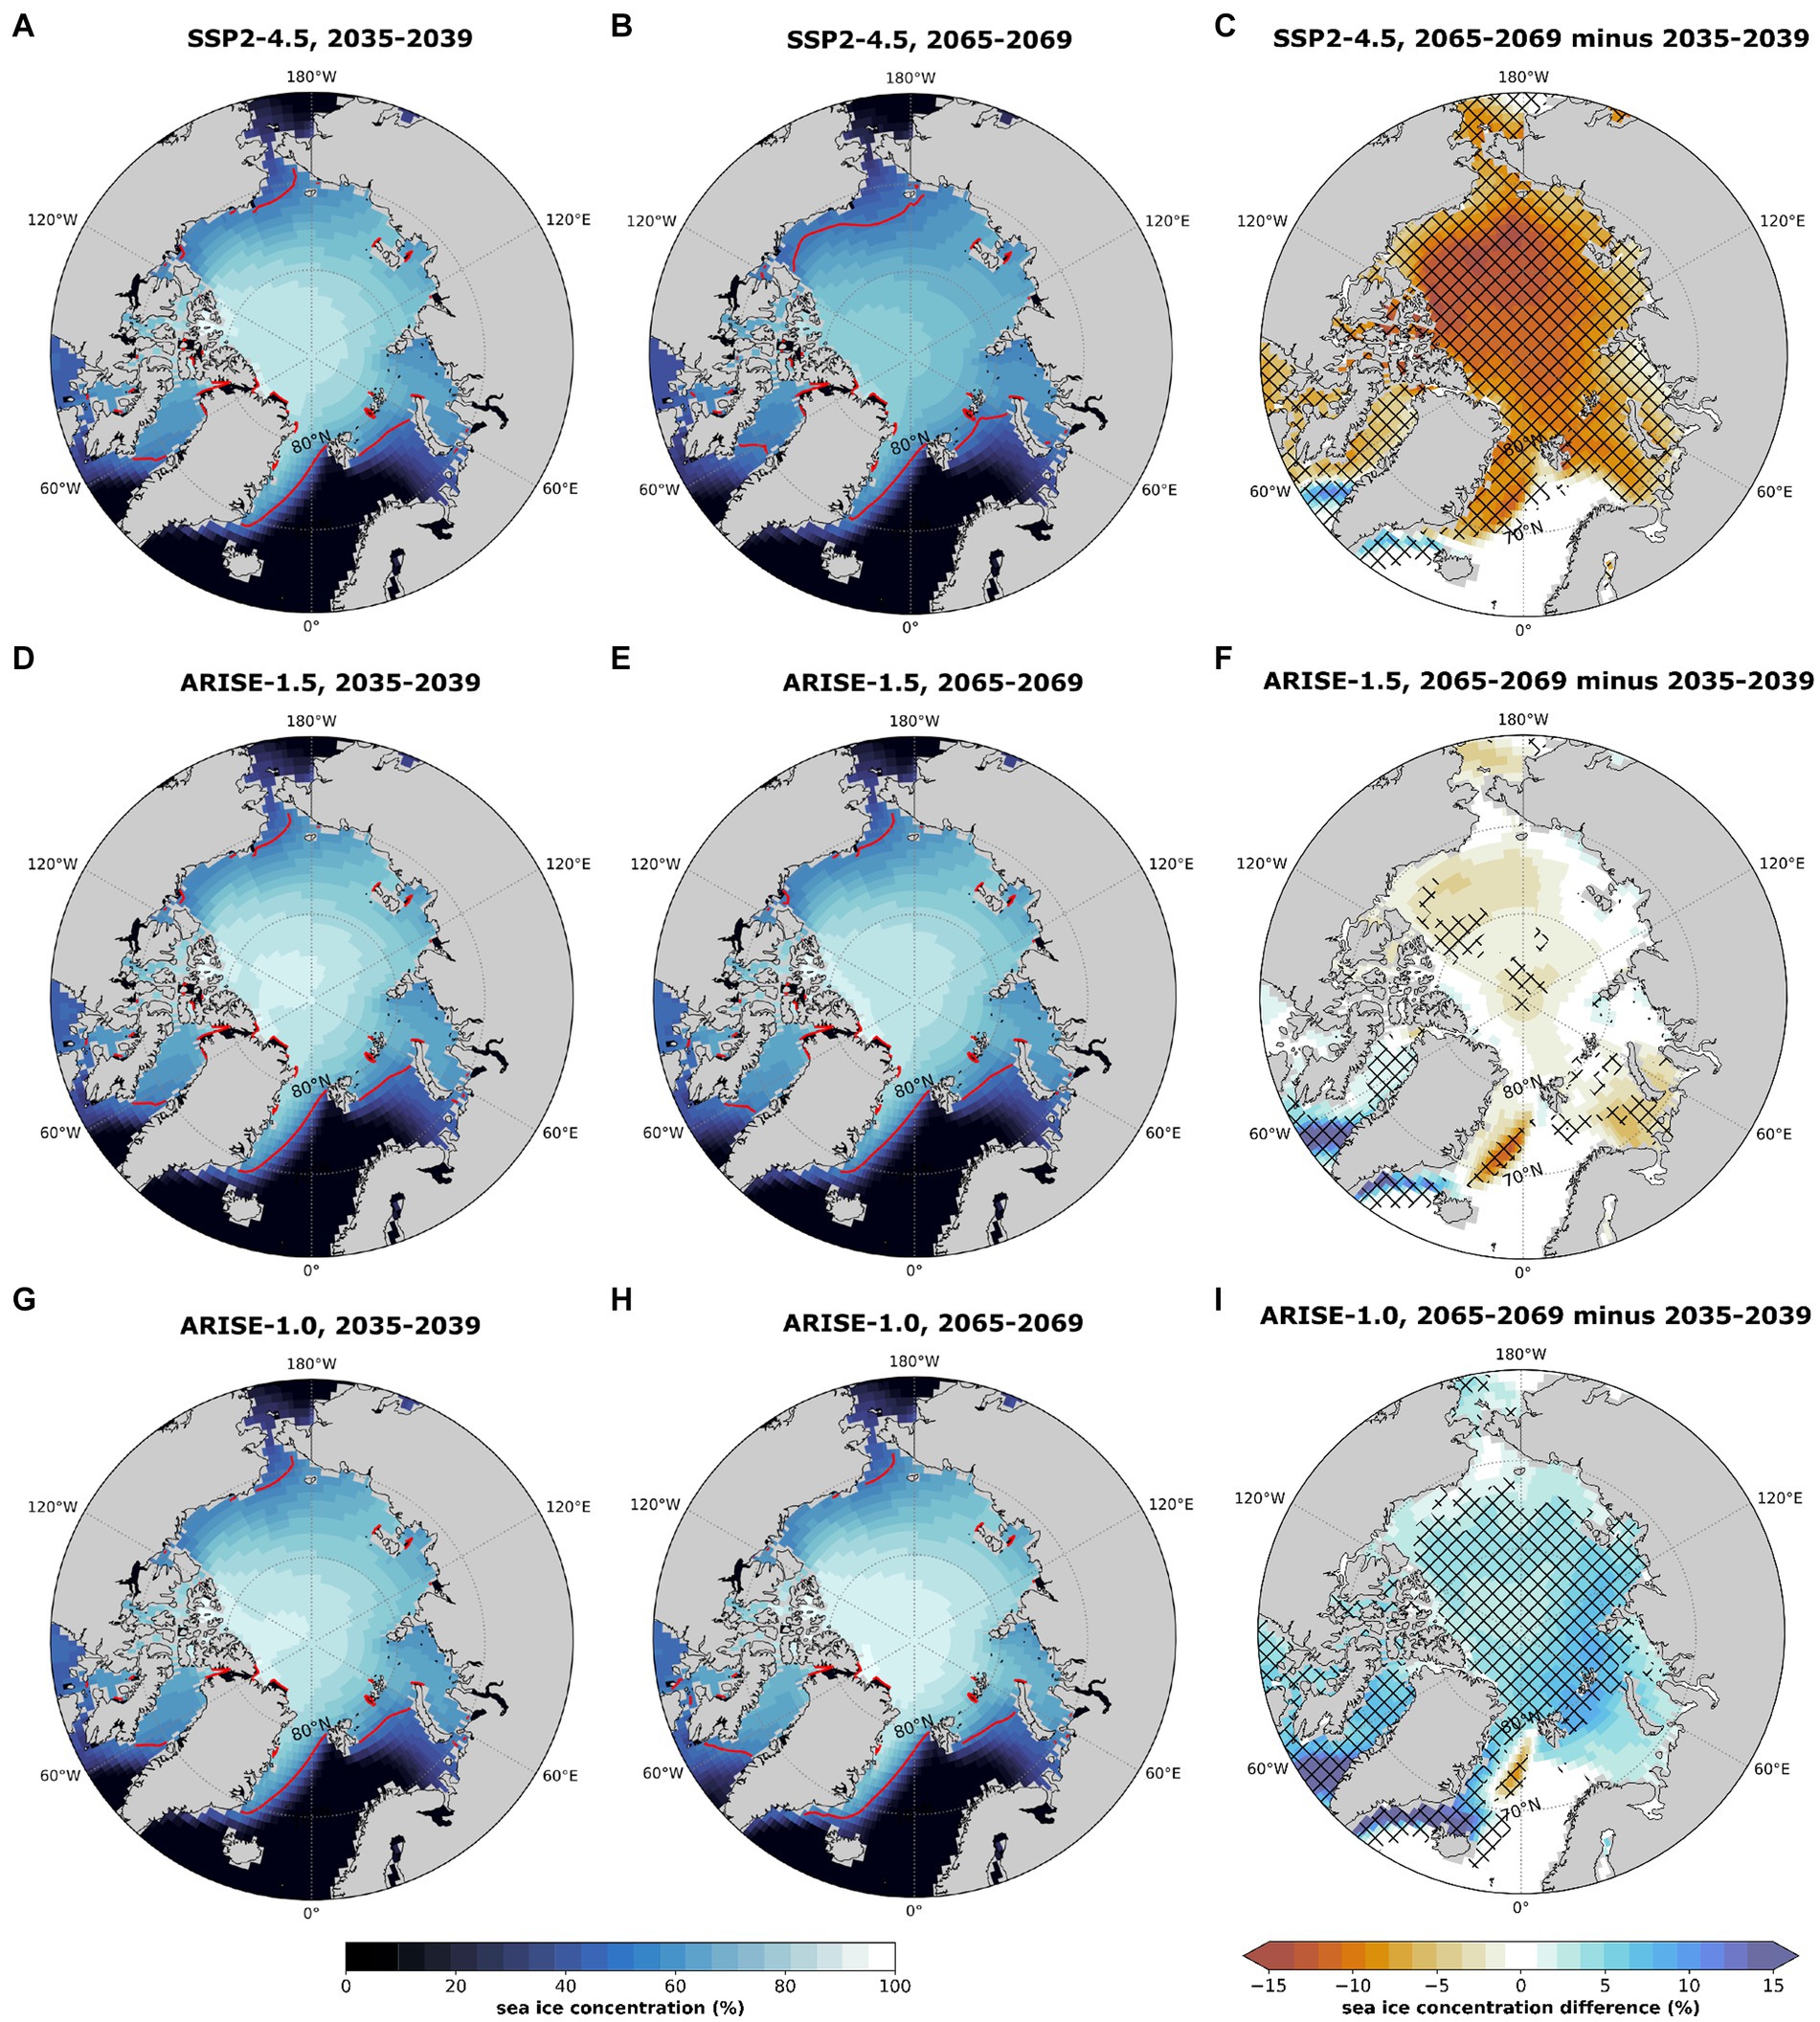
Figure 1. Annual mean sea ice concentration for (A) SSP2-4.5, 2035–2039, (B) SSP2-4.5, 2065–2069, (C) SSP2-4.5, 2065–2069 minus 2035–2039, (D) ARISE-1.5, 2035–2039, (E) ARISE-1.5, 2065–2069, (F) ARISE-1.5, 2065–2069 minus 2035–2044, (G) ARISE-1.0, 2035–2039, (H) ARISE-1.0, 2065–2069, and (I) ARISE-1.0, 2065–2069 minus 2035–2039. The red line on maps in the two left columns is the 50% sea ice concentration threshold. In the rightmost column, hatched regions indicate that at least 80% of ensemble members agree on the sign of change.
As with SIC, annual mean sea ice thickness (SIT; Figure 2) is similar in all simulations from 2035 to 2039. Between 2035–2039 and 2065–2069, SSP2-4.5 sea ice thins by >1 m along the Canadian Archipelago and by up to 30 cm along the NSR (Figures 2B,C). Changes in SIT and SIC are concomitant in ARISE-1.5 (Figures 2E,F). SIT remains nearly the same between 2035–2039 and 2065–2069, thinning slightly in the Beaufort and Chukchi Seas, while landfast ice in the East Siberian Sea becomes slightly thicker.
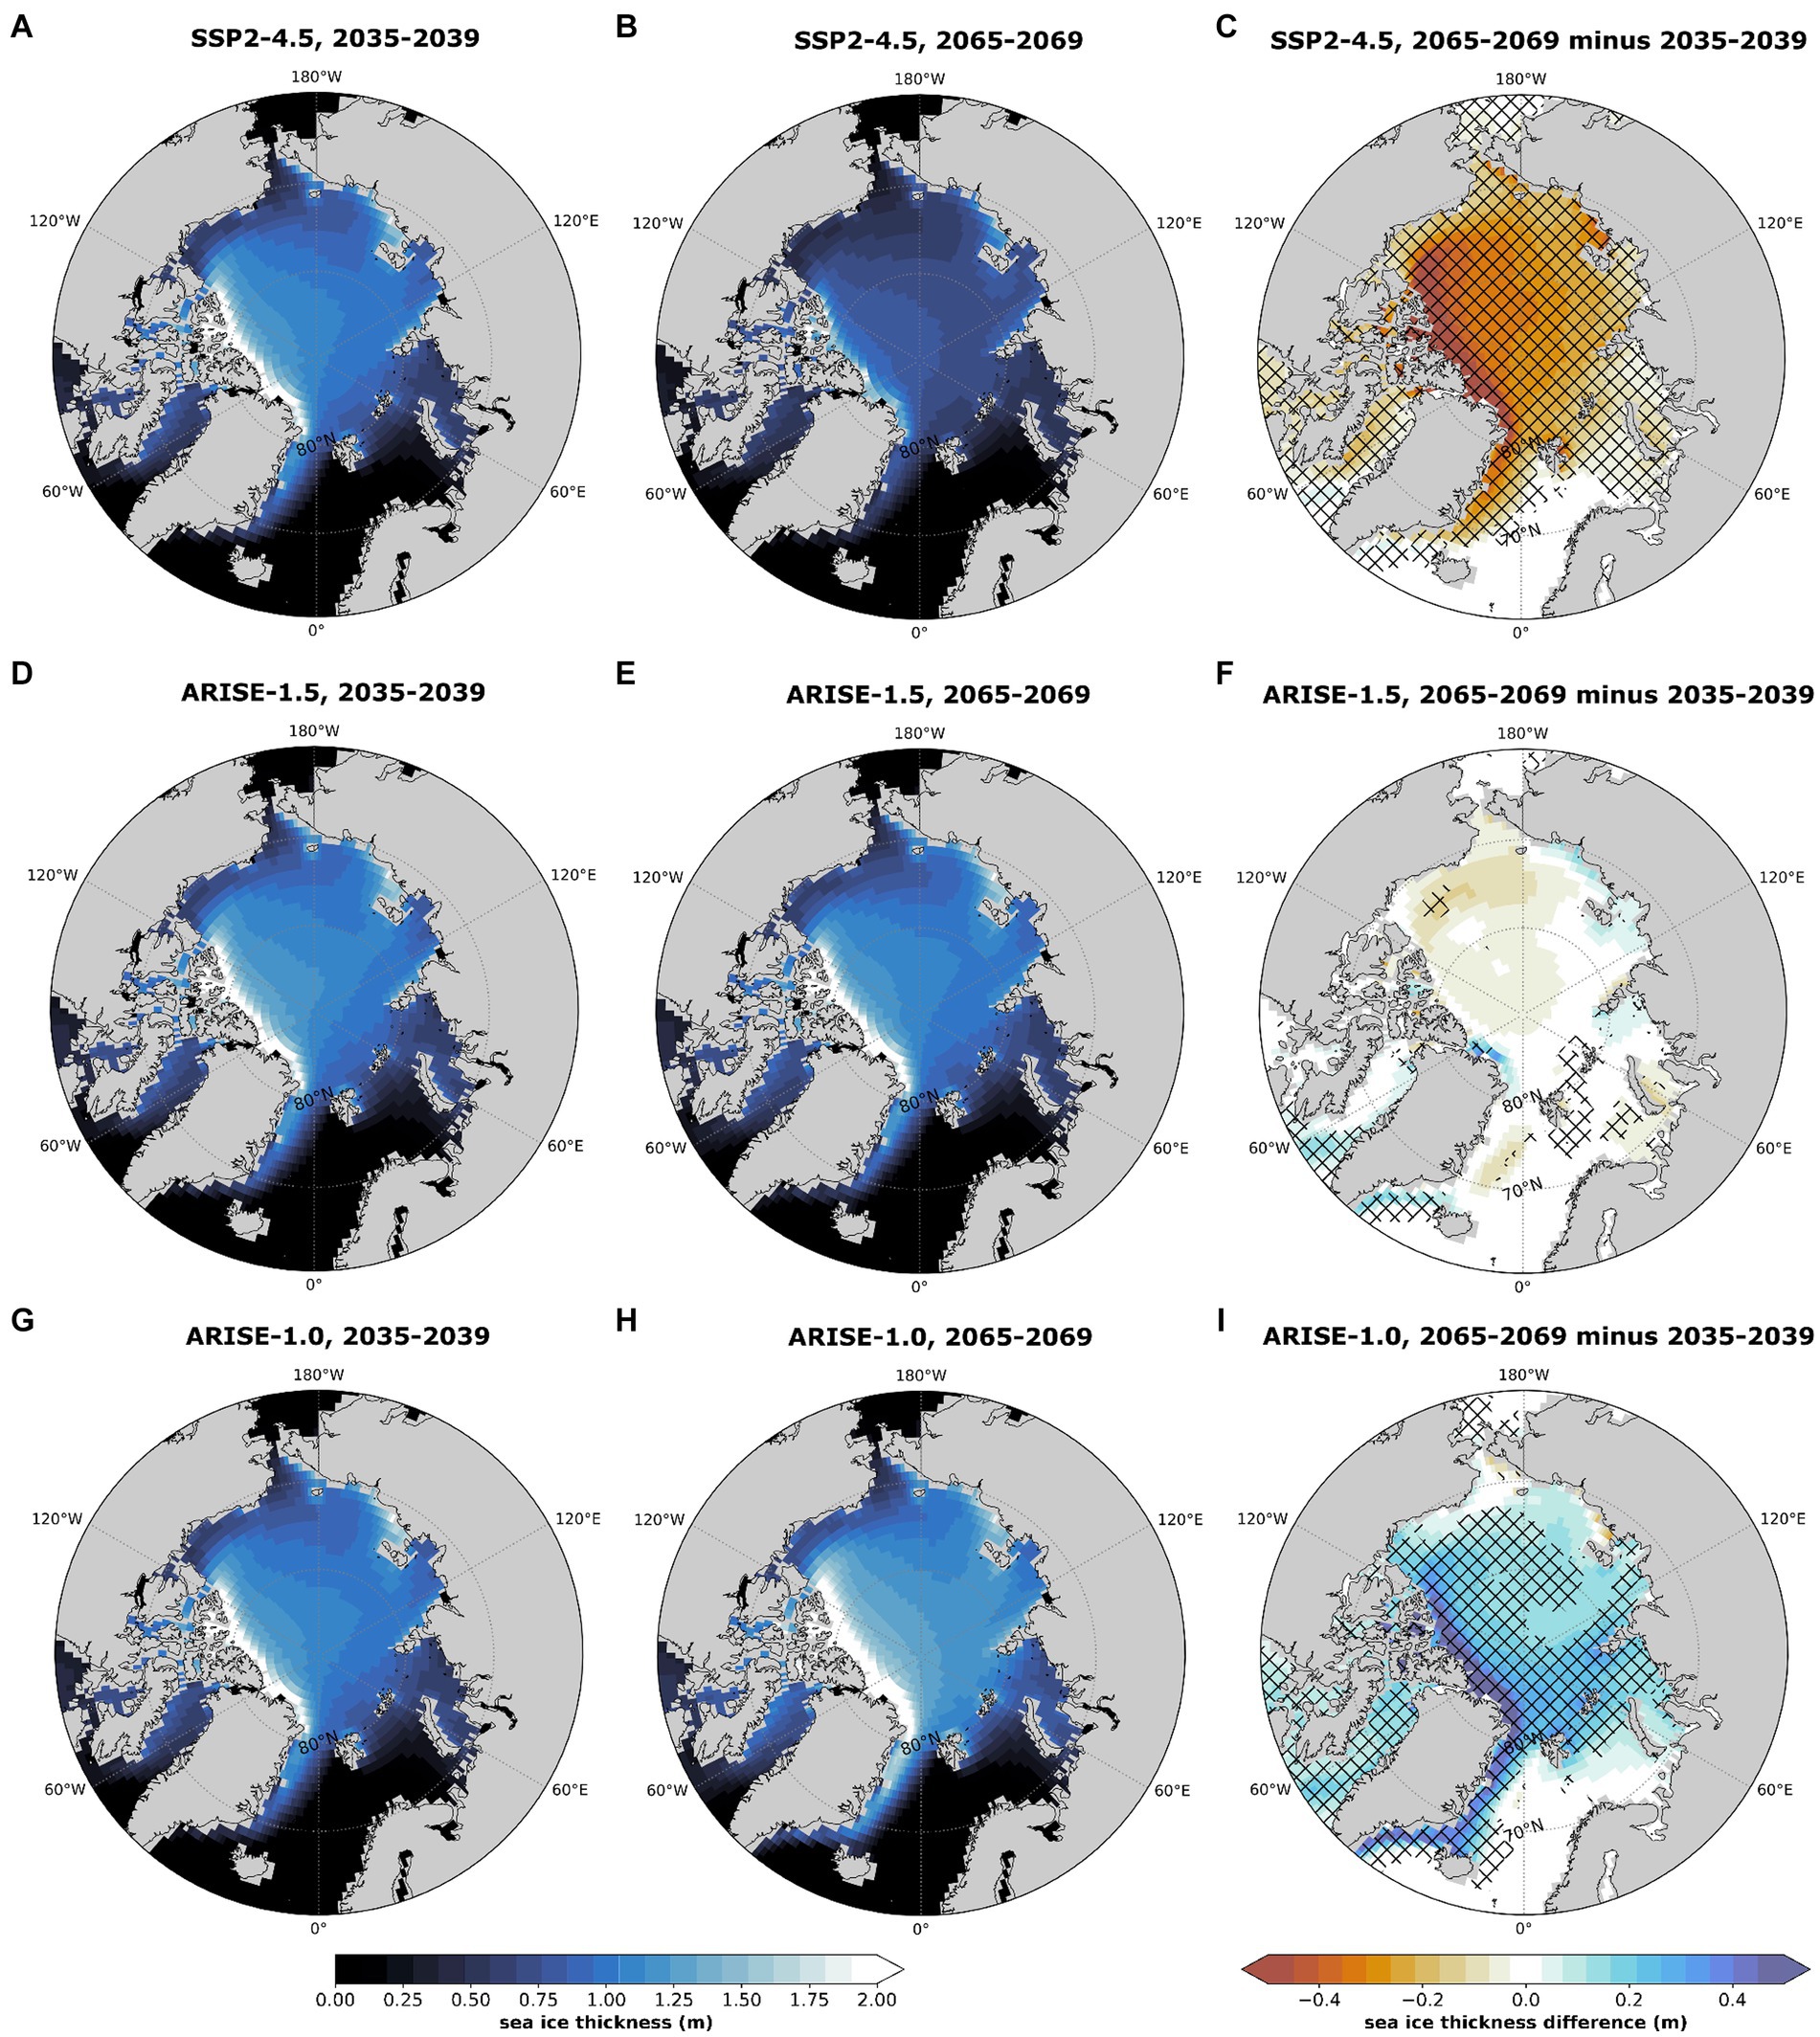
Figure 2. As in Figure 1 except for grid-cell mean sea ice thickness.
ARISE-1.0 differs considerably from the other simulations. SIT increases over time (Figure 2H), growing by more than 50 cm off northern Greenland and the Canadian Archipelago (Figure 2I), thereby reducing the likelihood of safe travel along parts of the NWP. The increase in SIC (Figure 1I) is linked to increasing SIT: ice that survives for more than a year tends to be thicker than first-year ice because layers can build up over time, and older ice tends to have reduced brine inclusions, which makes it stronger and more hazardous to ships (Johnston and Timco, 2008).
We next present the annual mean time series of grid-cell mean SIT above the Arctic Circle (Figure 3A), across the NWP region (Figure 3B), and across the NSR region (Figure 3C). Since ice thickness is the main factor in determining navigability, here we only show the time series of SIT (see Supplementary Figure S1 for SIC time series). As expected from the Arctic Ocean-wide ice thinning in SSP2-4.5, there is an SSP2-4.5 (red solid lines) ensemble mean decrease of 28, 30, and 23% in SIT from 2035–2039 to 2065–2069 above the Arctic Circle, along the NWP region, and along the NSR region, respectively. The ensemble member range narrows over time, though there is considerable interannual variability in individual ensemble members.
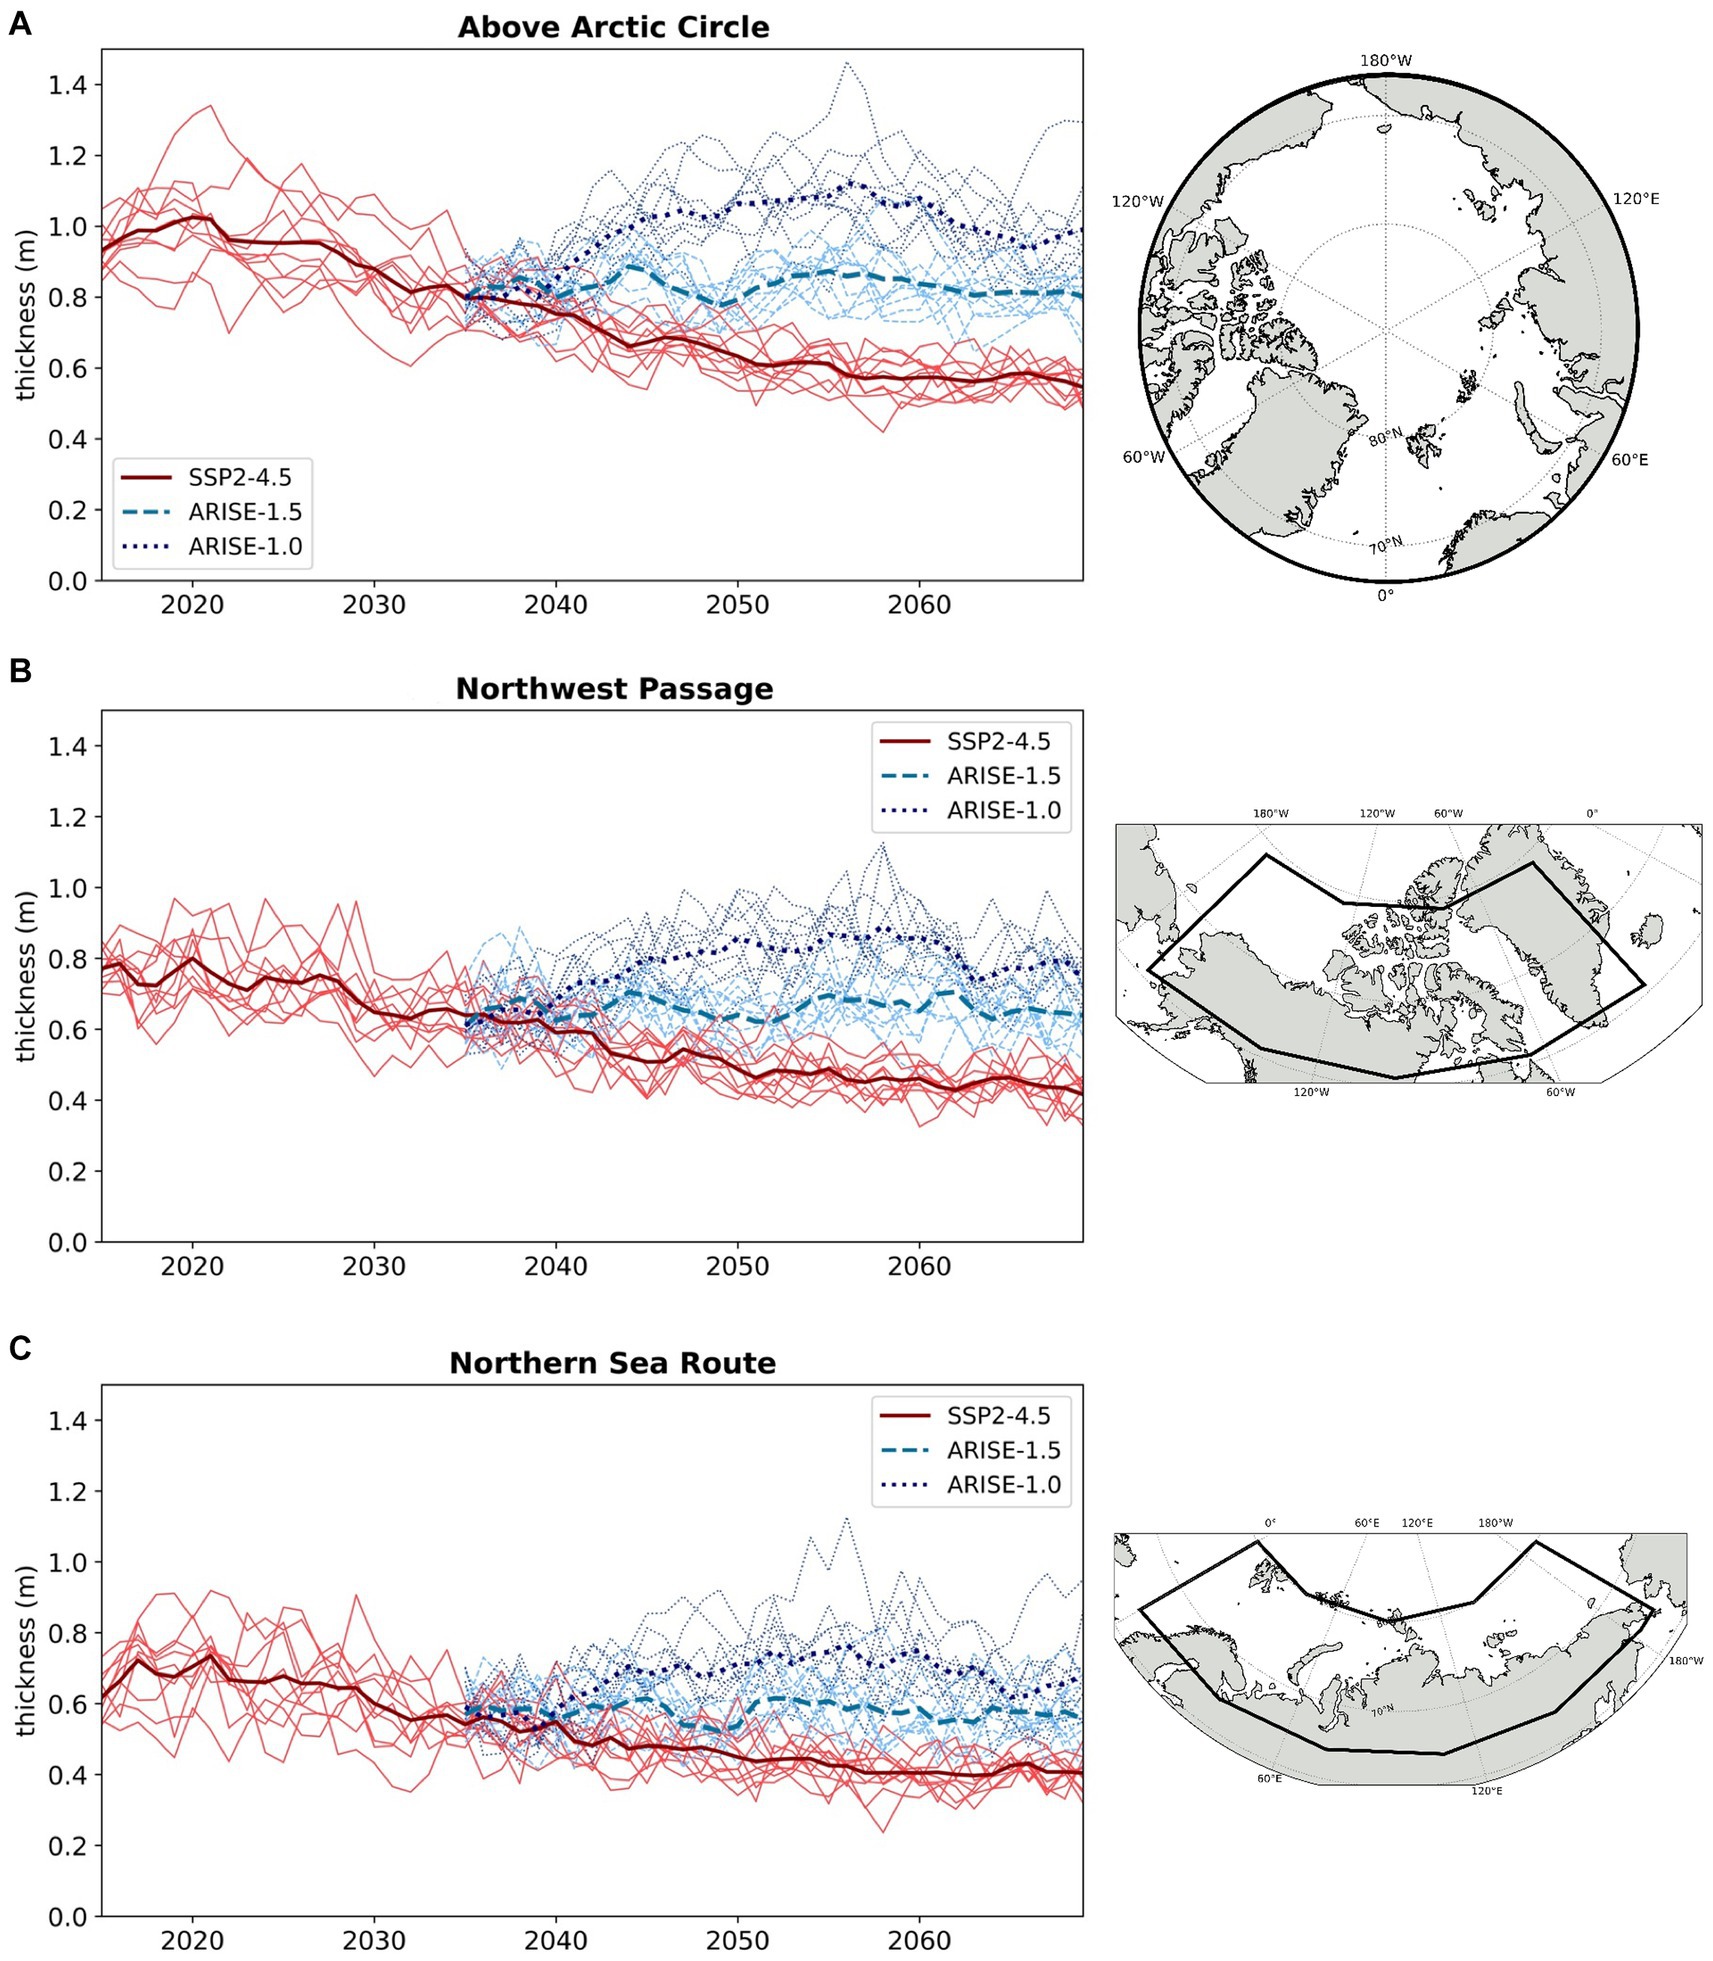
Figure 3. Time series of annual mean grid-cell mean sea ice thickness over the (A) Arctic Circle, (B) Northwest Passage region, and (C) Northern Sea Route region in SSP2-4.5 (red solid lines), ARISE-1.5 (blue dashed lines), and ARISE-1.0 (purple dotted lines). Thin lines are individual ensemble members; thick lines are ensemble means.
ARISE-1.5 (blue dashed lines) also exhibits interannual variability after SAI deployment in 2035 but no trend. The standard deviation is <3 cm in all regions. There is only a 1–2% change from 2035–2039 to 2065–2069. In ARISE-1.0 (purple dotted lines), SIT increases in all three regions for the first ∼10 years and then plateaus near 2020 ice thickness levels in SSP2-4.5, that is, it recovers to levels that occurred 15 years before SAI deployment.
Changes in sea ice thickness affect how navigable the Arctic Ocean may be with and without SAI. For PC6 ships (Figure 4), the Arctic Ocean poleward of 80°N is nearly impassable from 2035 to 2039 in all scenarios, consistent with other studies (Min et al., 2022; Wei et al., 2020), which found that the full Transpolar Route may not open until the mid-21st century. The most navigable areas in all scenarios are the Barents Sea, Baffin Bay, and Bering Strait (Figures 4A,D,G), all of which have at least 180 navigable days from 2035 to 2039. As sea ice thins and disappears in SSP2-4.5, the average number of navigable days in the area north of 60°N increases by 60 days from 2035–2039 to 2065–2069 (Figure 4B). There are more navigable days everywhere except the northern Canadian Archipelago. The large increase in navigable days is robust across ensemble members (dark green hatched region in Figure 4C). The area north of 60°N that is navigable for at least 180 days increases by approximately 5.7 million km2 between 2035–2039 and 2065–2069.
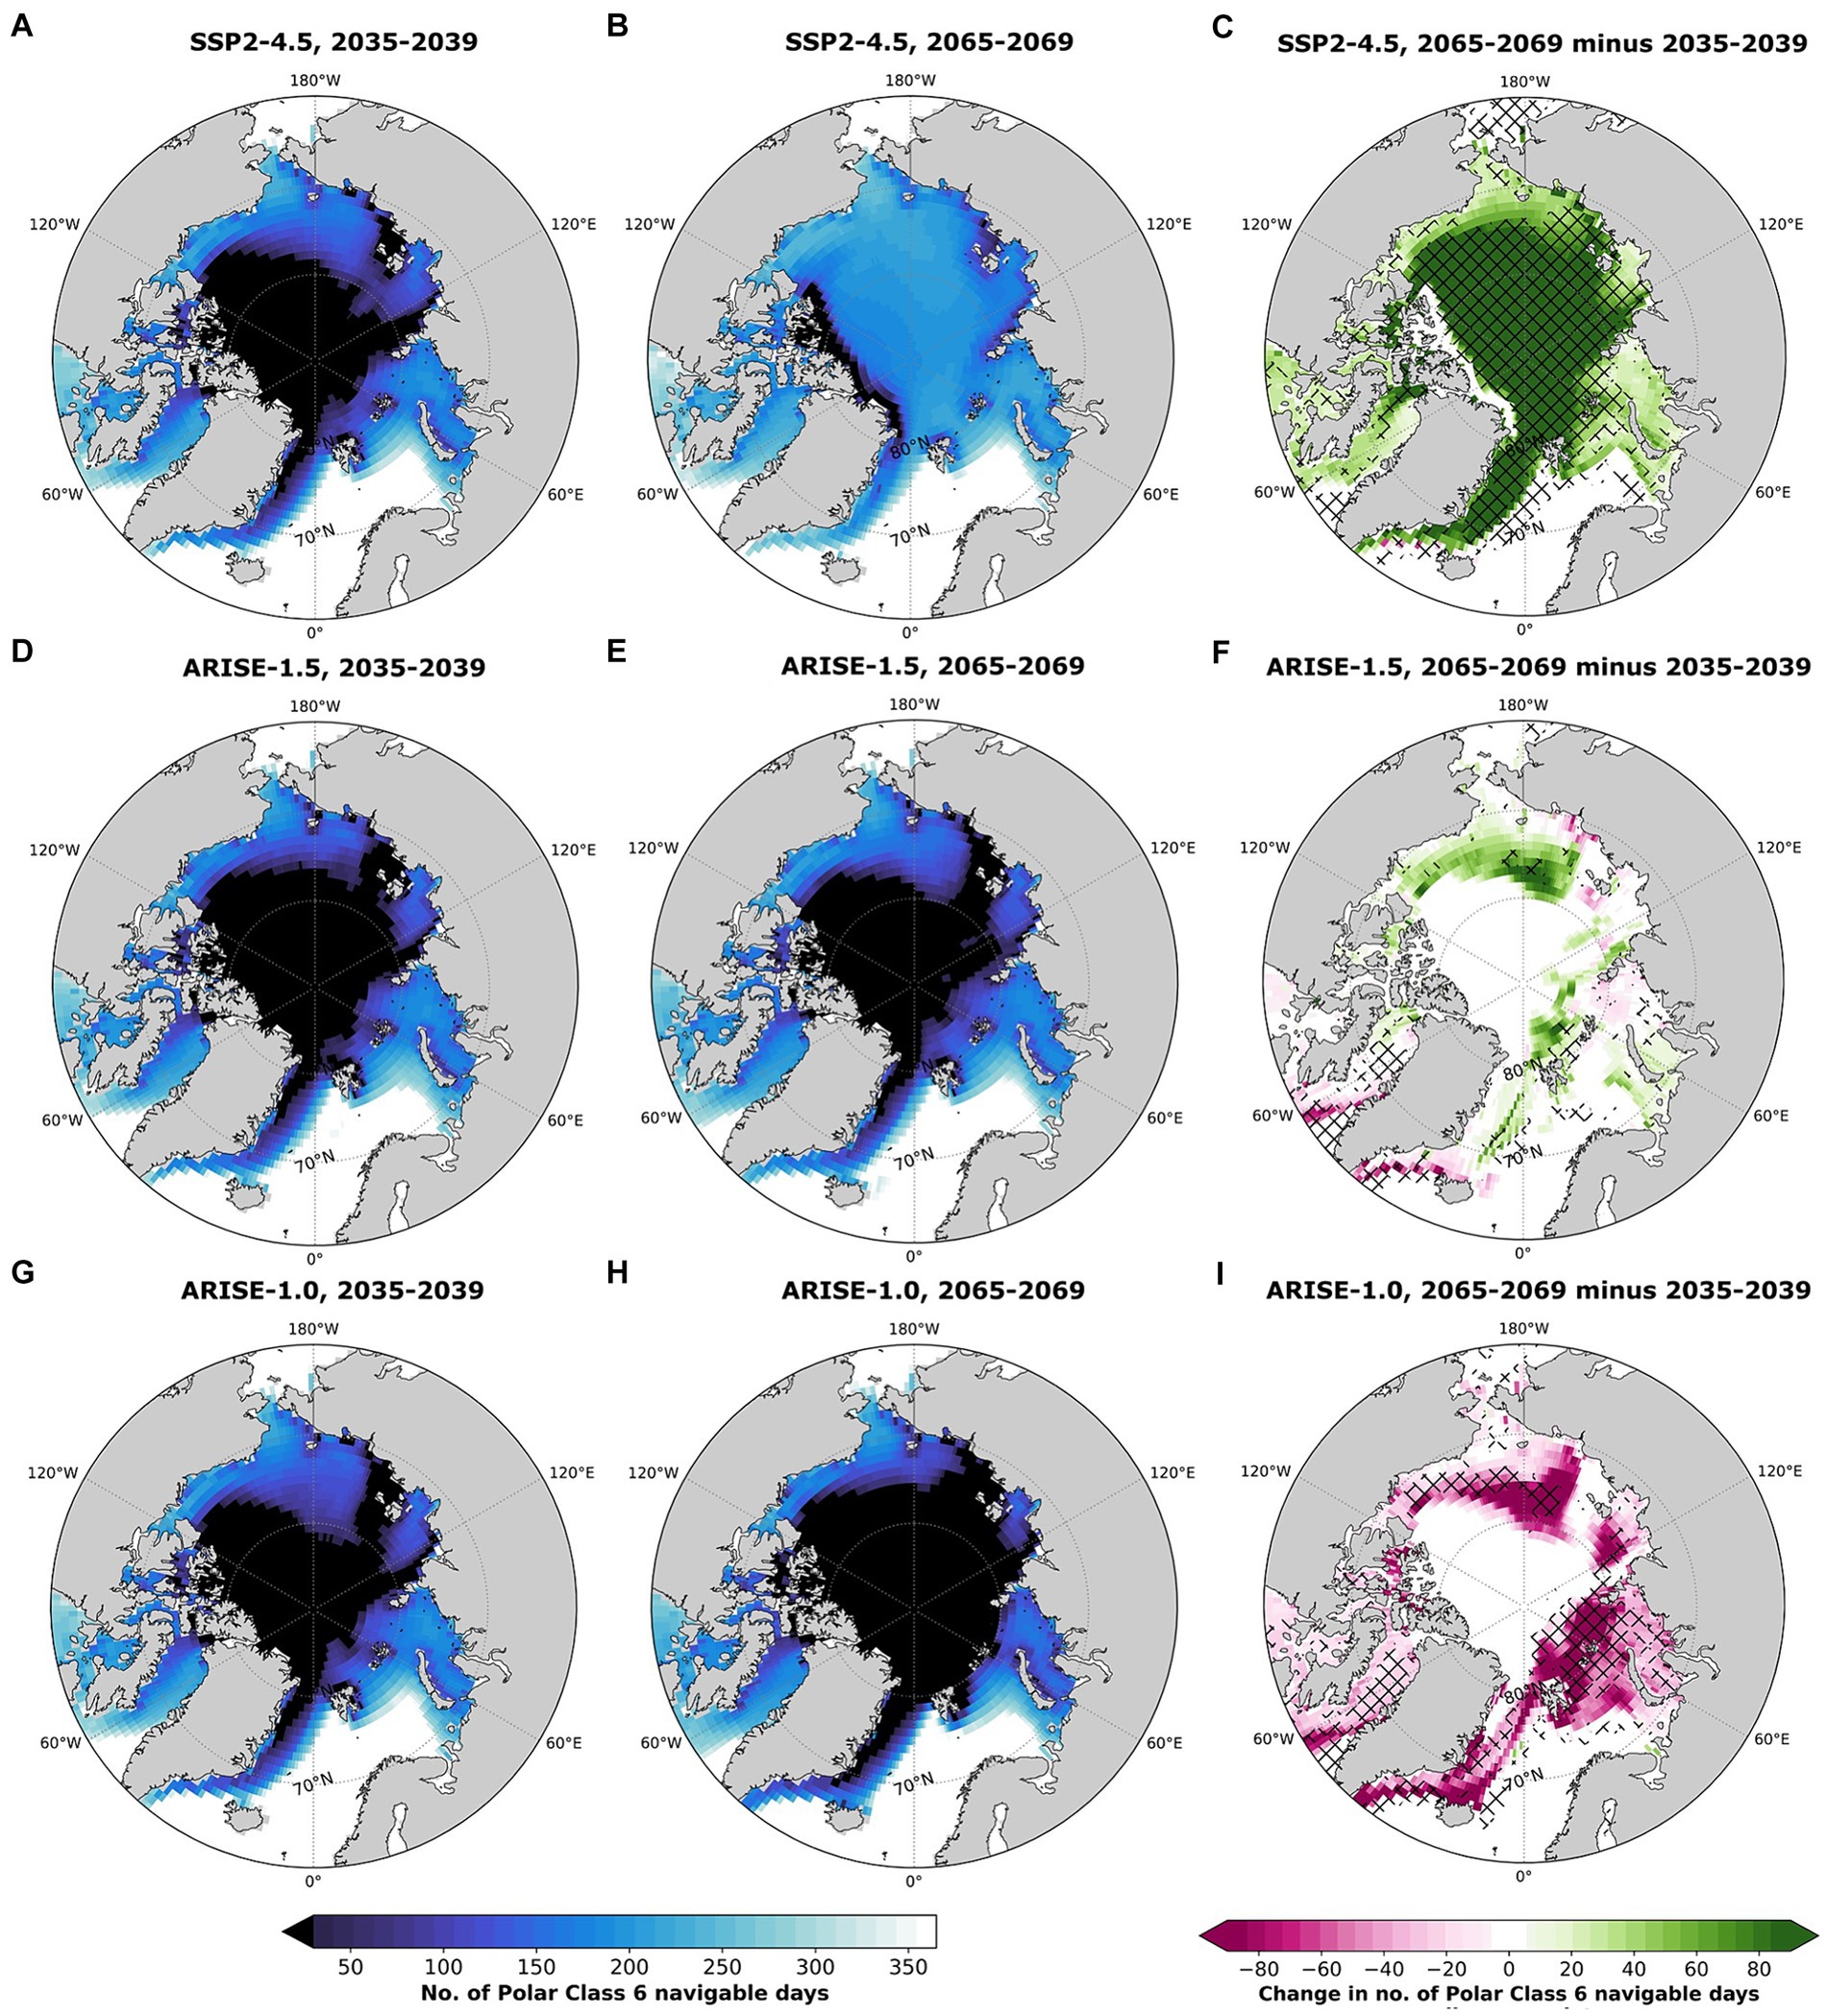
Figure 4. The number of Polar Class 6 navigable days in (A) SSP2-4.5 2035–2039, (B) SSP2-4.5 2065–2069, (C) SSP2-4.5 between 2035–2039 and 2065–2069, (D) ARISE-1.5 2035–2039, (E) ARISE-1.5 2065–2069, (F) ARISE-1.5 between 2035–2039 to 2065–2069, (G) ARISE-1.0, 2035–2039, (H) ARISE-1.0, 2065–2069, and (I) ARISE-1.0 between 2035–2039 and 2065–2069. In the rightmost column, hatched regions indicate that at least 80% of ensemble members agree on the sign of change.
Unlike in SSP2-4.5, in ARISE-1.5, there is no Arctic Ocean-wide increase in navigable days between 2035–2039 and 2065–2069 (Figures 4D–F). The average number of navigable days north of 60°N increases from 179 to 184 days, but that increase is almost entirely between 70–80°N, and there is almost no change in the central Arctic Ocean along the TSR. The area north of 60°N that is navigable for at least 180 days increases by only 0.2 million km2 between 2035–2039 and 2065–2069.
In ARISE-1.0, thicker ice results in a substantial decrease in navigability (Figures 4H,I). While the Barents Sea, Baffin Bay, and Bering Strait are accessible for about half the year in 2035–2039, by 2065–2069, thickening sea ice limits navigation to the edge of the ice pack. The number of navigable days decreases everywhere that ice exists (i.e., not in the North Atlantic Ocean or the Norwegian Sea) except in the central Arctic and the northern Canadian Archipelago (white cells in Figure 4I). There is no change in these regions because they are never navigable in ARISE-1.0. The area north of 60°N that is navigable for at least 180 days decreases by 1 million km2 between 2035–2039 and 2065–2069, and some parts of the Barents, Kara, and East Siberian Seas lose more than 90 navigable days.
In contrast with PC6 vessels, OW vessels are projected to experience very few navigable days (Figure 5), even under SSP2-4.5. OW vessels can only travel where there is almost no sea ice, so they are limited to the ice pack edge. North of 60°N, there is an average of 110, 103, and 106 navigable days a year in 2035–2039 in SSP2-4.5 (Figure 5A), ARISE-1.5 (Figure 5D), and ARISE-1.0 (Figure 5G), respectively. Although this may suggest that the Arctic Ocean is navigable for OW vessels for nearly a third of the year, only the margins of the ice pack and the ice-free North Atlantic Ocean are actually navigable. Any changes in navigability by 2065–2069 occur on the ice pack edge as sea ice thins and retreats (SSP2-4.5), retreats or expands regionally (ARISE-1.5), or expands (ARISE-1.0). SSP2-4.5 has more navigable days in several of the marginal Arctic seas, though notably there is no change along most of the NSR (Figure 5C). In ARISE-1.5, the Barents and Kara Seas and the Bering Strait gain more than 90 navigable days, but there are also parts that have a 63-day decrease (Figure 5F). The impassable area poleward of 60°N in ARISE-1.0 increases by 1.1 million km2 between 2035–2039 and 2065–2069 (Figure 5H). Much of the sea ice edge loses more than 90 navigable days, and the largest declines in navigable days occur near Greenland and northern Europe (Figure 5I).
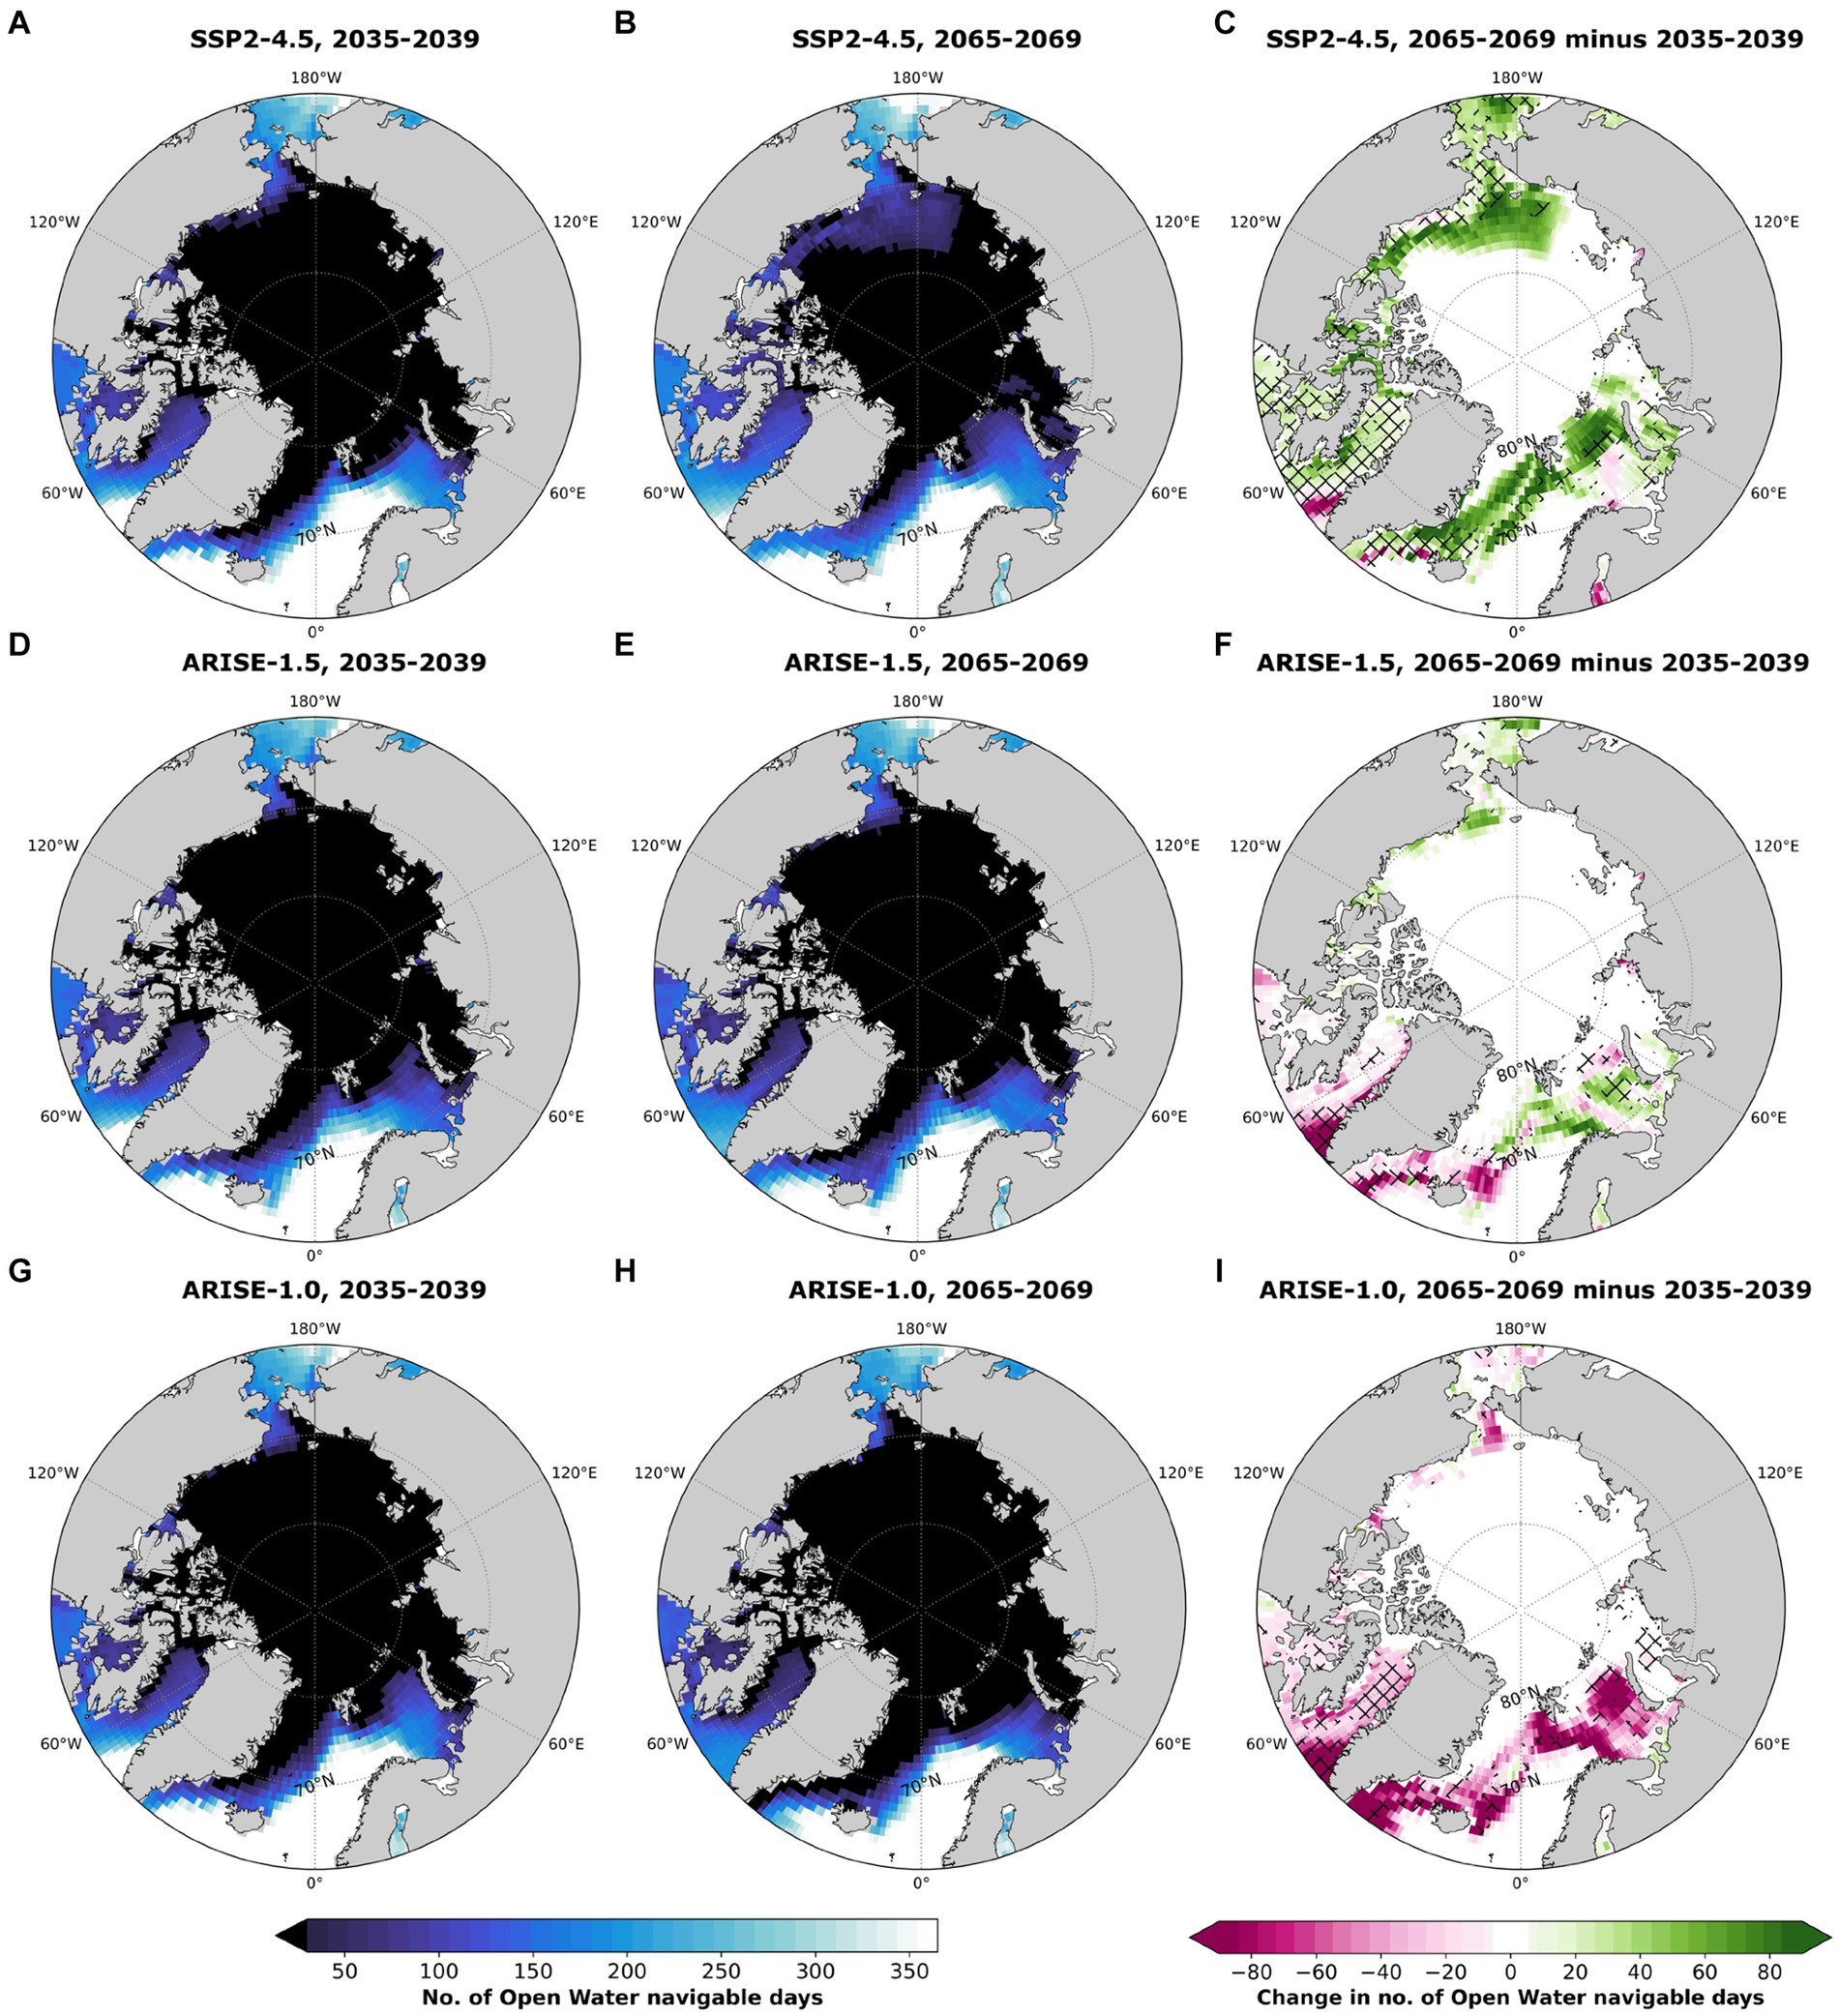
Figure 5. As in Figure 4 except for open water vessels.
The total number of navigable days is important for assessing future Arctic Ocean safety, but projecting if navigable days occur consecutively is important for determining future shipping feasibility. Figure 6 shows the first date after March 1 that a grid cell is persistently navigable for PC6 vessels for at least 30 consecutive days. Grid cells generally become persistently navigable in the late summer and early fall of 2035–2039, when sea ice is near or at its annual minimum extent. The central Arctic Ocean is not persistently navigable in any simulation in 2035–2039 even where there were more than 30 navigable days in Figure 4, indicating that those days did not occur consecutively.
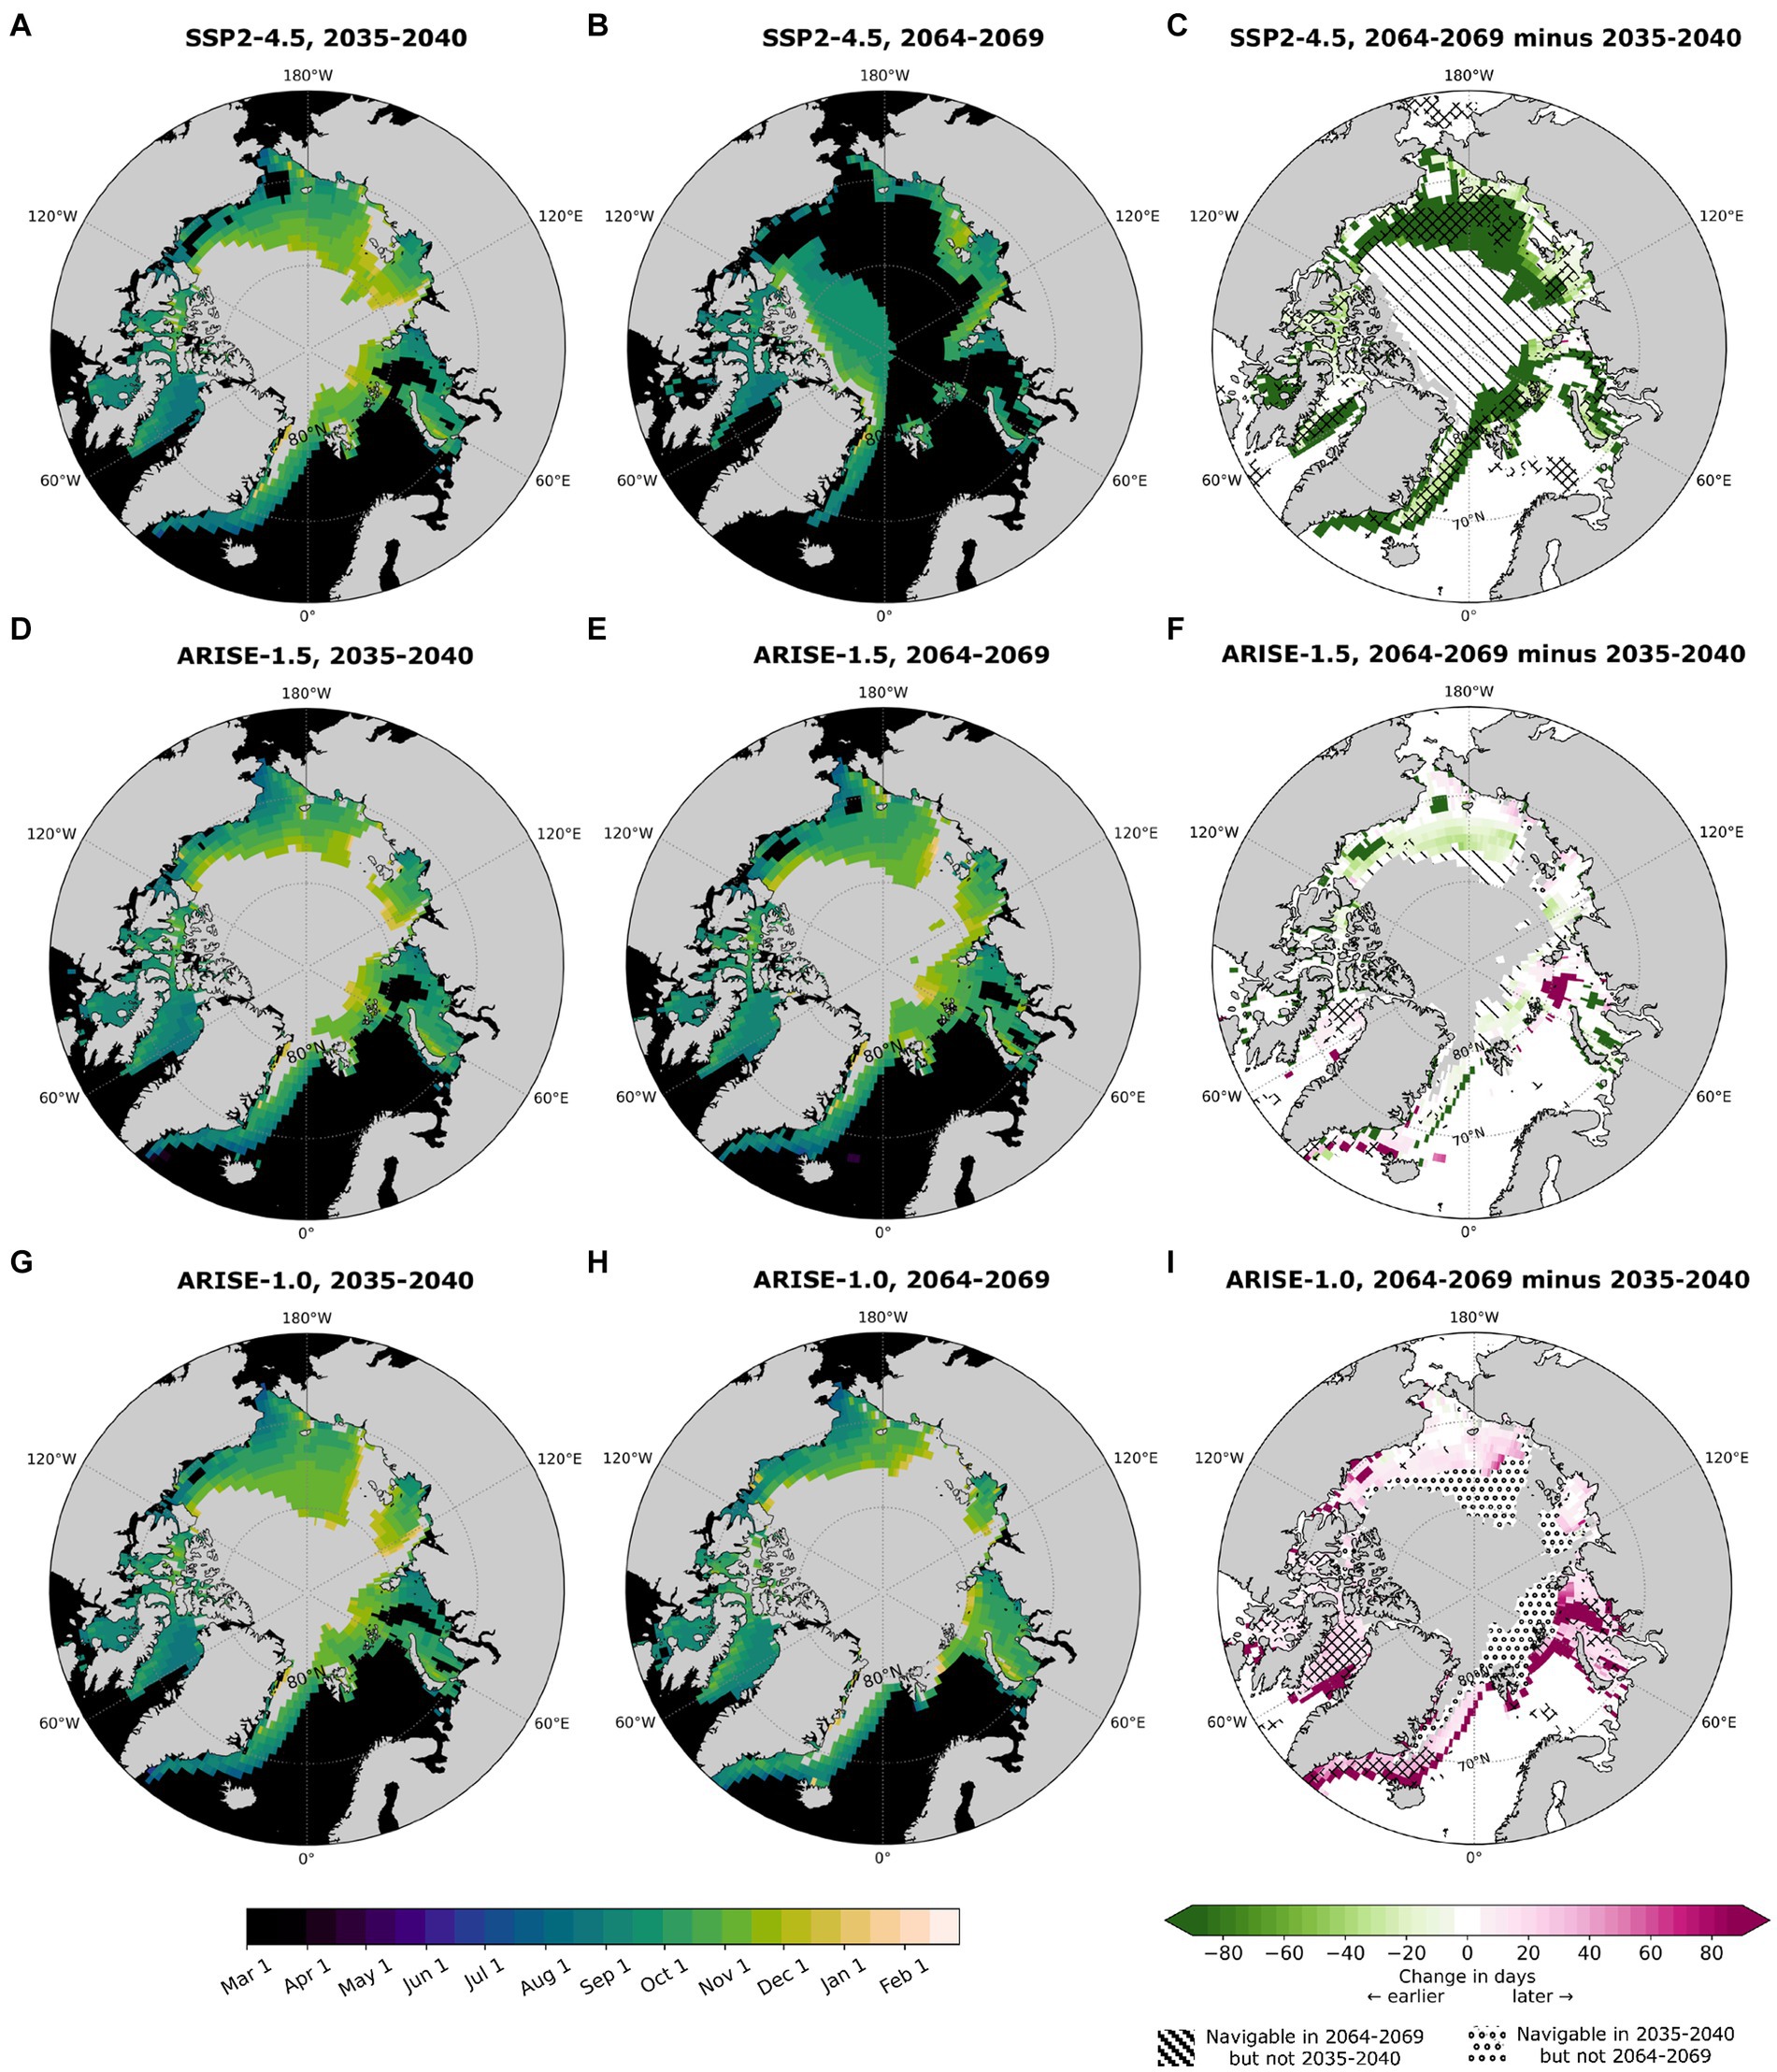
Figure 6. The first date when a grid cell is navigable for at least 30 consecutive days for Polar Class 6 vessels in (A) SSP2-4.5 2035–2040, (B) SSP2-4.5 2064–2069, (C) SSP2-4.5 2064–2069 minus 2035–2040, (D) ARISE-1.5 2035–2040, (E) ARISE-1.5 2064–2069, (F) ARISE-1.5 2064–2069 minus 2035–2040, (G) ARISE-1.0 2035–2040, (H) ARISE-1.0, 2064–2069, and (I) ARISE-1.0 2064–2069 minus 2035–2040. Striped (dotted) cells in the rightmost column are where there were not at least 30 consecutive navigable days in 2035–2040 (2064–2069) but were in 2064–2069 (2035–2040), respectively. In the rightmost column, hatched regions indicate that at least 80% of ensemble members agree on the sign of change.
Over time in SSP2-4.5, more of the Arctic is either persistently navigable in March, or the date consolidates around the beginning of September when sea ice is at its annual minimum extent (Figure 6B). The area that is persistently navigable in ARISE-1.5 increases by 0.7 million km2 and expands poleward, and some grid cells that were persistent starting in September are persistent in August by 2065–2069 (Figure 6E). ARISE-1.0 experiences the opposite trend: persistently navigable areas shrink between 2035–2039 and 2065–2069, and parts of the Kara Sea that were navigable starting in January are not persistently navigable until August.
Maps in the rightmost column quantify changes in the first persistently navigable date. Striped grid cells were never persistently navigable in 2035–2039 but then will become so in 2065–2069. Conversely, dotted grid cells are persistently navigable in 2035–2039 but are not in 2065–2069. In SSP2-4.5 (Figure 6C) and ARISE-1.5 (Figure 6F), some regions become persistently navigable by 2065–2069 but that “newly” persistent area is much larger in SSP2-4.5 than in ARISE-1.5. ARISE-1.0 only delays the date when a grid cell is persistently navigable or loses it altogether (pink and dotted regions, Figure 6H). Between 2035–2039 and 2065–2069, ARISE-1.0 loses 2.1 million km2 of persistently navigable area.
There are very few regions where the Arctic Ocean is persistently navigable for OW vessels (Figure 7). Anywhere with fewer than 30 total navigable days cannot, by our definition, be persistently navigable. Poleward of 78°N is never persistently navigable for any simulation, but in 2035–2039, some marginal seas become so between June and September in SSP2-4.5 (Figure 7A) and between June and November for both ARISE simulations (Figures 7D,G). The Barents and Chukchi Seas and parts of the East Siberian Sea become persistently navigable in 2065–2069 in SSP2-4.5 in September or October when sea ice is at its lowest extent or beginning to refreeze (Figure 7B).
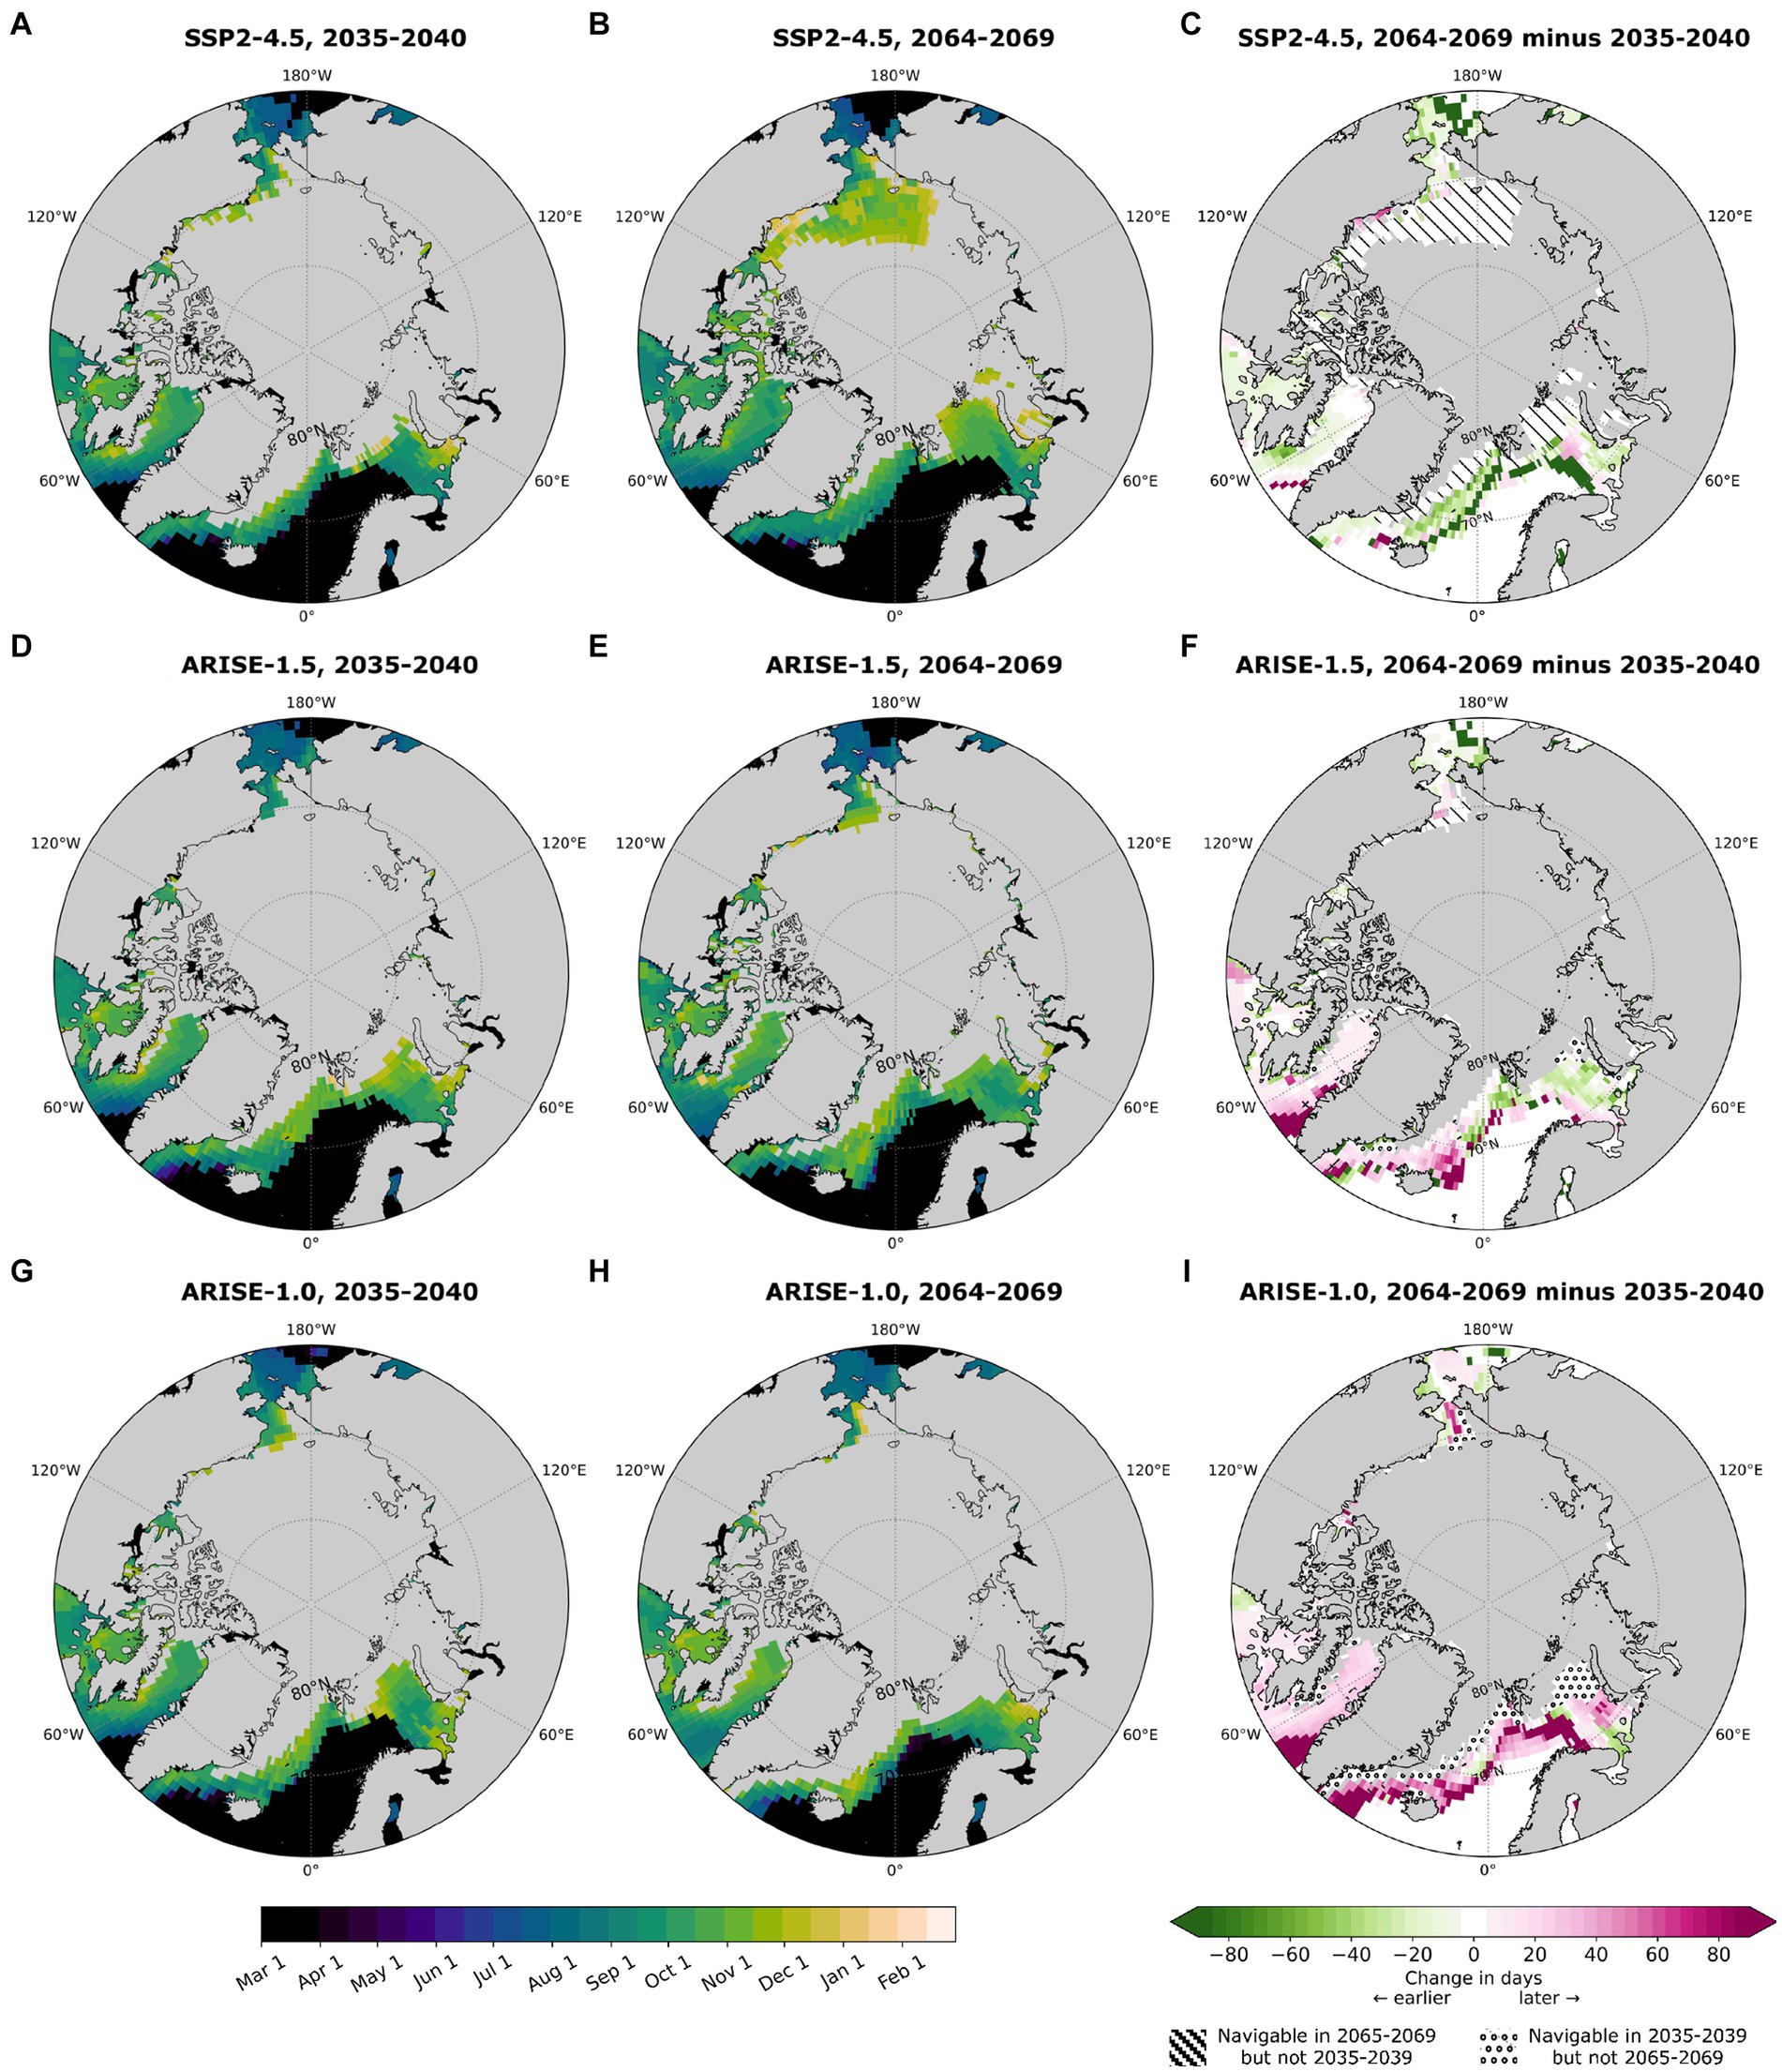
Figure 7. As in Figure 6 except for open water vessels.
There are regional shifts in the timing of the first persistently navigable day in ARISE-1.5. Unlike PC6 vessels, there are both dashed and some dotted grid cells along the sea ice edge. There is little change in the area poleward of 60°N that is persistently navigable in ARISE-1.5 (<0.1 million km2). The areas that are persistently navigable for OW vessels in ARISE-1.0 move south away from the central Arctic Ocean (Figure 7G). SAI has less effect on navigability persistence for OW vessels than for PC6 because very little of the Arctic Ocean is persistently navigable for OW vessels in any simulation.
Finally, we show how projected sea ice changes may affect optimal Arctic Ocean routes and the shortest time to complete a trip. Figure 8 displays the fastest safe routes for PC6 ships between Blanc-Sablon, Canada, or Rotterdam, the Netherlands, and the Bering Strait. The lines represent the fastest completed route, with overlapping lines indicating repeated routes. All three traditional Arctic shipping routes—the NSR, TSR, and NWP—are utilized in all the simulations. In all simulations, sea ice is thin enough for PC6 ships to take the TSR instead of a longer route closer to the coast. In SSP2-4.5, the optimal safe route expands poleward from the NWP and NSR into the central Arctic Ocean. A similar poleward movement of optimal routes also occurs in ARISE-1.5, though not to the same extent as in SSP2-4.5. There are fewer overall trips in ARISE-1.0 (Figure 8C), and the optimal routes do not expand poleward as they do under the other scenarios. Since sea ice is thinnest in the Kara, Laptev, and East Siberian Seas throughout the entire 35-year simulations (Figure 2), the NSR is the most accessible of the three traditional Arctic routes as it is in the current climate. Ships can safely travel through the NWP in some months in all simulations; most paths under SSP2-4.5 follow a shorter route through the M’Clure Strait instead of a more southern route through the Victoria Strait and Amundsen Gulf.
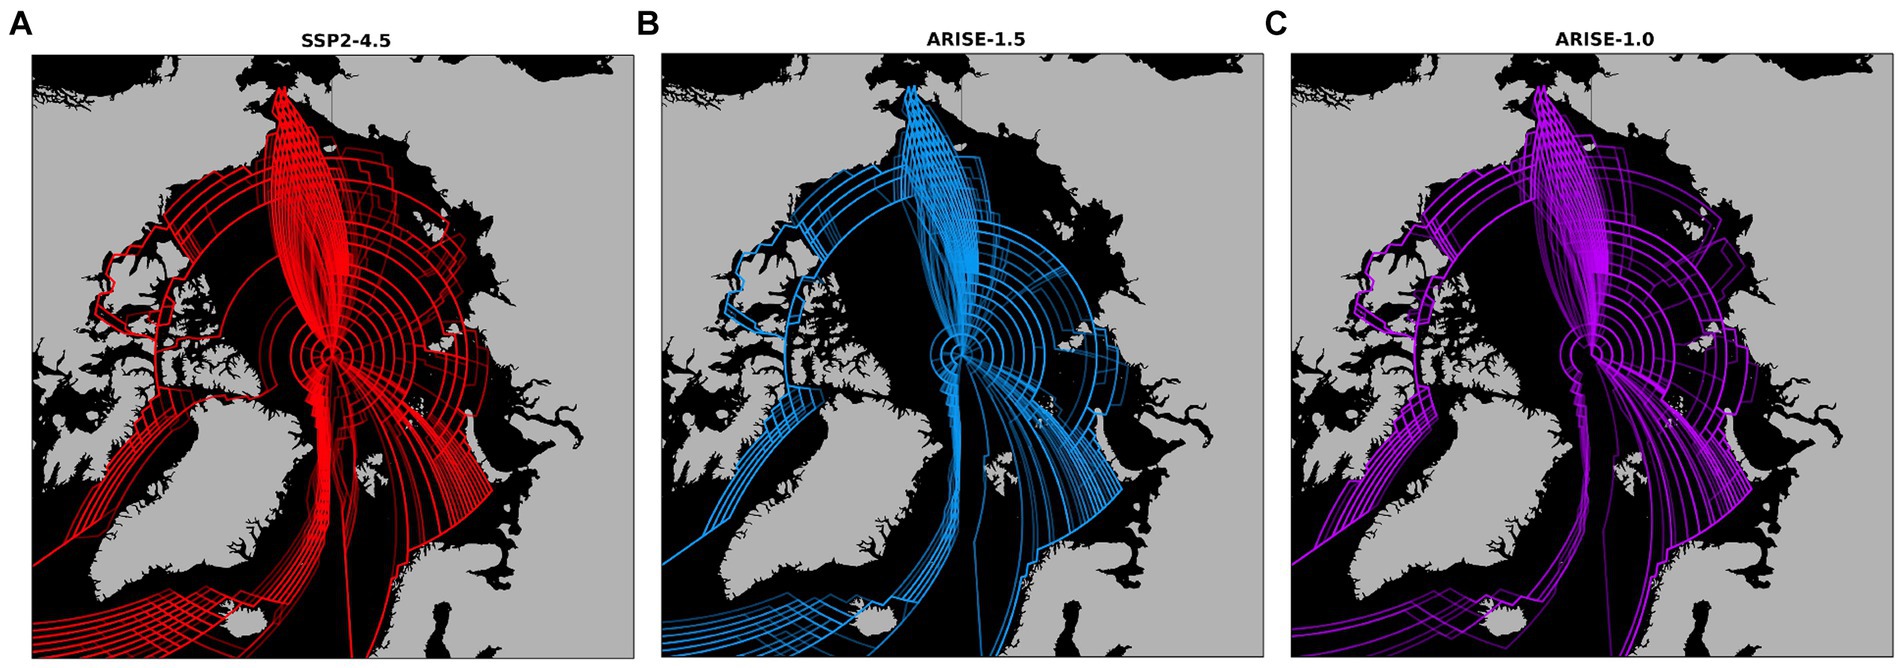
Figure 8. Maps of the fastest safe routes between either Blanc-Sablon, Canada, or Rotterdam, Netherlands, to the Bering Strait in (A) SSP2-4.5 (red lines), (B) ARISE-1.5 (blue lines), and (C) ARISE-1.0 (purple lines). Each line represents the fastest route for a single month. Route calculations are attempted for every month from January 2035 to December 2069. Not every month has a safe route.
Although the fastest routes often follow similar paths in all simulations, there is a wide range in the number of completed trips. Of the 420 total possible trips from each origin point (i.e., one trip a month for 35 years), 314 (75%) from Blanc-Sablon and 321 (76%) from Rotterdam are completed in SSP2-4.5, 240 (57%) from Blanc-Sablon, 246 (59%) from Rotterdam are completed in ARISE-1.5, and 214 (51%) from Blanc-Sablon and 226 (54%) from Rotterdam are completed in ARISE-1.0. While ships can traverse the TSR in all simulations, far more trips following the TSR are completed in SSP2-4.5 than in the ARISE simulations. There are 116 completed TSR trips in SSP2-4.5 (Figure 8A), and 56 and 45 in ARISE-1.5 (Figure 8B) and ARISE-1.0 (Figure 8C), respectively.
The time to complete the shortest route varies greatly by month and simulation. We show the shortest trip time based on ensemble mean monthly mean sea ice thickness in January, July, and September in Figure 9. The shortest trip times for all months are shown in Supplementary Figures S2, S3. The dotted line at 30 days indicates the threshold for when a potential trip across the Arctic Ocean becomes faster than a potential trip using a lower-latitude shipping route. Range bars around the markers show the range of fastest successful trips in individual ensemble members, with the lower bar showing the shortest successful trip and the upper bar showing the longest successful trip. Range bars are only shown when there is a successful trip in at least 80% of a simulation’s ensemble members.
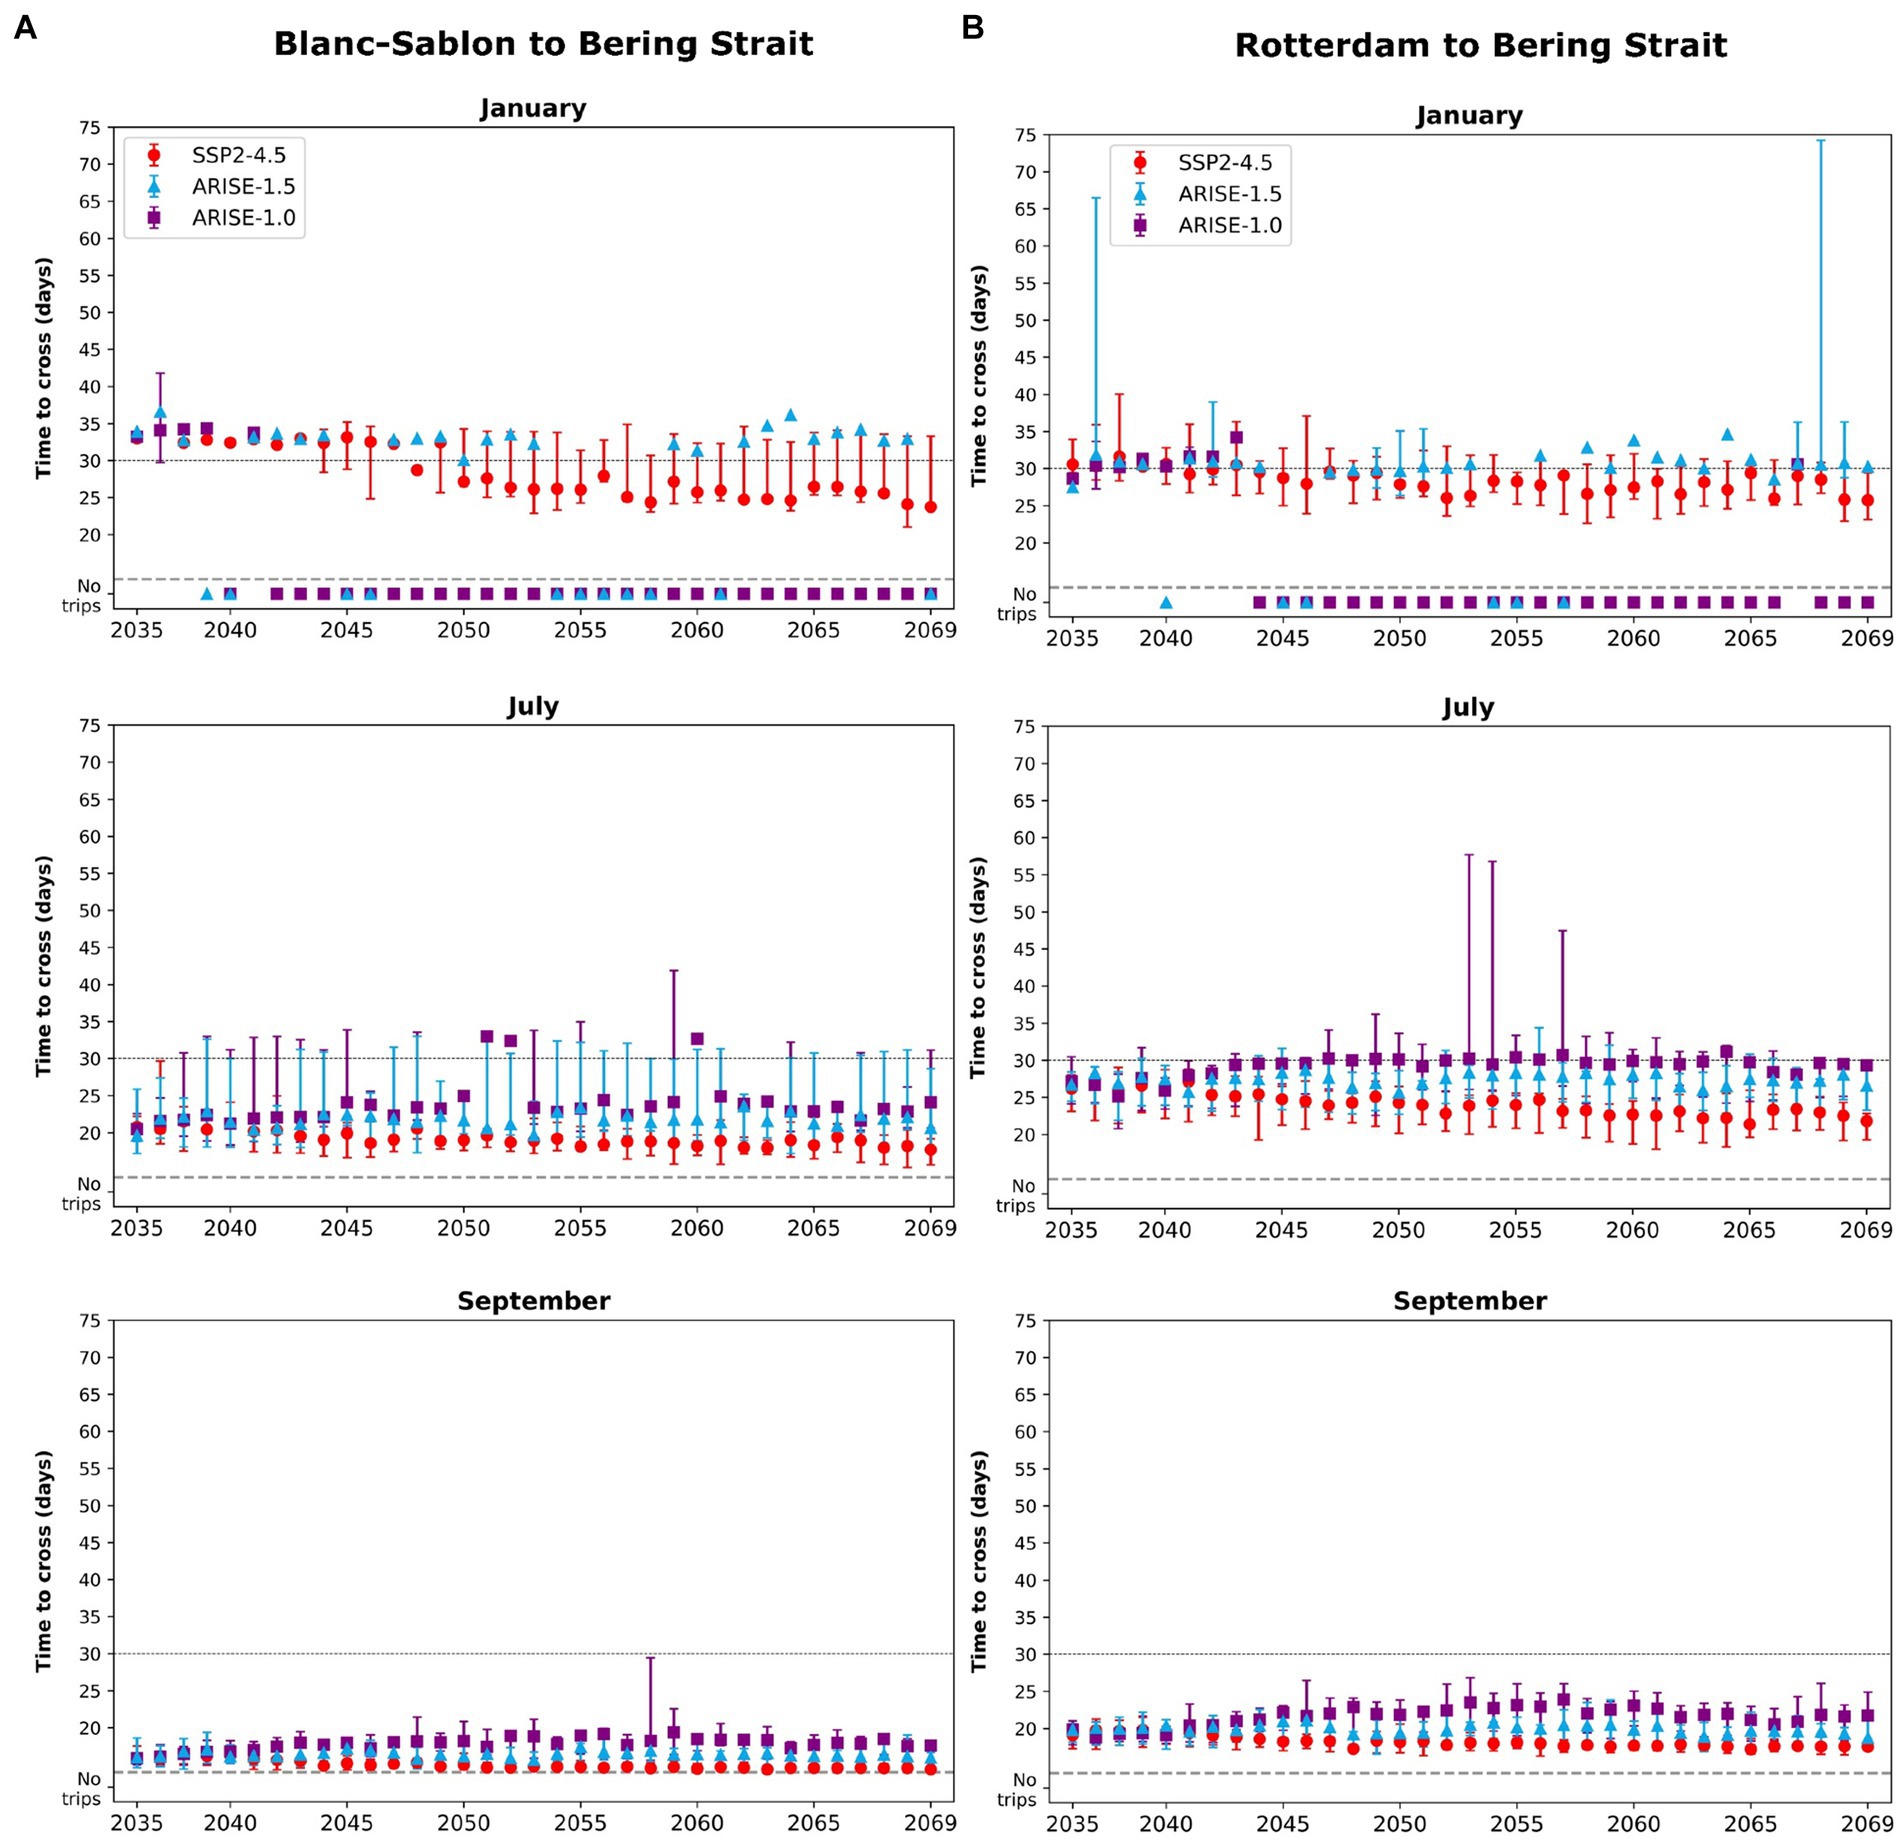
Figure 9. Time in days to cross the fastest safe route (Figure 8) in January, July, and September from (A) Blanc-Sablon, Canada, and (B) Rotterdam, the Netherlands, to the Bering Strait, 2035–2069. Red dots are SSP2-4.5; blue triangles are ARISE-1.5; and purple squares are ARISE-1.0. Markers show the trip time based on monthly mean ensemble mean sea ice conditions. The range bars around the markers indicate the range of the shortest to the longest travel times in individual ensemble members. Range bars are only shown if there was a successful trip in at least 80% of a simulation’s ensemble members. “No trips” means there is no safe path during a certain month. The dotted line at 30 days indicates when the fastest safe route across the Arctic Ocean may be faster than a lower-latitude route.
In January, PC6 vessels can safely complete both routes for the first 3 years in all simulations, but by 2038, there is no consistent safe route after SAI deployment. By the 2040s, ships would have no safe route in ARISE-1.0 from Blanc-Sablon (Figure 9A) or from Rotterdam (Figure 9B), and the trips that are completed almost always take longer than 30 days. In addition, there is no robust agreement between the ARISE-1.0 ensemble members that a safe trip is possible from either Blanc-Sablon or Rotterdam in January (note the lack of range bars approximately most of the ARISE-1.0 markers). Ships are more likely to complete both routes in January in ARISE-1.5, but travel times range from ∼30 to 37 days from Blanc-Sablon and ∼29 to 35 days from Rotterdam. By the 2060s, travel times are highly variable in ARISE-1.5, and there are some years when no safe trip is possible. As in ARISE-1.0, there is not robust ensemble member agreement that a safe trip is possible from Blanc-Sablon (Figure 9A). There is year-to-year variability in SSP2-4.5 travel times as well, but overall travel time decreases from 2035 to 2069. The travel time from Blanc-Sablon decreases by roughly 9 days, and the travel time from Rotterdam decreases by roughly 4 days. By the 2050s, a trip in ARISE-1.5 always takes longer than the same trip in SSP2-4.5. Even the upper range of travel time for a trip in SSP2-4.5 is often shorter or roughly the same as the ensemble mean travel time for the same trip in ARISE-1.5. By the 2060s, a ship can complete a trip from Blanc-Sablon an average of ∼8 days faster in SSP2-4.5 than in ARISE-1.5, and ∼4 days faster from Rotterdam.
Every year, there is a safe route from both origin points in July in all simulations in the ensemble mean. July travel times for both SAI simulations are very similar for the first 5 years but then diverge. Travel times in ARISE-1.0 from the Blanc-Sablon plateau are near 24 days, with the exception of a few outlier years when the time increases by more than a week from the previous year; in those years, a ship may be moving very slowly or taking detours around thick ice. There are no outlier years from Rotterdam. Even though there is a safe route from both origin points every year in the ensemble mean, however, in many years, there is not a safe route for at least 80% of ARISE-1.0 ensemble members. This is in contrast with ARISE-1.5, where ensemble members are in robust agreement that there is a safe route every year. Travel times in ARISE-1.5 are less variable in July than in January, that is, the ARISE-1.5 ensemble mean travel times for July are fairly consistent: the standard deviation is <1 day for both routes. There is more interannual variability in the range of travel times in ARISE-1.5 ensemble members, and occasionally, the upper range of travel times exceeds 30 days even though the ensemble mean travel time is always shorter than 30 days. By the 2040s, the ARISE-1.5 travel times from Blanc-Sablon and Rotterdam are always longer than travel times in SSP2-4.5. SSP2-4.5 travel times from Rotterdam decrease over time, while travel times from the Blanc-Sablon plateau approximately 18 days by 2055. Even the upper range of SSP2-4.5 travel times does not exceed 30 days.
In September, when sea ice is at its annual minimum extent, travel times still increase slightly in ARISE-1.0. Travel times increase for 10 years and then generally plateau, coinciding with sea ice thickness recovery time (Figure 3). SSP2-4.5 September travel times decrease and then plateau, indicating that ∼15 days (Blanc-Sablon to Bering Strait) and ∼18 days (Rotterdam to Bering Strait) is the fastest a PC6 vessel can make those trips within AIRSS speed parameters. SAI appears to have the least influence on September travel times because the spread of times between the three simulations is the smallest. From Blanc-Sablon, the spread in average travel times is ∼3 days, and from Rotterdam, the spread is ∼4 days. The range of travel times in individual ensemble members also overlaps between all three simulations, again showing that SAI does not substantially change travel time compared to SSP2-4.5. Even though travel times do increase slightly from 2035 to 2069 under SAI, the travel times are all less than 30 days, indicating it may still be advantageous to use Arctic shipping routes instead of lower-latitude routes in September.
The projected increases in navigability, the opening of the Transpolar Route, and the shortening of travel times across the Arctic Ocean in a non-SAI world are consistent with previous studies (Melia et al., 2016; Wei et al., 2020). However, this is the first study to compare how different SAI strategies may affect future Arctic shipping feasibility compared to a future without SAI. We find that ARISE-1.5 maintains sea ice conditions near 2035 levels, with very small regional changes to both annual mean sea ice concentration (Figure 1F) and thickness (Figures 2F, 3) over the 35-year simulation. In ARISE-1.0, with a lower temperature target, sea ice recovers close to 2020 levels in the model. As a result, there are only small changes in navigable days and travel time in ARISE-1.5 compared to SSP2-4.5 but substantially reduced navigability in ARISE-1.0 compared to SSP2-4.5. In some years, it is safe to transit the Arctic Ocean under ARISE-1.5 but not under ARISE-1.0, showing that the future of Arctic shipping after SAI is highly dependent on the particular SAI strategy. This is consistent with findings that show that the Arctic sea ice response to SAI is also highly dependent on the SAI temperature goals, injection latitudes and aerosol volume (Lee et al., 2023), injection timing (Lee et al., 2021), and injection altitude and background forcing scenario (Jones et al., 2018).
Even in today’s climate, the Arctic Ocean is an unpredictable place because of regional and interannual variability in sea ice, making it difficult to predict if an entire route will be open when a ship starts traveling. Sea ice is sensitive to temperature (Olonscheck et al., 2019), synoptic activity (Mills and Walsh, 2014; Wettstein and Deser, 2014), and storms (Graham et al., 2019), thus a reduction in navigability under SAI may only exacerbate the unpredictability. Shipping companies may be far less likely to consider Arctic shipping routes if a route is open for 1 year but closed the next (Figure 9). Arctic routes may also become less attractive as alternatives to the Suez and Panama Canals if there is a large range in travel times even along the same route and companies may not know when their cargo will get to its destination.
Although sea ice conditions are a crucial component of determining whether the Arctic is safe for ship travel, they are not the only consideration. In this study, as with many studies on future Arctic navigability (e.g., Smith and Stephenson, 2013; Wei et al., 2020; Zhang et al., 2023), we do not include meteorological conditions such as fogginess (Song et al., 2023) or hazards such as wave height (Casas-Prat and Wang, 2020) that reduces navigability. We also do not include any local sea ice responses to shifting ship traffic or new governance from Indigenous communities about Arctic access (Huntington et al., 2023). All of the above factors may reduce PC6 and OW vessels’ abilities to safely navigate the Arctic Ocean. In addition, the accuracy of projected sea ice thickness affects the accuracy of projected navigation risk. Anomalously thick ice along parts of the NWP (Henke et al., 2023) may lead to an underestimation of ships’ ability to travel through this region.
SAI may be deployed for a variety of reasons and preserving Arctic sea ice could be one of them. Since SAI is currently only deployed in climate models, there are likely to be additional unintended consequences of SAI that models do not predict (see, e.g., Robock et al., 2009; Tracy et al., 2022; Wunderlin et al., 2024). While we only focus on whether Arctic shipping could be possible after SAI due to changes in sea ice conditions, it is important to consider both potential benefits and risks arising from climate intervention relative to the Arctic changes caused by climate change.
Overall, we show that deploying SAI in an effort to stabilize or reduce global mean temperatures may lead to increasing Arctic sea ice concentration and thickness relative to a non-SAI world. Increasing sea ice thickness relative to a non-SAI future leads to a reduction in navigable days across most of the Arctic Ocean in ARISE-1.0. There is a small increase in the total number of navigable days in ARISE-1.5. When compared with the large increase in navigable days and the reduction in travel times under SSP2-4.5, however, both SAI strategies greatly reduce the possibilities of safe and fast Arctic shipping. In other words, future Arctic shipping in an SAI world takes longer and is more hazardous than future Arctic shipping in a non-SAI world. This is apparent in the time it takes to travel from Blanc-Sablon, Canada, and Rotterdam, the Netherlands, across the Arctic Ocean to the Bering Strait. From July to January, the shortest travel time for each route decreases from 2035 to 2069 in SSP2-4.5 but either increases or remains relatively constant in the SAI scenarios. In some years, the Arctic is accessible every month in SSP2-4.5, but there are no safe paths across the Arctic Ocean for PC6 ships in either SAI simulation. Even when a safe path exists in the ARISE-SAI simulations’ ensemble means, there may not be robust agreement that a safe path exists in at least 80% of individual ensemble members. Our results provide new insights into how global climate intervention strategies may affect Arctic sea ice and the feasibility of Arctic Ocean shipping.
Unprocessed monthly and daily mean sea ice data for the ARISE-SAI-1.5 and SSP2-4.5 simulations are publicly available online from Richter et al. (2022) and Mills et al. (2022), respectively. All Python code is available on Zenodo from Morrison (2024).
AM: Conceptualization, Formal analysis, Investigation, Methodology, Visualization, Writing – original draft, Writing – review & editing. DP: Conceptualization, Formal analysis, Investigation, Writing – review & editing. EB: Funding acquisition, Resources, Supervision, Writing – review & editing. JH: Funding acquisition, Resources, Supervision, Writing – review & editing.
The author(s) declare that financial support was received for the research, authorship, and/or publication of this article. ALM, EAB, and JWH were supported, in part, by a grant from Quadrature Climate Foundation and also supported, in part, by the Defense Advanced Research Projects Agency Grant HR00112290071. The views expressed here do not necessarily reflect the positions of the U.S. government. DP was supported by the National Science Foundation (NSF) Research Experience for Undergraduates (REU) program at Colorado State University, Grant No. 1950172.
We thank B. Dobbins and J. Richter for providing the ARISE-SAI-1.0 data and W. Maslowski for helpful comments on calculating the shortest routes using sea ice thickness categories.
The authors declare that the research was conducted in the absence of any commercial or financial relationships that could be construed as a potential conflict of interest.
All claims expressed in this article are solely those of the authors and do not necessarily represent those of their affiliated organizations, or those of the publisher, the editors and the reviewers. Any product that may be evaluated in this article, or claim that may be made by its manufacturer, is not guaranteed or endorsed by the publisher.
The Supplementary material for this article can be found online at: https://www.frontiersin.org/articles/10.3389/fclim.2024.1426679/full#supplementary-material
Aksenov, Y., Popova, E. E., Yool, A., Nurser, A. J. G., Williams, T. D., Bertino, L., et al. (2017). On the future navigability of Arctic Sea routes: high-resolution projections of the Arctic Ocean and sea ice. Mar. Policy 75, 300–317. doi: 10.1016/j.marpol.2015.12.027
Bensassi, S., Stroeve, J. C., Martínez-Zarzoso, I., and Barrett, A. P. (2016). Melting ice, growing trade? Elem. Sci. Anth. 4:000107. doi: 10.12952/journal.elementa.000107
Berdahl, M., Robock, A., Ji, D., Moore, J. C., Jones, A., Kravitz, B., et al. (2014). Arctic cryosphere response in the geoengineering model Intercomparison project G3 and G4 scenarios. J. Geophys. Res. Atmos. 119, 1308–1321. doi: 10.1002/2013JD020627
Casas-Prat, M., and Wang, X. L. (2020). Sea ice retreat contributes to projected increases in extreme Arctic Ocean surface waves. Geophys. Res. Lett. 47, 2020–088100. doi: 10.1029/2020GL088100
Chen, J., Kang, S., Du, W., Guo, J., Xu, M., Zhang, Y., et al. (2021). Perspectives on future sea ice and navigability in the Arctic. Cryosphere 15, 5473–5482. doi: 10.5194/tc-15-5473-2021
Copland, L., Dawson, J., Tivy, A., Delaney, F., and Cook, A. (2021). Changes in shipping navigability in the Canadian Arctic between 1972 and 2016. Facets 6, 1069–1087. doi: 10.1139/facets-2020-0096
Danabasoglu, G., Bates, S. C., Briegleb, B. P., Jayne, S. R., Jochum, M., Large, W. G., et al. (2012). The CCSM4 ocean component. J. Clim. 25, 1361–1389. doi: 10.1175/JCLI-D-11-00091.1
Danabasoglu, G., Lamarque, J.-F., Bacmeister, J., Bailey, D. A., DuVivier, A. K., Edwards, J., et al. (2020). The Community earth system model version 2 (CESM2). J. Adv. Model. Earth Syst. 12, 2019–001916. doi: 10.1029/2019MS001916
Duffey, A., Irvine, P., Tsamados, M., and Stroeve, J. (2023). Solar geoengineering in the polar regions: A review. Earth’s Future 11:e2023EF003679. doi: 10.1029/2023EF003679
DuVivier, A. (2018). CICE-consortium documentation release 6.0.0.Alpha. Available at: https://cice-consortium-cice.Readthedocs.io/downloads/en/cice6.0.0.Alpha/pdf/ (Accessed January 10, 2024).
DuVivier, A. K., Holland, M. M., Kay, J. E., Tilmes, S., Gettelman, A., and Bailey, D. A. (2020). Arctic and Antarctic Sea ice mean state in the Community earth system model version 2 and the influence of atmospheric chemistry. J. Geophys. Res. Oceans 125, 2019–015934. doi: 10.1029/2019JC015934
Gettelman, A., Mills, M. J., Kinnison, D. E., Garcia, R. R., Smith, A. K., Marsh, D. R., et al. (2019). The whole atmosphere Community climate model version 6 (WACCM6). J. Geophys. Res. Atmos. 124, 12380–12403. doi: 10.1029/2019JD030943
Graham, R. M., Itkin, P., Meyer, A., Sundfjord, A., Spreen, G., Smedsrud, L. H., et al. (2019). Winter storms accelerate the demise of sea ice in the Atlantic sector of the Arctic Ocean. Sci. Rep. 9:9222. doi: 10.1038/s41598-019-45574-5
Henke, M., Cassalho, F., Miesse, T., Ferreira, C. M., Zhang, J., and Ravens, T. M. (2023). Assessment of Arctic Sea ice and surface climate conditions in nine CMIP6 climate models. Arct. Antarct. Alp. Res. 55:2271592. doi: 10.1080/15230430.2023.2271592
Hueholt, D. M., Barnes, E. A., Hurrell, J. W., Richter, J. H., and Sun, L. (2023). Assessing outcomes in stratospheric aerosol injection scenarios shortly after deployment. Earth’s Future 11, 2023–003488. doi: 10.1029/2023EF003488
Hunke, E. C., Lipscomb, W. H., Turner, A. K., Jeffery, N., and Elliott, S. (2015). CICE: The Los Alamos Sea ice model documentation and software user’s manual version 5 (tech. rep. la-cc-06–012). Los Alamos, NM: Technical report, Los Alamos National Laboratory.
Hunke, E., Roberts, A., D’Angelo, G., Verma, T., Chen, M., Dann, J., et al. (2019). Ldrd 20190608er: Diagnosing near-future changes in Arctic Sea ice and ocean conditions. Los Alamos, NM: Technical report, Los Alamos National Laboratory.
Huntington, H. P., Olsen, J., Zdor, E., Zagorskiy, A., Shin, H. C., Romanenko, O., et al. (2023). Effects of Arctic commercial shipping on environments and communities: context, governance, priorities. Transp. Res. Part D: Transp. Environ. 118:103731. doi: 10.1016/j.trd.2023.103731
IMO (2002). Guidelines for ships operating in Arctic ice-covered waters. London: International Maritime Organization Available at: https://www.gc.noaa.gov/documents/gcil1056-MEPC-Circ399.pdf.
Jiang, J., Cao, L., MacMartin, D. G., Simpson, I. R., Kravitz, B., Cheng, W., et al. (2019). Stratospheric sulfate aerosol geoengineering could alter the high-latitude seasonal cycle. Geophys. Res. Lett. 46, 14153–14163. doi: 10.1029/2019GL085758
Johnston, M. E., and Timco, G. W. (2008). Understanding and identifying old ice in summer. Technical report, National Research Council Canada, Canadian Hydraulics Centre, Transport Canada, Ottawa. Report CHC-TR-055.
Jones, A. C., Hawcroft, M. K., Haywood, J. M., Jones, A., Gu, X., and Moore, J. C. (2018). Regional climate impacts of stabilizing global warming at 1.5 K using solar geoengineering. Earth’s Future 6, 230–251. doi: 10.1002/2017EF000720
Keen, A., Blockley, E., Bailey, D. A., Debernard, J. B., Bushuk, M., Delhaye, S., et al. (2021). An intercomparison of the mass budget of the Arctic Sea ice in CMIP6 models. Cryosphere 15, 951–982. doi: 10.5194/tc-15-951-2021
Kravitz, B., MacMartin, D. G., Mills, M. J., Richter, J. H., Tilmes, S., Lamarque, J.-F., et al. (2017). First simulations of designing stratospheric sulfate aerosol geoengineering to meet multiple simultaneous climate objectives. J. Geophys. Res. Atmos. 122, 12616–12634. doi: 10.1002/2017JD026874
Lasserre, F. (2014). Case studies of shipping along Arctic routes. Analysis and profitability perspectives for the container sector. Transp. Res. A Policy Pract. 66, 144–161. doi: 10.1016/j.tra.2014.05.005
Lee, W. R., MacMartin, D. G., Visioni, D., and Kravitz, B. (2021). High-latitude stratospheric aerosol geoengineering can be more effective if injection is limited to spring. Geophys. Res. Lett. 48:e2021GL092696. doi: 10.1029/2021GL092696
Lee, W. R., MacMartin, D. G., Visioni, D., Kravitz, B., Chen, Y., Moore, J. C., et al. (2023). High-latitude stratospheric aerosol injection to preserve the Arctic. Earth’s Future 11:e2022EF003052. doi: 10.1029/2022EF003052
Li, X., Stephenson, S. R., Lynch, A. H., Goldstein, M. A., Bailey, D. A., and Veland, S. (2021). Arctic shipping guidance from the CMIP6 ensemble on operational and infrastructural timescales. Clim. Chang. 167, 1–9. doi: 10.1007/s10584-021-03172-3
MacMartin, D. G., Kravitz, B., Keith, D. W., and Jarvis, A. (2014). Dynamics of the coupled human-climate system resulting from closed-loop control of solar geoengineering. Clim. Dyn. 43, 243–258. doi: 10.1007/s00382-013-1822-9
Maersk (2023). A short guide on ocean freight transit times. Available at: https://www.maersk.com/logistics-explained/transportation-and-freight/2023/09/27/sea-freight-guide (Accessed October 2, 2023).
Matthews, H. D., and Wynes, S. (2022). Current global efforts are insufficient to limit warming to 1.5°C. Science 376, 1404–1409. doi: 10.1126/science.abo3378
Meier, W. N., and Stroeve, J. (2022). An updated assessment of the changing Arctic Sea ice cover. Oceanography 35, 10–19. doi: 10.5670/oceanog.2022.114
Melia, N., Haines, K., and Hawkins, E. (2016). Sea ice decline and 21st century trans-Arctic shipping routes. Geophys. Res. Lett. 43, 9720–9728. doi: 10.1002/2016GL069315
Mills, M., Visioni, D., and Richter, J. H. (2022). CESM2 model output CESM2-WACCM6-SSP245. NCAR Available at: https://www.earthsystemgrid.org/dataset/ucar.cgd.cesm2.waccm6.ssp245.html (Accessed June 15, 2023).
Mills, C. M., and Walsh, J. E. (2014). Synoptic activity associated with sea ice variability in the Arctic. J. Geophys. Res. Atmos. 119, 12117–12131. doi: 10.1002/2014JD021604
Min, C., Yang, Q., Chen, D., Yang, Y., Zhou, X., Shu, Q., et al. (2022). The emerging Arctic shipping corridors. Geophys. Res. Lett. 49, 2022–099157. doi: 10.1029/2022GL099157
Morrison, A. L. (2024). Code for “projected changes to Arctic shipping routes after stratospheric aerosol deployment in the ARISE-SAI scenarios” : Zenodo Available at: https://zenodo.org/records/13372695 (Accessed August 26, 2024).
Mudryk, L. R., Dawson, J., Howell, S. E. L., Derksen, C., Zagon, T. A., and Brady, M. (2021). Impact of 1, 2 and 4°C of global warming on ship navigation in the Canadian Arctic. Nat. Clim. Chang. 11, 673–679. doi: 10.1038/s41558-021-01087-6
National Academies of Sciences, Engineering, and Medicine (2021). Reflecting sunlight: recommendations for solar geoengineering research and research governance. Washington, DC: The National Academies Press.
Notz, D.SIMIP Community (2020). Arctic Sea ice in CMIP6. Geophys. Res. Lett. 47, 2019–086749. doi: 10.1029/2019GL086749
Notz, D., and Stroeve, J. (2018). The trajectory towards a seasonally ice-free Arctic Ocean. Curr. Clim. Chang. Rep. 4, 407–416. doi: 10.1007/s40641-018-0113-2
O’Neill, B. C., Tebaldi, C., Vuuren, D. P., Eyring, V., Friedlingstein, P., Hurtt, G., et al. (2016). The scenario model intercomparison project (ScenarioMIP) for CMIP6. Geosci. Model Dev. 9, 3461–3482. doi: 10.5194/gmd-9-3461-2016
Olonscheck, D., Mauritsen, T., and Notz, D. (2019). Arctic Sea-ice variability is primarily driven by atmospheric temperature fluctuations. Nat. Geosci. 12, 430–434. doi: 10.1038/s41561-019-0363-1
Parkinson, C. L., and Digirolamo, N. E. (2021). Sea ice extents continue to set new records: Arctic, Antarctic, and global results. Remote Sens. Environ. 267:112753. doi: 10.1016/j.rse.2021.112753
Rantanen, M., Karpechko, A. Y., Lipponen, A., Nordling, K., Hyvarinen, O., Ruosteenoja, K., et al. (2022). The Arctic has warmed nearly four times faster than the globe since 1979. Commun. Earth Environ. 3, 1–10. doi: 10.1038/s43247-022-00498-3
Riahi, K., Vuuren, D. P., Kriegler, E., Edmonds, J., O’Neill, B. C., Fujimori, S., et al. (2017). The shared socioeconomic pathways and their energy, land use, and greenhouse gas emissions implications: an overview. Glob. Environ. Chang. 42, 153–168. doi: 10.1016/j.gloenvcha.2016.05.009
Richter, J. H. (2022). CESM2 model output ARISE-SAI-1.5 dataset. NCAR Available at: https://www.earthsystemgrid.org/dataset/ucar.cgd.ccsm4.ARISE-SAI-1.5.html (Accessed June 15, 2023).
Richter, J. H., Visioni, D., MacMartin, D. G., Bailey, D. A., Rosenbloom, N., Dobbins, B., et al. (2022). Assessing responses and impacts of solar climate intervention on the earth system with stratospheric aerosol injection (ARISE-SAI): protocol and initial results from the first simulations. Geosci. Model Dev. 15, 8221–8243. doi: 10.5194/gmd-15-8221-2022
Robock, A., Marquardt, A., Kravitz, B., and Stenchikov, G. (2009). Benefits, risks, and costs of stratospheric geoengineering. Geophys. Res. Lett. 36:L19703. doi: 10.1029/2009GL039209
Schøyen, H., and Bráthen, S. (2011). The Northern Sea route versus the Suez Canal: cases from bulk shipping. J. Transp. Geogr. 19, 977–983. doi: 10.1016/j.jtrangeo.2011.03.003
Schröder, C., Reimer, N., and Jochmann, P. (2017). Environmental impact of exhaust emissions by Arctic shipping. Ambio 46, 400–409. doi: 10.1007/s13280-017-0956-0
Shen, Z., Duan, A., Li, D., and Li, J. (2021). Assessment and ranking of climate models in Arctic Sea ice cover simulation: from CMIP5 to CMIP6. J. Clim. 34, 3609–3627. doi: 10.1175/JCLI-D-20-0294.1
Shu, Q., Wang, Q., Song, Z., Qiao, F., Zhao, J., Chu, M., et al. (2020). Assessment of sea ice extent in CMIP6 with comparison to observations and CMIP5. Geophys. Res. Lett. 47, 2020–087965. doi: 10.1029/2020GL087965
Smith, R., Jones, P., Briegleb, B., Bryan, F., Danabasoglu, G., Dennis, J., et al. (2010). The parallel ocean program (POP) reference manual: Ocean component of the Community climate system model (CCSM) and Community earth system model (CESM).
Smith, L. C., and Stephenson, S. R. (2013). New trans-Arctic shipping routes navigable by midcentury. PNAS 110, 1191–1195. doi: 10.1073/pnas.1214212110
Somanathan, S., Flynn, P., and Szymanski, J. (2009). The Northwest Passage: a simulation. Transp. Res. A Policy Pract. 43, 127–135. doi: 10.1016/j.tra.2008.08.001
Song, S., Chen, Y., Chen, X., Chen, C., Li, K.-F., Tung, K.-K., et al. (2023). Adapting to a foggy future along trans-Arctic shipping routes. Geophys. Res. Lett. 50, 2022–102395. doi: 10.1029/2022GL102395
Stephenson, S. R., Smith, L. C., and Agnew, J. A. (2011). Divergent long-term trajectories of human access to the Arctic. Nat. Clim. Chang. 1, 156–160. doi: 10.1038/nclimate1120
Tilmes, S., Richter, J. H., Kravitz, B., MacMartin, D. G., Mills, M. J., and Simpson, I. R. (2018). CESM1(WACCM) stratospheric aerosol geoengineering large ensemble project. Bull. Am. Meteorol. Soc. 99, 2361–2371. doi: 10.1175/BAMS-D-17-0267.1
Timco, G. W., Gorman, B., Falkingham, J., and O’Connell, B. (2005). Scoping study: Ice information requirements for marine transportation of natural gas from the high Arctic. National Research Council Canada: Technical report, Climate Change Technology and Innovation Initiative Unconventional Gas Supply.
Tracy, S. M., Moch, J. M., Eastham, S. D., and Buonocore, J. J. (2022). Stratospheric aerosol injection may impact global systems and human health outcomes. Elem. Sci. Anth. 10:00047. doi: 10.1525/elementa.2022.00047
Transport Canada (1998). Arctic ice regime shipping system (AIRSS) standards. Ottawa, Ontario, Canada: Transport Canada.
United Nations Environment Programme (2023). Emissions gap report 2023: broken record – temperatures hit new highs, yet world fails to cut emissions (again). Nairobi: Technical report, United Nations Environment Programme.
Urrego-Blanco, J. R., Hunke, E. C., Urban, N. M., Jeffery, N., Turner, A. K., Langenbrunner, J. R., et al. (2017). Validation of sea ice models using an uncertainty-based distance metric for multiple model variables. J. Geophys. Res. Oceans 122, 2923–2944. doi: 10.1002/2016JC012602
Watts, M., Maslowski, W., Lee, Y. J., Kinney, J. C., and Osinksi, R. (2021). A spatial evaluation of Arctic Sea ice and regional limitations in CMIP6 historical simulations. J. Clim. 34, 6399–6420. doi: 10.1175/JCLI-D-20-0491.1
Wei, T., Yan, Q., Qi, W., Ding, M., and Wang, C. (2020). Projections of Arctic Sea ice conditions and shipping routes in the twenty-first century using CMIP6 forcing scenarios. Environ. Res. Lett. 15:104079. doi: 10.1088/1748-9326/abb2c8
Wettstein, J. J., and Deser, C. (2014). Internal variability in projections of twenty-first-century Arctic Sea ice loss: role of the large-scale atmospheric circulation. J. Clim. 27, 527–550. doi: 10.1175/JCLI-D-12-00839.1
Wunderlin, E., Chiodo, G., Sukhodolov, T., Vattioni, S., Visioni, D., and Tilmes, S. (2024). Side effects of sulfur-based geoengineering due to absorptivity of sulfate aerosols. Geophys. Res. Lett. 51:e2023GL107285. doi: 10.1029/2023GL107285
Keywords: sea ice, climate intervention, climate change, shipping, stratospheric aerosol injection, Arctic
Citation: Morrison AL, Pathak D, Barnes EA and Hurrell JW (2024) Projected changes to Arctic shipping routes after stratospheric aerosol deployment in the ARISE-SAI scenarios. Front. Clim. 6:1426679. doi: 10.3389/fclim.2024.1426679
Edited by:
David Docquier, Royal Meteorological Institute of Belgium, BelgiumReviewed by:
Ting Wei, China Meteorological Administration, ChinaCopyright © 2024 Morrison, Pathak, Barnes and Hurrell. This is an open-access article distributed under the terms of the Creative Commons Attribution License (CC BY). The use, distribution or reproduction in other forums is permitted, provided the original author(s) and the copyright owner(s) are credited and that the original publication in this journal is cited, in accordance with accepted academic practice. No use, distribution or reproduction is permitted which does not comply with these terms.
*Correspondence: Ariel L. Morrison, YXJpZWwubW9ycmlzb25AY29sb3N0YXRlLmVkdQ==
Disclaimer: All claims expressed in this article are solely those of the authors and do not necessarily represent those of their affiliated organizations, or those of the publisher, the editors and the reviewers. Any product that may be evaluated in this article or claim that may be made by its manufacturer is not guaranteed or endorsed by the publisher.
Research integrity at Frontiers
Learn more about the work of our research integrity team to safeguard the quality of each article we publish.