
95% of researchers rate our articles as excellent or good
Learn more about the work of our research integrity team to safeguard the quality of each article we publish.
Find out more
METHODS article
Front. Clim. , 16 January 2025
Sec. Climate and Decision Making
Volume 6 - 2024 | https://doi.org/10.3389/fclim.2024.1410329
This article is part of the Research Topic Addressing Climate Change Through Public Participation in Practice View all articles
 Jessica E. Christian1*
 Richard M. Buzard2
 Katie L. Spellman3
 Harper L. Baldwin1
 Reyce C. Bogardus1
 Jeanette Carlson4
 Gabe Dunham5
 Susan Flensburg1
 Roberta J. T. Glenn3Jacquelyn R. Overbeck6
 Chris V. Maio1
Arctic amplification of climate change has resulted in increased coastal hazards impacts to remote rural coastal communities in Alaska where conducting research can be difficult, requiring alternate methods for measuring change. The pilot program, Stakes for Stakeholders, was initially planned to be funded from 2016–2018. Upon project completion the work has shifted to individual community’s partnering with several agencies to continue the work. This research showcases a successful long-term community-based erosion monitoring program in two rural communities in Southwest Alaska. The resulting outputs from the workflow we developed were (1) locally prioritized data products, such as a hazard assessment report for Chignik Bay and (2) evaluation rubrics used to assess the suitability of future sites and the efficacy of the program. Our model of two-way communication, responsiveness to individual community needs, and attention to efficiency and effectiveness of the program workflow, can serve as a model for universities, for-profit, non-profit, Tribal, city, state, and federal research agencies and communities partnering to respond to global climate change.
Coastal hazards have increased worldwide because of global climate change, resulting in major environmental shifts with Arctic and sub-Arctic regions at the forefront (Cohen et al., 2014; Koenigk et al., 2020; Pörtner et al., 2022). Some of these changes include the decline of sea ice, increased flooding hazards and erosion, permafrost degradation, and sea- level rise (Manson and Solomon, 2007; Osterkamp, 2007; Sepp and Jaagus, 2011; Cazenave and Cozannet, 2014; Frey et al., 2015; Li et al., 2020; Bogardus, 2021; Magnan et al., 2022; Buzard et al., 2023). Alaska has warmed at a faster rate than the rest of the United States, resulting in warmer, longer summers; shorter, milder winters; and increased storm impacts, all of which are negatively impacting rural coastal communities (Melvin et al., 2017; Taylor et al., 2017; Berman and Schmidt, 2019). Approximately 83% of Alaska’s population resides along the coast, often in remote communities (National Oceanographic and Atmospheric Administration [NOAA], 2023).
The remoteness of these rural coastal communities and other environmental conditions (e.g., extreme cold and strong storms) raises challenges to conducting research in the region. Some of these challenges include fragile instrumentation during harsh winters, high cost of site visits, and the limited time frame to collect data in the snow-free months across the state of Alaska. The combination of these issues results in fragmented and incomplete data sets during a period that timely evidence is necessary to fuel informed decision-making that supports adaptation from coastal hazards. Despite the availability of extensive remote sensing data that span decades (Overbeck et al., 2020; Buzard et al., 2020; Buzard et al., 2021; Gibbs and Richmond, 2015; Gibbs et al., 2019), year-to-year erosion rate comparisons remain underexplored (Overbeck et al., 2020; Buzard et al., 2020; Buzard et al., 2021). More recently, communities and scientific agencies are interested in determining specific drivers of erosion and to identify annual and seasonal rate changes (García-Ruiz et al., 2017; Parven et al., 2022).
Community-Based Monitoring (CBM) has become an increasingly popular approach to address local needs through standardized environmental monitoring and fostering collaborations among Tribal organizations, state agencies, and academic institutions (Eicken et al., 2021; Eitzel et al., 2017; Tebes, 2005; Bronen et al., 2020; Buzard et al., 2023). However, 86% of Alaska Native villages report having experienced erosion and flooding, with 35% indicating significant environmental threats from hazards such as erosion, flooding, and permafrost thaw (Government Accountability Office [GAO], 2022; General Accounting Office [GAO], 2003). This vulnerability is exacerbated by the structural legacy of colonization, which has historically marginalized Indigenous voices in research and decision-making (General Accounting Office [GAO], 2003; Government Accountability Office [GAO], 2009; Melvin et al., 2017; Government Accountability Office [GAO], 2022).
As cross-cultural collaboration in Arctic research increases, it is essential to establish ethical frameworks that prioritize Indigenous perspectives and foster reciprocal relationships between scientists and local communities (Ermine et al., 2004; Suaalii-Sauni and Fulu-Aiolupotea, 2014; Bailie et al., 2021). Reciprocity between local communities and UAF researchers in relation to the Stakes for Stakeholders Program is a key aspect of establishing a working relationship in which local voices and concerns are heard and provide the foundation to the program. This study aims to contribute to the literature on CBM by analyzing the effectiveness of the Stakes for Stakeholders Program, focusing on how equitable partnerships can enhance coastal monitoring efforts.
Using the Stakes for Stakeholders program as a case study, the central research question guiding this study is: How can the design and implementation of CBM programs be improved to better address the unique challenges faced by rural coastal communities in Alaska? To explore this question, we will examine four key objectives: (1) Develop sustainable partnerships with local environmental observers to identify priorities and integrate Indigenous knowledge; (2) Conduct baseline topographic surveys and establish monitoring sites; (3) Create and refine protocols for efficient data management; and (4) Produce community-prioritized data products that facilitate local decision-making. By analyzing this case study, the paper draws on broader theoretical frameworks related to citizen science (Irwin, 2002) and lay expertise (Wynne, 2008), which emphasize the importance of integrating local knowledge into scientific inquiry to address complex environmental issues. This work also contributes to ongoing debates about the role of Indigenous knowledge in environmental governance, particularly in the context of climate change adaptation.
One of the primary goals of this research is to highlight and document CBM best practices through detailed protocols and workflows. The description of the sites and context for our case example, processes and workflows are described in the following sections. The Stakes for Stakeholder CBM sites began with community meetings with university and state partners, followed by site establishment and data collection. Products and protocols were written and revised over the following years based on iterative feedback.
The main researcher in this study joined the Stakes for Stakeholders project as a part of her graduate studies. She joined the project to learn more about how coastal hazards have impacted rural communities and how she can make science more accessible and usable to the public.
The idea for Stakes for Stakeholders came from a high school class in Newtok, AK. Residents of Newtok have long been concerned about erosion in the community as they have lost hundreds of feet of their shoreline the past several decades. A science teacher at Newtok School began measuring erosion with their class in 2012 and shared their report of their methods and findings with the State of Alaska in 2015. This effort led to the creation of our Alaska Sea Grant project named Stakes for Stakeholders. The pilot program began in 2016 with a two day workshop at UAF Bristol Bay campus and was initially funded by Bureau of Indian Affairs, Alaska Sea Grant, and Environmental Protection Agency. The workshop brought together environmental observers from 12 communities in Bristol Bay to learn about CBM methodology from ACGL and DGGS researchers. The project was originally funded from 2016–2019 and ended at the project end date. Though the project officially ended, CBM work continues as an individual community technical assistance carried out by multiple agencies and entities.
This study focuses on two communities in Bristol Bay and the Gulf of Alaska (GOA), Dillingham and Chignik Bay (Figure 1).
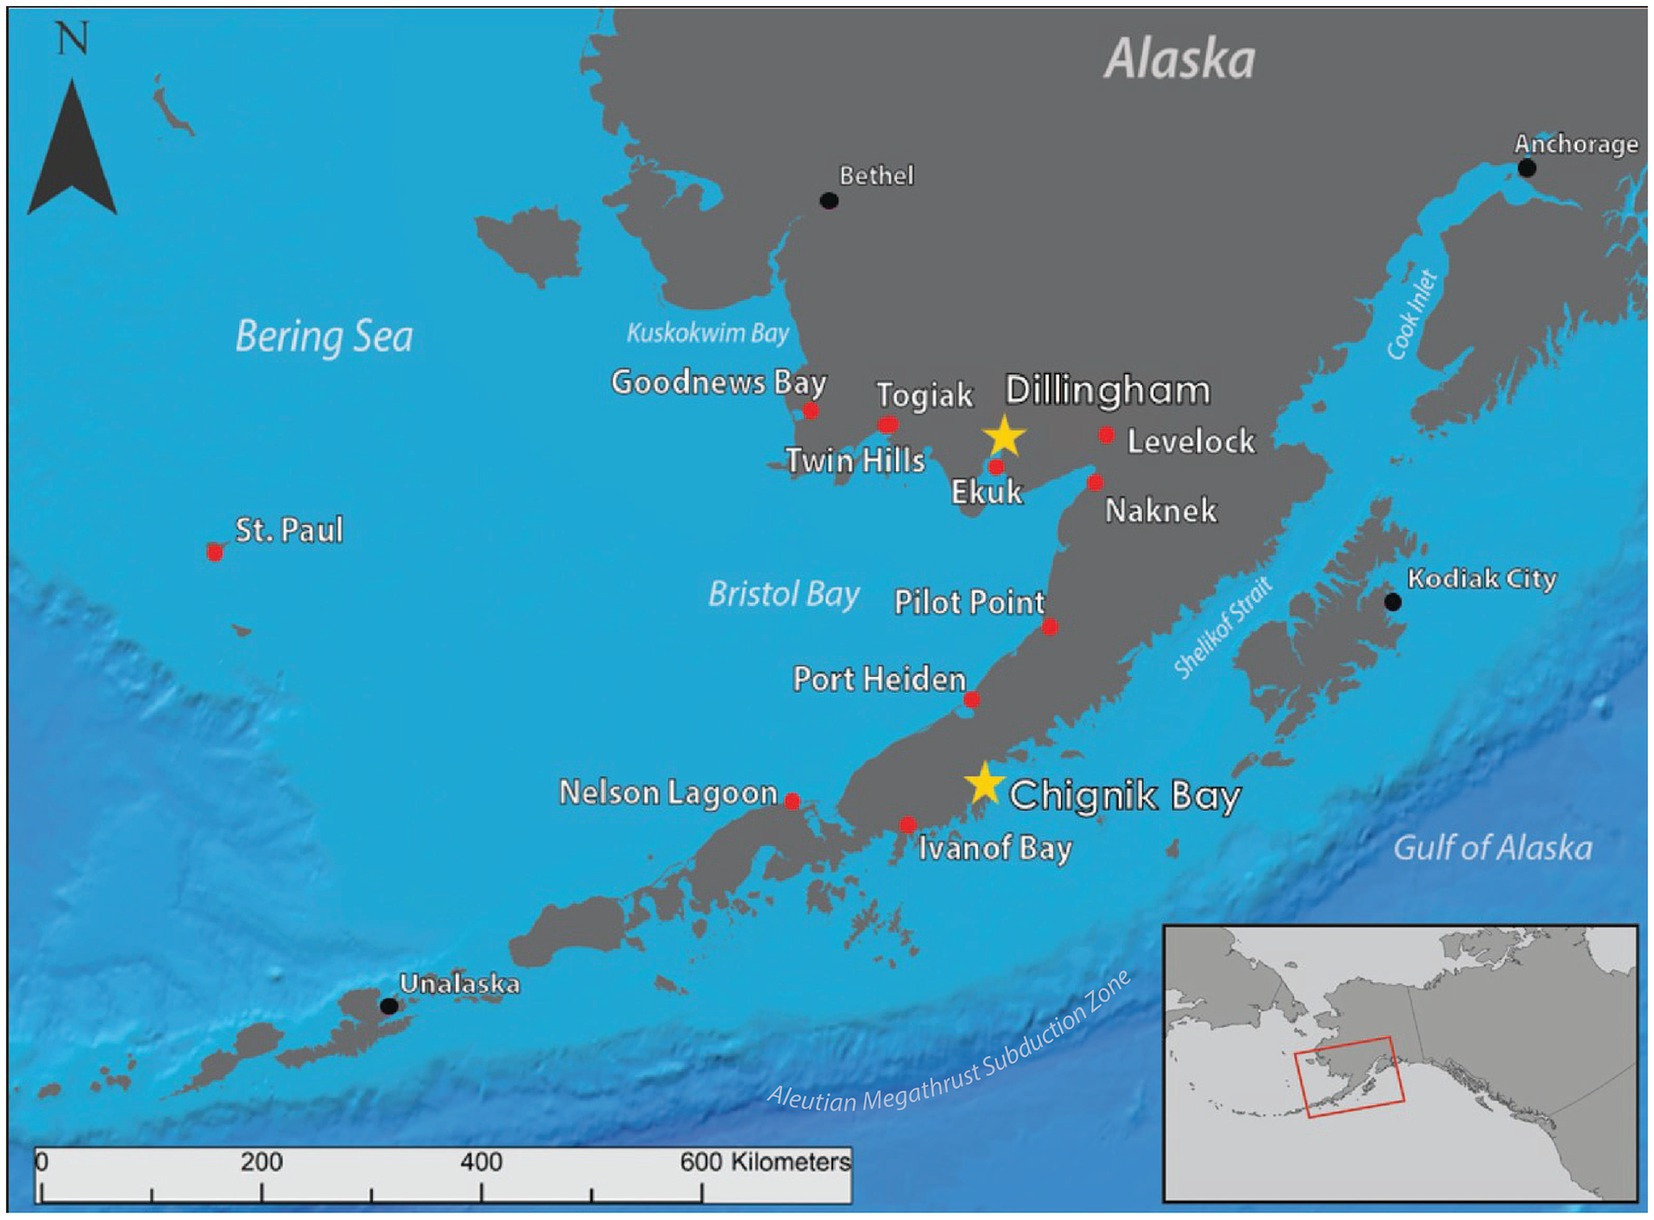
Figure 1. Map of Stakes for Stakeholders CBM sites in Bristol Bay and the Gulf of Alaska. Gold stars represent study sites, red circles indicate communities participating in a CBM program, and black circles represent regional hub communities.
Dillingham is located at the head of Nushagak Bay at the confluence of the Nushagak and Wood rivers. The City of Dillingham has a population of 2,370 year-round and can reach a population of 10,000 during the summer fishing season (Dillingham City School District, AK [DCSD], 2024). Dillingham is completely dependent on air and marine services for supplies and transportation as there are no roads that connect it to larger cities. The community serves as the hub for the Bristol Bay region for supplies, health services, transportation, and tourism.
Chignik Bay is a community of around 44 year-round residents located on the southeastern side of the Alaska Peninsula in the Gulf of Alaska (United States Census Bureau, 2022). The community of Chignik Bay is tucked into the western side of the smaller Anchorage Bay and it is accessible by air and sea with a state ferry running during the summer months bringing supplies to the community. The community served as one of the first commercial salmon fisheries in Alaska. To this day commercial salmon fishing is one of the basis of the economy, though there has been increasing concern that climate change is impacting fish populations.
Bristol Bay encompasses 103,600 km2 and houses one of the largest salmon fisheries in the world (United Tribes of Bristol Bay [UTBB], 2023). Bristol Bay contains 31 Federally recognized Tribes composed of Yup’ik, Dena’ina, and Alutiiq people who have resided in the region for more than 11,000 years (Waters and Stafford, 2013; Hohonu, 2023), as well as Russian settlers and mixed heritage American settlers moving to the region in the late 1700’s and mid 1800’s, respectively (Library of Congress [LOC], 2023). The more recent waves of settlers brought permanent infrastructure, such as fish canneries and permanent houses, to the communities (Clark et al., 2006; Troll and French, 2022), which are now vulnerable to coastal hazards. Bristol Bay is a tide-dominated environment with semidiurnal tides ranging from 2 m at the mouth of the bay to more than 5 m at its head in Dillingham (Wise et al., 1987). Wave energy is greatest at the mouth of the bay, near Nelson Lagoon, and grows weaker as it travels to the head, near Dillingham (Wise et al., 1987). With the Pacific current’s warm intrusion moving through the Aleutian Islands and cutting through the bay’s mouth, the region is a hot spot for cyclonic storms that can last for days and in some locations, create waves reaching 9 m (Sharma et al., 1972; Wise et al., 1987; Buzard et al., 2020; Bogardus, 2021).
The GOA is a mixed tide and wave energy system dominated by strong storms (Stabeno et al., 2004). The terrain around the coastal GOA causes storms in the region to linger, even in the later stages of their life cycles (Wilson and Overland, 1986). In the western GOA the Alaskan Stream, driven by wind and freshwater runoff, controls circulation along the shelf (Stabeno et al., 2004). This circulation, in addition to complex bottom water topography, results in a highly productive coastal zone, promoting the introduction of ocean waters to juvenile salmon (Hermann and Stabeno, 1996; Napp et al., 1996).
The Bristol Bay area is primarily made up of unconsolidated sediments consisting of glacial drift, alluvium, and lacustrine sediments with limited areas of exposed rock (Sharma et al., 1972; Wilson et al., 2015). In the western GOA, unconsolidated surficial sediment is composed of mostly glacial drift, marine deposits, and alluvial fan and floodplain deposits with the most prominent geology being rugged and sharp coastlines composed of a mixture of solid rock and loose sediment (Riehle et al., 1977). Both sites are located in a region that is tectonically active on the Aleutian Megathrust subduction zone and may experience tectonic and isostatic uplift or subsidence, which can influence local erosion rates (DeGrandpre and Freymueller, 2019; Kaufman and Manley, 2004). Bristol Bay communities are oriented away from the main fault while the Gulf of Alaska communities are directly facing the main fault, making them more susceptible to tectonically driven hazards such as tsunamis and submarine landslides (Pulpan and Kienle, 1979; Rogers, 1977).
Partnerships between ACGL scientists and environmental observers are an important foundation to identify local priorities, gain guidance through local and Indigenous knowledge holders, and collaborate in research activities. To develop sustainable and reciprocal partnerships with environmental observers, annual site visits were coordinated to conduct coastal topographic survey (Figure 2); select and establish CBM sites and perform site maintenance (Figures 3, 4); and train new community members working on the project. Workflows for these processes can be found in Supplementary Figures S1–S3 (Supplementary material 1). Community meetings were hosted by local environmental observers and Tribal leaders that gathered residents to guide CBM activities and provide a platform for knowledge exchange. These meetings often took the form of a cookout or potluck to encourage greater participation and a less formal atmosphere. During meetings, ACGL scientists listened to and documented community testimonials regarding areas of concern, past extreme storm events, and other long-term observations made by local and Indigenous knowledge holders. Between visits, local environmental observers gathered shoreline data; maintained monitoring sites; and attended biannual teleconference meetings with ACGL scientists to provide updates, discuss site visits, and give feedback on the program that is used to improve data products. Various meetings were held with environmental observers and the public to invite everyone to share concerns and suggestions for the CBM program. Environmental observers facilitated formal and informal meetings between ACGL scientists and community members. The meeting style that resulted in the greatest public turnout occurred during public cookouts or other types of potluck settings. The Chignik Bay Climate Action Symposium held in May 2022 is an example of a successful meeting (Figure 5). The meeting was held in the community center building and was coordinated and hosted by the Chignik Bay Tribe with input from ACGL scientists and other presenters. Flyers were put up weeks in advance to provide time for community planning. Large prints and poster size (11 in x17 in) maps depicting CBM sites and other datasets were prepared by the ACGL scientists and dispersed to attendees. The meeting was potluck styled and a raffle was set up to bring in a wider audience. Tables were arranged in a “u” shape to bring focus to the speakers and allow for open discussion. The food was set up in the back along with the large print maps laid out on tables and hung up on walls. Breaks were taken between speakers and discussion time was weaved into each presentation. There were approximately 40 attendees and the meeting led to several important outcomes including new funding support and collaborations. Chignik Bay Tribe organized a follow up symposium in June 2023 that included ongoing and new research projects. The symposium was attended by over 50 participants and resulted in follow up actions captured in the 2023 Chignik Regional Climate Resiliency Symposium Summary that is on the Chignik Watershed website and includes hyperlinks to presentations.1
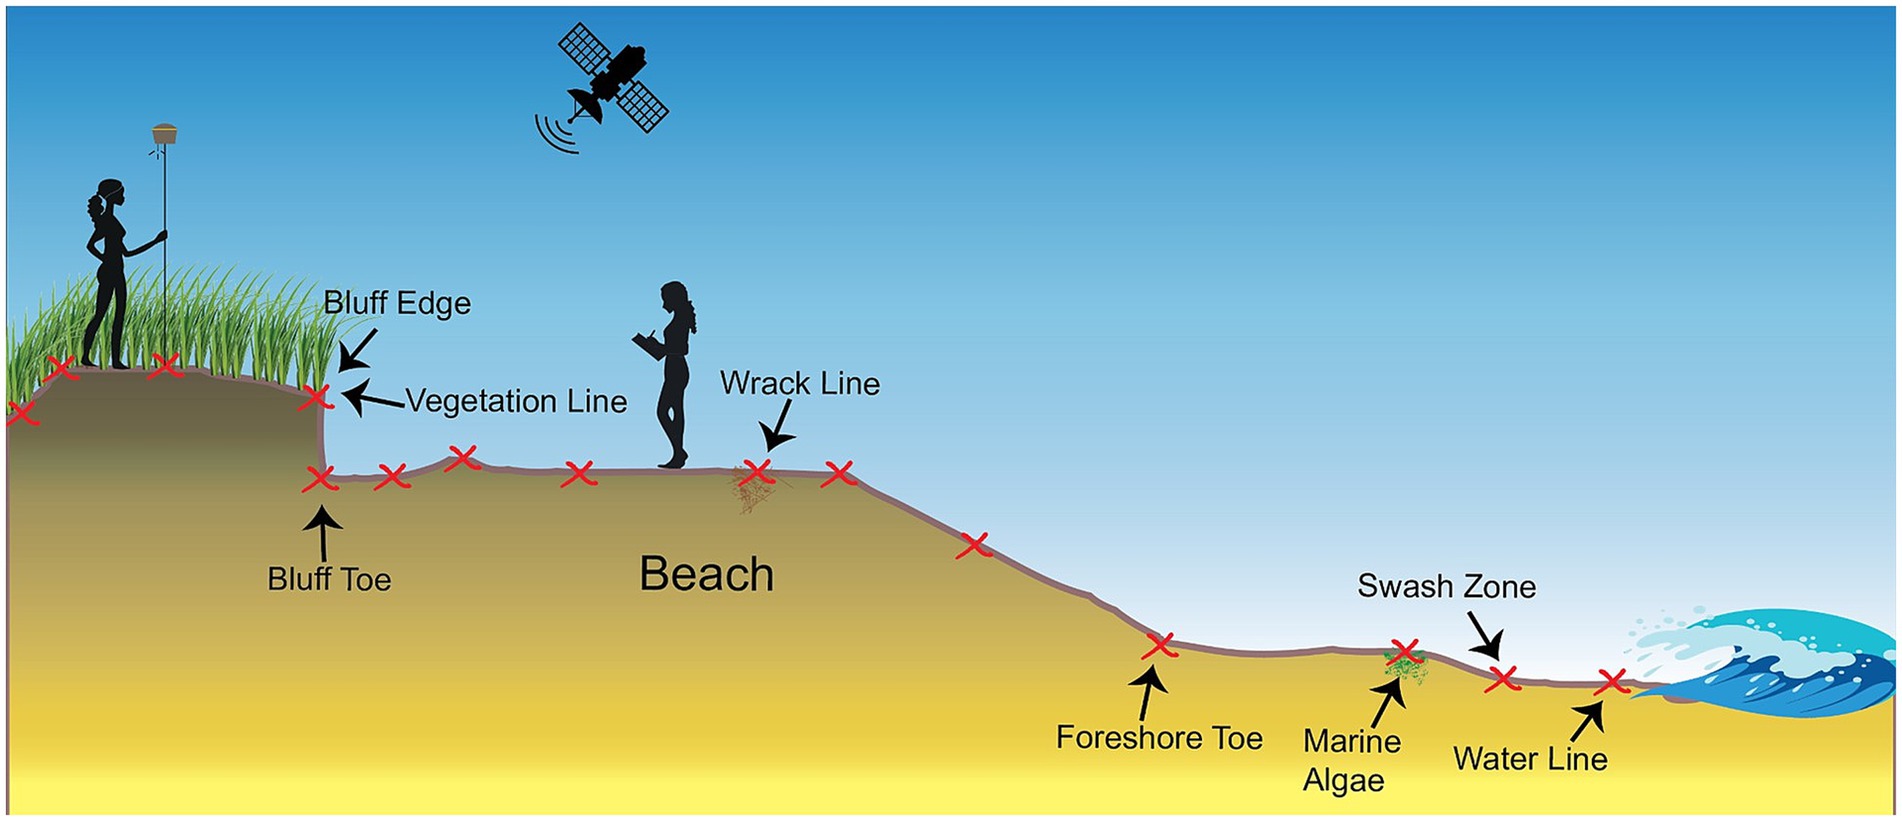
Figure 2. Example diagram of coastal topographic profile collection process. The surveyor walks in a straight line (profile) perpendicular to the shoreline collecting RTK-GNSS points represented by red x’s along the profile. The red x’s are representative of changes in topography, vegetation, sediment type, and beach zones.
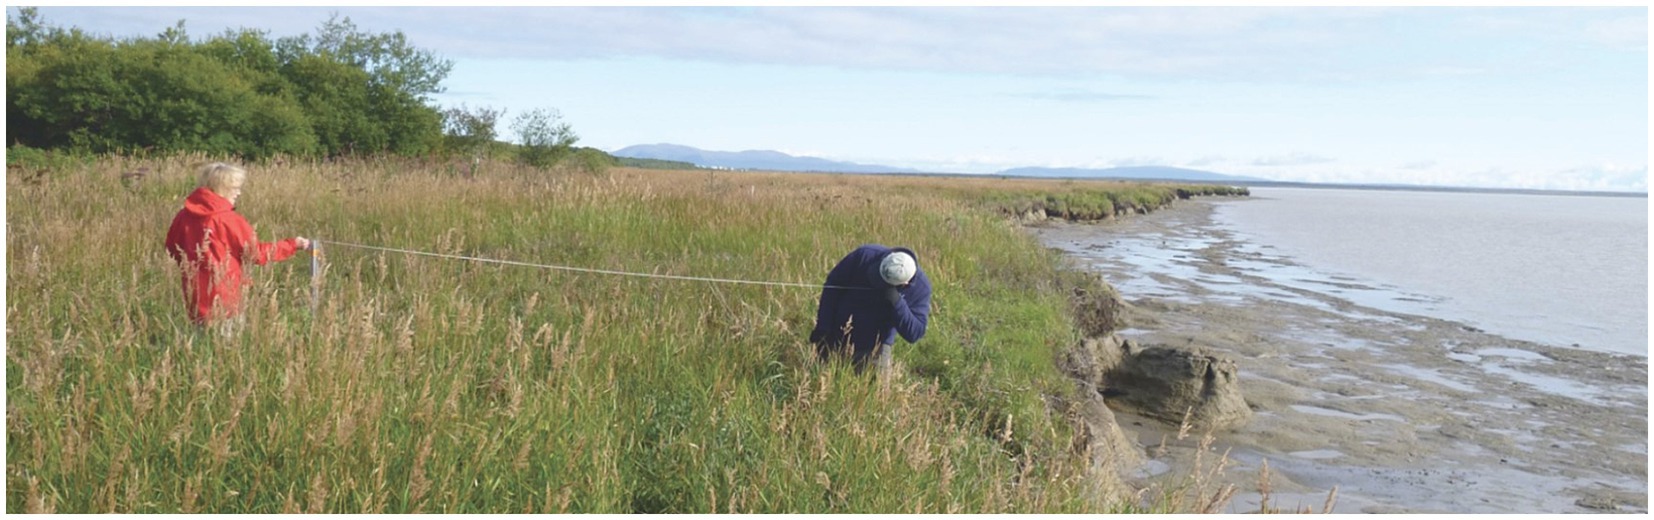
Figure 3. Stake ranging to measure erosion rates includes setting up two wooden stakes perpendicular to the coast and making repeat measurements of the distance along that straight line between the seaward stake and the bluff. The person in blue is looking down the imaginary straight line made by the two stakes to ensure his measurement is on the same transect as the last measurement. Photo used with permission from Buzard R. M. et al. (2019).
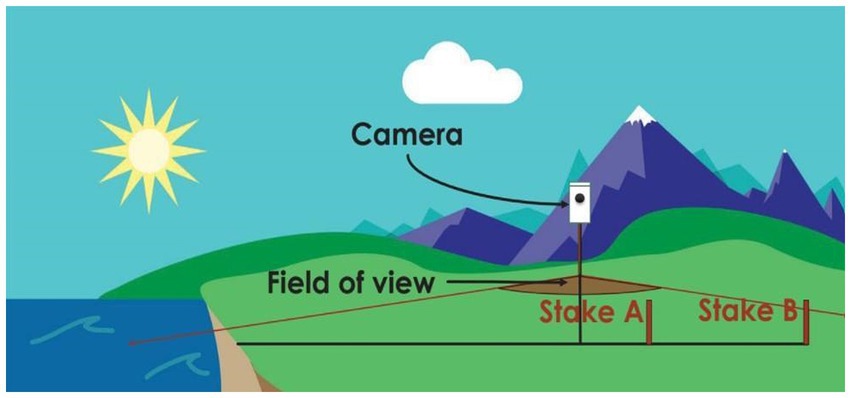
Figure 4. Example of time-lapse camera site set up. Stakes A and B are installed near the eroding feature and make up a single profile (i.e., a line parallel to the eroding feature). A time-lapse camera is installed a distance back and facing the profile to capture the two stake locations and the eroding feature in the swath of the image. Cameras take pictures hourly, and local environmental observers maintain them and send in SD cards of the images (from Buzard R. M. et al., 2019).
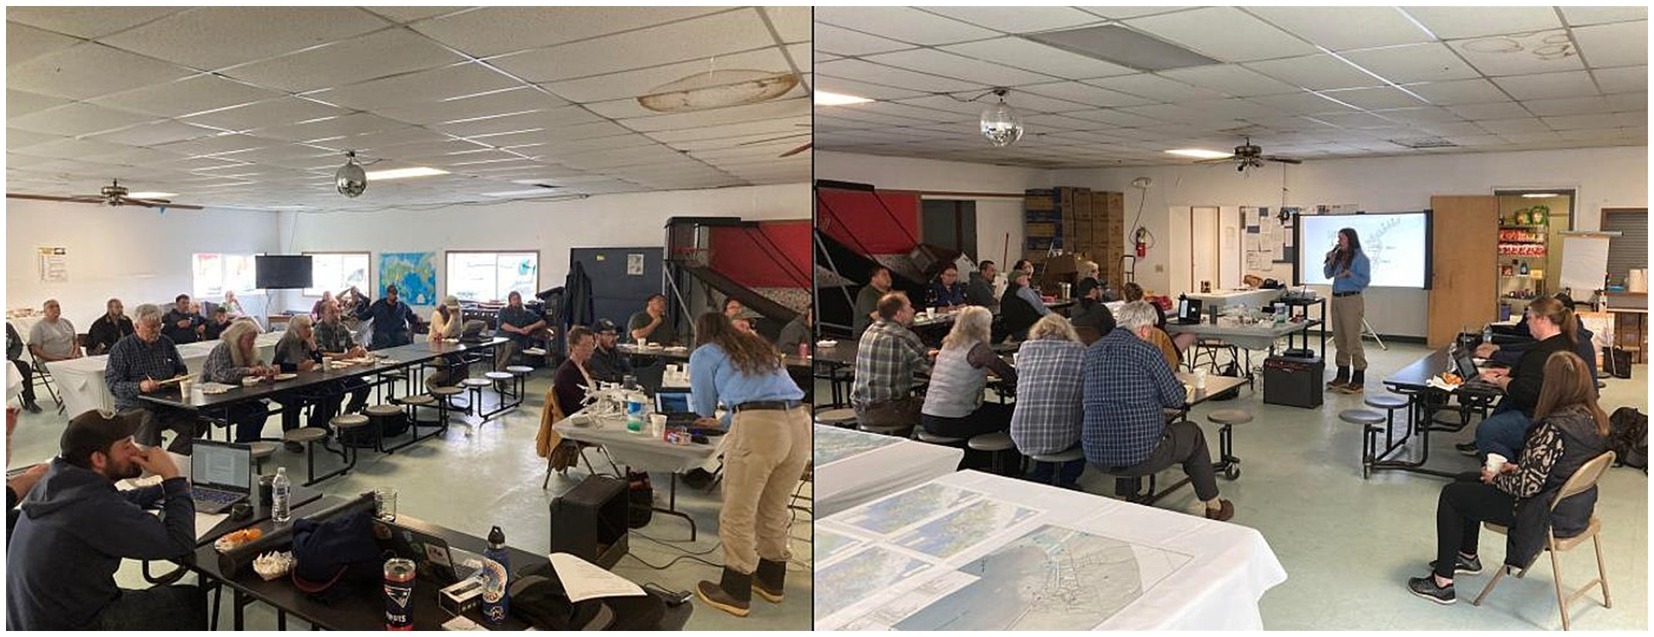
Figure 5. Image of the Chignik Bay Climate Action Symposium in 2022. Participants included local residents, Tribal, State, and City officials, as well as representatives from private engineering firms, government agencies, and academic institutions. Data products were shared with community members, including infrastructure maps, shoreline change maps, and CBM graphs and other visualizations.
The Stakes for Stakeholders CBM program is a case example for public engagement in climate change research in practice (Buzard R. et al., 2019; Glenn, 2022). Stakes for Stakeholders includes developing reciprocal partnerships between Tribal and city governments of rural coastal and riverine communities to implement accurate data collection protocols to map, quantify, and monitor erosion and flooding. This program has been led through the Division of Geological & Geophysical Surveys (DGGS), the University of Alaska Fairbanks (UAF) Arctic Coastal Geoscience Lab (ACGL), and the Bristol Bay Native Association and is now active in over a dozen communities across western Alaska.
Tribal environmental coordinators are paid a salary as part of the Environmental Protection Agency’s Indian Environmental General Assistance Program, which will be referred to as local environmental observers from this point onwards (Alaska Native Tribal Health Consortium, 2016). CBM sites were chosen after community discussions between partners about areas of local concern and were established in the late spring or early summer months depending on community subsistence activities. These discussions often-included areas where erosion or flooding threatened infrastructure, transportation routes to access subsistence hunting and fishing resources, and other naturally important lands such as cemeteries, archeological sites etc. For example, the monitoring site in Chignik Bay near the medical clinic was chosen by the Tribal Council because it is the only medical provider in the area and is a new, multi-million-dollar structure built near an eroding shoreline. Once CBM sites were decided, ACGL scientists, environmental observers, and their assistants installed monitoring sites and maintained them throughout the years. We developed a rubric for determining the suitability of a site to assist future decision making as new communities join the effort that can be found in Supplementary material 2.
During site visits by ACGL, partners conducted repeat coastal topographic surveys using a real-time kinematic global navigation satellite system (RTK-GNSS; Figure 2). These cross-shore profiles were collected across the shoreline fronting the community with greater spatial resolution at each of the monitoring sites. Coastal profiles differ from CBM sites in that they are collected with sophisticated survey equipment. Topographic profiles are used to compare to CBM erosion rates. Between site visits by ACGL, local environmental observers visited each site two to three times per year to measure erosion, following the CBM Monitoring Handbook’s stake-ranging methods (Buzard R. M. et al., 2019). Erosion measurements were also made before and after extreme storm events. Environmental observers would then send site measurements to the ACGL via email or postal mail. The ACGL updates those measurements into an Excel spreadsheet and run a MATLAB code to calculate and plot measured changes (Buzard R. et al., 2019). The workflow for this process is diagrammed in Supplementary Figure S1 (Supplementary material 1).
Environmental observers would collect erosion measurements at stake-ranging sites. These stake ranging sites consist of 2–3 wooden stakes installed along lines perpendicular to the eroding feature in areas of concern for communities (Figure 3). The most seaward stake was installed 25–50 ft. from the eroding feature and following stakes were installed 50 ft. apart. Erosion measurements were collected by starting at the most seaward stake and walking along the invisible profile with a measuring tape out to the eroding feature. Environmental observers collected data periodically throughout the year depending on the shoreline type, local availability to collect measurements, and erosion rate. They would then send these measurements to ACGL via postal mail or e-mail. The workflow for this process is diagrammed in Supplementary Figure S2 (Supplementary material 1).
Time-lapse images are used to measure erosion when observers are unable to collect erosion measurements and to document the local environmental conditions surrounding significant erosion events (Buzard et al., 2020). Time-lapse cameras were installed at suitable sites and with permission from the community. These sites generally have a clear visual of the shoreline and the eroding stakes, do not infringe upon people’s privacy, and are relatively low traffic areas to avoid vandalism or damage. Two types of cameras were installed in communities: the Bushnell HD Trophy Cam and Wingscape cameras. Time-lapse cameras were installed perpendicular to profiles at the stake-ranging sites (Figure 4). ACGL provided hands-on training during site visits as well as workflow documents to support local data collectors in their operation and maintenance (Buzard R. M. et al., 2019). Workflow processes for this in addition to using the images to calculate erosion rates, time-lapse images were compiled in Adobe Premier and produced videos to support the visualization of coastal processes and drivers such as changes in sea-ice conditions and wave action. Results were shared with the community via email, teleconference meetings, or during in-person site visits (Figure 5). The workflow for this process is diagrammed in Supplementary Figure S2 (Supplementary material 1).
Written protocols and workflows were developed by the ACGL to document the Stakes for Stakeholders CBM methods (Buzard R. M. et al., 2019; Buzard R. et al., 2019; Buzard et al., 2020; Christian, 2023). Products that focus on local priority areas were developed by the ACGL with data collected by environmental observers. These products include a variety of graphs, maps, timelapse videos, and a hazard assessment report. The hazard assessment report is a comprehensive document that outlines the geologic and oceanic settings, coastal hazards, products and assessment tools, and risks to infrastructure in each community. These reports were requested by communities to provide accurate and up-to-date information and data products that can be included in their Federal Emergency Management Agency (FEMA)-required Tribal Hazard Mitigation Plans as well as funding proposals, engineering reports, and other local planning documents. The hazard reports are meant to be a working document that is periodically updated to continually serve as a go-to source of information for communities. ACGL and DGGS researchers created these protocols and workflows for environmental observers to reference during data collection. There are currently no plans to create any more protocols, unless the environmental observers request additional information. Including environmental observers in future updates would ensure that data collectors get what they need from these documents.
As part of effectively addressing local priorities, an assessment tool was designed to outline the social and environmental factors that contribute to the efficacy of the Stakes for Stakeholders program. This literature-based 3-point rubric, modeled after Larson and Spellman (2017), identifies key social and environmental factors influencing the effectiveness of the CBM program [Supplementary Tables S1, S2 (Supplementary material 2); e.g., Pollock and Whitelaw, 2005; Sharpe and Conrad, 2006; Berkes et al., 2007; Conrad and Daoust, 2008; Huntington, 2011; Stone et al., 2014; DeVries et al., 2016]. Community needs and priorities are always evolving, making the evaluation of monitoring programs an important process. To evaluate the environmental factors that affect the success of the Stakes for Stakeholders program, we examined the physical features defined in the coastal hazard literature (e.g., Berkes et al., 2007; Stone et al., 2014; DeVries et al., 2016; Capdevila et al., 2020; Cheng et al., 2020; McNamara et al., 2020), learned through our prior 6-years of work, and from feedback given by local environmental observers [Supplementary Table S1 (Supplementary material 2)]. To determine social factors that enhance or limit the success, we identified key factors we had noticed in our relationships and the factors identified in the large literature base on this topic that support participation and communication feedback loops defined in the CBM literature [Supplementary Table S2 (Supplementary material 2); e.g., Pollock and Whitelaw, 2005; Sharpe and Conrad, 2006; Conrad and Daoust, 2008; Ford et al., 2013; Stone et al., 2014; Johnson et al., 2016; Capdevila et al., 2020; Cheng et al., 2020; McNamara et al., 2020; Eicken et al., 2021; Lazrus et al., 2022; Yua et al., 2022; Mercer et al., 2023]. This rubric was applied to evaluate Dillingham and Chignik Bay to pilot the rubric and look for areas of program improvement.
Community Engagement led to new information sharing that helped prioritize community needs and build a sustainable CBM program. Baseline data collection and CBM site results are described for the communities of Dillingham and Chignik Bay followed by the assessment of the CBM programs in each community using the assessment rubrics described in the methods.
Establishing a Community-Based Monitoring (CBM) program began with the most crucial step: building and maintaining existing relationships with local communities. This foundational connection was key to ensuring a sustainable monitoring effort. The process involved introductions between new and returning participants from both the ACGL team and the community members, facilitated through teleconference meetings and in-person site visits.
In-person visits proved invaluable, allowing for the development of personal relationships, a deeper understanding of local coastal hazard priorities, and stronger communication across all participants. These face-to-face interactions helped identify key areas for monitoring and informed the creation of data products. During initial conversations, community members, environmental observers, and ACGL scientists collaborated to select monitoring sites. They also coordinated the establishment, operation, and maintenance of these sites. For instance, in Chignik Bay, local input highlighted a stretch of road leading to the airport that had been eroding. This insight led to the selection of this location as a priority for monitoring.
Maintaining active, flexible communication—across a variety of formats—and being receptive to community input were all essential to the success of the CBM program. Informal, impromptu conversations between ACGL scientists and local residents also played a significant role in gathering valuable local knowledge. Wearing bright survey vests while conducting fieldwork helped residents easily identify ACGL scientists, and when accompanied by local environmental observers, many were eager to engage in conversation. These exchanges often resulted in the sharing of critical information, such as high-water level locations, new areas of erosion, and observations of environmental changes and the community’s responses. The extended time ACGL scientists spent in the communities fostered these informal conversations. Site visits typically lasted at least four days, often closer to a week, allowing sufficient time for fieldwork, while also accommodating for weather-related delays. This time frame enabled scientists to engage with residents through both formal and informal meetings. The presence of the ACGL team in the community underscored their commitment to addressing local concerns, significantly contributing to the success of the CBM program.
ACGL scientists and local environmental observers collected baseline and repeat shoreline change data using RTK-GNSS coastal topographic profiles, stake-ranging measurements, and timelapse camera photos. These datasets are analyzed to measure erosion rates, identify erosion causes/mechanisms, and map hazard areas. The following sub-sections highlight the CBM efforts in each community. Details about the RTK-GNSS coastal topographic profiles can be found in Supplementary materials 3, 4.
Dillingham is one of the longest participating communities, as it was one of the initial four communities to take part in the Stakes for Stakeholders program, with seven years of CBM data and measurements continue to be collected. There are three CBM sites: the sewage lagoon, peat meadow, and kanakanak flats (Figure 6). Each site contains three stakes’ profiles (including the camera profile). Along-profile erosion measurements were averaged at each site to show the general erosion trend from 2016 to 2023. Communities found data products the most useful when they were reported in ft. as meters are not as commonly used. Erosion rates are shown in Figure 7. The sewage lagoon had the fastest erosion rate while Peat Meadows had the slowest erosion rate (Figure 7). Time-lapse cameras were installed at each site and images were sent in by environmental observers approximately every six months. Photos were compiled into time-lapse videos, published on the ACGL YouTube channel, and sent to community partners via email or flash drive (Figure 8). Time-lapse erosion rates were not updated for either community. There were enough measurements regularly collected in both communities to capture erosion events and the amount of effort that goes into camera derived measurements was unnecessary. A total of 40 coastal profiles were collected in Dillingham from 2016 to 2023. A map of coastal profile locations and three representative profiles collected around CBM sites can be seen in Supplementary material 3. Three coastal topographic profiles are presented to show the variation of erosion rates around the CBM sites. The sewage lagoon experiences 11.5 ft./yr. (3.5 m/yr), peat meadows experiences 1.6 ft./yr. (0.5 m/yr), and kanakanak flats experiences 1.6 ft./yr. (0.5 m/yr).
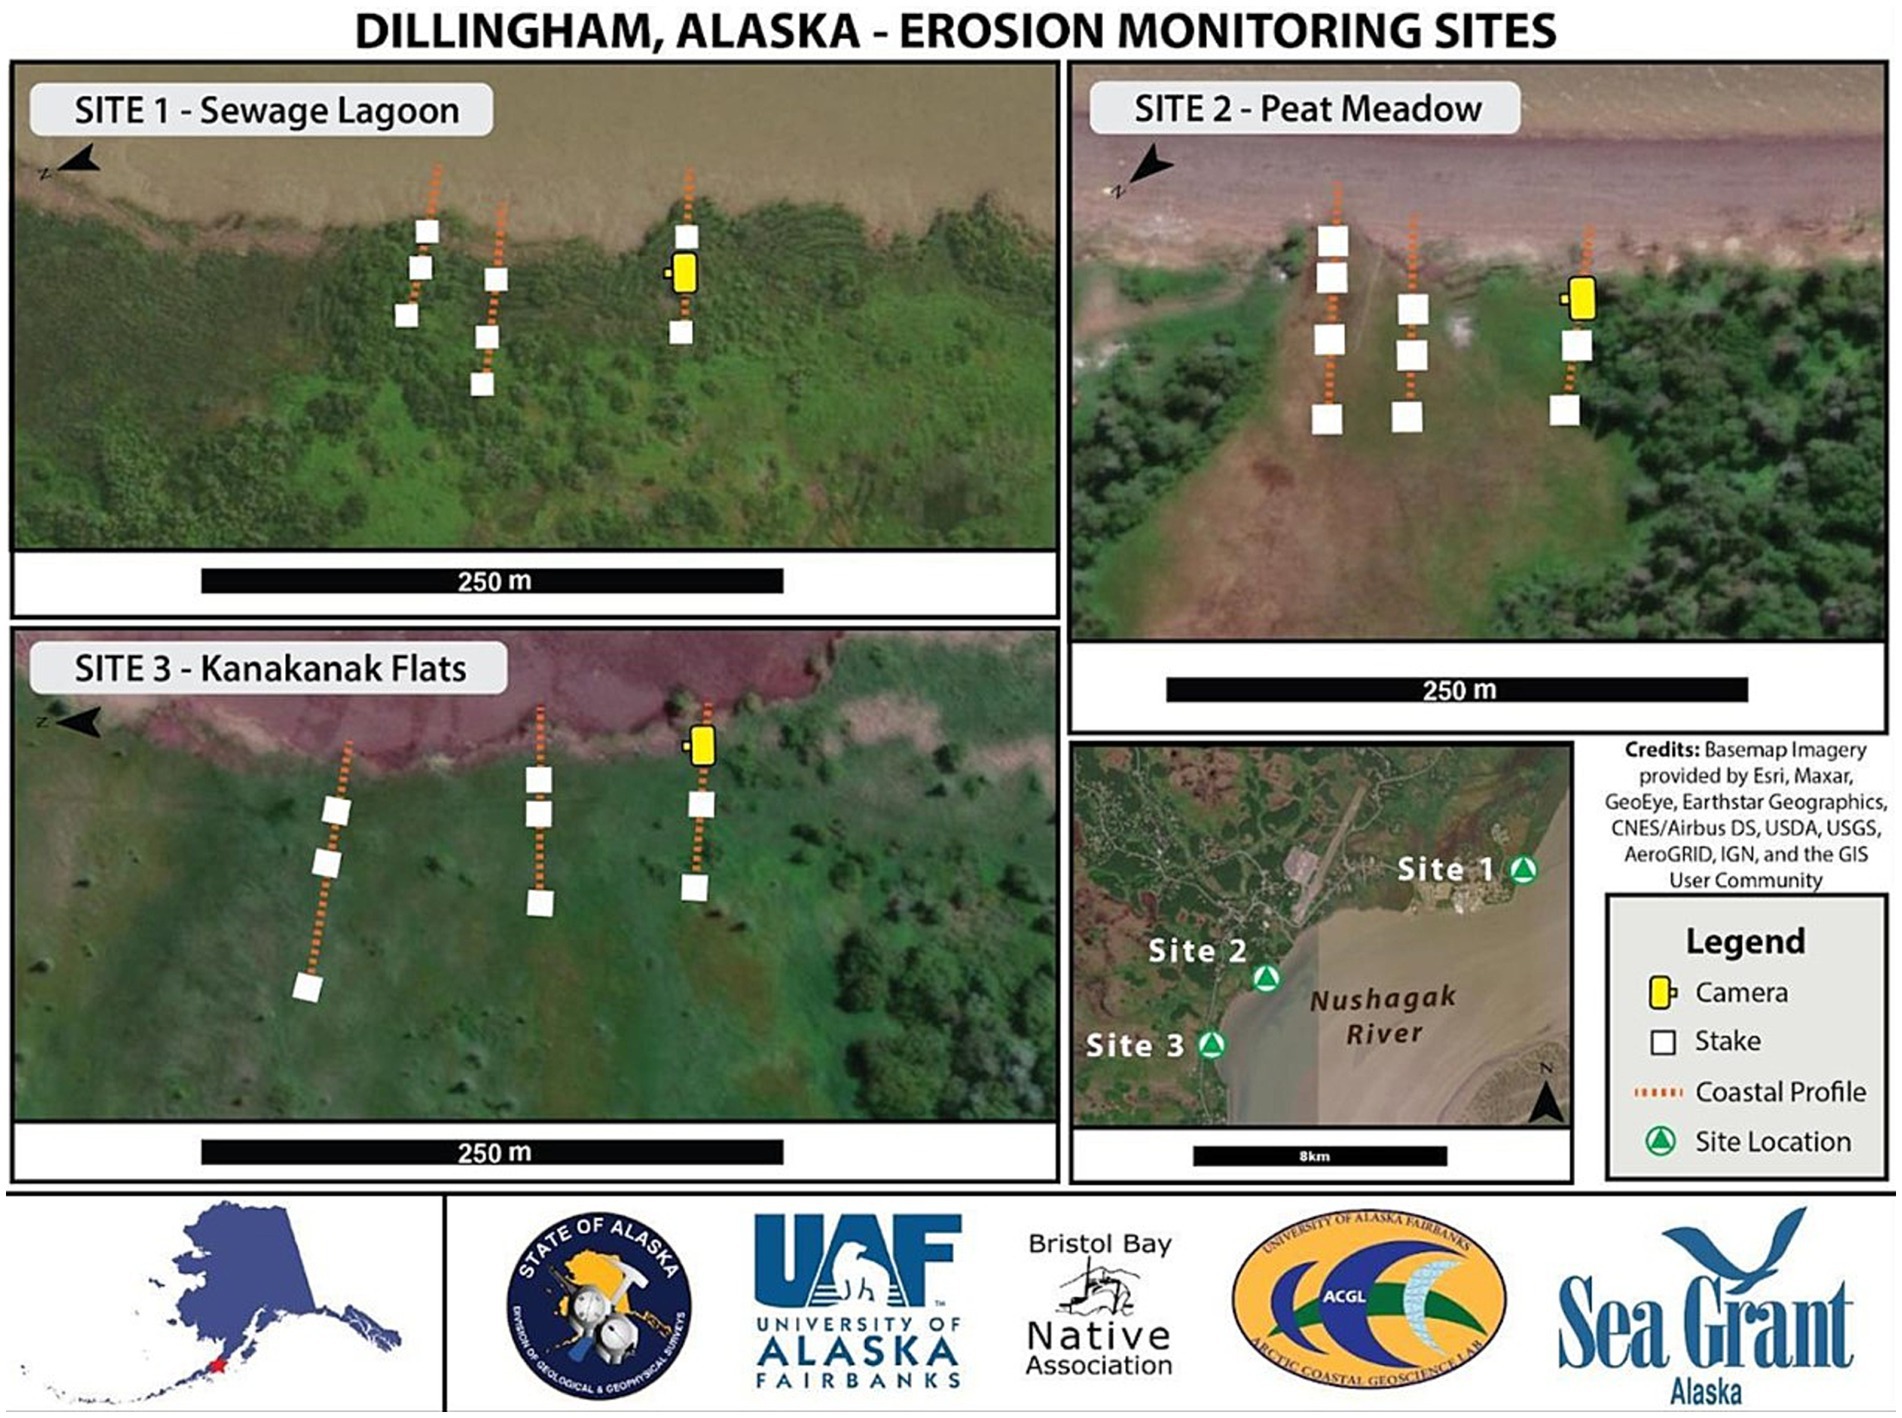
Figure 6. CBM site map in Dillingham, Alaska. Updated stake and camera locations are represented by the white boxes and the yellow rectangle, respectively. Coastal topographic profile locations are represented by dotted orange lines.
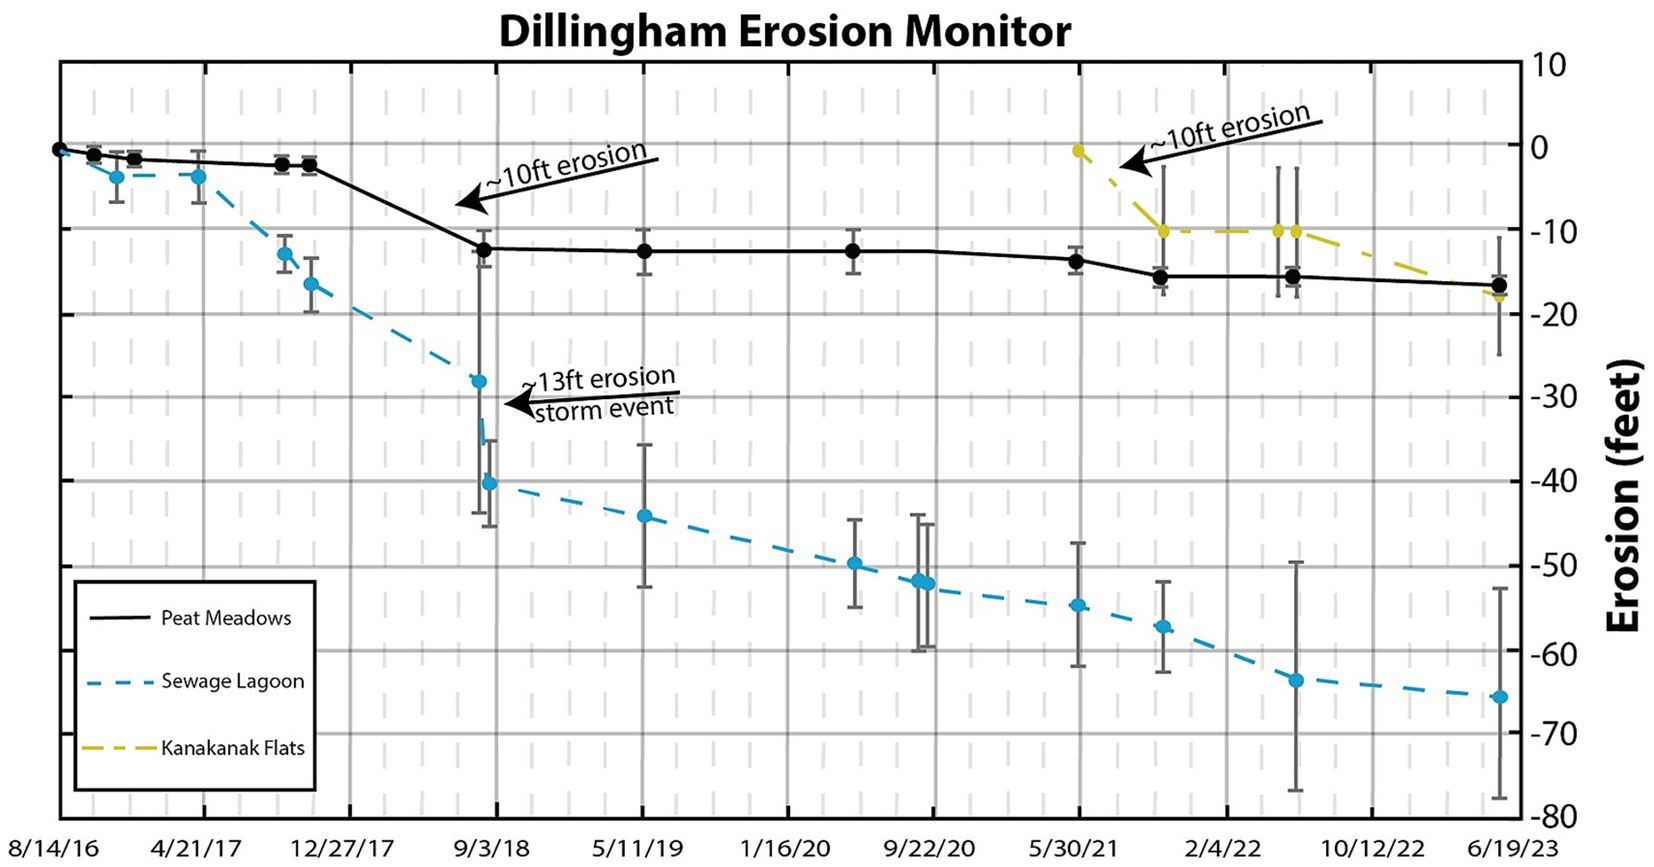
Figure 7. Averaged CBM stake site measurements at all three monitoring sites in Dillingham, AK. Measurements were taken from 2016 to 2022 and are reported here in ft. as they are delivered to community partners. The graph shows erosion distance over time. Notice at the sewage lagoon, the pre and post storm measurements in August 2018 that documented about 13 ft. (3.96 m) of erosion in that single event. Peat meadows has been relatively stable except for an increase in 2018 with 10 ft. (3.05 m) of erosion occurring over that year. Local observations indicate this increase in erosion was due to a series of extreme storm events. At kanakanak flats, there was an increase in erosion around the year 2021, with 10 ft. (3.05 m) of erosion occurring over five months.
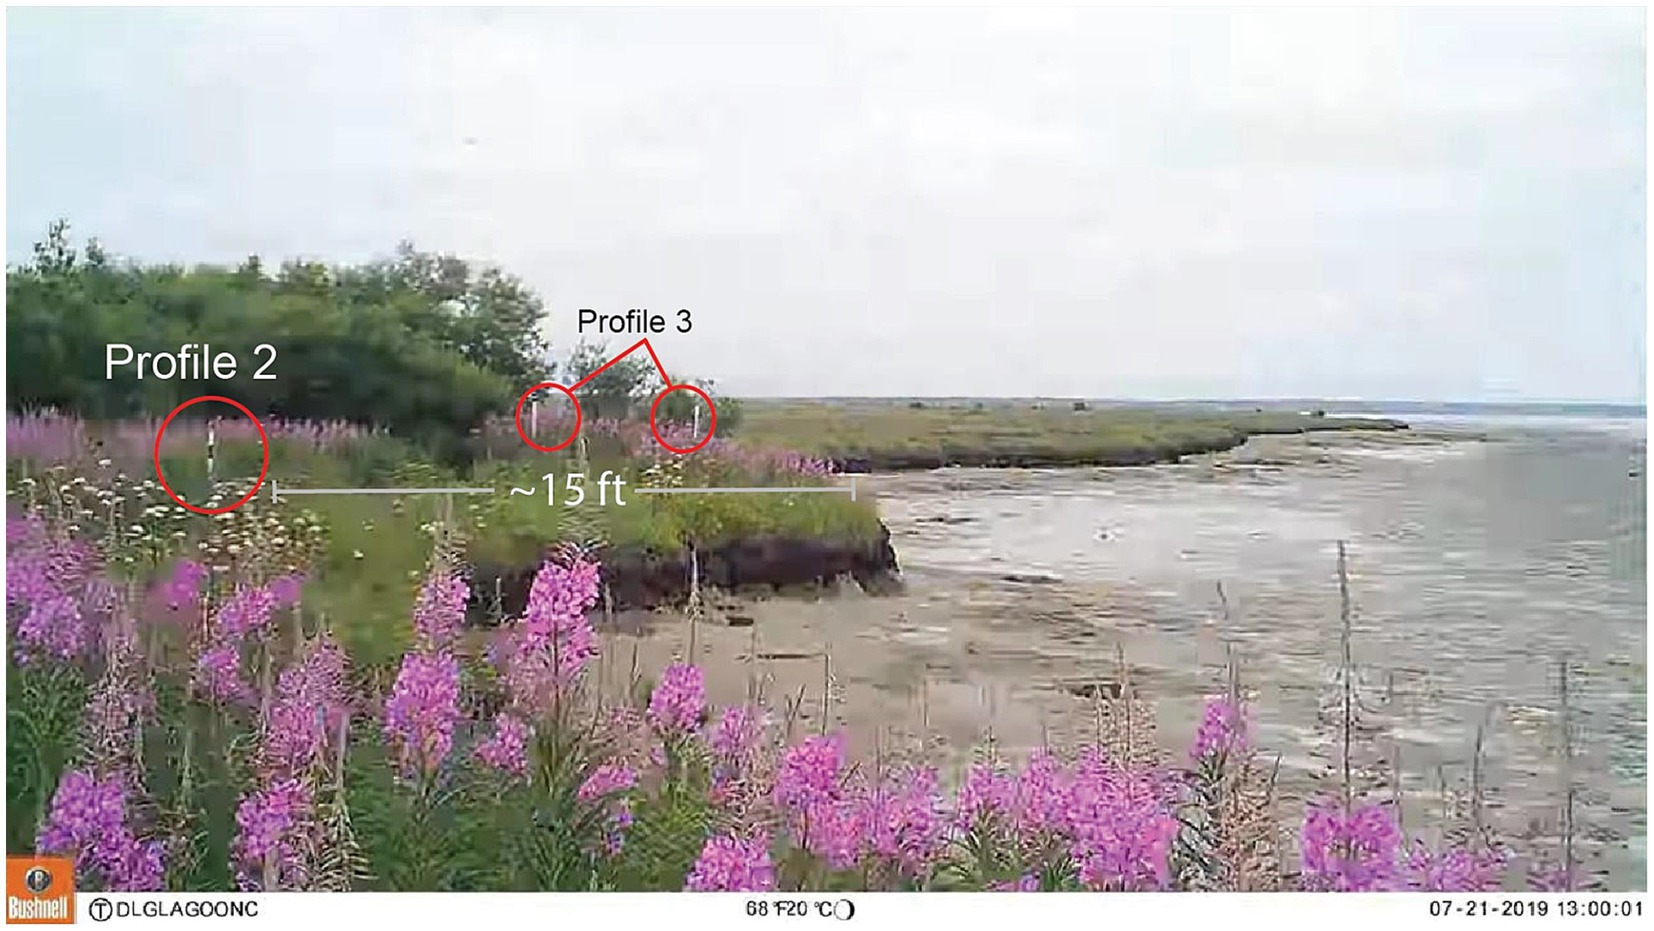
Figure 8. Time-lapse picture and compiled video of the Sewage Lagoon stake site. Notice white stakes in background highlighted in red circles. According to community measurements, profile two was approximately 15 ft. away from the eroding bluff in this image. Images taken at Dillingham sewage lagoon from May 2019 to November 2019 make up a revealing video that documents wave action and erosion resulting from a single storm event (https://youtu.be/M0zNXxNGhig).
Chignik Bay has participated in the Stakes for Stakeholders program since 2019. There are three CBM sites: site one – the airstrip, site two – the medical clinic, and site three – the Tribal office (Figure 9). The airstrip site has four stake profiles and one camera. The average distance of erosion at the site from 2019 to 2022 was 1.8 ft. (0.5 m) in three years equating to a rate of 0.7 ft./yr. (0.2 m/yr) (Figure 10). The airstrip site could not be updated with 2023 data because the stakes were destroyed during construction. The clinic site has two staked profiles with one camera. There was an average distance of erosion across the two profiles of 4 ft. (1.2 m) over four years equating to a rate of 1.0 ft./yr. (0.3 m/yr) (Figure 11). It is important to note that the two profiles at this site are very different in that one is positioned along an area of unconsolidated sandier sediments and the other is on riprap with the shoreline armored by large boulders. These profiles were installed to view the efficacy of the riprap. The Tribal office site was installed in 2021 and no new measurements were collected in 2023, therefore there was not enough data to generate a graph. Time-lapse cameras were installed at each site. These images were sent to the ACGL and compiled into time-lapse videos, published on the ACGL YouTube channel, and sent via email or flash drive to the communities (Figure 12). A total of 33 coastal profiles were collected in Dillingham from 2019 to 2023. A map of coastal profile locations and one representative profile collected in front of the clinic CBM site can be seen in Supplementary material 4. Many of the coastal topographic profiles show relative stability due to the rockier composition of the sediment but erosion areas do exist. One such area is the clinic, where there has been approximately 6.6 ft. (2 m) of erosion over four years.
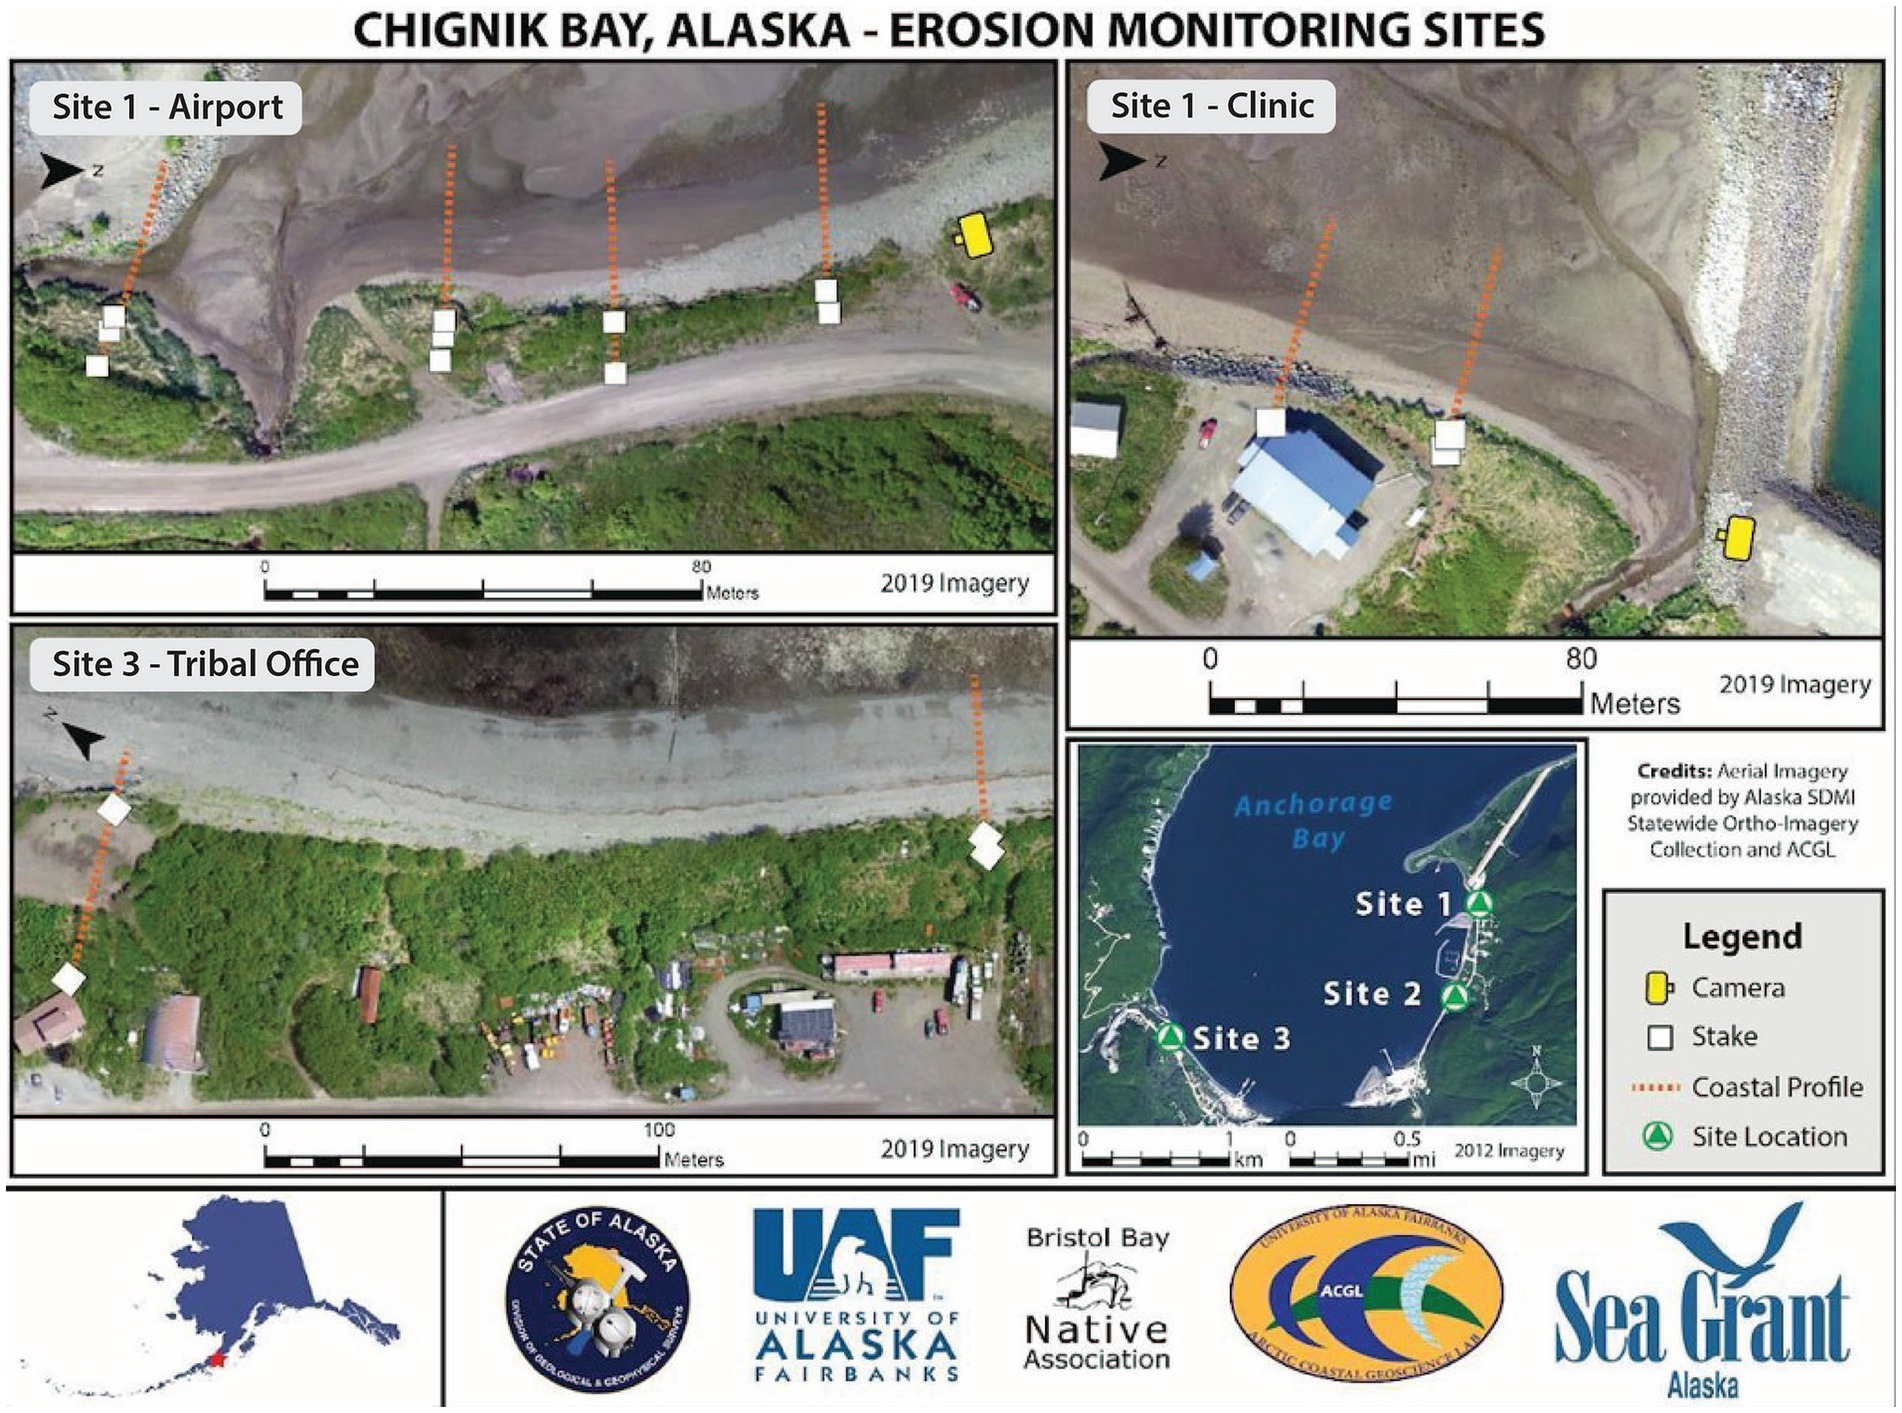
Figure 9. CBM site map in Chignik Bay, Alaska. Stake and camera locations are represented by the white boxes and the yellow rectangle, respectively. Coastal topographic profiles are represented by dotted orange lines.
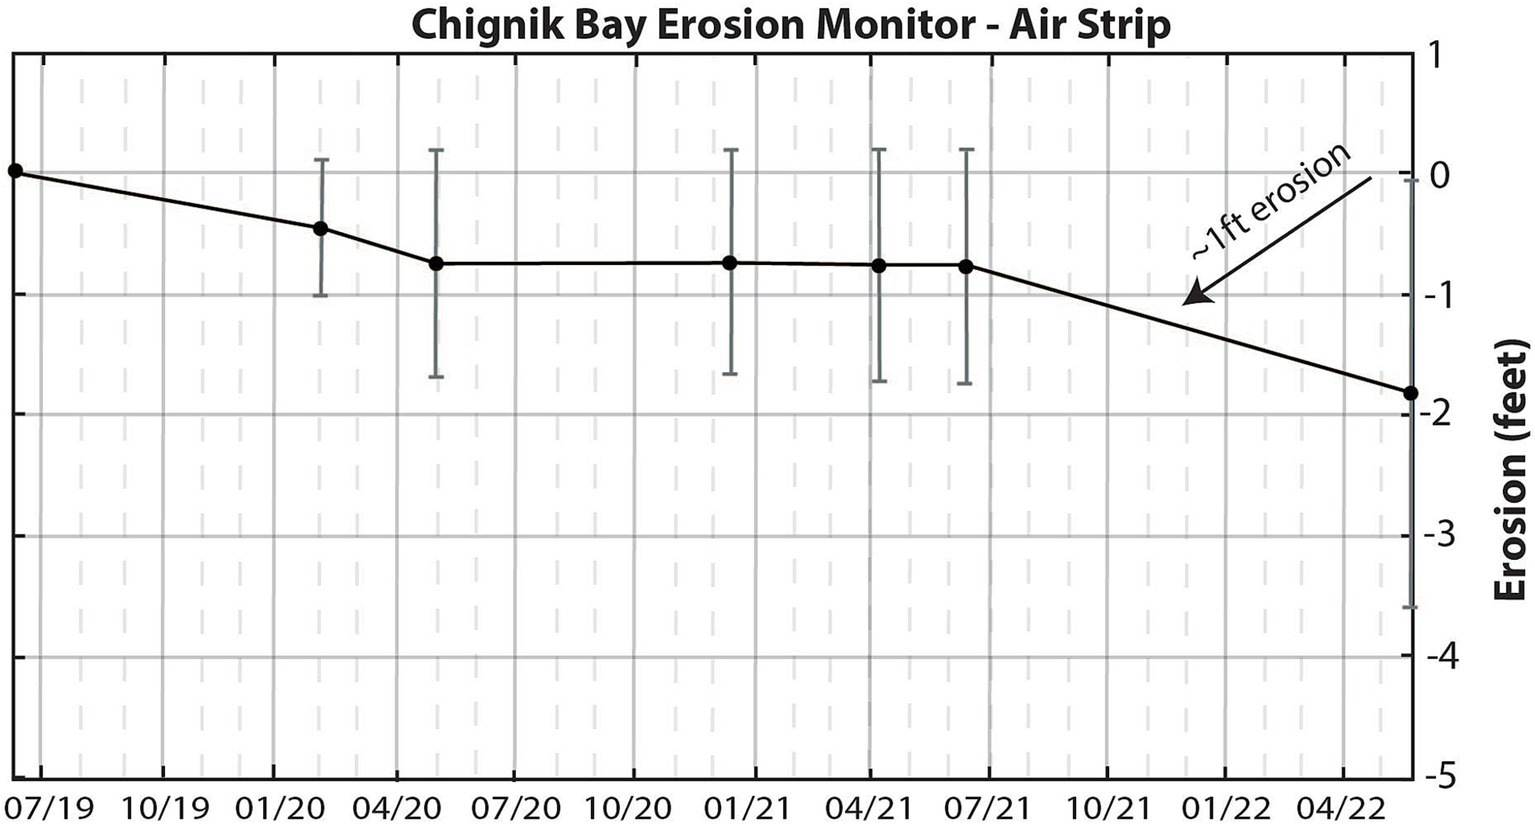
Figure 10. Averaged CBM stake site measurements at the air strip in Chignik Bay, AK. Data were taken from 2019 to 2022. Erosion rates are relatively consistent given the level of uncertainty associated with the measurements.
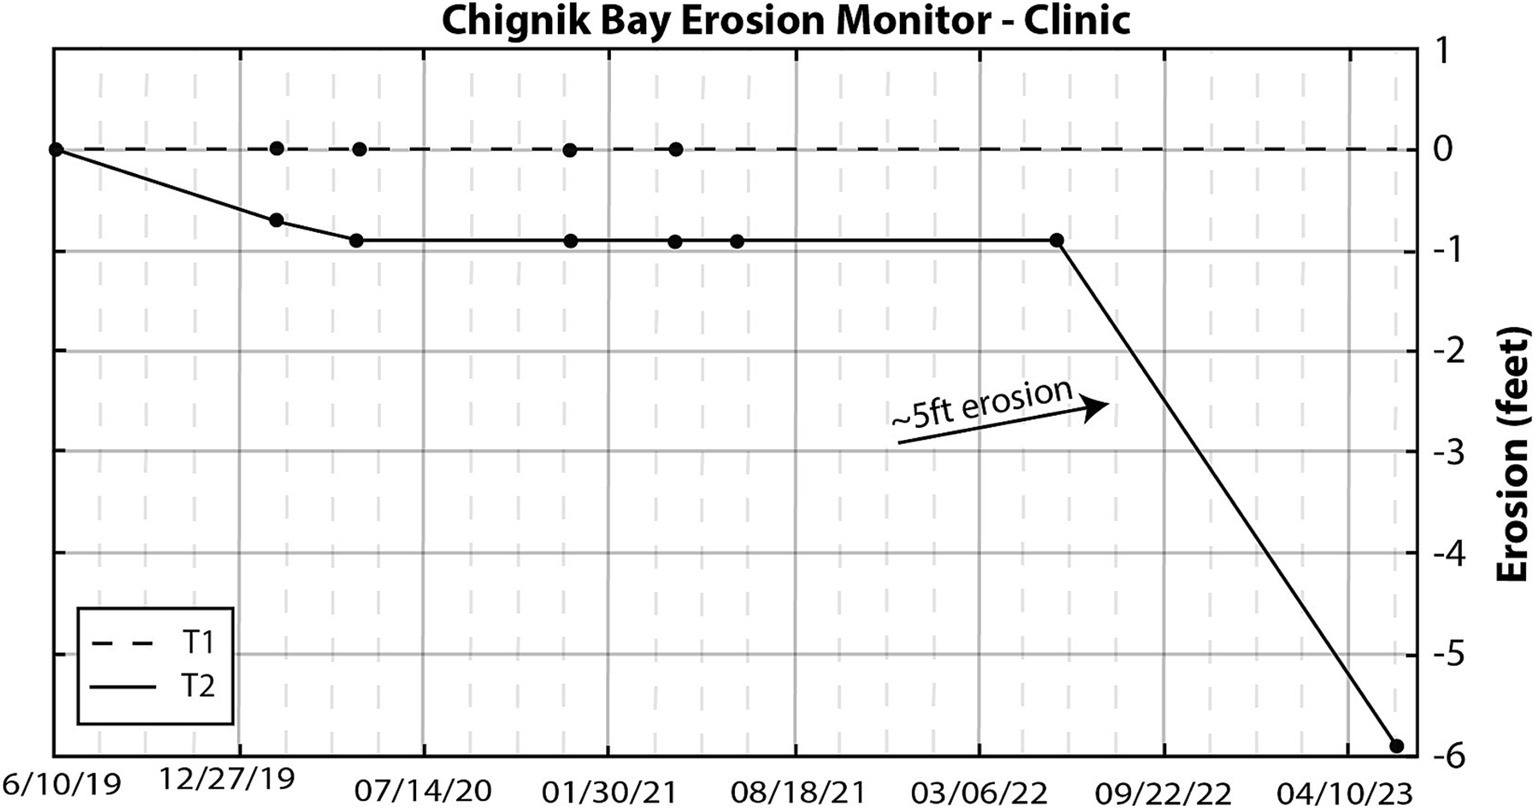
Figure 11. Individual CBM stake site measurements at the medical clinic in Chignik Bay, AK. Data were taken from 2019 to 2023 and are reported here in ft. as they are delivered to community partners. Riprap was placed in front of a section of the clinic, while the remaining area is unconsolidated sediment. T1 is positioned on riprap in front of the clinic. T2 is positioned on unconsolidated sediment in front of the clinic. There was about 6.0 ft. (1.83 m) of erosion at T2 between 2019 and 2023.
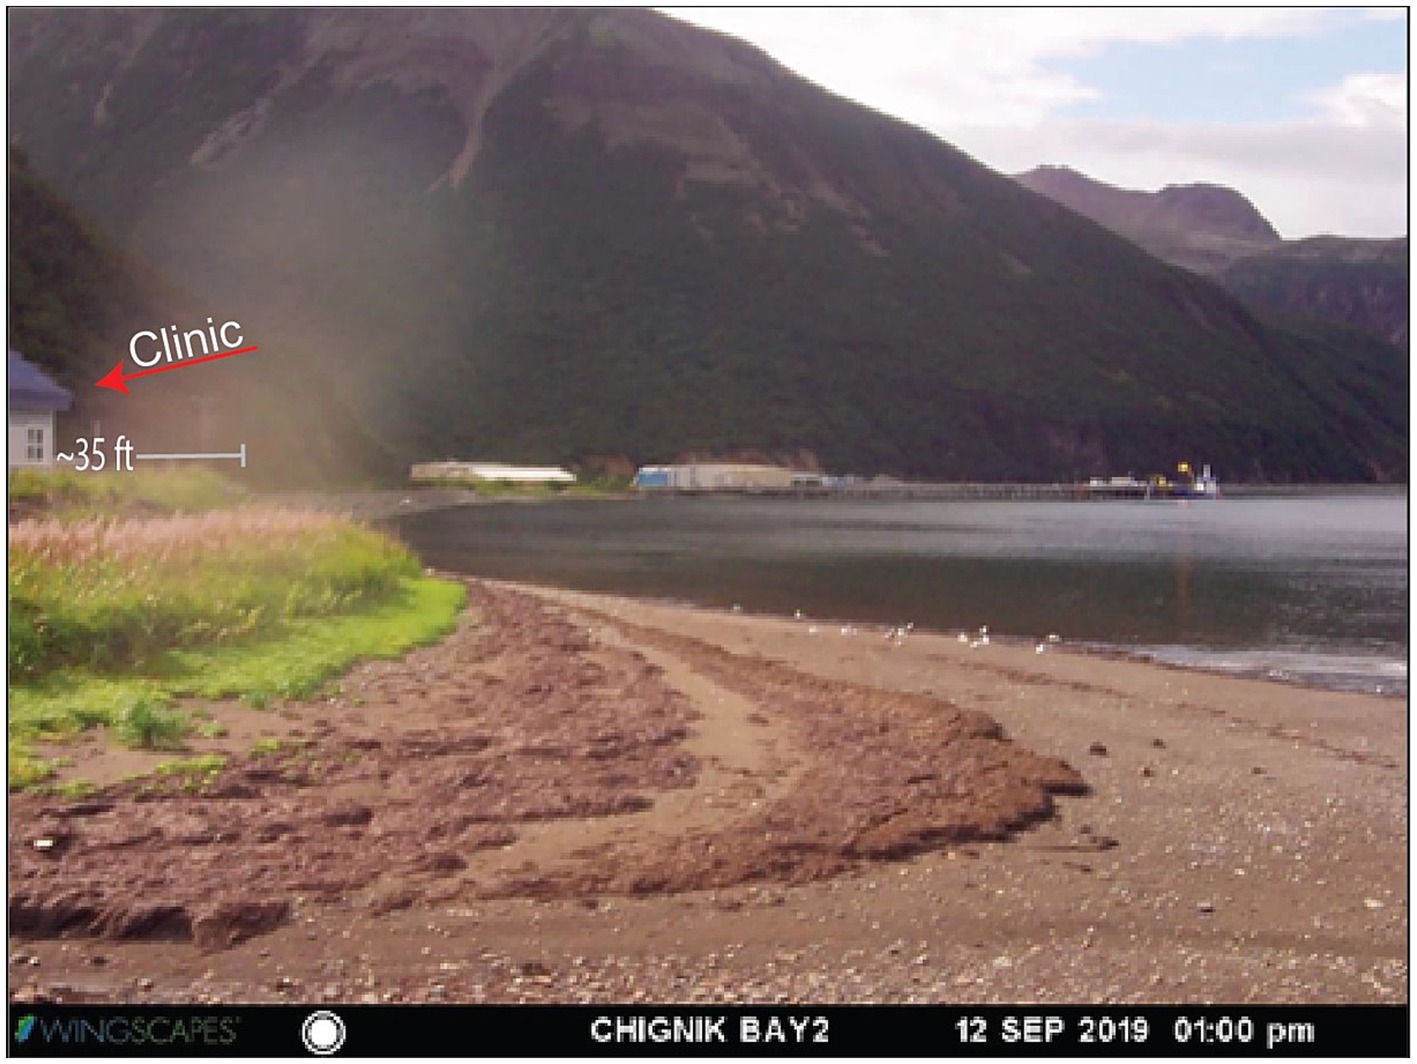
Figure 12. Time-lapse picture and compiled video of the clinic site. Images taken at Chignik Bay from June 2019 to May 2022 (https://youtu.be/3SjWLrm6vOw).
A 60-page hazard assessment report was created using available shoreline datasets and local knowledge (Christian, 2023). The report is organized into seven sections: (1) local narrative, (2) geographic overview, (3) natural hazards and mitigation efforts, (4) data products and assessment tools, (5) identified coastal hazard areas, (6) a summary of community threats and resiliency, and (7) data gaps and future work. The local narrative section includes excerpts from two environmental observers and a consultant with the Chignik Intertribal Coalition. These individuals describe environmental changes they have observed and how these shifts have impacted the community. Following this, the geographic overview provides a regional perspective on the western GOA, along with a brief community history, information on the local population, the geologic setting, climate and meteorology, oceanographic conditions, and the local sea ice regime. The natural hazards and mitigation efforts section outlines the hazards affecting the area, as well as past and ongoing mitigation measures, providing essential context for understanding the interaction between the environment and the community. This is followed by a description of the data products and assessment tools compiled, collected, and created by the ACGL. These data were used to identify areas of the community most vulnerable to coastal hazards, such as the local bridge connecting the two halves of the community, the only road to the airstrip, and the sole medical clinic. The summary of community threats and resiliency section synthesizes the findings, presenting them in a clear, concise manner. The report concludes with a section on data gaps and future work, which highlights areas where further data collection is needed and outlines plans for future efforts. The final report was delivered to the community of Chignik Bay in both PDF format and as a printed copy.
The efficacy of CBM sites is reliant on certain physical and social factors. The environmental rubric has five contributing factors including: (1) vegetation density, (2) a clearly defined shoreline, vegetation line, feature or bluff edge, (3) accessibility and safety, (4) a noticeable changing shoreline, and (5) cause for concern [Supplementary Table S1 (Supplementary material 2)]. Measurement accuracy refers to how distinct the eroding feature is. For example, if there is a cracked bluff, this can cause confusion between data collectors and may decrease influence the accuracy of measurements. The cause for concern factor refers to the social ties to the land and the type of infrastructure located there. For example, power, sanitation, and emergency access infrastructure can increase the need for CBM programs. Supplementary Table S1 (Supplementary material 2) lists the environmental factor descriptions and examples that lead to high or low site suitability and effectiveness for long term monitoring efficacy. The social factors we found as major contributors to the success of a CBM site included: (1) human working capacity, (2) personnel turnover transition, (3) accessibility and relevance of training materials, (4) participation level of community based monitoring environmental observers, (5) amount of support from ACGL, and (4) quality of the relationships between ACGL and community partners [Supplementary Table S2 (Supplementary material 2)]. These factors are, of course, interrelated, and can be coarsely assessed using a rubric for program evaluation and improvements.
First and foremost, CBM programs like this are limited by human working capacity, which refers to the pool of environmental observers’, data collectors, and partnering scientists needed to carry out the work and the time they have available amidst other work tasks (Pollock and Whitelaw, 2005; Sharpe and Conrad, 2006; Conrad and Daoust, 2008). For example, if there are not enough people to do the work both in the communities (e.g., Tribal staff) and at the ACGL (e.g., students and staff), the program will not have the capacity to run effectively or efficiently (Johnson et al., 2016). Turnover time refers to the hand-off from one participant to another.
Staff turnover of environmental observers is common in rural communities and among students in university labs like the ACGL. When one of the people involved leaves, the time to find and train another person to do the job can halt progress (Stone et al., 2014). This may also cause discrepancies in the measurements between different data collectors, as well as the management of the data within the lab. An optimal transition between personnel would include strategies for good communication between outgoing and incoming personnel, and meetings with both community partners and scientists to effectively communicate the history, progress and workflows expected in the partnership.
Training materials allow local environmental observers to confidently collect CBM data throughout the year. Providing relevant and accessible training materials increases the local capacity to train incoming environmental observers and may in turn reduce transition periods between turnover (Pollock and Whitelaw, 2005; Stone et al., 2014; Cheng et al., 2020). It is recommended to provide training materials in multiple different formats, such as in person workshops and written documents. In person workshops are a great way to kickstart a CBM program in a community while written documents are adequate in providing refreshers and guidance to local environmental observers during the year.
As we have found in our Stakes for Stakeholders program, good relationships are the backbone of high quality, sustainable CBM programs. Many of the relationships in CBM programs are cross-cultural, especially in the Arctic and sub-arctic regions, where it is common to see local environmental observers being Indigenous and scientists being non-Indigenous (Johnson et al., 2016). Trust and equitable partnerships are fundamental features of good relationships in research collaborations between non-Indigenous scientists and Indigenous Knowledge holders (Yua et al., 2022; Lazrus et al., 2022; Mercer et al., 2023). We have found one way to build these relationships is by seeking guidance from environmental observers to focus on locally relevant problems at a scale that combines the interests of local communities and research partners (see also Eicken et al., 2021). Another effective way we have found for building these relationships is having informal time for conversation, like time to sit for tea, share meals, have community potlucks together, or even just have informal conversation at the beginning or end of videoconference meetings or phone calls (see also Ford et al., 2013).
The variability in social and environmental conditions between Dillingham and Chignik Bay provided an opportunity to test the assessment rubrics. Environmentally, Chignik Bay is more vulnerable to tectonic activity and associated hazards, whereas Dillingham faces greater risks from erosion and flooding. The diverse range of coastal hazards in each region necessitates a broader approach to identifying effective community-based monitoring (CBM) programs for managing these threats. While the rubrics offer a baseline assessment, certain factors are more relevant than others depending on the specific community (see Tables 1, 2).
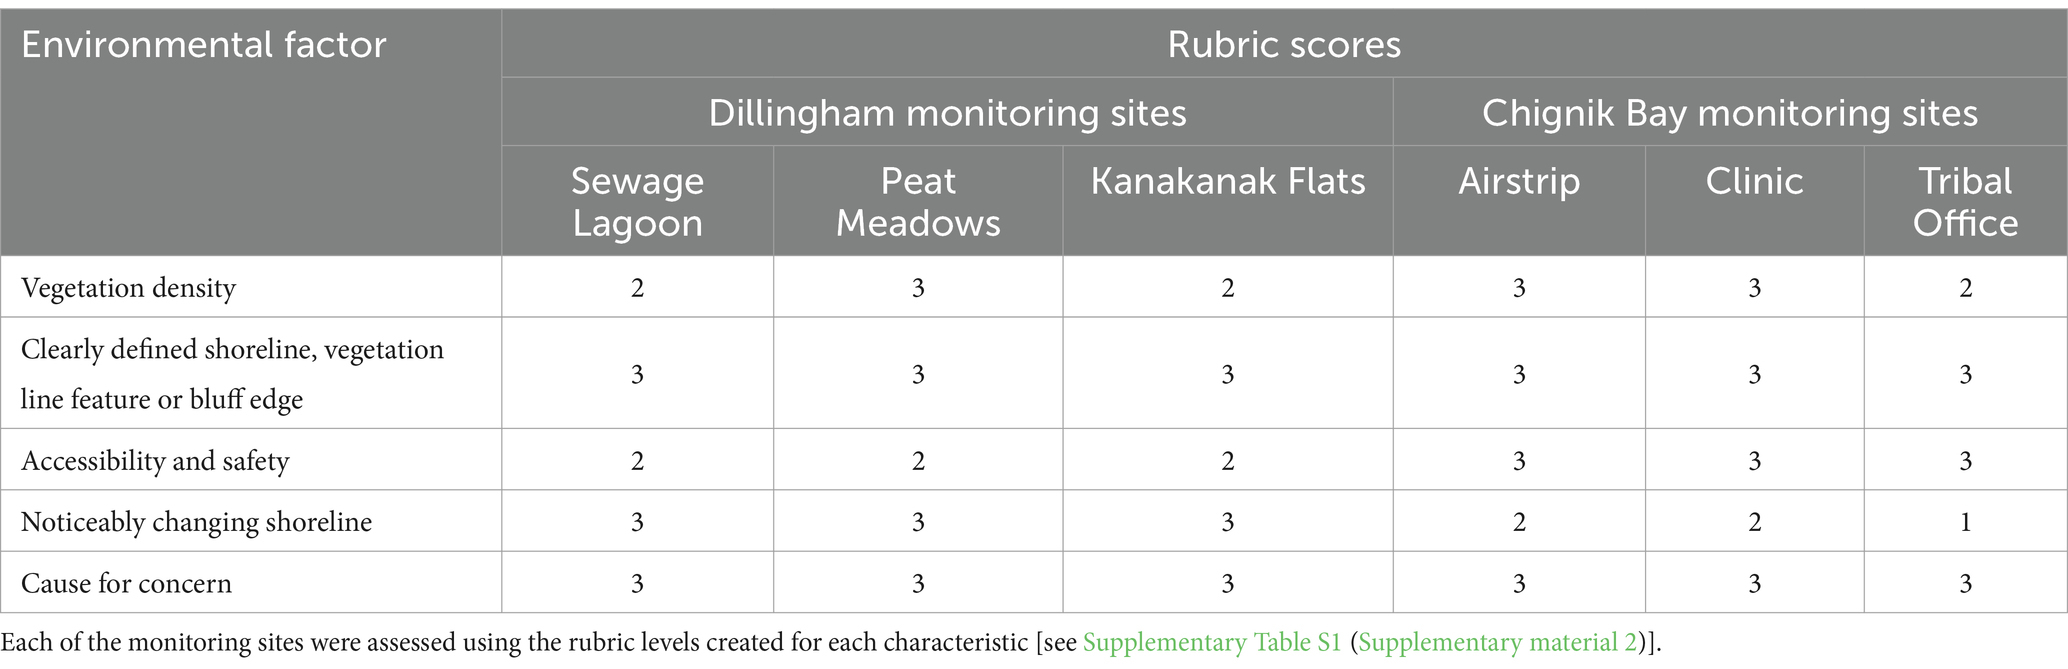
Table 1. Evaluation rubric scores for the environmental suitability of an erosion monitoring site for Dillingham and Chignik Bay, AK.
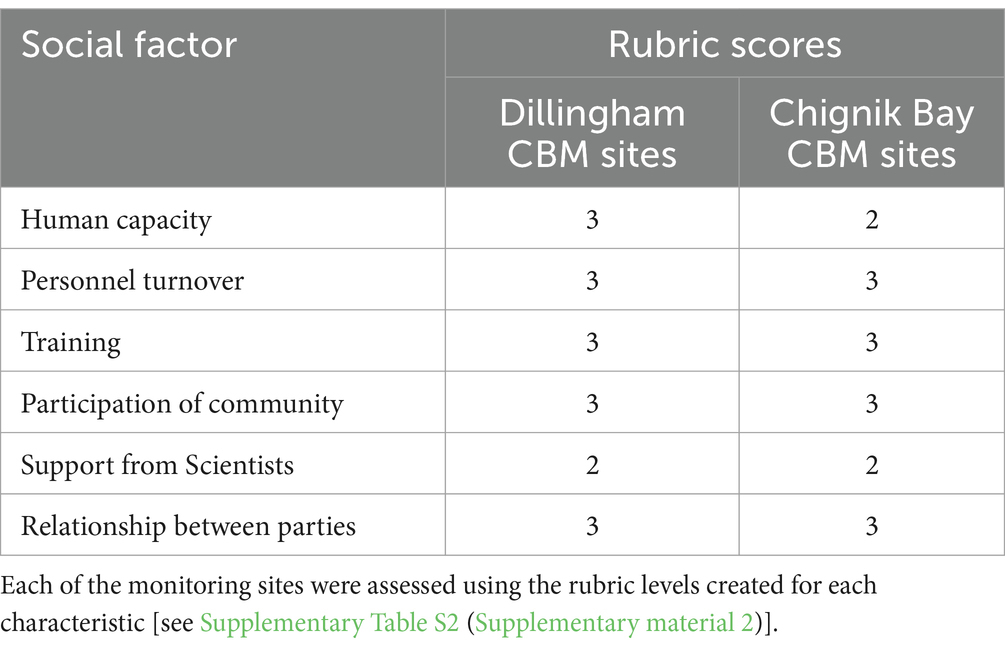
Table 2. Evaluation rubric scores for the social factors contributing to the success and sustainability of the erosion monitoring CBM site for Dillingham and Chignik Bay, AK.
Chignik Bay scored highest in the areas of relationships and community participation. Interviews with residents revealed that erosion is not the community’s primary concern, but local environmental observers remain committed to monitoring efforts. This dedication strengthens community self-advocacy and provides long-term data that could be valuable for future research. However, the lowest score in Chignik’s assessment was for support from scientists. While measurement protocols were provided, data products were not delivered in a timely manner. Allocating more staff time to produce and distribute these products would help reduce delays and ensure a consistent flow of information for the community.
In contrast, Dillingham faces significant erosion, with major land loss and infrastructure risks anticipated within the next 30 years. The community also has a team of environmental observers working with both the BBNA and Curyung Tribe, as well as scientists from the UAF Bristol Bay campus. These factors contributed to the highest scores in Dillingham’s assessment. However, some of the lowest scores were in site accessibility, safety, and support from scientists. As seen in Chignik Bay, the lack of dedicated personnel at the ACGL resulted in delays in product distribution. Additionally, the Dillingham monitoring sites at the sewage lagoon and Kanakanak Flats are in hard-to-reach locations, requiring hikes through dense vegetation over difficult terrain. There have also been reports of bear activity near the monitoring sites, with time-lapse images capturing their presence on the beach. This poses a safety risk to local data collectors, adding an extra layer of precaution that can disrupt regular data collection efforts.
The relationships between the ACGL and local communities facilitated the collection of baseline data, community advocacy, and laid a strong foundation for sustainable CBM programs. Efforts to advance CBM methods included the thorough documentation of protocols, workflows, and the development of assessment tools. This discussion highlights best practices and key considerations for those looking to establish or enhance shoreline change CBM programs.
Community engagement is foundational to the success of CBM programs through ensuring local knowledge and priorities are central to the monitoring process. This reciprocal relationship between researchers and communities is essential for the collection of relevant data and for fostering trust, empowerment, and long-term sustainability (Berkes et al., 2007; Berman and Schmidt, 2019). Successful CBM programs are those that actively involve local communities throughout the project lifecycle (Conrad and Daoust, 2008; Danielsen et al., 2021).
When planning community engagement, flexibility is a critical consideration. Given that environmental observers often serve multiple roles within their communities, the scheduling of fieldwork must accommodate their availability and other community obligations. For example, local observers frequently balance their roles as environmental monitors with subsistence activities, so planning field visits around subsistence harvests or local events ensures that monitoring activities do not disrupt these vital practices (Bronen et al., 2020; Ford et al., 2013). This flexibility extends to the field schedule itself; longer stays (four to seven days) in communities allow researchers to build stronger relationships with local observers, engage in meaningful discussions, and ensure sufficient time to complete both research and engagement objectives (Huntington, 2011; Buzard et al., 2020).
Collaboration with environmental observers in travel planning is another key factor in ensuring the success of CBM programs. Aligning fieldwork trips to occur at similar times each year creates consistency in data collection, which is particularly valuable when comparing environmental change over time (Danielsen et al., 2021). This consistency also makes it easier to account for seasonal variation in environmental conditions (Gofman, 2010).
Data sharing also presents logistical challenges in remote communities, where internet bandwidth can be limited. For instance, large files generated by CBM programs, such as raster data or GNSS data, are often too large to download over local internet connections (Cazenave and Cozannet, 2014). To address this, physical copies of reports and flash drives are often used to deliver data products directly to community members. Additionally, publishing data products on external platforms such as the ACGL’s YouTube channel or the Alaska Water Level Watch website (Alaska Water Level Watch [AWLW], 2023; Hohonu, 2023) offers more reliable and accessible means for local stakeholders to access information. By utilizing external hosting sites, researchers ensure that data is publicly available and easy to access for a broader audience, including community members who may not have access to high-speed internet or specialized software like GIS.
Building and maintaining strong relationships with community partners is integral to the success of any CBM initiative. Successful relationship-building strategies include fostering open, two-way communication between researchers and community members. This approach ensures that research aligns with local priorities while building trust, an essential component of any long-term research partnership (Berkes et al., 2007; Bronen et al., 2020). Listening to community members and engaging in meaningful conversations allows researchers to better understand local environmental concerns and community dynamics, thus facilitating the creation of more relevant data products (Danielsen et al., 2021).
Before conducting fieldwork, researchers should familiarize themselves with the history of the community and any previous research conducted in the area. This preparation signals respect for the community’s experiences and provides a deeper understanding of community concerns, ensuring that the research process is sensitive to local values and priorities (Maldonado et al., 2014). Engaging with local community members during field visits—whether through informal conversations or structured meetings—creates opportunities for researchers to refine their research questions and improve their data collection methodologies based on community feedback (Berman and Schmidt, 2019). As observed in the Stakes for Stakeholders program, these conversations often lead to new insights into environmental conditions that might otherwise go unreported in scientific studies (Christian, 2023; Buzard R. et al., 2019). Consistent follow-up is equally important. Researchers should regularly check in with environmental observers to ensure that data products meet community needs and to discuss how these products will be used for local decision-making (Ford et al., 2013; Danielsen et al., 2021). The iterative nature of CBM means that ongoing feedback from community members is crucial for refining the monitoring process and ensuring that the data collected serves the long-term interests of the community (Conrad and Daoust, 2008).
As community engagement and relationship-building strategies evolve, it is important to consider how local knowledge and expertise are integrated into the research process. CBM offers a platform for incorporating Indigenous and local ecological knowledge alongside scientific data, fostering a more holistic understanding of environmental change (Berkes et al., 2007). This integration strengthens the relevance of the data and empowers communities by validating their knowledge within the scientific framework (Huntington, 2011; Bronen et al., 2020). The success of CBM programs depends on recognizing the value of this knowledge and fostering an environment where community expertise is respected and integrated into every stage of the research process (Danielsen et al., 2021).
By adopting a flexible, community-centered approach to planning, data collection, and product revision, CBM programs can enhance their sustainability and effectiveness (Buzard et al., 2020). The Stakes for Stakeholders program underscores the importance of relationship-building, flexibility, and ongoing communication to produce reliable scientific data that serves the practical needs of local communities. When CBM is implemented with respect for local knowledge and a commitment to mutual benefit, it has the potential to support more effective decision-making, greater community resilience, and stronger partnerships between scientists and Indigenous communities (Ford et al., 2013; Danielsen et al., 2021).
Observations from CBM efforts provided a better understanding of erosion rates and drivers in Dillingham and Chignik Bay. Remote-sensing based shoreline change analyses typically have fewer temporal samples than CBM, resulting in a long-term linear change rate computation. These frequent erosion measurements help answer questions as to whether erosion rates are accelerating and what specifically causes erosion, information used by mitigation planners to respond appropriately.
There are specific questions about dynamic erosion processes that are difficult to answer with remotely sensed data, that can be answered by community-led interests, discoveries, and actions. These benefit from having in-situ and camera observations at high temporal sampling, high resolution, and with added context from local observers. For example, the Chignik Clinic area has relatively slow erosion, seen in the in-situ measurements that may be missed in aerial imagery. Extrapolating the CBM erosion rate with the distance to the Clinic suggests erosion would reach the Clinic in about 25 years. However, the data span is short, and erosion is episodic, with events occurring less than annually. Continued monitoring is necessary to refine the erosion projection estimate. Additionally, the comparison to the riprap shows that the riprap successfully prevented erosion. With this detailed analysis, community planners have a greater understanding of the risk, namely the amount of time to respond to erosion before it affects the Clinic and the needed monitoring to refine that estimate. The success of the riprap also provides planners with a potential solution that can be weighed against installation and maintenance costs, plus any observed adverse impacts that may have been caused by riprap.
CBM fills data gaps invites more observations about erosion processes that help scientists and planners better understand how to interpret results and make decisions. In coastal Alaska, erosion most commonly occurs in areas with unconsolidated sediments and high storm activity (U.S. Army Corps of Engineers, 2009; Overbeck et al., 2020). The city of Dillingham is underlain by unconsolidated sediments such as well-sorted Quaternary alluvial, glacial, and dune sand and silt deposits (Beikman, 1974). These unconsolidated sediments also have isolated masses of permafrost (Hartman and Johnson, 1984). As the shoreline erodes and permafrost is exposed, thermo-erosional processes result in faster erosion of unconsolidated sediment compared to rocky coastlines or sediments without permafrost (Overbeck et al., 2020).
Erosion does not have to be immediately impactful to a community for a CBM program to be a success. Chignik Bay is an example where erosion has been slow and steady, however, the environmental observers are highly engaged. Maintaining a strong relationship with environmental observers through year-round communication, incorporating their feedback into data products paved the way for a successful CBM program. It may also be beneficial to coordinate with DOT and on-site construction workers in the future to ensure monitoring sites are not destroyed, as the airstrip was. The most prominent surficial geology in Chignik Bay is bedrock, promoting a relatively stable shoreline and coastal configuration. Much of the coastline fronting community infrastructure is also protected by riprap/revetments. Based on the CBM measurements and local observations, the clinic has recently experienced an increase in erosion from a storm event in May 2023. Chignik Bay is located in close proximity to active faults and the possibility of sudden tectonic uplift or subsidence may influence erosion rates in the future (DeGrandpre and Freymueller, 2019). For example, on March 27th, 1964, a 9.2 MW earthquake and several aftershocks caused uplift as much as 10 m on land and 15 m in the ocean in southcentral Alaska (Plafker, 1965). This resulted in a sudden change in shoreline processes and beach morphology in the region (Stanley, 1968). A more recent earthquake in 2020 approximately 100 miles south of Chignik Bay over the Shumangan Islands resulted in megathrust-type rupture (Santellanes et al., 2022). Events like these can alter shoreline processes, which may increase erosion rates as seen in the past (Stanley, 1968). CBM programs can be used to monitor impacts from sudden events like these in addition to gradual morphological changes over time.
Time-lapse cameras were useful when installed in more secluded areas or on private property in capturing visual changes to the shoreline in both communities from spring-fall. Camera derived measurements may be useful in communities where consistent stake ranging measurements cannot be collected. They may also be particularly useful in capturing specific erosion events, in the event weather conditions are not safe for measurement collection.
The assessment rubrics were used to evaluate areas of success and those that need improvement. These rubrics are also applicable tools for other CBM programs in scoping out the suitability of a potential monitoring site as well as assessing the human capacity needed on both the program staff and community collaborator sides of the CBM workflows.
Iterative feedback throughout the CBM programs identified several environmental contributing factors to be addressed to improve data collection. For example, dense vegetation blocked camera views of shoreline edges, making stake-ranging measurements extremely valuable during the summer. Local partners from Dillingham and Chignik Bay reported confusion in collecting measurements in areas where there were cracks in the bluff or slumps in front of the shoreline with the most common question being where on the eroding feature should the measurement be taken. For example, if a tuft of grass was curling downward over the bluff do you measure to its most seaward point or where the slope changes on the bluff? To alleviate this issue, ACGL scientists were able to recommend using the break in slope at the bluff edge when the vegetation line was not distinct. Maintaining an open communication channel helped to quickly address questions and ensure successful data collection.
Another important characteristic to take into consideration is the noticeability of erosion at the monitoring site. If there is no noticeable change, data collection may seem unnecessary over the time scale of the typical data collection, which appeared to be the case in the Chignik Bay sites. This demonstrates that the interval between measurements should vary between sites. For example, in Dillingham, to keep up with the high erosion rates it is necessary to take measurements at least three times a year, while in Chignik Bay once or twice per year is likely enough. The one exception to this is when there is the opportunity to collect measurements before and after a storm event. This can be a difficult task in the face of and the aftermath of an extreme storm event, but the data is critical to deciphering the drivers of change at each location. Data from pre- and post-storm collection was some of the most revealing of this project. These data are especially important to collect as disaster funding agencies, such as FEMA, do not recognize erosion to be a disaster, but storms are recognized as disasters and qualify for relief funding. In this case, if storms are proven to be the cause of erosion, communities may qualify for disaster relief funding to address erosion concerns.
In our evaluation of the social factors influencing the CBM site success, we found that it was important to invest in maintaining a pool of people with the time, interest, and capacity to conduct the regular shoreline measurements. Chignik Bay has a much smaller population than Dillingham, limiting the possible number of environmental observers and assistants, resulting in a lower social factor score of Human Capacity than Dillingham. Chignik Bay has a smaller population therefore a smaller pool of applicants to carry out CBM tasks which may result in longer turnover periods and fewer erosion measurements. Effective CBM efforts align the program commitments to the motivations a community member may have in taking on stewardship of the monitoring site. Motivations of environmental monitoring programs generally fall into five themes: values (wanting to contribute to science or society while helping the environment), personal development (learn about the environment, gain technical skills, connect with their place), career development or recognition (gain experience or recognition related to career interest), social connection (feeling a part of a community), and recreation (having fun by doing science outside; i.e., Robinson et al., 2021). To justify the time commitment, a CBM program could create opportunities within the program to connect with other communities involved, opportunities for recognition, and opportunities for broader technical training (drone piloting, shoreline assessments, etc.). For example, the environmental observer in Chignik Bay expressed interest in gaining surveying experience to expand their skillset for future employment. During summer visits, the environmental observer would join visiting researchers and help collect topographic and UAV surveys. These experiences allow local environmental observers to build their skillsets and expend career opportunities while visiting researchers may learn more about the local environment and receive extra help in data collection.
There were many challenges to overcome throughout the program. Four common or most challenging setbacks were related to community capacity; data overload and processing time; community involvement; and data archiving, accessing, and sovereignty. Human capacity was commonly reduced due to an environmental observer/local data collector leaving the position. The turnover time between positions was long and generally caused wide time gaps between data collection and meetings. The setbacks from turnover can be reduced by supporting the local capacity to train new staff, providing training materials, and keeping flexibility to be able to revisit the site to train new personnel. Scheduling also presented an issue during planning phases. Residents in communities have many obligations and do not always have the time to collect data or attend meetings. Planning consistent meetings ahead of time as well as having back-up collectors would help solve this problem. Both turnover and scheduling setbacks can be mitigated by broadening the network within the community. For example, Dillingham has three active environmental observers at a time, resulting in relatively consistent data collection despite these setbacks.
Another common problem encountered was centered around planning meetings. Meetings are an integral part of CBM and form the foundation of connections between researchers, local governing bodies, environmental observers, and community members. It is also important to have representation from all of the local governing bodies. In Alaska’s rural communities, this usually includes representatives from the City, Tribal Council, and Native Corporation. When establishing a CBM program a meeting with local governing bodies, environmental observers, and researchers is recommended to gain a general idea of what type of research the community is interested in. Initial conversations may be carried out over online meetings, but an in-person meeting is also recommended for making final decisions. Once the program is established, follow up meetings with environmental observers may be scheduled online throughout the year, depending on their schedule. These meetings provide a space for environmental observers to ask questions, report on what they’ve collected and any changes they notice, and for researchers to provide assistance and share preliminary data products. When presenting polished results, community meetings may be held in person through a public forum with local governing bodies, environmental observers, and for community members to share feedback and ask questions. As previously mentioned, local partners often have several roles within their community, making their time limited. Therefore, it is important to agree on the purpose of a community meeting before holding one. If there are no particularly impactful results to the community, a large public forum may not be necessary. This helps avoid wasting community members’ time and streamlines meeting agendas and outcomes.
The second most common issue of the CBM program was the data overload for the ACGL. There are a myriad of monitoring datasets collected throughout the years. Data and analysis products were consistently delayed due to a lack of a consistent organization and processing by students. Having specialized data management positions, protocols, and shared workspaces for data storage and processing can combat these issues. Having a staff position strictly for data management, and another for data processing helps to streamline the workflow and improve timeliness of products. Providing more guidance to inexperienced students who are leading these reports or incorporating them into the student’s research projects can help streamline this work.
The final takeaway revolves around data archiving, access, and sovereignty. This factor is a combination of data management, community involvement, and community capacity. Before promising data and products to communities, it is critical to identify how these will be shared, accessed, and who they belong to. Having conversations about data sovereignty with local partners helps both communities and scientists understand who owns the data and products. Data sovereignty refers to the community’s authority and right to control data collected within their community. The ACGL and local partners share ownership, in this case. Local data collectors are listed as co-authors and are included in the review process for all data products and reports generated by the ACGL. Raw data is kept on the ACGL servers and analyzed data is given to local environmental observers. While many communities do not have the capacity to host, process, and analyze raw data, it is important that they know what datasets are available for the community, as it is integral for planning. While this is not a comprehensive program evaluation, which would ideally be conducted by an external evaluator, it is nonetheless a useful tool in self-evaluation. The assessment tools provide general guidance to researchers to self-reflect on program success and ensure community needs are at the forefront of the work.
The hazard assessment report examines environmental conditions in Chignik Bay to provide an up-to-date resource for environmental observers and local government to reference when planning for the future of the community (Christian, 2023). The resulting work also bolstered self-advocacy through the form of local environmental observers’ role in data collection and operation of erosion monitoring sites. Chignik Bay has used the hazard assessment report to consult engineering firms and other funding agencies for mitigation efforts and the expansion of other research projects. Maps and graphics included in the report are able to be used in the Tribal Hazard Mitigation Plan (THMP) and within funding proposals directed at federal entities, including the Bureau of Indian Affairs Tribal Resiliency Program. THMPs are typically updated every 5 years in compliance with federal hazard mitigation planning regulations and focus on community specific planning and goals, while the hazard assessment report puts more of a focus on available datasets for the community and a more detailed resource for the environmental setting. Comprehensive datasets were also provided for engineering firms working with the community on hazard mitigation and infrastructure development.
There is no current plan to update the hazard assessment report as it has not been requested by the community, however, there are still plans for future data collection and collaboration with the community through field visits and ongoing graduate student research. When deciding between the different types of deliverables (i.e., comprehensive reports vs. individual data products) it is important to consider timelines. The written report took months to compile and was subject to delays due to increasing workload, though may not need to be updated as often as individual data products do. Individual data products may be delivered in a timelier manner, though they are specific and may not encompass what a community needs. Therefore, it is critical to have a discussion with community partners to determine the scope of their needs before deciding to move forward with these reports.
Rural coastal communities in Alaska are experiencing increasing damage to infrastructure due to climate-driven flooding and erosion. CBM programs offer a solution to fill gaps in local shoreline data, producing valuable, community-relevant data products that inform decision-making to mitigate infrastructure damage. The Stakes for Stakeholders program serves as a key example of how CBM can empower local communities by providing training opportunities for both the next generation of geoscientists and local environmental observers. The program also emphasizes the importance of making data collection protocols and workflows accessible, ensuring that local environmental observers and research staff can easily implement and sustain monitoring efforts over time.
Through the Stakes for Stakeholders program, a range of important data products, including hazard assessment reports, topographic surveys, updated aerial imagery, elevation models, and erosion rates, were generated. These data products directly supported Dillingham and Chignik Bay in securing funding for erosion mitigation efforts. In Dillingham, shoreline change rates average 4.7 ft./yr. (1.4 m/yr), although variability exists across different sections of the coastline. Similarly, in Chignik Bay, the average shoreline change rate is 1.5 ft./yr. (0.4 m/yr), though the loss of monitoring sites has made some data collection more challenging. However, the erosion rates recorded at the clinic site in Chignik Bay, where riprap has been installed, provide critical insights into the increasing erosion pressures surrounding the community.
While the Stakes for Stakeholders program ended with the conclusion of its funding, the foundational work established—through written protocols and workflows—has enabled a smooth transition between research staff, ensuring the continued evolution of erosion and hazard monitoring efforts. Ongoing work in the region involves integrating advanced environmental monitoring technologies, such as water level sensors, weather stations, and wave buoys, into CBM programs. In addition, efforts to expand local training programs and school outreach are under development, which may include training students and community members in UAV operation, data analysis, and coastal hazard research.
This research contributes to the growing body of literature on the inner workings of CBM programs (e.g., Danielsen et al., 2021; Gofman, 2010; Johnson et al., 2016; Kouril et al., 2016; Sigman, 2015), offering insights into how these programs can be designed and implemented to address local priorities and research gaps. By investigating the operational mechanisms of CBM in a digestible and replicable manner [see Supplementary Tables S1, S2 (Supplementary material 2)], this study provides a practical blueprint for researchers and community leaders interested in launching or enhancing their own CBM programs.
Moreover, this research reinforces the wide applicability of CBM across a variety of fields where local decision-making and policy development are key (García-Ruiz et al., 2017; Obubu et al., 2022; Parven et al., 2022). As demonstrated in this case study, Stakes for Stakeholders has contributed to local erosion mitigation and planning efforts in Dillingham, Chignik Bay, and surrounding communities. The success of the program can be measured through the strong partnerships built between local communities, the ACGL, and other stakeholders, as well as the substantial funding opportunities that have resulted from the data collected. For example, the Chignik Bay monitoring site played a pivotal role in securing half a million dollars in funding for local erosion mitigation projects and supporting graduate student research on local coastal hazards. By bridging local knowledge with scientific data, CBM methodologies have shown their potential to drive meaningful environmental governance, particularly in areas heavily impacted by climate change. This research illustrates how CBM programs can be an effective tool in addressing urgent environmental challenges, enhancing community resilience, and expanding research opportunities in remote, underserved regions.
Ultimately, the findings of this study highlight the importance of reciprocal relationships between scientists and local communities, emphasizing that mutual respect and community empowerment are critical for the long-term success and sustainability of CBM initiatives. When designed with flexibility, inclusivity, and respect for local knowledge, CBM can address immediate environmental needs while build a foundation for long-term community engagement in scientific research and environmental decision-making.
The datasets presented in this study can be found in online repositories. The names of the repository/repositories and accession number(s) can be found in the article/Supplementary material.
Written informed consent was obtained from the individual(s) for the publication of any potentially identifiable images or data included in this article.
JCh: Conceptualization, Data curation, Formal analysis, Investigation, Methodology, Software, Project administration, Visualization, Writing – original draft, Writing – review & editing. RiB: Conceptualization, Data curation, Formal analysis, Methodology, Writing – original draft, Writing – review & editing. KS: Conceptualization, Formal analysis, Methodology, Visualization, Writing – original draft, Writing – review & editing. HB: Data curation, Writing – original draft, Writing – review & editing. ReB: Data curation, Writing – original draft, Writing – review & editing. JCa: Writing – original draft, Writing – review & editing. GD: Conceptualization, Methodology, Writing – original draft, Writing – review & editing. SF: Conceptualization, Methodology, Writing – original draft, Writing – review & editing. RG: Data curation, Writing – original draft, Writing – review & editing. JO: Writing – original draft, Writing – review & editing. CM: Data curation, Formal analysis, Funding acquisition, Investigation, Methodology, Supervision, Visualization, Writing – original draft, Writing – review & editing.
The author(s) declare that financial support was received for the research, authorship, and/or publication of this article. The funders of this project include Alaska Sea Grant, the DGGS Coastal Hazards Program, the National Science Foundation Navigating the New Arctic program awards (ICER-1927827 and RISE 2318375), and the National Science Foundation CAREER award (OPP 1848542). Thanks to the Native Village of Twin Hills and the Native Village of Togiak for also providing funding for this research. The University of Alaska Fairbanks also provided funding through the Thesis Completion Fellowship and awards.
The authors would like to acknowledge all local partners from Chignik Bay, Dillingham, Ivanof Bay, Nelson Lagoon, Pilot Point, Port Heiden, Levelock, Ekuk, Naknek, Twin Hills, Togiak, Goodnews Bay, and Saint Paul Island. The authors would like to give a special thanks to Renee Rogue, Desi Bond, and CaSandera Johnson for their help and hard work coordinating CBM activities at Dillingham. The authors would also like to give a special thanks to Debbie Carlson and Ed Krauss for their efforts and hard work coordinating and collecting CBM activities at Chignik Bay. The authors appreciate all the contributions they have made to maintain the CBM sites and for sharing their knowledge and homes with us. Their insight has been invaluable to this research and their company, delightful. The authors would like to thank those who have provided training and guidance throughout my degree. Special thanks to Jacquelyn Overbeck for sharing your knowledge, passion, and for your continued support. As part of the reason that the Stakes for Stakeholders project came to fruition, your strong leadership and perspective helped guide this research and inspire me as a young scientist. The authors would like to thank my friends and family for their constant support. Thanks to my friends and family for believing in me when I could not. To the many friends I made in Alaska who have provided endless support, thank you. Finally, the authors would like to thank my canine and feline companions, Zoe and Rowena, for the unconditional love and laughter through it all. Adobe 28.0 Generative AI technology was used for making of Figure 2.
The authors declare that the research was conducted in the absence of any commercial or financial relationships that could be construed as a potential conflict of interest.
All claims expressed in this article are solely those of the authors and do not necessarily represent those of their affiliated organizations, or those of the publisher, the editors and the reviewers. Any product that may be evaluated in this article, or claim that may be made by its manufacturer, is not guaranteed or endorsed by the publisher.
The Supplementary material for this article can be found online at: https://www.frontiersin.org/articles/10.3389/fclim.2024.1410329/full#supplementary-material
Alaska Native Tribal Health Consortium. (2016). IGAP Roles. Available online at: https://www.anthc.org/wp-content/uploads/2016/01/IGAP_Roles_051016.pdf (Accessed March 13, 2023)
Alaska Water Level Watch [AWLW]. (2023). Alaska Ocean Observing Systems. Available online at: https://aoos.org/alaska-water-level-watch/ (Accessed March 14, 2023)
Bailie, J., Potts, B. A., Laycock, A. F., Abimbola, S., Bailie, R. S., Cunningham, F. C., et al. (2021). Collaboration and knowledge generation in an 18-year quality improvement research programme in Australian Indigenous primary healthcare: a coauthorship network analysis. BMJ open 11:e045101.
Beikman, H. M. (1974). Preliminary geologic map of the southwest quadrant of Alaska (No. 611). Reston, VA: US Geological Survey.
Berkes, F., Berkes, M. K., and Fast, H. (2007). Collaborative integrated management in Canada's north: The role of local and traditional knowledge and community-based monitoring. Coast. Manag. 35, 143–162. doi: 10.1080/08920750600970487
Berman, M., and Schmidt, J. I. (2019). Economic effects of climate change in Alaska. Weather Clim. Soc 11, 245–258. doi: 10.1175/WCAS-D-18-0056.1
Bogardus, R. C. (2021). Identifying Spatial Patterns of Storm Driven Flooding and Erosion at Nelson Lagoon, Alaska [Master’s Thesis]. Fairbanks, AK: University of Alaska Fairbanks.
Bronen, R., Pollock, D., Overbeck, J., Stevens, D., Natali, S., and Maio, C. (2020). Usteq: integrating indigenous knowledge and social and physical sciences to coproduce knowledge and support community-based adaptation. Polar Geogr. 43, 188–205. doi: 10.1080/1088937X.2019.1679271
Buzard, R. M., Kinsman, N. E. M., Maio, C. V., Erikson, L. H., Jones, B. M., Anderson, S., et al. (2023). Barrier Island Reconfiguration Leads to Rapid Erosion and Relocation of a Rural Alaska Community. J. Coast. Res. doi: 10.2112/JCOASTRES-D-22-00093.1
Buzard, R. M., Maio, C. V., Verbyla, D., Kinsman, N. E., and Overbeck, J. R. (2020). Measuring historical flooding and erosion in Goodnews Bay using datasets commonly available to Alaska communities.
Buzard, R. M., Overbeck, J. R., and Maio, C. V. (2019). Community-based methods for monitoring coastal erosion, Alaska Division of Geological Geophysical Surveys Information Circular, 84.
Buzard, R., Overbeck, J., and Maio, C. (2019). Baseline shoreline assessment using timelapse photography and emery rods. Environmental Protection Agency Quality Assurance Project Plan, approved 3/8/2017, updated and approved 4/11/2019.
Buzard, R. M., Turner, M. M., Miller, K. Y., Antrobus, D. C., and Overbeck, J. R. (2021). Erosion exposure assessment of infrastructure in Alaska coastal communities: Report of Investigation RI 2021–3. Fairbanks, AK: Alaska Division of Geological & Geophysical Survey.
Capdevila, P., Stott, I., Beger, M., and Salguero-Gómez, R., (2020). Towards a comparative framework of demographic resilience. Trends in Ecology & Evolution 35, 776–786.
Cazenave, A., and Cozannet, G. L. (2014). Sea level rise and its coastal impacts. Earth's Future 2:15. doi: 10.1002/2013EF000188
Cheng, Y., Yu, J., Shen, Y., and Huang, B., (2020). Coproducing responses to COVID‐19 with community‐based organizations: lessons from Zhejiang Province, China. Public Administration Review 80, 866–873.
Christian, J. E. (2023). Community-Based Monitoring: Shoreline Change in Southwest Alaska. [Master’s Thesis]. Fairbanks, AK: University of Alaska Fairbanks.
Clark, J. H., McGregor, A., Mecum, R. D., Krasnowski, P., and Carroll, A. M. (2006). The commercial salmon fishery in Alaska. Alaska Fishery Res. Bulletin 12, 1–146.
Cohen, J., Screen, J. A., Furtado, J. C., Barlow, M., Whittleston, D., Coumou, D., et al. (2014). Recent Arctic amplification and extreme mid-latitude weather. Nat. Geosci. 7, 627–637. doi: 10.1038/ngeo2234
Conrad, C. T., and Daoust, T. (2008). Community-based monitoring frameworks: Increasing the effectiveness of environmental stewardship. Environ. Manag. 41, 358–366. doi: 10.1007/s00267-007-9042-x
Danielsen, F., Johnson, N., Lee, O., Fidel, M., Iversen, L., Poulsen, M. K., et al. (2021). Community-based monitoring in the Arctic. Fairbanks, AK: University of Alaska Press.
DeGrandpre, K. G., and Freymueller, J. T. (2019). Vertical velocities, glacial isostatic adjustment, and Earth structure of Northern and Western Alaska based on repeat GPS measurements. J. Geophys. Res. Solid Earth 124, 9148–9163. doi: 10.1029/2018JB017163
DeVries, B., Pratihast, A. K., Verbesselt, J., Kooistra, L., and Herold, M. (2016). Characterizing forest change using community-based monitoring data and Landsat time series. PLoS One 11:e0147121. doi: 10.1371/journal.pone.0147121
Dillingham City School District, AK [DCSD]. (2024). Dillingham City School District. Available online at: https://www.dlgsd.org/page/our-community (Accessed July 15, 2024)
Eicken, H., Danielsen, F., Sam, J. M., Fidel, M., Johnson, N., Poulsen, M. K., et al. (2021). Connecting top-down and bottom-up approaches in environmental observing. Bioscience 71, 467–483. doi: 10.1093/biosci/biab018
Eitzel, M., Cappadonna, J., Santos-Lang, C., Duerr, R., West, S. E., Virapongse, A., et al. (2017). Citizen science terminology matters: Exploring key terms. Citizen Science, 1–20. doi: 10.5334/cstp.96
Ermine, W., Sinclair, R., and Jeffery, B. (2004). The ethics of research involving Indigenous peoples. Saskatoon, SK: Indigenous Peoples' Health Research Centre.
Ford, J. D., McDowell, G., Shirley, J., Pitre, M., Siewierski, R., Gough, W., et al. (2013). The dynamic multiscale nature of climate change vulnerability: an Inuit harvesting example Ann. Am. Assoc. Geogr. 103, 1193–1211. doi: 10.1080/00045608.2013.776880
Frey, K. E., Moore, G. W. K., Cooper, L. W., and Grebmeier, J. M. (2015). Divergent patterns of recent sea ice cover across the Bering, Chukchi, and Beaufort seas of the Pacific Arctic Region. Prog. Oceanogr. 136, 32–49. doi: 10.1016/j.pocean.2015.05.009
García-Ruiz, J. M., Beguería, S., Lana-Renault, N., Nadal-Romero, E., and Cerdà, A. (2017). Ongoing and emerging questions in water erosion studies. Land Degrad. Dev. 28, 5–21. doi: 10.1002/ldr.2641
General Accounting Office [GAO]. (2003). Alaska Native Villages: Most are affected by flooding and erosion, but few qualify for federal assistance. Report No. GAO-04-142. Washington, DC, USA.
Gibbs, A. E., and Richmond, B. M., (2015). National assessment of shoreline change: Historical change along the north coast of Alaska, US-Canadian border to Icy Cape (No. 2015–1048). US Geological Survey.
Gibbs, A. E., Nolan, M., Richmond, B. M., Snyder, A. G., and Erikson, L. H. (2019). Assessing patterns of annual change to permafrost bluffs along the North Slope coast of Alaska using high-resolution imagery and elevation models. Geomorphology 336, 152–164. doi: 10.1016/j.geomorph.2019.03.029
Glenn, R. T. (2022). Documenting Coastal Change and Community-Based Observations in Alaska Communities [Master’s Thesis]. Fairbanks, AK: University of Alaska Fairbanks.
Government Accountability Office [GAO]. (2009). Alaska native villages: Limited progress has been made on relocating villages threatened by flooding and erosion. (Report No.GAO-09-551).
Government Accountability Office [GAO]. (2022). Alaska native issues: Federal agencies could enhance support for native village efforts to address environmental threats. (Report No. GAO-22-104241).
Hartman, C. W., and Johnson, P. R. (1984). Environmental atlas of Alaska. Fairbanks, AK: Institute of Water Resources/Engineering Experiment Station, University of Alaska Fairbanks.
Hermann, A. J., and Stabeno, P. J. (1996). An eddy-resolving model of circulation on the western Gulf of Alaska shelf: 1. Model development and sensitivity analyses. J. Geophys. Res. 101, 1129–1149. doi: 10.1029/95JC02681
Hohonu. (2023). 24/7 Water Level Monitoring. Available online at: https://dashboard.hohonu.io/map-page (Accessed March 15, 2023)
Irwin, A. (2002). Citizen science: A study of people, expertise and sustainable development. London: Routledge.
Johnson, N., Behe, C., Danielsen, F., Krümmel, E. M., Nickels, S., and Pulsifer, P. L. (2016). Community-based monitoring and indigenous knowledge in a changing arctic: a review for the sustaining arctic observing networks. Sustain Arctic Observing Network Task 9:74. doi: 10.1080/00045608.2013.776880
Kaufman, D. S., and Manley, W. F. (2004). Pleistocene maximum and Late Wisconsinan glacier extents across Alaska, USA. Dev. Quaternary Sci. 2, 9–27. doi: 10.1016/S1571-0866(04)80182-9
Koenigk, T., Key, J., and Vihma, T. (2020). Climate change in the Arctic. Phys. Chem. Arctic Atmosphere, 673–705. doi: 10.1007/978-3-030-33566-3_11
Kouril, D., Furgal, C., and Whillans, T. (2016). Trends and key elements in community-based monitoring: a systematic review of the literature with an emphasis on Arctic and Subarctic regions. Environ. Rev. 24, 151–163. doi: 10.1139/er-2015-0041
Larson, A., and Spellman, K. V. (2017). Elements of Effective Contributory Citizen Science Program Design and Evidence element was met. Fairbanks, AK: University of Alaska Fairbanks, International Arctic Research Center.
Lazrus, H., Maldonado, J., Blanchard, P., Souza, M. K., Thomas, B., and Wildcat, D. (2022). Culture change to address climate change: collaborations with Indigenous and Earth sciences for more just, equitable, and sustainable responses to our climate crisis. PLoS Clim 1:e0000005. doi: 10.1371/journal.pclm.0000005
Li, Z., Zhao, J., Su, J., Li, C., Cheng, B., Hui, F., et al. (2020). Spatial and temporal variations in the extent and thickness of Arctic landfast ice. Remote Sens. 12:64. doi: 10.3390/rs12010064
Library of Congress [LOC]. (2023). Russian Beginnings. Available online at: https://www.loc.gov/collections/meeting-of-frontiers/articles-and-essays/alaska/ (Accessed March 14, 2023)
Magnan, A. K., Oppenheimer, M., Garschagen, M., Buchanan, M. K., Duvat, V. K., Forbes, D. L., et al. (2022). Sea level rise risks and societal adaptation benefits in low-lying coastal areas. Sci. Rep. 12:10677. doi: 10.1038/s41598-022-14303-w
Maldonado, J. K., Shearer, C., Bronen, R., Peterson, K., and Lazrus, H. (2014). “The impact of climate change on tribal communities in the US: displacement, relocation, and human rights” in Climate Change and Indigenous Peoples in the United States: Impacts, Experiences and Actions (New York: Springer), 93–106.
Manson, G. K., and Solomon, S. M. (2007). Past and future forcing of beaufort sea coastal change. Atmosphere-Ocean 45, 107–122. doi: 10.3137/ao.450204
McNamara, K. E., Clissold, R., Westoby, R., Piggott-McKellar, A. E., Kumar, R., and Clarke, T.. (2020). An assessment of community-based adaptation initiatives in the Pacific Islands. Nature Climate Change 10, 628–639.
Melvin, A. M., Larsen, P., Boehlert, B., Neumann, J. E., Chinowsky, P., Espinet, X., et al. (2017). Climate change damages to Alaska public infrastructure and the economics of proactive adaptation. Proc. Natl. Acad. Sci. 114, E122–E131. doi: 10.1073/pnas.1611056113
Mercer, L., Whalen, D., Pokiak, D. L., Lim, M., and Mann, P. J. (2023). Ensuring continuity and impact in Arctic monitoring: a solution-orientated model for community-based environmental research. Environ. Res. Ecol. 2:045001. doi: 10.1088/2752-664X/ad0241
Napp, J. M., Incze, L. S., Ortner, P. B., Siefert, D. L. W., and Britt, L. (1996). The plankton of Shelikof Strait, Alaska: standing stock, production, mesoscale variability and their relevance to larval fish survival. Fish. Oceanogr. 5, 19–38. doi: 10.1111/j.1365-2419.1996.tb00080.x
National Oceanographic and Atmospheric Administration [NOAA]. (2023). Office for Coastal Management. Available online at: https://coast.noaa.gov/states/alaska.html#:~:text=Of%20the%20total%20population%20of,coastal%20portions%20of%20the%20state (Accessed October 28, 2023)
Obubu, J. P., Odong, R., Alamerew, T., Fetahi, T., and Mengistou, S. (2022). Application of DPSIR model to identify the drivers and impacts of land use and land cover changes and climate change on land, water, and livelihoods in the L. Kyoga basin: implications for sustainable management. Environm. Syst. Res. 11:11. doi: 10.1186/s40068-022-00254-8
Osterkamp, T. E. (2007). Characteristics of the recent warming of permafrost in Alaska. J. Geophys. Res. Earth 112. doi: 10.1029/2006JF000578
Overbeck, J. R., Buzard, R. M., Turner, M. M., Miller, K. Y., and Glenn, R. J. (2020). Shoreline Change at Alaska Coastal Communities. Fairbanks, AK: State of Alaska, Department of Natural Resources, Division of Geological & Geophysical Surveys.
Parven, A., Pal, I., Witayangkurn, A., Pramanik, M., Nagai, M., Miyazaki, H., et al. (2022). Impacts of disaster and land-use change on food security and adaptation: Evidence from the delta community in Bangladesh. Int. J. Disaster Risk Reduction 78:103119. doi: 10.1016/j.ijdrr.2022.103119
Plafker, G. (1965). Tectonic Deformation Associated with the 1964 Alaska Earthquake: The earthquake of 27 March 1964 resulted in observable crustal deformation of unprecedented areal extent. Science 148, 1675–1687. doi: 10.1126/science.148.3678.1675
Pollock, R. M., and Whitelaw, G. S. (2005). Community-based monitoring in support of local sustainability. Local Environ. 10, 211–228. doi: 10.1080/13549839.2005.9684248
Pörtner, H. O., Roberts, D. C., Adams, H., Adler, C., Aldunce, P., Ali, E., et al. (2022). Climate change 2022: Impacts, adaptation and vulnerability (3056). Geneva, Switzerland: IPCC.
Pulpan, H., and Kienle, F. (1979). “Western Gulf of Alaska seismic risk” in Offshore Technology Conference (Richardson, TX: OnePetro).
Riehle, J. R., Reger, R. D., and Carver, C. L. (1977). Geology and Geologic Hazards of the Western Coast of the Kenai Peninsula from Kenai to English Bay, Alaska. Fairbanks, AK: Division of Geological & Geophysical Surveys.
Robinson, J. A., Kocman, D., Speyer, O., and Gerasopoulos, E. (2021). Meeting volunteer expectations—a review of volunteer motivations in citizen science and best practices for their retention through implementation of functional features in CS tools. J. Environ. Plan. Manag. 64, 2089–2113. doi: 10.1080/09640568.2020.1853507
Rogers, J. F. (1977). “Implications of plate tectonics for offshore Gulf of Alaska petroleum exploration” in Offshore Technology Conference (Richardson, TX: OnePetro).
Santellanes, S. R., Melgar, D., Crowell, B. W., and Lin, J. T. (2022). Potential megathrust co-seismic slip during the 2020 Sand Point, Alaska strike-slip earthquake. Authorea Preprints.
Sepp, M., and Jaagus, J. (2011). Changes in the activity and tracks of Arctic cyclones. Clim. Chang. 105, 577–595. doi: 10.1007/s10584-010-9893-7
Sharma, G. D., Naidu, A. S., and Hood, D. W. (1972). Bristol Bay: model contemporary graded shelf. AAPG Bull. 56, 2000–2012.
Sharpe, A., and Conrad, C. (2006). Community based ecological monitoring in Nova Scotia: challenges and opportunities. Environ. Monit. Assess. 113, 395–409. doi: 10.1007/s10661-005-9091-7
Sigman, M. (2015). Community-based monitoring of Alaska’s coastal and ocean environment: best practices for linking Alaska citizens with science.
Stabeno, P. J., Bond, N. A., Hermann, A. J., Kachel, N. B., Mordy, C. W., and Overland, J. E. (2004). Meteorology and oceanography of the Northern Gulf of Alaska. Cont. Shelf Res. 24, 859–897. doi: 10.1016/j.csr.2004.02.007
Stanley, K. W. (1968). Effects of the Alaska earthquake of March 27, 1964, on shore processes and beach morphology (No. 543-J). Washington, DC: US Government Printing Office.
Stone, J., Barclay, J., Simmons, P., Cole, P. D., Loughlin, S. C., Ramón, P., et al. (2014). Risk reduction through community-based monitoring: the vigías of Tungurahua, Ecuador. J. Appl. Volcanol. 3, 1–14. doi: 10.1186/s13617-014-0011-9
Suaalii-Sauni, T., and Fulu-Aiolupotea, S. M. (2014). Decolonizing Pacific research, building Pacific research communities and developing Pacific research tools: The case of the talanoa and the faafaletui in Samoa. Asia Pac. Viewp. 55, 331–344. doi: 10.1111/apv.12061
Taylor, P., Maslowski, W., Perlwitz, J., and Wuebbles, D. (2017). Arctic changes and their effects on Alaska and the rest of the United States. Washington, DC, USA: Global Change Research Program.
Tebes, J. K. (2005). Community science, philosophy of science, and the practice of research. Am. J. Community Psychol. 35, 213–230. doi: 10.1007/s10464-005-3399-x
Troll, T., and French, L. H. (2022). Bristol Bay Remembers: The Great Flu of 1919. Bristol Bay, AK: Bristol Bay Heritage Land Trust.
U.S. Army Corps of Engineers (2009). Alaska Baseline Erosion Assessment: Study Findings and Technical Report. Anchorage, AK: Alaska District U.S. Army Corps of Engineers, 68.
United States Census Bureau. (2022). Dillingham Census Area, Alaska. Available online at: https://www.census.gov/quickfacts/fact/table/dillinghamcensusareaalaska/PST045222 (Accessed February 18, 2022)
United Tribes of Bristol Bay [UTBB]. (2023). About Bristol Bay. Available online at: https://www.utbb.org/about-bristol-bay (Accessed February 21, 2023)
Waters, M. R., and Stafford, T. W. Jr. (2013). The first Americans: A review of the evidence for the Late-Pleistocene peopling of the Americas. Paleoamerican Odyssey, 543–562.
Wilson, F. H., Hults, C. P., Mull, C. G., and Karl, S. M. (2015). Geologic map of Alaska. Reston, VA: US Department of the Interior, US Geological Survey.
Wilson, J. G., and Overland, J. E. (1986). “Meteorology of the northern Gulf of Alaska” in The Gulf of Alaska: Physical Environment and Biological Resources, DOC/NOAA. eds. D. W. Hood and S. T. Zimmerman, 31–54.
Wise, J. L., Leslie, L. D., and Labelle, J. C. (1987). An Oceanographic and Climatological Atlas of Bristol Bay. Anchorage, AK: University of Alaska Anchorage Arctic Environmental Information and Data Center.
Wynne, B. (2008). Elephants in the rooms where publics encounter “science”?: A response to Darrin Durant,“Accounting for expertise: Wynne and the autonomy of the lay public. Public Underst. Sci. 17, 21–33. doi: 10.1177/0963662507085162
Keywords: community-based monitoring, Southwest Alaska, geomorphology, coastal hazards, coastal erosion
Citation: Christian JE, Buzard RM, Spellman KL, Baldwin HL, Bogardus RC, Carlson J, Dunham G, Flensburg S, Glenn RJT, Overbeck JR and Maio CV (2025) Community-based monitoring: shoreline change in Southwest Alaska. Front. Clim. 6:1410329. doi: 10.3389/fclim.2024.1410329
Edited by:
John Paul Nelson, Georgia Institute of Technology, United StatesReviewed by:
Giandomenico Foti, Mediterranea University of Reggio Calabria, ItalyCopyright © 2025 Christian, Buzard, Spellman, Baldwin, Bogardus, Carlson, Dunham, Flensburg, Glenn, Overbeck and Maio. This is an open-access article distributed under the terms of the Creative Commons Attribution License (CC BY). The use, distribution or reproduction in other forums is permitted, provided the original author(s) and the copyright owner(s) are credited and that the original publication in this journal is cited, in accordance with accepted academic practice. No use, distribution or reproduction is permitted which does not comply with these terms.
*Correspondence: Jessica E. Christian, amVjaHJpc3RpYW5AYWxhc2thLmVkdQ==
Disclaimer: All claims expressed in this article are solely those of the authors and do not necessarily represent those of their affiliated organizations, or those of the publisher, the editors and the reviewers. Any product that may be evaluated in this article or claim that may be made by its manufacturer is not guaranteed or endorsed by the publisher.
Research integrity at Frontiers
Learn more about the work of our research integrity team to safeguard the quality of each article we publish.