 Megan E. Franke
 James W. Hurrell
 Kristen L. Rasmussen
 Lantao Sun
- Department of Atmospheric Science, Colorado State University, Fort Collins, CO, United States
Hazards from convective weather pose a serious threat to the contiguous United States (CONUS) every year. Previous studies have examined how future projected changes in climate might impact the frequency and intensity of convective weather using simulations with both convection-permitting regional models and coarser-grid climate and Earth system models. We build on this existing literature by utilizing a large-ensemble of historical and future Earth system model simulations to investigate the time evolution of the forced responses in large-scale convective environments and how those responses might be modulated by the rich spectrum of internal climate variability. Specifically, daily data from an ensemble of 50 simulations with the most recent version of the Community Earth System Model was used to examine changes in the convective environment over the eastern CONUS during March-June from 1870 to 2100. Results indicate that anthropogenically forced changes include increases in convective available potential energy and atmospheric stability (convective inhibition) throughout this century, while tropospheric vertical wind shear is projected to decrease across much of the CONUS. Internal climate variability on decadal and longer time scales can either significantly enhance or suppress these forced changes. The time evolution of two-dimensional histograms of convective indices suggests that future springtime convective environments over the eastern CONUS may, on average, be supportive of relatively less frequent and shorter-lived, but deeper and more intense convection.
1 Introduction
Few places around the globe experience as much intense convection and severe weather as the United States (U.S.). Although the increase in costs is partly a result of inflationary pressure and increasingly populated rural areas (Sander et al., 2013), records from the National Centers of Environmental Information (NCEI) indicate that, over the last decade, the occurrence of billion-dollar severe weather events has more than doubled (NOAA National Centers for Environmental Information (NCEI), 2023). In addition, the Intergovernmental Panel on Climate Change (IPCC) noted with high confidence that models consistently project changes in climate that support an increase in the frequency and intensity of severe weather (IPCC, 2021).
Governed by the Clausius Clapeyron equation, as temperatures increase due to enhanced greenhouse gas concentrations, the air-column moisture content also increases. This combination leads to an increase in convective available potential energy (Romps, 2016; Agard and Emanuel, 2017), which is a key ingredient for the development of strong storms and severe weather. In the current climate, hazards associated with convective weather already threaten lives, infrastructure, food, and water supplies across the U.S. and elsewhere. Thus, an improved understanding of the causes of both near-term and longer-timescale variability of convective weather is needed to enhance resilience, especially to future severe weather outbreaks.
Due to their relatively small scale and intermittent occurrence, observing and collecting homogeneous records of thunderstorms and severe weather events is difficult, especially when these events occur in relatively unpopulated or rural areas (Johns and Doswell, 1992; Brooks et al., 2003). Though recent efforts have been made by Maas et al. (2024) to produce a globally unified database of severe weather observations, the mesoscale research community has developed convective indices and covariate proxies that represent the thermodynamic and kinematic components of the local storm environment and are indicative of conditions favorable for convective weather events (Fawbush and Miller, 1952; Rasmussen and Blanchard, 1998; Brooks et al., 2003; Romatschke and Houze, 2010; Blamey et al., 2017; Piper et al., 2019; Taszarek et al., 2021). Until we have a complete database of extreme weather events, these proxies help to partially offset the lack of direct, long-term, and reliable observations. Also, even though climate models struggle to accurately simulate the diurnal cycle of convection (Watters et al., 2021; Dong et al., 2023), they better represent large-scale dynamics and the thermodynamic properties of the atmosphere. Thus, convective indices and covariate proxies computed from climate models yield useful information on general convective environments, their regional differences, and their changes over time. The convective indices can also aid in determining the historical occurrence and future changes in the frequency, intensity, and type (or mode) of convection.
Considerable prior research has investigated both the historical climatology as well as projections of the future evolution of these parameters. In general, these studies have shown that boreal spring Convective Available Potential Energy (CAPE), a measure of the potential energy available for upward vertical motion in a storm environment, is expected to increase substantially over the eastern contiguous U.S. (CONUS) by the end of the 21st century (Trapp et al., 2007, 2009; Diffenbaugh et al., 2013; Seeley and Romps, 2015; Hoogewind et al., 2017; Rasmussen et al., 2017; Chen et al., 2020; Lepore et al., 2021). Though less explored, the spatiotemporal evolution of boreal spring Convective Inhibition (CIN) is also broadly consistent across previous studies, with increasing lower-level stability (increasing CIN magnitudes) by 2100, particularly over the central CONUS (Hoogewind et al., 2017; Rasmussen et al., 2017; Chen et al., 2020; Lepore et al., 2021). Many of these studies have utilized large-scale climate models to study future changes in these convective indices, while others have taken a different approach by applying dynamical downscaling (Gensini and Mote, 2015; Trapp and Hoogewind, 2016; Hoogewind et al., 2017; Ashley et al., 2023). For example, Rasmussen et al. (2017) analyzed high-resolution convection-permitting simulations (Liu et al., 2017) using the regional Weather Research and Forecasting model (WRF; Skamarock et al., 2021) at 4 km resolution forced with the European Reanalysis-Interim (ERA-Interim; Dee et al., 2011) plus a climate change perturbation from climate model simulations to investigate how CAPE, CIN, and their subsequent convective populations may change in the future. In particular, they calculated end-of-century monthly anomalies of CAPE and CIN relative to the historical climatology (1976–2005) using a 19-model ensemble mean from phase 5 of the Coupled Model Intercomparison Project (CMIP5; Taylor et al., 2012) under a future emissions scenario that assumed little mitigation. Their results are broadly consistent with the aforementioned studies, with increases projected in spring and summer CAPE and increasing magnitudes of CIN over the eastern CONUS. Such findings suggest that in the future, weak to moderate storms may be less frequent because of increased stability, but the most intense storms may become more numerous (Rasmussen et al., 2017; Chen et al., 2020).
There has been less agreement on projected end-of-century changes in tropospheric wind shear, a key factor for storm organization. For instance, Trapp et al. (2007), Diffenbaugh et al. (2013), and Ting et al. (2019) utilized a variety of Earth system models, all with different emissions scenarios, and found a robust swath of decreasing wind shear over most of the CONUS during the boreal spring season, while Hoogewind et al. (2017) and Lepore et al. (2021) both found increasing wind shear over the western and central U.S. with decreasing shear over the eastern U.S. by 2100. Though Diffenbaugh et al. (2013) found general decreases in tropospheric wind shear, they pointed out that most of the decreases occurred on days characterized by weak instability, emphasizing that when the changes in shear occur is an essential factor to consider when looking at future projections of severe weather.
Although changes in individual convective indices are useful for analyzing specific characteristics of severe storms, integrated measures of changes in storm environments, such as the product of CAPE and the tropospheric wind shear between the surface and 6 km (S06), can provide a more complete description of the convective environment in time and space. By definition, CAPES06 considers both the thermodynamic energy and the kinematic motion in a storm environment. As a result, increases in this variable might signify an increase in the frequency of significant severe storms relative to less severe storms (Rasmussen and Blanchard, 1998; Brooks et al., 2003; Craven and Brooks, 2004; Brooks, 2009). The historical climatology of warm-season CAPES06 produces a large-scale, spatially coherent pattern over the eastern CONUS, reflecting the climatology of the CAPE index (Brooks et al., 2003; Li et al., 2020). Simulations of future projections suggest that CAPES06 will continue to mirror changes in CAPE. Seeley and Romps (2015), for instance, used a subset of CMIP5 climate models, chosen based on their ability to reproduce a radiosonde climatology of severe storm environments, to compare 21st-century changes in the frequency of environments favorable for severe weather using a CAPES06 threshold. In general, all of the models they examined produced end-of-century CAPES06 changes that were of the same order of magnitude and showed consistent spatial patterns with increases over the southern and central U.S. ranging from 50 to 180% of the historical climatology.
While the aforementioned studies have provided valuable insights and have set the foundation for the types of changes that are likely to be experienced in future convective environments, many of them did not quantitatively assess the uncertainty in future projections of storm environments that are associated with internal, or natural, climate variability. This, along with emissions scenario and model response uncertainties, are essential to consider in studies using Earth system models to study future changes in climate (Hawkins and Sutton, 2009). While the emissions scenario can be specified and model response uncertainty can be reduced through model improvement, uncertainty due to internal climate variability is unlikely to be reduced due to the random and unpredictable nature of the Earth's climate system (Deser et al., 2012a). However, crucial insights can be gained by utilizing a large-ensemble approach from a single model (Lehner and Deser, 2023), whereby many simulations of the future are run under the same radiative forcing scenario but with slightly perturbed initial states. It is noteworthy to mention that the memory of the initial state is trivial in long climate simulations; thus, diversity in trends amongst the individual ensemble members is solely due to different random samples of internal variability, which are superimposed upon a common forced response (Deser and Phillips, 2022). Therefore, the large-ensemble approach not only allows for a better estimation of the forced climate change signal from a particular model, but it allows for an examination of a large range of possible future outcomes, all of which can be considered equally plausible (Deser et al., 2012a). This is essential since internal variability can act to either significantly enhance or suppress forced climate responses, particularly on regional scales (Deser, 2020). How low-frequency, unforced climate variability modulates the convective environments, including the thermodynamic and kinematic components critical for severe weather, has not been examined extensively to date, even though it is likely an important influence regionally.
We do note that many studies have examined the relationship between severe weather and specific modes of internal climate variability that operate primarily on sub-seasonal to interannual timescales. This includes the El Niño Southern Oscillation (ENSO) phenomenon (e.g., Cook and Schaefer, 2008; Allen et al., 2015; Lepore et al., 2017; Allen, 2018), the Madden Julian Oscillation (MJO) (e.g., Thompson and Roundy, 2013; Baggett et al., 2018; Tippett, 2018; Miller et al., 2022), and other distinct modes of variability (e.g., Gensini and Marinaro, 2016; Molina et al., 2016; Trapp and Hoogewind, 2019; Brown and Nowotarski, 2020; Tippett et al., 2022). Allen et al. (2015), for instance, found that fewer tornado and hail events occur over the central U.S. during El Niño events than during La Niña events. Thompson and Roundy (2013) showed that violent tornado outbreaks in the months March-May are more than two times more frequent during the second phase of the Real-time Multivariate MJO (RMM) index than during any other phases or periods of MJO inactivity. Such studies are critical in helping to better understand patterns of severe weather outbreaks and improving seasonal prediction skills (Allen et al., 2015; Lepore et al., 2017; Baggett et al., 2018; Tippett et al., 2022).
This study builds on the existing body of literature by examining the influence of climate change and internal climate variability on convective storm environments over the CONUS. Specifically, we utilize a large-ensemble of simulations from the Community Earth System Model version 2.0 (Danabasoglu et al., 2020), hereafter referred to as the CESM2-LE (Rodgers et al., 2021), to examine the range of the temporal evolution of convective ingredients from 1870 to 2100, which is a much longer, continuous- time record than has been examined before. The advantage of a large-ensemble approach is that it allows us to more robustly document anthropogenic climate change signals simulated by the CESM2, as well as assess the extent to which the forced signal in convective environments is modulated by internal, unforced variations in climate. Unlike most previous studies, our focus is on decadal and longer timescale internal climate variability, rather than subseasonal-to-interannual variations. Such an approach is important for ensuring that climate adaptation policies are based on the most complete scientific information available (Deser, 2020; Mankin et al., 2020).
2 Data and methods
2.1 Model information and data
We utilize simulation data from the CESM (Hurrell et al., 2013; Danabasoglu et al., 2020). The open-source CESM is unique in that it is both developed and applied to scientific problems by a large community of researchers. It is a critical infrastructure for the U.S. climate research community and is principally funded by the National Science Foundation (NSF) and managed by the U.S. National Center for Atmospheric Research (NCAR). Simulations performed with the CESM have made many significant contributions to climate research, ranging from paleoclimate applications (e.g., Otto-Bliesner et al., 2016) to contributions to the North American Multi-Model Ensemble (NMME; Kirtman et al., 2014) seasonal forecasting effort led by the National Oceanic and Atmospheric Administration (NOAA). Simulations with CESM have also been used extensively in both national and international assessments of climate science, including substantial contributions to version 6 of the CMIP (CMIP6; Eyring et al., 2016). The salient point is that CESM provides the broader academic community with a core modeling system to investigate a diverse set of Earth system interactions across multiple time and space scales.
Daily data for specific humidity, column air temperature, near-surface (10-m) wind speed, zonal and meridional winds, and geopotential heights were obtained from a large ensemble (LE) produced with the coupled CESM2 (Danabasoglu et al., 2020) for all model levels. The CESM2-LE uses the Community Atmosphere Model version 6 (CAM6), which is a “low-top” model consisting of 32 vertical levels (a relatively coarse stratospheric representation) and a nominal 1° (1.25° in longitude and 0.9° in latitude) spatial resolution. To study the temporal evolution of the severe weather environment over the CONUS, 50 ensemble members were analyzed spanning 1870–2100. Each ensemble member used CMIP6 forcings over the historical record and a future (2015–2100) forcing of SSP3-7.0 (Rodgers et al., 2021), a medium-high emissions scenario resulting in ~7.0 W m−2 in radiative forcing by the end of the 21st century (O'Neill et al., 2016; IPCC, 2021). This level of forcing is a policy-relevant target, and it is a more moderate forcing scenario than those analyzed in most studies to date that have examined future changes in convective environments.
2.2 Convective parameters
Several parameters to quantify the thermodynamic and kinetic characteristics of the large-scale storm environment across the U.S. were computed from the CESM2-LE data. Closely associated with the potential occurrence of deep convection is CAPE (J kg−1; Doswell and Rasmussen, 1994; Riemann-Campe et al., 2009). This thermodynamic parameter is formally defined as the vertical integral of buoyancy from the level of free convection (LFC) to the equilibrium level, making it suitable for diagnosing conditional instability and potential updraft strength (Holton, 1972). We have chosen to use the most-unstable CAPE, which is computed by finding the maximum equivalent potential temperature in the lowest 3,000 m, then calculating the CAPE starting at this level of maximum instability. This definition of CAPE was selected to ensure that our analysis captures potentially elevated convection, as well as the maximum instability (Rochette et al., 1999).
The CIN (J kg−1) is equal to the negative buoyancy, or the negative work done by the atmospheric boundary layer as a parcel ascends from the surface through the stable layer and to the level of free convection (Colby, 1984; Rasmussen and Blanchard, 1998; Riemann-Campe et al., 2009). It is routinely analyzed to evaluate the stability of the local atmosphere and, thus, the potential suppression of convection. As CIN is the amount of energy an air parcel needs to overcome in order to reach the LFC, it is commonly referred to as a negative value (i.e., more negative values mean more convective inhibition). As was done for CAPE, the most-unstable CIN in the lowest 3,000 m is used throughout this study.
To explore the kinematic components of the convective environment, we used the difference in the bulk vertical wind shear from 10 m above ground level to 6 km (~525 hPa) altitude, known as S06 (m s−1). Past work suggests that while lower-level wind shear is important for tornadic environments, S06 influences storm type, organization, and longevity (Rasmussen and Blanchard, 1998; Weisman and Rotunno, 2000; Brooks et al., 2003; Markowski and Richardson, 2010). Updrafts in environments characterized by moderate to high S06 (≥10 m s−1) are more likely to be sustained in the presence of precipitation, downdrafts, and adjacent outflow boundaries. This permits the updraft to grow even deeper, enhancing the chance of severe weather occurrence (Markowski and Richardson, 2010; Taszarek et al., 2020). Additionally, higher S06 is critical for the development of dynamic vertical pressure gradients within the storm which can have a strong influence on both the storm type and longevity, as well as impact convective initiation along cold pools. Namely, moderate to strong shear is imperative to the internal dynamics of a thunderstorm since it promotes vertical storm-scale rotation and assists in sustaining the updraft (Weisman and Rotunno, 2000; Trapp et al., 2007), both of which are essential for tornadogenesis, large hail formation, and damaging winds at the surface (Taszarek et al., 2020).
Previous research has demonstrated the utility of using the product of CAPE and S06, CAPES06 (m3 s−3), to help discriminate between significant severe storms and less severe storms (Rasmussen and Blanchard, 1998; Craven et al., 2002; Brooks et al., 2003; Brooks, 2009; Seeley and Romps, 2015). As mentioned, CAPES06 takes into account two of the most necessary components for convection, the thermodynamic energy and the vertical kinematic structure. As long as there exists a lifting mechanism for initiation to occur, high values of this parameter are indicative of higher updraft velocities and increased potential for storm organization. Historically, soundings from days with the most severe storms exhibit high values in this index (e.g., Rasmussen and Blanchard, 1998; Brooks et al., 2003; Brooks, 2009).
This study will focus primarily on the eastern CONUS region outlined in Figure 1, which is a region frequently characterized by often intense convection. Ocean grid points are masked from the analysis so that the focus is on convective indices over land only. We are interested in the extended boreal spring season, which we define as March through June (MAMJ), as this period captures the months when storms are most frequent over the eastern CONUS (Kelly et al., 1985; Brooks et al., 2003; Gensini and Ashley, 2011; Li et al., 2020). Later into the summer season, the temperature and moisture gradients in this region are weaker, and the jet-stream begins to shift north, resulting in an overall northward shift in convective activity (Song et al., 2019).
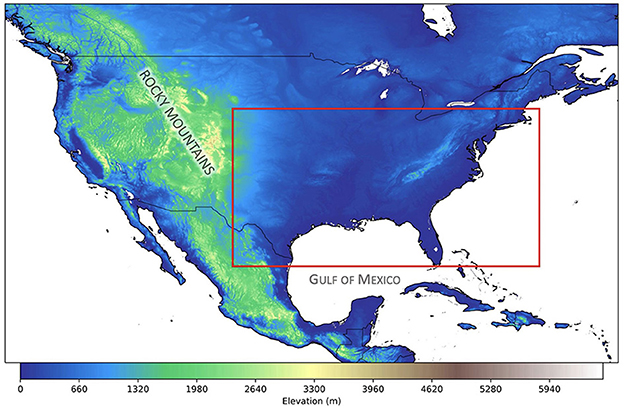
Figure 1. Red box highlights the eastern CONUS domain used for this study. Latitude bounds are between (25°N and 43°N) and longitude bounds are between (–104°W, –69°W). Topography data are from NOAA's ETOPO Global Relief Model (Amante and Eakins, 2009).
2.3 Verification
To verify that the CESM2-LE is a viable tool for the analysis of large-scale convective environments, monthly data gridded on pressure levels from the fifth-generation global climate reanalysis (ERA5; Hersbach et al., 2020) output from the European Center for Medium-Range Forecasts (ECMWF) was used for model validation. Previous studies have found ERA5 to be reliable in capturing the spatiotemporal climatology of convective environments (Taszarek et al., 2020; Pilguj et al., 2022). Li et al. (2020) conducted a climatological analysis of severe local storm environments over North America using ERA5 compared to CAM6 simulations of the historical period. They confirmed the validity of ERA5 against 69 radiosonde observational sites over the CONUS region with twice daily raw soundings, then further confirmed the fidelity of CAM6 against ERA5. While strong similarity was found between the two datasets, a warm bias was noted over the eastern CONUS in CAM6 (Li et al., 2020). These results are relevant to point out as CAM6 is the atmospheric component used in the CESM2-LE.
The MAMJ CAPES06 climatological mean (1980–2019) from ERA5 and a single ensemble member from CESM2-LE is shown in Figure 2 for 00 UTC, the time of maximum convective activity (Trapp et al., 2007; Diffenbaugh et al., 2013; Seeley and Romps, 2015). There is strong agreement between the CESM2-LE and ERA5 during the historical 1980–2019 period (spatial correlation coefficient over the eastern CONUS = 0.96), indicating that the model successfully captures the mean spatial characteristics of CAPES06 over the past 40 years. Good agreement is also found between ERA5 and CESM2-LE for the climatologies of the other convective indices (spatial correlation for CAPE = 0.97, CIN = 0.80, and S06 = 0.95). Further, many studies have shown that the CESM2 simulates internal climate variability well (e.g., Fasullo, 2020; Rodgers et al., 2021; Deser and Phillips, 2022). For instance, Capotondi et al. (2020) and Simpson et al. (2020) found that leading modes of variability such as the ENSO, the Pacific Decadal Oscillation (PDO), the North Atlantic Oscillation (NAO), and the Southern Annual Mode (SAM) are well represented in the CESM2 relative to observations. Such results, combined with the findings of earlier studies (e.g. Li et al., 2020), give us confidence in using the CESM2-LE to examine past and future forced changes in convective environments over the CONUS, in addition to variations driven by internal modes of climate variability.
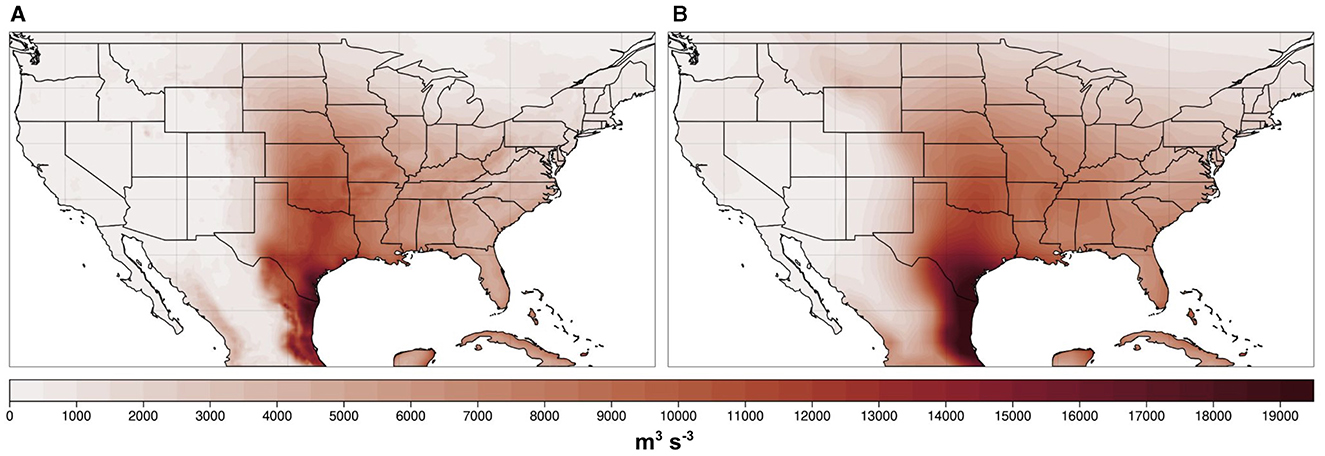
Figure 2. MAMJ 00 UTC CAPES06 (m3 s−3) climatology for (A) ERA5 reanalysis and (B) a single member from the CESM2-LE for the 1980-2019 period.
2.4 Temporal frequency of convective parameters
It is also relevant to note that previous studies have primarily used sub-daily data, specifically from 00 UTC (e.g., Figure 2), to compute convective parameters as this is the time of day when CAPE is maximized over the eastern CONUS (Trapp et al., 2007; Diffenbaugh et al., 2013; Seeley and Romps, 2015). However, sub-daily data only exists for 10 of the CESM2-LE ensemble members, which is inadequate to evaluate a more complete range of decadal variability simulated by the model. Deser et al. (2012a) suggests that at least 40 ensemble members are required for such purposes.
To assess the suitability of using daily mean data to analyze interannual and longer-term changes in seasonal-mean convective environments, instantaneous six-hourly data were extracted from one of the 10 ensemble members with sub-daily data. The time evolution of CAPE, CIN, S06, and CAPES06 anomalies (relative to 1971–2000 climatologies) from both 00 UTC and daily mean data were then compared (Figure 3). While differences exist in the absolute magnitude of the convective parameters, particularly for CIN which is minimized at 00 UTC, the seasonal-mean anomalies are highly correlated. This comparison was also done for anomalies calculated using 4 × daily data, also illustrated in Figure 3. Similarly high correlation coefficients were found between the seasonal anomalies computed from daily mean and 4 × daily data for each parameter. Thus, examining the temporal evolution of March–June anomalies from daily-mean data produces results that are almost identical to those using either 4 × daily data or 00 UTC data. Accordingly, using the daily mean data allows us to utilize all 50 ensemble members for our analyses. An ensemble of this size and temporal range, performed with a CMIP6 generation Earth system model provides an unprecedented opportunity to investigate the uncertainty of the long-term evolution of large-scale convective environments over the CONUS.
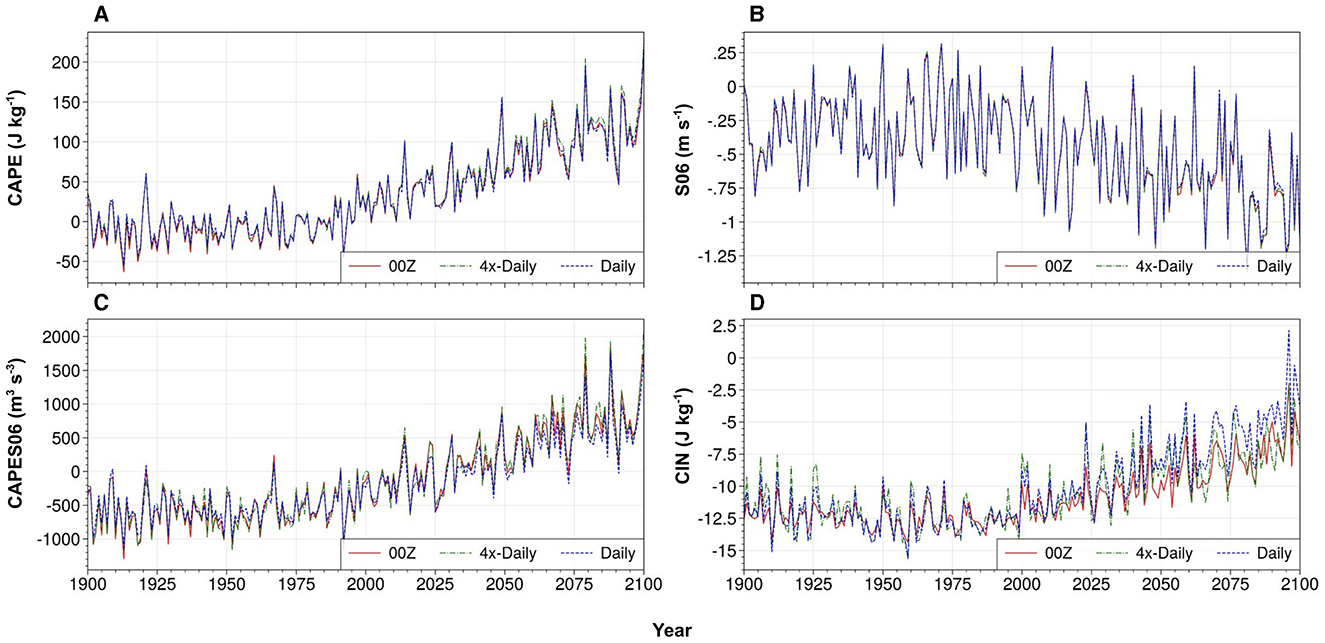
Figure 3. Time series of MAMJ anomalies relative to 1971-2000 baseline period computed from daily mean data (dotted blue lines), 00 UTC data (solid red lines), and six hourly data (4× daily; dashed green lines) from a single member of the CESM2-LE (SSP3-7.0) for: (A) CAPE (J kg−1); (B) S06 (m s−1); (C) CAPES06 (m3 s−3); and (D) CIN (J kg−1). The data are area averaged over the eastern CONUS region highlighted in Figure 1. Correlation coefficients between seasonal-mean anomalies based on 00Z vs. daily mean data are: (A) CAPE: r = 0.99; (B) S06: r = 0.99; (C) CAPES06: r = 0.98; (D) CIN: r = 0.96. Correlation coefficients between seasonal-mean anomalies based on 4 × -daily and daily mean data are: (A) CAPE: r = 0.99; (B) S06: r = 0.99; (C) CAPES06: r = 0.99; (D) CIN: r = 0.99.
3 Results
3.1 Forced changes and spread
The historical and future time evolution of the selected convective indices from 1870 to 2100 for the MAMJ season averaged over the eastern CONUS (Figure 1) and masked for oceanic regions are shown in Figure 4. The time series are expressed as seasonal anomalies relative to the 30-year base period 1971–2000. While considerable interannual and decadal variability is evident in individual ensemble members, the forced response for the convective indices shows minimal change from 1870 until about 1990. Just prior to 2000, however, forced changes in convective environments become apparent and exhibit clear departures from the historical climatological values throughout the current century. For instance, ensemble mean values of CAPE steadily increase throughout the 21st century, exceeding the historical climatological values by nearly 400 J kg−1 by 2100 (Figure 4A). As CAPE is directly influenced by the surface moist static energy, future increases in surface air temperature are likely the primary driver to increases in CAPE (Agard and Emanuel, 2017; Li and Chavas, 2021; Wang and Moyer, 2023). This hypothesis is further supported by Figure 1 in Rodgers et al. (2021) who leveraged the CESM2-LE to investigate the annual mean evolution of surface air temperature as well as top-of-atmosphere radiative imbalance from 1850 to 2100. They also found a clear departure from the historical climatology just before the year 2000, consistent with departures in CAPE in Figure 4A. Conversely, greenhouse-gas forcing causes S06 to become slightly more negative, with anomalies reaching ~−2 m s−1 by 2075, then remaining near that level through the remainder of the century (Figure 4B). The causal mechanism responsible for these slight decreases in wind shear is not a focus of this study, but we do note prior studies have suggested that a reduced merdional temperature gradient resulting from Arctic amplification could be the cause (Lee et al., 2019). The time evolution of CAPES06 (Figure 4C) exhibits behavior similar to that of CAPE, with an almost linear increase from the year 2000 of ~3,500 m3 s−3 above the historical climatology by 2100. The temporal history of CIN also shows little deviation until this century, when it exhibits a steady decrease to ~–18 J kg−1 by 2100 (Figure 4D). Recent work by Chen et al. (2020) found that future decreases in low-level relative humidity have direct implications for future increases in CIN, specifically by creating a more stable atmosphere through higher lifting condensation levels and reduced buoyancy. Additionally, Andrews et al. (2024) suggests that enhanced CIN in the future could be a result of elevated amplified warming. These results show that changes in convective environments due to anthropogenic forcing through the end of this century are prominent in CESM2-LE, as they are reflected in nearly all of the 50 members of the ensemble (light gray lines in Figure 4). Relatively few previous studies have been able to estimate the continuous-time evolution of changes in these convective indices, particularly to as far back as 1870 or by using a large ensemble (Lepore et al., 2021). This is significant because it allows us to estimate when the forced changes begin to emerge from the background noise of internal climate variability. We do note that Diffenbaugh et al. (2013) examined CAPE and S06 over the eastern CONUS from CMIP5 data covering 1970–2100, while Trapp et al. (2009) examined the time evolution of the same variables over 1950–2100 using data from a five-member ensemble from the Community Climate System Model version 3 (CCSM3). These studies, therefore, consisted of either multi-model ensembles or ensembles of a smaller size. The principal point is that convective environments over the eastern CONUS during the MAMJ season are likely to undergo substantial departures from the historical record over this century (Figure 4), moving toward higher convective energy, increased resistance to convection, and a slight decrease in the kinematic support for the production of hazards associated with convective weather.
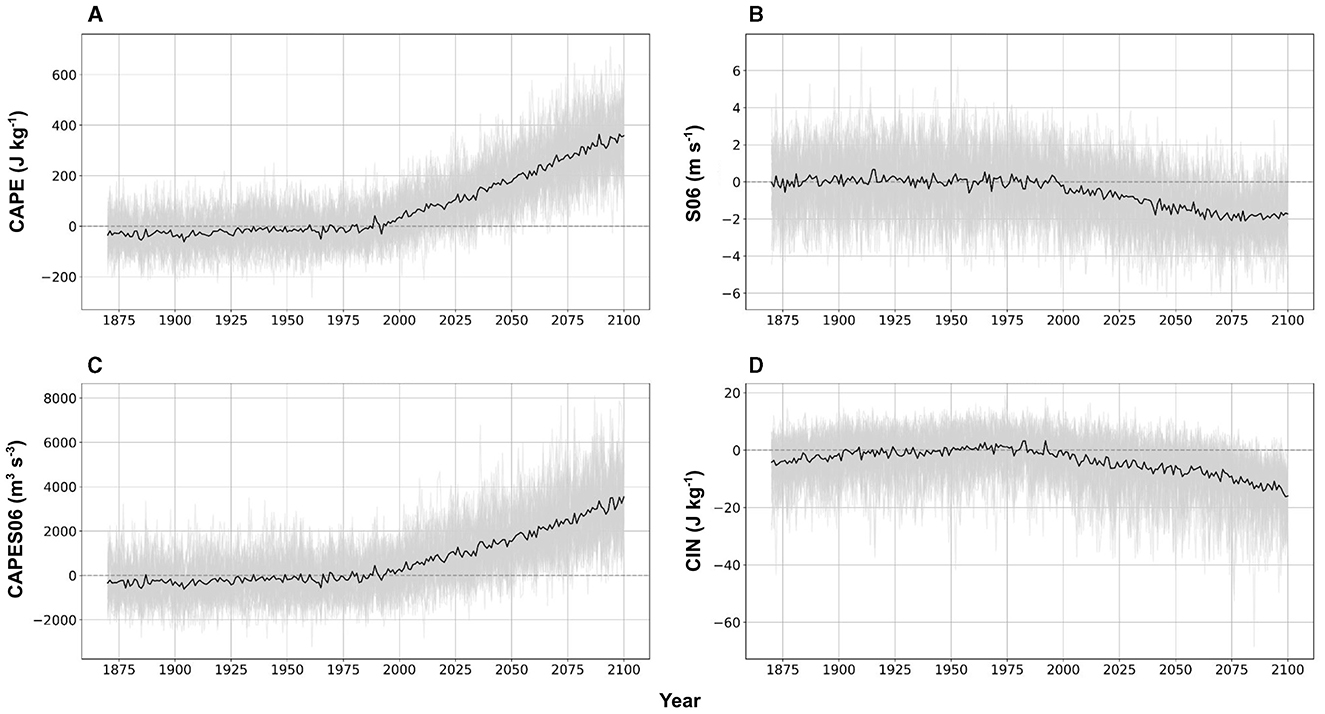
Figure 4. Time series of MAMJ anomalies over the eastern CONUS (Figure 1) relative to the 1971–2000 baseline climatology for: (A) CAPE (J kg−1; baseline climatology = 519 J kg−1); (B) S06 (m s−1; baseline climatology = 16 m s−1); (C) CAPES06 (m3 s−3; baseline climatology = 5,694 m3 s−3); and (D) CIN (J kg−1; baseline climatology = –26 J kg−1). The 50-member ensemble mean from CESM2-LE (black) is superimposed on individual members (light gray). The future forcing scenario from 2015 to 2100 is SSP3-7.0.
To evaluate the spatial character of these changes, epoch differences for future 30-year periods relative to the 1971–2000 baseline climatology are shown in Figure 5. Over the next few decades (2021–2050), increases in MAMJ CAPE are largest near the Gulf Coast and are positive across the entire CONUS (Figure 5A). Changes in CAPE are projected to further strengthen throughout the rest of this century, primarily over the eastern CONUS and southern Plains (e.g., Trapp et al., 2007; Diffenbaugh et al., 2013; Seeley and Romps, 2015; Hoogewind et al., 2017; Rasmussen et al., 2017; Chen et al., 2020; Lepore et al., 2021). As CAPE is related to the theoretical maximum potential updraft within a thunderstorm by wmax = (Holton, 1972), projections of higher CAPE imply that, on average, future storms will have stronger updrafts (Del Genio et al., 2007; Hoogewind et al., 2017), resulting in deeper, more explosive convection than storms during the reference period (1971–2000). Note that such changes are likely slightly overestimated, as are most calculations of CAPE, due to the assumptions associated with parcel theory such as excluding condensate loading and effects due to entrainment. Prior studies have also found that entrainment is likely to become stronger as a result of warming (Singh and O'Gorman, 2013), but these effects may be minor as a result of strong wind shear in the midlatitudes helping to produce wider updraft cores (Mulholland et al., 2021). Dougherty and Rasmussen (2021) also showed that updraft intensities increased in flash flood-producing storms in the CONUS simulations, further supporting the hypothesis that increasing CAPE results in an increased risk for extreme weather. The spatial patterns in these changes also highlight the influence of the Great Plains Low-Level Jet (GPLLJ) in advecting warm, moist air into the Plains and east of the Rocky Mountains (e.g., Carlson et al., 1983).
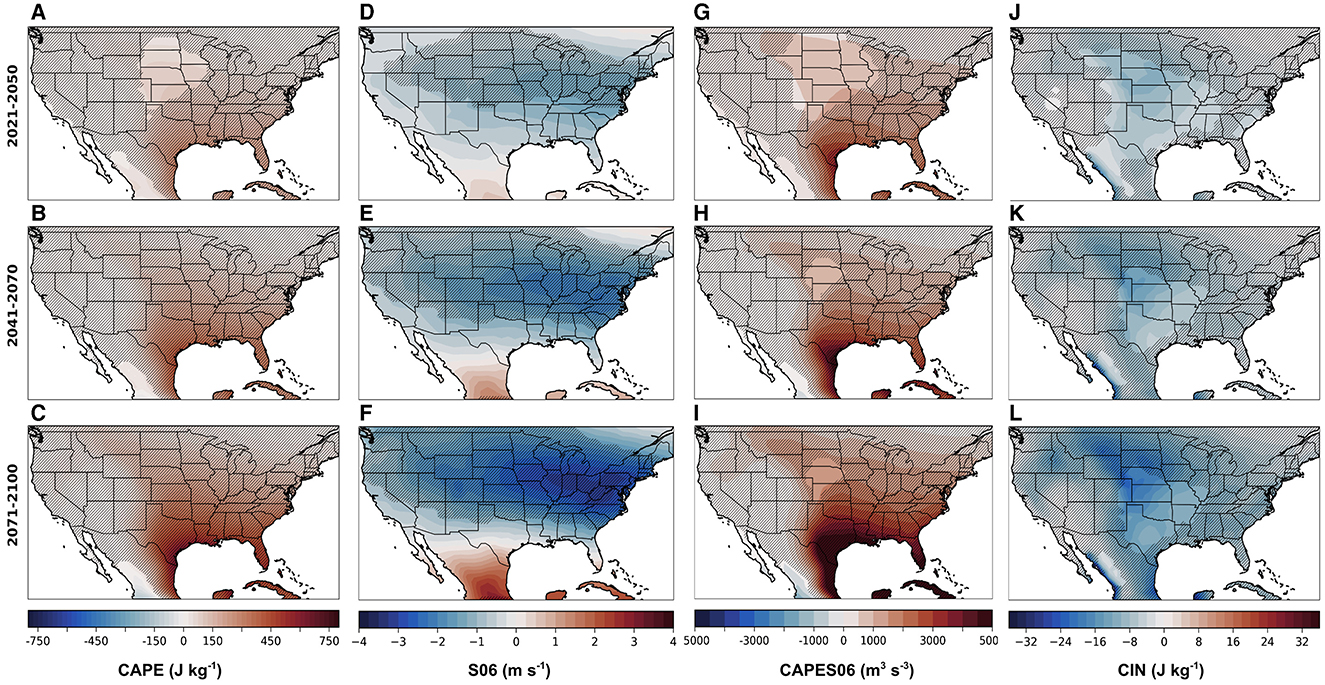
Figure 5. Epoch differences from the 1971–2000 baseline for early (2021–2050; top row), mid (2041–2070; middle row), and end-of-century (2071–2100; bottom row) during MAMJ for (A–C) CAPE (J kg−1), (D–F) S06 (m s−1), (G–I) CAPES06 (m3 s−3), and (J–L) CIN (J kg−1). Differences are for the CESM2-LE multi-member mean under the SSP3-7.0 scenario. Hatching indicates the 95% statistical significance based on the two-tailed Student's T-test.
Epoch differences in MAMJ wind shear reveal a large and spatially coherent east-west swath of decreasing S06 over the entirety of the CONUS (Figures 5D–F), increasing in magnitude with time (see also Trapp et al., 2007, 2009; Diffenbaugh et al., 2013; Hoogewind et al., 2017; Ting et al., 2019; Lepore et al., 2021). The greatest changes appear in the northeast, with smaller decreases over the southern CONUS. Storm environments characterized by strong vertical wind shear are more likely to be organized, last longer, and become self-sustaining (Lilly, 1979; Rotunno, 1981; Klemp, 1987; Weisman and Rotunno, 2000). Organized storms can come in a variety of types such as isolated, intense supercells or quasi-linear convective systems. Herein, we will consider the definition of “organized convection” to be inclusive of all types of storms, including MCSs, and not only highly organized supercells. Whether or not these decreases in S06 occur on days with high instability is essential to consider when thinking of these changes in the context of the development of daily convection (Diffenbaugh et al., 2013), but this is out of the scope of the current study. In general, decreases in shear with time indicate that increasingly fewer convective environments may have the support necessary to initiate and maintain the most hazardous storms.
The projected spatial characteristics of changes in CAPES06 (Figures 5G–I) are similar to those found in previous studies, such as Seeley and Romps (2015), who leveraged four climate models from CMIP5 forced with two different emissions scenarios to compare the end-of-century projections of CAPES06 over the U.S. Overall, the spatial patterns of MAMJ CAPES06 are dominated by changes in CAPE over time and are characterized by a coherent increase over the eastern CONUS, consistent with prior literature (Carlson et al., 1983; Rasmussen et al., 2017). Although projected decreases in S06 suggest that there could be less support for storm organization and dynamics, some studies speculate that the large-scale increases in CAPE will make up for the diminishing S06 (Trapp et al., 2007, 2009). While severe weather can occur less frequently in other types of convective environments (i.e., high shear and low CAPE; Sherburn and Parker, 2014), the main point is that CAPES06 is expected to undergo substantial increases by the end of this century, suggesting convective environments over the eastern U.S. may be supportive of a higher ratio of significant severe vs. less severe storms, given convective initiation.
This hypothesis, however, does not consider the increasing magnitude of CIN that represents the negative buoyancy that parcels need to overcome in order to realize their CAPE (Diffenbaugh et al., 2013; Rasmussen et al., 2017). Despite enhanced CAPE in a future climate, weak to moderate storms may be less frequent due to increased resistance to convective initiation, or enhanced stability (i.e. CIN) that requires more lifting or heating to overcome (e.g., Rasmussen et al., 2017; Chen et al., 2020). Changes in the forced component of CIN projected by the CESM2-LE are characterized by decreases over the central and northern Great Plains that increase in magnitude throughout this century, reaching ~–18 J kg−1 by 2100 (Figures 5J–L). Such changes are indicative of a more stable or “capped” atmosphere. If strong enough (CIN ≤ –200 J kg−1), this stability could potentially inhibit convection completely. On the other hand, there is the possibility that there is moderate CIN (–50 J kg−1 ≥ CIN ≥ –200 J kg−1), allowing for an accumulation of CAPE that, once released, could produce more explosive convection. The juxtaposition of the terrain-induced mid-level capping inversion with the warm, moist air allows for the modulation of CAPE by CIN until convective initiation occurs and intense convection is then able to develop. Globally, this is commonly observed in convective environments in the vicinity of large mountain ranges such as the Rockies and the Andes (Johns and Doswell, 1992; Zipser et al., 2006; Romatschke and Houze, 2010; Rasmussen and Houze, 2011, 2016). It is also evident in the spatial patterns that the areas of maximum change of CIN are not collocated with the areas of maximum change in CAPE (Figure 5). This difference could suggest that the storms in each of these two regions may likely vary in frequency, longevity, and intensity. Overall, these changes are in agreement with previous studies using Earth system models (e.g., Hoogewind et al., 2017; Chen et al., 2020; Lepore et al., 2021), as well as with studies that have used dynamical downscaling with high-resolution regional models (Gensini and Mote, 2015; Trapp and Hoogewind, 2016; Hoogewind et al., 2017; Rasmussen et al., 2017; Haberlie et al., 2022; Ashley et al., 2023), projecting coherent increases in the magnitude of CIN over the central and southern Great Plains by 2100.
Two-dimensional histograms are shown in Figure 6 to examine future phase spaces of pairs of convective indices. This figure provides additional insight into how convective indices covary in time as a result of forced and internal climate variability. The anomalies of MAMJ CAPE, CIN, and S06 relative to the 1971–2000 climatology are plotted for each year over a near-term period (2021–2050) in blue, as well as for an end-of-century period (2071–2100) in orange (Figure 6). These anomalies were area-averaged over the eastern CONUS (Figure 1) and plotted for each of the 50 individual ensemble members (i.e., 30 years × 50 ensemble members produces 1,500 values per epoch). In addition, one-dimensional histograms of the anomalies are plotted on the opposite axis spine for each index, illustrating the evolution of their discrete temporal distributions occurring as a result of internal variability. The shift of the future distribution in orange for both of these plots highlights the changes associated with the forced response, while the shape of these distributions illustrates the range associated with the internal variability.
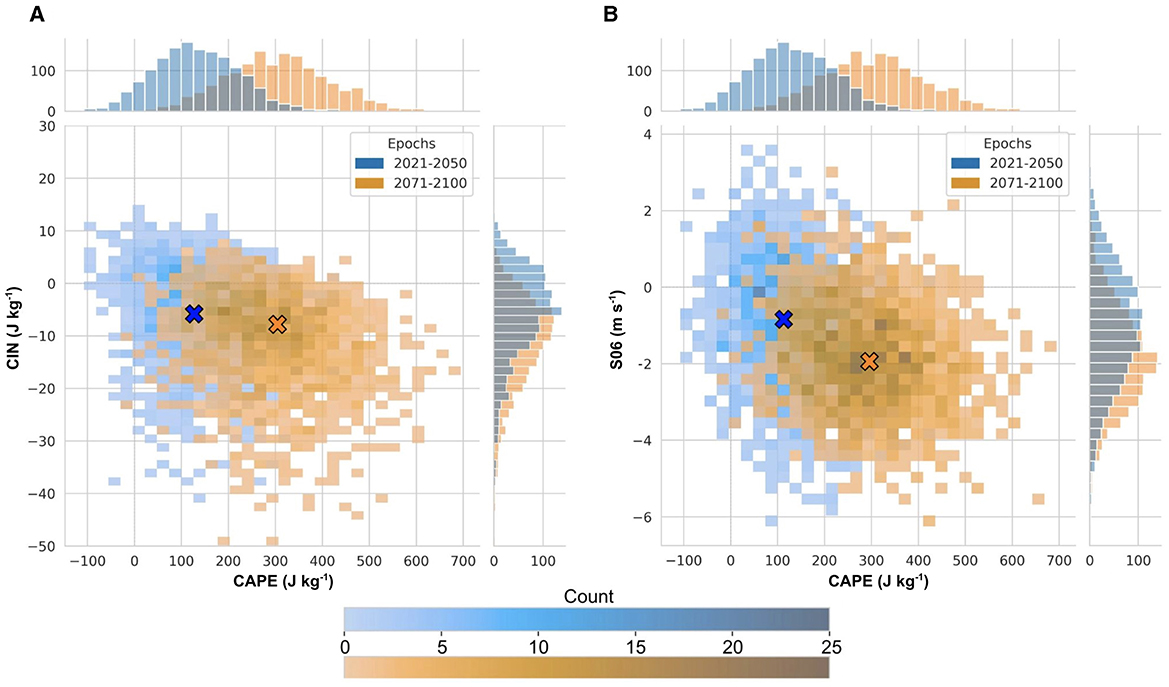
Figure 6. Two-dimensional histograms of anomalies relative to 1971-2000 over eastern CONUS (Figure 1) for MAMJ: (A) CAPE (J kg−1) vs. CIN (J kg−1) and (B) CAPE (J kg−1) vs. S06 (m s−1) for near-term changes in blue (2021–2050) and end-of-century changes in orange (2071–2100) under SSP3-7.0 for all 50 members from the CESM2-LE. Marginal distributions for each index and period are shown on the opposite axis. Blue and orange symbols denote the density centers of the joint distributions for each respective period.
Focusing on the evolution of the CAPE vs. CIN phase space (Figure 6A), near-term changes are most likely to be around 100 J kg−1 in CAPE and around –5 J kg−1 for CIN, where the greatest density of points occurs within the blue distribution (denoted with blue and orange symbols). By the end of the century, this distribution shifts to increases of around 300 J kg−1 for CAPE anomalies and around –10 J kg−1 for CIN. Comparing the shapes of the two distributions, it is clear that the range of end-of-century CAPE and CIN anomalies are slightly greater than those of the near-term anomalies, with CAPE potentially ranging from –25 to 700 J kg−1 and CIN ranging from around 10 J kg−1 to about –50 J kg−1 (Figure 6A). Overall, phase spaces characterized by these changes indicate that, relative to the baseline climatology (1971–2000), future environments may have a higher probability of having more buoyant energy and nearly an order of magnitude increase of inhibition acting to cap this energy.
The S06 phase space (Figure 6B) exhibits, on average, decreases of around –2 m s−1 by the end of the century, broadly consistent with the magnitude of wind shear changes over the eastern CONUS shown in previous studies (Trapp et al., 2007; Diffenbaugh et al., 2013; Hoogewind et al., 2017; Rasmussen et al., 2017; Lepore et al., 2021). It is also clear that the shapes of the CAPE vs. S06 distributions evolve from long and narrow over the coming decades to more circular by the end of the century. In other words, according to the CESM2-LE, the uncertainty due to internal variability for S06 is likely to decrease as the century progresses, whereas the uncertainty due to internal variability for CAPE is likely to increase.
Taszarek et al. (2020) investigated various environments that were associated with severe weather such as hail, tornadoes, and high winds over the Southeast, Great Plains, and the Midwest using ERA5 and the Storm Prediction Center (SPC) Storm Data from 1979 to 2018. They found that the conditional probability of experiencing hazards such as hail >2 cm required at least 10 m s−1 of S06, roughly –85 J kg−1 of CIN, and nearly 1,500 J kg−1 of CAPE, whereas winds >32 m s−1, and tornadoes rated F0+ and higher and were more likely in phase spaces characterized by at least 20 m s−1 of S06, –75 J kg−1 of CIN and 1,300 J kg−1 of CAPE. The results of this study only highlight the range of future changes and cannot be used to say anything about specific storm events due to the coarse resolution of the CESM2-LE. Nonetheless, the future changes are noteworthy: in the presence of convective initiation, the projected increases in end-of-century CAPE and CIN mean that the thresholds for severe weather occurrence found in Taszarek et al. (2020) may be approached more often. Further investigation into how these phase spaces manifest at higher model resolutions is a subject of future work.
3.2 Internal variability
Previous studies have primarily focused on changes in convective environments due to anthropogenic climate change (i.e., the forced response). However, the large ensemble approach provides a novel opportunity to investigate the effect of internal (or unforced) climate variability, where all 50 ensemble members represent an equally possible path to reality. To illustrate the range of possible outcomes, the simple metric of linear trends in each convective index over the next 30 years (2021–2050) is first considered. Histograms of the ensemble members are shown in Figure 7. Changes through 2050 are analyzed because uncertainty due to internal climate variability is most significant over the next several decades relative to the forced signal. Even in the presence of significant internal variability, 30-year trends of MAMJ CAPE over the eastern CONUS are positive for all 50 ensemble members (Figure 7A), but they exhibit considerable spread. Trends out to 2050 range from near zero to ~68 J kg−1 decade−1, while two-thirds of the ensemble members have CAPE trends between 20 and 40 J kg−1 decade−1. Similarly, trends in S06 are mostly of the same sign, with 46 of the 50 ensemble members exhibiting negative trends with a minimum of -0.85 m s−1 decade−1 projected by four members (Figure 7B). These results show that the sign of the response of CAPE and S06 to anthropogenic forcing is distinct across nearly all of the CESM2-LE members, but that the magnitude of the forced response is likely to be considerably moderated by low-frequency internal climate variability over the coming decades (Figures 7A, B). It follows that MAMJ trends in CAPES06 over the coming decades are positive for nearly all ensemble members (Figure 7C), with 80% of the members exhibiting trends between 100 and 500 m3 s−3 decade−1. In contrast, the signs of 30-year trends in MAMJ CIN over the eastern CONUS are more mixed (Figure 7D). Twenty-one of the ensemble members exhibit positive trends, while the other 29 exhibit negative trends down to –4.25 J kg−1 decade−1. While Figure 4D illustrates a forced decrease over eastern CONUS in CIN magnitudes by the end of the century (i.e., more negative values), the sign of the change is less certain due to internal climate variability (Figure 7D).
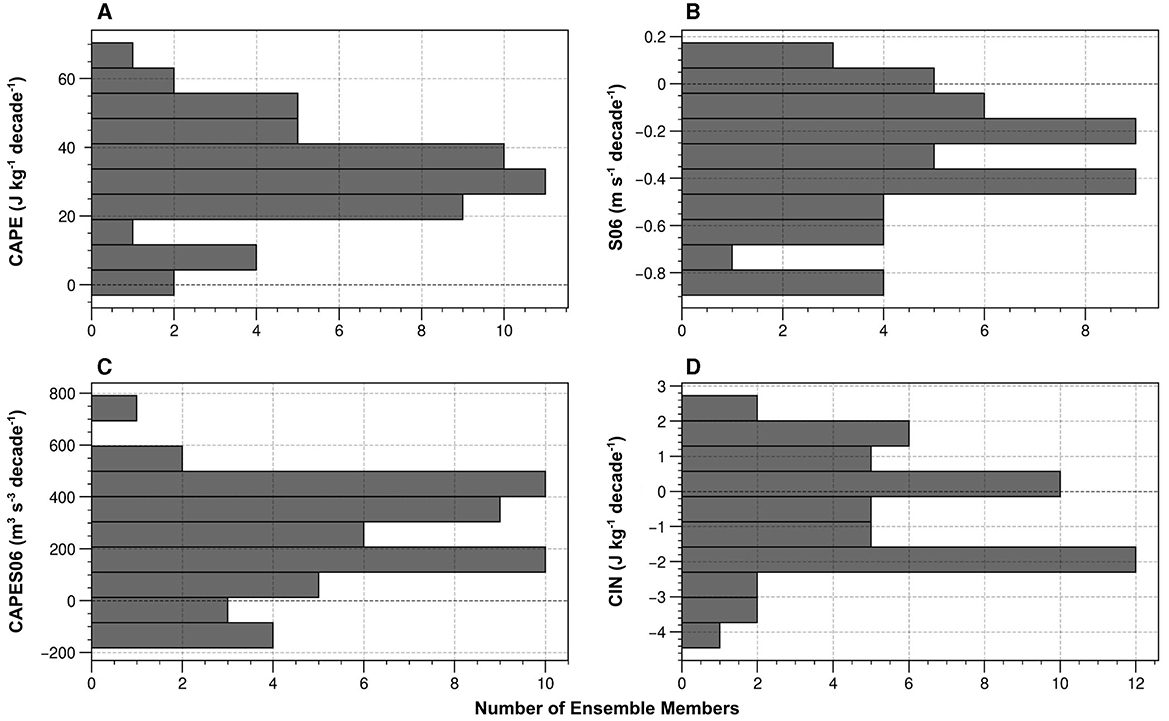
Figure 7. Histograms of the linear trends (MAMJ 2021-2050) of: (A) CAPE (J kg−1 decade−1); (B) S06 (m s−1 decade−1); (C) CAPES06 (m3 s−3 decade−1); (D) CIN (J kg−1 decade−1) over the eastern CONUS (Figure 1) from the 50 members of the CESM2-LE under SSP3-7.0. Linear trends were calculated using ordinary least squares linear regression.
To further illustrate the dominant role that internal climate variability is likely to play over the next several decades, we examined spatial patterns of change by subjectively selecting the ensemble members with the largest and smallest trends in area-averaged convective indices over the eastern CONUS during the MAMJ season, as seen in Figure 7. CAPES06 is shown since it considers both the thermodynamic energy and kinematic support (Figure 8). Ensemble member 25 exhibits the most negative (minimum) CAPES06 trend (–182 m3 s−3 decade−1) while ensemble member 23 has the largest trend (791 m3 s−3 decade−1). These two ensemble members were subjectively selected to most dramatically illustrate the role of internal climate variability in modulating the forced response in CAPES06. The spatial patterns of the linear trends in CAPES06 for these two simulations are shown in Figures 8A, D, respectively. By removing the forced trend (ensemble mean) from each of these individual ensemble members (Figures 8B, E), the changes in CAPES06 over the next several decades due purely to internal variability are revealed (Figures 8C, F). In general, the signals of internal climate variability are spatially coherent and are of a larger magnitude over the next several decades than the forced trends. In ensemble member 25, internal climate variability counteracts the forced, positive change in CAPES06 over much of the southeastern U.S. (Figure 8C), resulting in an overall negative trend over much of the region (Figure 8A). Conversely, in ensemble member 23, internal climate variability (Figure 8F) augments the forced signal and produces a very strong increase through 2050, especially over parts of Texas and the southern Great Plains (Figure 8D).
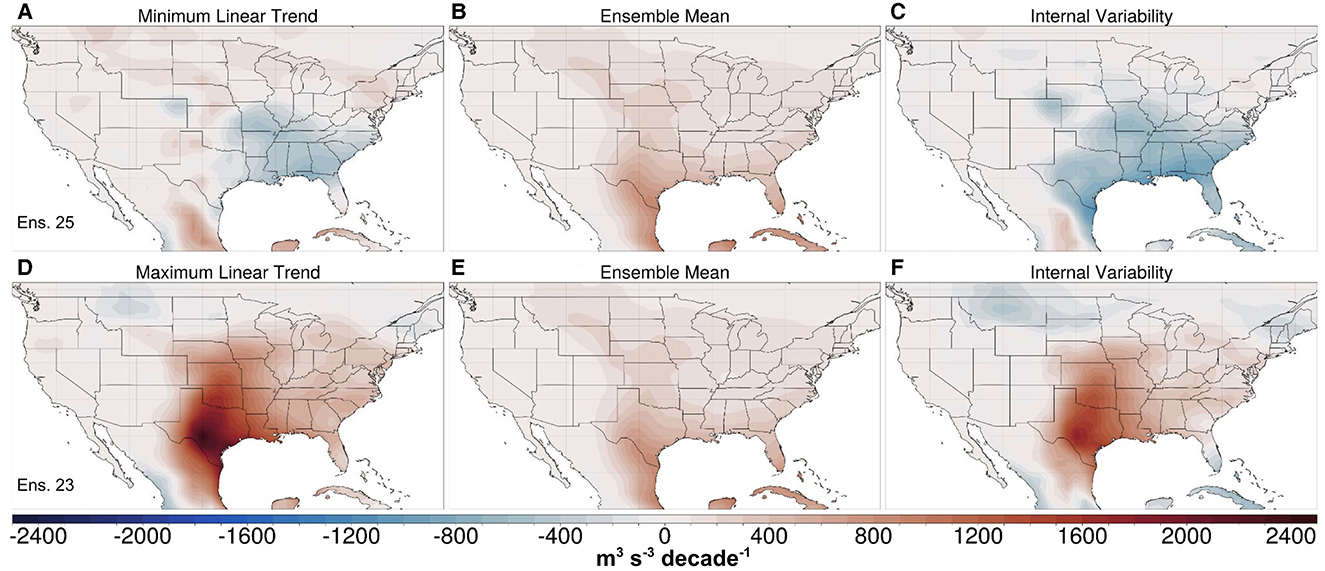
Figure 8. Linear decadal trends of MAMJ CAPES06 (m3 s−3 decade−1) over 2021–2050 for the CESM2-LE member 25 (top row) and member 23 (bottom row). The left panels (A, D) show the total trend values, while the middle panels (B, E) show the trends of the 50-member ensemble mean (SSP3-7.0). The internal variability component (left minus middle panels) are shown in the right panels (C, F). Note that panels (B) and (E) are identical.
4 Discussion and conclusions
A goal of this study was to better understand how convective weather is likely to change in a warmer, future climate over the eastern CONUS. While the spatiotemporal scales on which these storms occur are smaller than can be explicitly resolved by relatively coarse resolution models such as the CESM2, such models can be leveraged to instead examine the evolution of the large-scale convective environments in which the storms develop. Further, by using a large ensemble of CESM2 simulations, it is possible to not only identify and examine anthropogenically-forced changes in convective environments over time but also how the forced changes are likely to be altered by the rich spectrum of internal climate variability. To our knowledge, a focus on this latter aspect of decadal and longer timescale variability has yet to be robustly documented. An increased understanding of the range of plausible, future convective environments can enhance our capability to better project the nature of convective weather events, including severe weather, in the future and perhaps aid in increasing resilience to their associated hazards, particularly in regions of increasing population such as the eastern CONUS.
Our study is novel in that we have examined the continuous-time evolution of various convective indices from 1870 to 2100 over the eastern CONUS. We have shown that, at least according to the CESM2-LE, the anthropogenic influence on convective environments became very apparent near the year 2000. Consistent with previous studies using km-scale convection allowing models (e.g., Rasmussen et al., 2017), the anthropogenic influence will become even stronger in the coming decades and may drive the future thermodynamic components of convective environments toward supporting less frequent, but more explosive and deep convection, so long as a forcing mechanism is present. Additionally, there may be slightly less kinematic support for storms, implying less support for the longevity of supercells and larger multi-cellular organized convective storm modes capable of delivering extreme severe weather risks. Whether or not the decreases in S06 are large enough to cause any significant differences between present-day storms and end-of-century storms is difficult to answer with our results alone and is left as a focus for future studies.
By taking advantage of a large-ensemble approach, this study was further able to investigate the effect of internal climate variability on large-scale convective environments, rather than just the forced response. While we have shown that future changes in convective environments due to the forced response are spatially coherent and large, we have also demonstrated how these changes can be substantially modulated by internal variability. Changes to the latter also have spatial coherency and large magnitude and, thus, can either significantly enhance or suppress the forced changes.
Examining the convective proxies and the bivariate distributions of the selected indices, our results indicate that it is likely that future environments will be characterized by higher CAPE, moderate-high magnitudes of CIN, and lower S06, which is in general agreement with previous literature. The actual time evolution of these quantities will, of course, not only be influenced by forced climate change but also by internal variability. While it is not possible to make a deterministic prediction of how actual convective environments over the CONUS will evolve throughout the rest of this century, our study has helped to quantify the range of uncertainty and plausible scenarios.
Our results depend on the assumption that the CESM2-LE is capable of accurately simulating the future, particularly with a future forcing scenario of SSP3-7.0, even though it performs well in simulating past convective environments (e.g., Figure 2). Additionally, our study depends on the ability of the CESM2-LE to simulate internal climate variability well, which previous studies have shown to generally be the case (Capotondi et al., 2020; Fasullo, 2020; Simpson et al., 2020; Rodgers et al., 2021). We are thus confident that CESM2 produces a realistic range of internal variability in large-scale convective environments. Furthermore, we have interpreted our results with the assumption that a forcing mechanism for convective initiation will be present, therefore providing an opportunity for large-scale convective environments to be realized. This assumption has merit given the findings of Rasmussen et al. (2017), who examined intense future storms in a high-resolution framework.
This study is the first to exploit the CESM2-LE to examine changes in convective parameters. Plans for future work include more comprehensive regional analyses, especially since some regions are less influenced by internal variability than others (Deser et al., 2012b). Also, numerous studies have investigated the role of individual modes of climate variability in affecting convective environments (Cook and Schaefer, 2008; Thompson and Roundy, 2013; Molina et al., 2016), primarily focusing on sub-seasonal (e.g., MJO) to interannual variations (e.g., ENSO). Following a similar approach, we plan on further analyses to examine which decadal and multi-decadal modes of variability are most important in driving the internal climate variations documented here, in addition to any predictive skill they might have.
Finally, similar analyses for other seasons, as well as other regions of the world where convective activity is pronounced, such as over Argentina on the lee-side of the Andes (e.g., Zipser et al., 2006; Rasmussen and Houze, 2011; Rasmussen et al., 2014; Mulholland et al., 2018; Lepore et al., 2021; Nesbitt et al., 2021) is needed. A better understanding of the possible future evolution and variability in large-scale convective environments across the globe is critical for understanding future changes in the convective population over the eastern U.S., their associated hazards and, in particular, how we choose to adapt to these hazards.
Data availability statement
The datasets presented in this study can be found in online repositories. The names of the repository/repositories and accession number(s) can be found below: The Community Earth System Model Version 2-Large Ensemble (CESM2-LE): https://doi.org/10.26024/kgmp-c556; Fifth-Generation Global Climate Reanalysis (ERA5): https://doi.org/10.5065/BH6N-5N20.
Author contributions
MF: Formal analysis, Visualization, Writing – original draft, Writing – review & editing, Investigation, Software, Validation. JH: Conceptualization, Funding acquisition, Methodology, Project administration, Resources, Supervision, Writing – review & editing, Validation. KR: Writing – review & editing, Conceptualization, Methodology, Validation. LS: Resources, Writing – review & editing, Data curation, Validation.
Funding
The author(s) declare financial support was received for the research, authorship, and/or publication of this article. This work was partially supported by the co-author's, KR, NSF-AGS; grant no. 2312317 as well as by the Walter Scott Jr. College of Engineering at Colorado State University.
Acknowledgments
The CESM project is supported primarily by the National Science Foundation. We would like to acknowledge the CESM2 Large Ensemble Community Project and super-computing resources provided by the IBS Center for Climate Physics in South Korea. The authors would also like to thank Dan Chavas from Purdue University for preliminary discussions regarding this project. We also thank the five reviewers for their insightful recommendation. The original manuscript was improved considerably as a result of their thorough and constructive reviews.
Conflict of interest
The authors declare that the research was conducted in the absence of any commercial or financial relationships that could be construed as a potential conflict of interest.
Publisher's note
All claims expressed in this article are solely those of the authors and do not necessarily represent those of their affiliated organizations, or those of the publisher, the editors and the reviewers. Any product that may be evaluated in this article, or claim that may be made by its manufacturer, is not guaranteed or endorsed by the publisher.
References
Agard, V., and Emanuel, K. (2017). Clausius Clapeyron scaling of peak CAPE in continental convective storm environments. J. Atmos. Sci. 74, 3043–3054. doi: 10.1175/JAS-D-16-0352.1
Allen, J. T. (2018). “Climate change and severe thunderstorms,” in Oxford Research Encyclopedia of Climate Science. Oxford: Oxford University Press. doi: 10.1093/acrefore/9780190228620.013.62
Allen, J. T., Tippett, M. K., and Sobel, A. H. (2015). Influence of the El Niño/Southern Oscillation on tornado and hail frequency in the United States. Nat. Geosci. 8, 278–283. doi: 10.1038/ngeo2385
Amante, C., and Eakins, B. W. (2009). ETOPO1 1 Arc-Minute Global Relief Model: Procedures, Data Sources and Analysis. NOAA Technical Memorandum NESDIS NGDC-24. Boulder, CO: National Geophysical Data Center, NOAA.
Andrews, M. S., Gensini, V. A., Haberlie, A. M., Ashley, W. S., Michaelis, A. C., Taszarek, M., et al. (2024). Climatology of the elevated mixed layer over the contiguous United States and Northern Mexico Using ERA5: 1979–2021. J. Clim. 37:1833. doi: 10.1175/JCLI-D-23-0517.1
Ashley, W. S., Haberlie, A. M., and Gensini, V. A. (2023). The future of supercells in the United States. Bull. Am. Meteorol. Soc. 104, E1–E21. doi: 10.1175/BAMS-D-22-0027.1
Baggett, C. F., Nardi, K. M., Childs, S. J., Zito, S. N., Barnes, E. A., Maloney, E. D., et al. (2018). Skillful subseasonal forecasts of weekly Tornado and hail activity using the Madden-Julian Oscillation. J. Geophys. Res. Atmos. 123, 12661–12675. doi: 10.1029/2018JD029059
Blamey, R. C., Middleton, C., Lennard, C., and Reason, C. J. C. (2017). A climatology of potential severe convective environments across South Africa. Clim. Dyn. 49, 2161–2178. doi: 10.1007/s00382-016-3434-7
Brooks, H. (2009). Proximity soundings for severe convection for Europe and the United States from reanalysis data. Atmos. Res. 93, 546–553. doi: 10.1016/j.atmosres.2008.10.005
Brooks, H. E., Lee, J. W., and Craven, J. P. (2003). The spatial distribution of severe thunderstorm and tornado environments from global reanalysis data. Atmos. Res. 67–68, 73–94. doi: 10.1016/S0169-8095(03)00045-0
Brown, M. C., and Nowotarski, C. J. (2020). Southeastern U.S. tornado outbreak likelihood using daily climate indices. J Clim. 33, 3229–3252. doi: 10.1175/JCLI-D-19-0684.1
Capotondi, A., Deser, C., Phillips, A. S., Okumura, Y., and Larson, S. M. (2020). ENSO and pacific decadal variability in the community earth system model version 2. J. Adv. Model. Earth Syst. 12:e2019MS002022. doi: 10.1029/2019MS002022
Carlson, T. N., Benjamin, S. G., Forbes, G. S., and Li, Y.-F. (1983). Elevated mixed layers in the regional severe storm environment: conceptual model and case studies. Mon. Weather Rev. 111, 1453–1474. doi: 10.1175/1520-0493(1983)111<1453:EMLITR>2.0.CO;2
Chen, J., Dai, A., Zhang, Y., and Rasmussen, K. L. (2020). Changes in convective available potential energy and convective inhibition under global warming. J. Clim. 33, 2025–2050. doi: 10.1175/JCLI-D-19-0461.1
Colby, F. P. (1984). Convective inhibition as a predictor of convection during AVE-SESAME II. Mon. Weather Rev. 112, 2239–2252. doi: 10.1175/1520-0493(1984)112<2239:CIAAPO>2.0.CO;2
Cook, A. R., and Schaefer, J. T. (2008). The relation of El Niño Southern Oscillation (ENSO) to winter Tornado outbreaks. Mon. Weather Rev. 136, 3121–3137. doi: 10.1175/2007MWR2171.1
Craven, J. P., Jewell, R. E., and Brooks, H. E. (2002). Comparison between observed convective cloud-base heights and lifting condensation level for two different lifted parcels. Weather Forecast. 17, 885–890. doi: 10.1175/1520-0434(2002)017<0885:CBOCCB>2.0.CO;2
Craven, J. P., and Brooks, H. E. (2004). Baseline climatology of sounding derived parameters associated with deep moist convection. Natl. Weather Dig. 28:12.
Danabasoglu, G., Lamarque, J.-F., Bacmeister, J., Bailey, D. A., DuVivier, A. K., Edwards, J., et al. (2020). The Community Earth System Model Version 2 (CESM2). J. Adv. Model. Earth Syst. 12:e2019MS001916. doi: 10.1029/2019MS001916
Dee, D. P., Uppala, S. M., Simmons, A. J., Berrisford, P., Poli, P., Kobayashi, S., et al. (2011). The ERA-Interim reanalysis: configuration and performance of the data assimilation system. Q. J. R. Meteorol. Soc. 137, 553–597. doi: 10.1002/qj.828
Del Genio, A. D., Yao, M.-S., and Jonas, J. (2007). Will moist convection be stronger in a warmer climate? Geophys. Res. Lett. 34:L16703. doi: 10.1029/2007GL030525
Deser, C. (2020). Certain uncertainty: the role of internal climate variability in projections of regional climate change and risk management. Earths Future 8:e2020EF001854. doi: 10.1029/2020EF001854
Deser, C., Knutti, R., Solomon, S., and Phillips, A. S. (2012a). Communication of the role of natural variability in future North American climate. Nat. Clim. Chang. 2, 775–779. doi: 10.1038/nclimate1562
Deser, C., Phillips, A., Bourdette, V., and Teng, H. (2012b). Uncertainty in climate change projections: the role of internal variability. Clim. Dyn. 38, 527–546. doi: 10.1007/s00382-010-0977-x
Deser, C., and Phillips, A. S. (2022). “The role of internal variability in regional climate change,” in Predictability, probabilistic forecasts, data assimilation, inverse problems/Climate, atmosphere, ocean, hydrology, cryosphere, biosphere/Simulation. doi: 10.5194/npg-2022-15
Diffenbaugh, N. S., Scherer, M., and Trapp, R. J. (2013). Robust increases in severe thunderstorm environments in response to greenhouse forcing. Proc. Nat. Acad. Sci. 110, 16361–16366. doi: 10.1073/pnas.1307758110
Dong, W., Zhao, M., Ming, Y., Krasting, J., and Ramaswamy, V. (2023). Simulation of united states mesoscale convective systems using GFDL's new high-resolution general circulation model. J. Clim. 36, 1–40. doi: 10.1175/JCLI-D-22-0529.1
Doswell, C. A., and Rasmussen, E. N. (1994). The effect of neglecting the virtual temperature correction on CAPE calculations. Weather Forecast. 9, 625–629. doi: 10.1175/1520-0434(1994)009<0625:TEONTV>2.0.CO;2
Dougherty, E., and Rasmussen, K. L. (2021). Variations in flash flood producing storm characteristics associated with changes in vertical velocity in a future climate in the Mississippi River Basin. J. Hydrometeorol. 22, 671–687. doi: 10.1175/JHM-D-20-0254.1
Eyring, V., Bony, S., Meehl, G. A., Senior, C. A., Stevens, B., Stouffer, R. J., et al. (2016). Overview of the Coupled Model Intercomparison Project Phase 6 (CMIP6) experimental design and organization. Geosci. Model Dev. 9, 1937–1958. doi: 10.5194/gmd-9-1937-2016
Fasullo, J. T. (2020). Evaluating simulated climate patterns from the CMIP archives using satellite and reanalysis datasets using the Climate Model Assessment Tool (CMATv1). Geosci. Model Dev. 13, 3627–3642. doi: 10.5194/gmd-13-3627-2020
Fawbush, W. J., and Miller, R. C. (1952). A mean sounding representative of the tornadic airmass environment. Bull. Am. Meteorol. Soc. 33, 303–307. doi: 10.1175/1520-0477-33.7.303
Gensini, V. A., and Ashley, W. S. (2011). Climatology of potentially severe convective environments from North American regional reanalysis. Electron. J. Sev. Storms Meteorol. 6, 1–40. doi: 10.55599/ejssm.v6i8.35
Gensini, V. A., and Marinaro, A. (2016). Tornado frequency in the United States related to global relative angular momentum. Mon. Weather Rev. 144, 801–810. doi: 10.1175/MWR-D-15-0289.1
Gensini, V. A., and Mote, T. L. (2015). Downscaled estimates of late 21st century severe weather from CCSM3. Clim. Change 129, 307–321. doi: 10.1007/s10584-014-1320-z
Haberlie, A. M., Ashley, W. S., Battisto, C. M., and Gensini, V. A. (2022). Thunderstorm activity under intermediate and extreme climate change scenarios. Geophys. Res. Lett. 49:e2022GL098779. doi: 10.1029/2022GL098779
Hawkins, E., and Sutton, R. (2009). The potential to narrow uncertainty in regional climate predictions. Bull. Am. Meteorol. Soc. 90, 1095–1108. doi: 10.1175/2009BAMS2607.1
Hersbach, H., Bell, B., Berrisford, P., Hirahara, S., Horányi, A., Muñoz-Sabater, J., et al. (2020). The ERA5 global reanalysis. Q. J. R. Meteorol. Soc. 146, 1999–2049. doi: 10.1002/qj.3803
Holton, J. R. (1972). An Introduction to Dynamic Meteorology. Number 16 in International geophysics series. New York, NY: Academic Press.
Hoogewind, K. A., Baldwin, M. E., and Trapp, R. J. (2017). The impact of climate change on hazardous convective weather in the United States: insight from high-resolution dynamical downscaling. J. Clim. 30, 10081–10100. doi: 10.1175/JCLI-D-16-0885.1
Hurrell, J. W., Holland, M. M., Gent, P. R., Ghan, S., Kay, J. E., Kushner, P. J., et al. (2013). The community earth system model: a framework for collaborative research. Bull. Am. Meteorol. Soc. 94, 1339–1360. doi: 10.1175/BAMS-D-12-00121.1
Johns, R. H., and Doswell, C. A. (1992). Severe local storms forecasting. Weather Forecast. 7, 588–612. doi: 10.1175/1520-0434(1992)007<0588:SLSF>2.0.CO;2
Kelly, D. L., Schaefer, J. T., and Doswell, C. A. (1985). Climatology of nontornadic severe thunderstorm events in the United States. Mon. Weather Rev. 113, 1997–2014. doi: 10.1175/1520-0493(1985)113<1997:CONSTE>2.0.CO;2
Kirtman, B. P., Min, D., Infanti, J. M., Kinter, J. L., Paolino, D. A., Zhang, Q., et al. (2014). The North American Multimodel Ensemble: phase-1 seasonal-to-interannual prediction; phase-2 toward developing intraseasonal prediction. Bull. Am. Meteorol. Soc. 95, 585–601. doi: 10.1175/BAMS-D-12-00050.1
Klemp, J. B. (1987). Dynamics of tornadic thunderstorms. Annu. Rev. Fluid Mech. 19, 369–402. doi: 10.1146/annurev.fl.19.010187.002101
Lee, S. H., Williams, P. D., and Frame, T. H. A. (2019). Increased shear in the North Atlantic upper-level jet stream over the past four decades. Nature 572, 639–642. doi: 10.1038/s41586-019-1465-z
Lehner, F., and Deser, C. (2023). Origin, importance, and predictive limits of internal climate variability. Environ. Res. Clim. 2:023001. doi: 10.1088/2752-5295/accf30
Lepore, C., Abernathey, R., Henderson, N., Allen, J. T., and Tippett, M. K. (2021). Future global convective environments in CMIP6 models. Earths Future 9:e2021EF002277. doi: 10.1029/2021EF002277
Lepore, C., Tippett, M. K., and Allen, J. T. (2017). ENSO-based probabilistic forecasts of March May U.S. tornado and hail activity. Geophys. Res. Lett. 44, 9093–9101. doi: 10.1002/2017GL074781
Li, F., and Chavas, D. R. (2021). Midlatitude continental CAPE is predictable from large-scale environmental parameters. Geophys. Res. Lett. 48:e2020GL091799. doi: 10.1029/2020GL091799
Li, F., Chavas, D. R., Reed, K. A., and Dawson II, D. T. (2020). Climatology of severe local storm environments and synoptic-scale features over North America in ERA5 reanalysis and CAM6 simulation. J. Clim. 33, 8339–8365. doi: 10.1175/JCLI-D-19-0986.1
Lilly, D. K. (1979). The dynamical structure and evolution of thunderstorms and squall lines. Annu. Rev. Earth Planet. Sci. 7, 117. doi: 10.1146/annurev.ea.07.050179.001001
Liu, C., Ikeda, K., Rasmussen, R., Barlage, M., Newman, A. J., Prein, A. F., et al. (2017). Continental-scale convection-permitting modeling of the current and future climate of North America. Clim. Dyn. 49, 71–95. doi: 10.1007/s00382-016-3327-9
Maas, M., Supinie, T., Berrington, A., Emmerson, S., Aidala, A., Gavan, M., et al. (2024). The Tornado archive: compiling and visualizing a worldwide digitized tornado database. Bull. Am. Meteorol. Soc. 105:7. doi: 10.1175/BAMS-D-23-0123.1
Mankin, J. S., Lehner, F., Coats, S., and McKinnon, K. A. (2020). The value of initial condition large ensembles to robust adaptation decision-making. Earths Future 8:e2012EF001610. doi: 10.1029/2020EF001610
Markowski, P. M., and Richardson, Y. (2010). “Mesoscale convective systems,” in Mesoscale Meteorology in Midlatitudes, eds. P. Markowski, and Y. Richardson (Hoboken, NJ: Wiley), 245–272. doi: 10.1002/9780470682104.ch9
Miller, D. E., Gensini, V. A., and Barrett, B. S. (2022). Madden-Julian oscillation influences United States springtime tornado and hail frequency. NPJ Clim. Atmos. Sci. 5, 1–8. doi: 10.1038/s41612-022-00263-5
Molina, M. J., Timmer, R. P., and Allen, J. T. (2016). Importance of the Gulf of Mexico as a climate driver for U.S. severe thunderstorm activity. Geophys. Res. Lett. 43, 12295–12304. doi: 10.1002/2016GL071603
Mulholland, J. P., Peters, J. M., and Morrison, H. (2021). How does vertical wind shear influence entrainment in squall lines? J. Atmos. Sci. 78, 1931–1946. doi: 10.1175/JAS-D-20-0299.1
Mulholland, J. P., Nesbitt, S. W., Trapp, R. J., Rasmussen, K. L., and Salio, P. V. (2018). Convective storm life cycle and environments near the Sierras de Córdoba, Argentina. Mon. Weather Rev. 146, 2541–2557. doi: 10.1175/MWR-D-18-0081.1
Nesbitt, S. W., Salio, P. V., Ávila, E., Bitzer, P., Carey, L., Chandrasekar, V., et al. (2021). A storm safari in subtropical south america: proyecto RELAMPAGO. Bull. Am. Meteorol. Soc. 102, E1621–E1644. doi: 10.1175/BAMS-D-20-0029.1
NOAA National Centers for Environmental Information (NCEI) (2023). U.S. Billion-Dollar Weather and Climate Disasters, 1980-Present. doi: 10.25921/stkw-7w73
O'Neill, B. C., Tebaldi, C., van Vuuren, D. P., Eyring, V., Friedlingstein, P., Hurtt, G., et al. (2016). The scenario model intercomparison project (scenariomip) for CMIP6. Geosci. Model Dev. 9, 3461–3482. doi: 10.5194/gmd-9-3461-2016
Otto-Bliesner, B. L., Brady, E. C., Fasullo, J., Jahn, A., Landrum, L., Stevenson, S., et al. (2016). Climate variability and change since 850 CE: an ensemble approach with the community earth system model. Bull. Am. Meteorol. Soc. 97, 735–754. doi: 10.1175/BAMS-D-14-00233.1
Pilguj, N., Taszarek, M., Allen, J. T., and Hoogewind, K. A. (2022). Are trends in convective parameters over the United States and Europe consistent between reanalyses and observations? J. Clim. 35, 3605–3626. doi: 10.1175/JCLI-D-21-0135.1
Piper, D. A., Kunz, M., Allen, J. T., and Mohr, S. (2019). Investigation of the temporal variability of thunderstorms in central and western Europe and the relation to large-scale flow and teleconnection patterns. Q. J. R. Meteorol. Soc. 145, 3644–3666. doi: 10.1002/qj.3647
Rasmussen, E. N., and Blanchard, D. O. (1998). A baseline climatology of sounding-derived supercell and tornado forecast parameters. Weather Forecast. 13, 1148–1164. doi: 10.1175/1520-0434(1998)013<1148:ABCOSD>2.0.CO;2
Rasmussen, K. L., and Houze, R. A. (2011). Orogenic convection in subtropical south america as seen by the TRMM satellite. Mon. Weather Rev.139, 2399–2420. doi: 10.1175/MWR-D-10-05006.1
Rasmussen, K. L., and Houze, R. A. (2016). Convective initiation near the andes in subtropical South America. Mon. Weather Rev.144, 2351–2374. doi: 10.1175/MWR-D-15-0058.1
Rasmussen, K. L., Prein, A. F., Rasmussen, R. M., Ikeda, K., and Liu, C. (2017). Changes in the convective population and thermodynamic environments in convection-permitting regional climate simulations over the United States. Clim. Dyn. 55, 383–408. doi: 10.1007/s00382-017-4000-7
Rasmussen, K. L., Zuluaga, M. D., and Houze, R. A. Jr. (2014). Severe convection and lightning in subtropical South America. Geophys. Res. Lett. 41, 7359–7366. doi: 10.1002/2014GL061767
Riemann-Campe, K., Fraedrich, K., and Lunkeit, F. (2009). Global climatology of Convective Available Potential Energy (CAPE) and convective inhibition (CIN) in ERA-40 reanalysis. Atmos. Res. 93, 534–545. doi: 10.1016/j.atmosres.2008.09.037
Rochette, S. M., Moore, J. T., and Market, P. S. (1999). The importance of parcel choice in elevated CAPE computations. Natl. Weather Dig. 23, 20–32.
Rodgers, K. B., Lee, S.-S., Rosenbloom, N., Timmermann, A., Danabasoglu, G., Deser, C., et al. (2021). Ubiquity of human-induced changes in climate variability. Earth Syst. Dyn. 12, 1393–1411. doi: 10.5194/esd-12-1393-2021
Romatschke, U., and Houze, R. A. (2010). Extreme summer convection in South America. J. Clim. 23, 3761–3791. doi: 10.1175/2010JCLI3465.1
Romps, D. M. (2016). Clausius Clapeyron Scaling of CAPE from analytical solutions to RCE. J. Atmos. Sci. 73, 3719–3737. doi: 10.1175/JAS-D-15-0327.1
Rotunno, R. (1981). On the evolution of thunderstorm rotation. Mon. Weather Rev.109, 577–586. doi: 10.1175/1520-0493(1981)109<0577:OTEOTR>2.0.CO;2
Sander, J., Eichner, J. F., Faust, E., and Steuer, M. (2013). Rising variability in thunderstorm-related U.S. losses as a reflection of changes in large-scale thunderstorm forcing. Weather Clim. Soc. 5, 317–331. doi: 10.1175/WCAS-D-12-00023.1
Seeley, J. T., and Romps, D. M. (2015). The effect of global warming on severe thunderstorms in the United States. J. Clim. 28, 2443–2458. doi: 10.1175/JCLI-D-14-00382.1
Sherburn, K. D., and Parker, M. D. (2014). Climatology and ingredients of significant severe convection in high-shear, low-CAPE environments. Weather Forecast. 29, 854–877. doi: 10.1175/WAF-D-13-00041.1
Simpson, I. R., Bacmeister, J., Neale, R. B., Hannay, C., Gettelman, A., Garcia, R. R., et al. (2020). An evaluation of the large-scale atmospheric circulation and its variability in CESM2 and other CMIP models. J. Geophys. Res. Atmos. 125:e2020JD032835. doi: 10.1029/2020JD032835
Singh, M. S., and O'Gorman, P. A. (2013). Influence of entrainment on the thermal stratification in simulations of radiative-convective equilibrium. Geophys. Res. Lett. 40, 4398–4403. doi: 10.1002/grl.50796
Skamarock, C., Klemp, B., Dudhia, J., Gill, O., Liu, Z., Berner, J., et al. (2021). A Description of the Advanced Research WRF Model Version 4.3. doi: 10.5065/1dfh-6p97
Song, F., Feng, Z., Leung, L. R., Houze Jr, R. A, Wang, J., Hardin, J., et al. (2019). Contrasting spring and summer large-scale environments associated with mesoscale convective systems over the U.S. great plains. J. Clim. 32, 6749–6767. doi: 10.1175/JCLI-D-18-0839.1
Taszarek, M., Allen, J. T., Marchio, M., and Brooks, H. E. (2021). Global climatology and trends in convective environments from ERA5 and rawinsonde data. NPJ Clim. Atmos. Sci. 4, 1–11. doi: 10.1038/s41612-021-00190-x
Taszarek, M., Allen, J. T., Púčik, T., Hoogewind, K. A., and Brooks, H. E. (2020). Severe convective storms across Europe and the United States. Part II: ERA5 environments associated with lightning, Large Hail, Severe Wind, and Tornadoes. J. Clim. 33, 10263–10286. doi: 10.1175/JCLI-D-20-0346.1
Taylor, K. E., Stouffer, R. J., and Meehl, G. A. (2012). An overview of CMIP5 and the experiment design. Bull. Am. Meteorol. Soc. 93, 485–498. doi: 10.1175/BAMS-D-11-00094.1
Thompson, D. B., and Roundy, P. E. (2013). The relationship between the Madden Julian Oscillation and U.S. Violent Tornado outbreaks in the Spring. Mon. Weather Rev. 141, 2087–2095. doi: 10.1175/MWR-D-12-00173.1
Ting, M., Kossin, J. P., Camargo, S. J., and Li, C. (2019). Past and future hurricane intensity change along the U.S. East Coast. Sci. Rep. 9:7795. doi: 10.1038/s41598-019-44252-w
Tippett, M. K. (2018). Robustness of relations between the MJO and U.S. Tornado occurrence. Mon. Weather Rev. 146, 3873–3884. doi: 10.1175/MWR-D-18-0207.1
Tippett, M. K., Lepore, C., and L'Heureux, M. L. (2022). Predictability of a tornado environment index from El Niñ Southern Oscillation (ENSO) and the Arctic oscillation. Weather Clim. Dyn. 3, 1063–1075. doi: 10.5194/wcd-3-1063-2022
Trapp, R. J., Diffenbaugh, N. S., and Gluhovsky, A. (2009). Transient response of severe thunderstorm forcing to elevated greenhouse gas concentrations. Geophys. Res. Lett. 36:L01703. doi: 10.1029/2008GL036203
Trapp, R. J., and Hoogewind, K. (2019). Future changes in hail occurrence in the United States determined through convection-permitting dynamical downscaling. J. Clim. 32, 5493–5509. doi: 10.1175/JCLI-D-18-0740.1
Trapp, R. J., and Hoogewind, K. A. (2016). The realization of extreme tornadic storm events under future anthropogenic climate change. J. Clim. 29, 5251–5265. doi: 10.1175/JCLI-D-15-0623.1
Trapp, R. J., Diffenbaugh, N. S., Brooks, H. E., Baldwin, M. E., Robinson, E. D., Pal, J. S., et al. (2007). Changes in severe thunderstorm environment frequency during the 21st century caused by anthropogenically enhanced global radiative forcing. Proc. Nat. Acad. Sci. 104, 19719–19723. doi: 10.1073/pnas.0705494104
Wang, Z., and Moyer, E. J. (2023). Robust relationship between midlatitudes CAPE and moist static energy surplus in present and future simulations. Geophys. Res. Lett. 50:e2023GL104163. doi: 10.1029/2023GL104163
Watters, D., Battaglia, A., and Allan, R. P. (2021). The diurnal cycle of precipitation according to multiple decades of global satellite observations, three CMIP6 models, and the ECMWF reanalysis. J. Clim. 34:5063. doi: 10.1175/JCLI-D-20-0966.1
Weisman, M. L., and Rotunno, R. (2000). The use of vertical wind shear versus helicity in interpreting supercell dynamics. J. Atmos. Sci. 57, 1452–1472. doi: 10.1175/1520-0469(2000)057<1452:TUOVWS>2.0.CO;2
Keywords: convection, mesoscale convective systems, climate change, internal variability, forced variability, decadal variability, convective environments, severe weather
Citation: Franke ME, Hurrell JW, Rasmussen KL and Sun L (2024) Impacts of forced and internal climate variability on changes in convective environments over the eastern United States. Front. Clim. 6:1385527. doi: 10.3389/fclim.2024.1385527
Received: 13 February 2024; Accepted: 13 August 2024;
Published: 01 October 2024.
Edited by:
Xiaosong Yang, NOAA/Geophysical Fluid Dynamics Laboratory, United StatesReviewed by:
Miguel Lovino, National Scientific and Technical Research Council (CONICET), ArgentinaFuning Li, Massachusetts Institute of Technology, United States
Wenhao Dong, Princeton University, United States
Copyright © 2024 Franke, Hurrell, Rasmussen and Sun. This is an open-access article distributed under the terms of the Creative Commons Attribution License (CC BY). The use, distribution or reproduction in other forums is permitted, provided the original author(s) and the copyright owner(s) are credited and that the original publication in this journal is cited, in accordance with accepted academic practice. No use, distribution or reproduction is permitted which does not comply with these terms.
*Correspondence: Megan E. Franke, bWVnYW4uZnJhbmtlQGNvbG9zdGF0ZS5lZHU=