
94% of researchers rate our articles as excellent or good
Learn more about the work of our research integrity team to safeguard the quality of each article we publish.
Find out more
ORIGINAL RESEARCH article
Front. Clim., 22 July 2024
Sec. Predictions and Projections
Volume 6 - 2024 | https://doi.org/10.3389/fclim.2024.1384202
 Ravi Kumar Kunchala1,2
 Raju Attada2,3
 Rama Krishna Karumuri2,4
 Vivek Seelanki5,6
 Bhupendra Bahadur Singh7
 Karumuri Ashok2,4
 Ibrahim Hoteit2*
This study assesses the aerosol optical depth (AOD) from historical simulations (2003–2014) and future climate scenarios (2015–2100) of the Coupled Model Intercomparison Project Phase 6 (CMIP6) over the Middle East and North Africa (MENA) region. Multi-model mean (MME) AOD statistics are generated as the average of those from the five best-performing CMIP6 models, which reproduce observational climate statistics. These models were selected based on the validation of various climate metrics, including strong pattern correlations with observations (>0.8). The resulting MME reproduces the observed AOD seasonal cycle well. The observed positive trends (summer and annual) over the Arabian Peninsula (AP) and negative trends (winter) over North Africa are well captured by MME, as regional meteorological drivers associated with observed AOD trends, with few discrepancies. Crucially, the MME fails to capture the AOD trends over North West Africa (NWA). For MENA and NWA regions, two high-emission scenarios, SSP370 and SSP585, project a continuous rise in the annual mean AOD until the end of the century. In contrast, the low-emission scenarios, SSP126 and SSP245, project a decreasing AOD trend. Interestingly, the projected future AOD area-averaged over the AP region varies significantly across all four scenarios in time. Notably, a substantial decrease of about 8–10% in the AOD is projected by the SSP126, SSP245, and SSP585 scenarios at the end of the century (2080–2100) relative to the current period. This projected decrease in annual-mean AOD, including the frequency of extreme AOD years under SSP585, is potentially associated with a concurrent increase in annual-mean rainfall over the AP.
Aerosols significantly impact the energy budget of the Earth-atmosphere system. The sharp rise in aerosol emissions over the Middle East and North Africa (MENA) region is primarily due to factors such as enhanced local surface heating, intensified local winds, and decreased soil moisture and vegetation (Davis et al., 2015; Yu et al., 2016; Ravi Kumar et al., 2019; Karumuri et al., 2021, 2022). The Middle East experiences an average of twenty major dust storms annually (Prakash et al., 2015; Ravi Kumar et al., 2019). The lifecycle of atmospheric aerosols from emission to transport and deposition is heavily influenced by atmospheric dynamics and thermodynamics (Kok et al., 2018). Atmospheric aerosols originate from a variety of sources, including biogenic (natural) and anthropogenic (human-related) activities. Mineral dust, a major component of aerosols, profoundly affects the Earth’s climate system (Pöschl, 2005; Vinoj et al., 2014), air quality (Islam and Almazroui, 2012), human health (Burnett et al., 2014; Krishna et al., 2019), and the fertilization of iron-deficient marine ecosystems (Mahowald et al., 2005; Jickells and Moore, 2015). A significant portion of global mineral dust originates from large desert regions such as the Sahara, Sahel, and Rub’ al Khali (Goudie and Middleton, 2001; Engelstaedter et al., 2006; Kok et al., 2018; Kumar et al., 2018). Aerosols from these deserts are known for their high optical depths (Masmoudi et al., 2015).
Nowadays, information about aerosols is primarily obtained through ground-based observations, satellites, and model simulations (Kalenderski and Stenchikov, 2016; Mehta et al., 2016; Kumar et al., 2018; Karumuri et al., 2021). Ground-based observations are collected from fixed monitoring stations and through campaigns that utilize mobile vehicles, ships, and other means. However, the deployed networks limit their spatial coverage (Li et al., 2020). Satellite observations offer relatively continuous long-term data of global aerosol concentrations over large areas, albeit with limitations in terms of time and altitude resolution (Li et al., 2022). Therefore, numerical models are utilized to simulate aerosol concentrations and provide information about different aerosol types based on emission inventories and atmospheric conditions (Ghan and Schwartz, 2007). Once validated, these models enable a comprehensive assessment of aerosol transport dynamics and variability. The simulated distributions of aerosols and dust emission processes depend on various factors such as land use, land category, soil conditions, precipitation, and the relevant physics (Titos et al., 2017; Shukla et al., 2022). Targeted simulations offer insights into the historical and possible future evolutions of aerosols, and to understand their trends and long-term variations spanning from years to decades (Ghan and Schwartz, 2007). This information is particularly valuable for regions with limited observed data, such as the Middle East and North Africa (MENA) region, in interpreting climate variations.
The MENA region, consisting of the Eastern Mediterranean Arabian Peninsula (AP) and North African sub-regions, including the Sahel and Sahara deserts, is one of the primary sources of dust aerosols in the world (Parajuli et al., 2016; Kumar et al., 2018; Ravi Kumar et al., 2019). It is a significant hotspot for dust, contributing approximately 75% of the global aerosol loading (Ginoux et al., 2012). Surface winds in the region play a crucial role in driving local dust emissions and transporting the dust downstream. For instance, prolonged periods of drought in the North African sub-regions have led to local drying (Chaibou et al., 2020). This resulted in desertification that has been associated with a significant increase in dust aerosol loading across the MENA region (Middleton, 1985; Held et al., 2005; Ackerley et al., 2011; Giannini and Kaplan, 2019; Almazroui, 2020).
The aerosol optical depth (AOD) represents the attenuation coefficient of insolation associated with particulate matter in the atmosphere (Sartelet et al., 2018). The AOD variability over the MENA region is closely linked to the frequency and intensity of regional dust storms, which are often triggered by atmospheric instability (Knippertz and Todd, 2012). Dust storms and strong surface winds are common in the MENA region, particularly in the Sahara and Sahel areas as well as the eastern and southern parts of the Arabian Peninsula during the summer (June–September) and winter (November–April) seasons (Mashat et al., 2008;; Alharbi et al., 2013; Kumar et al., 2018; Ravi Kumar et al., 2019; Chaibou et al., 2020). High AOD concentrations are often associated with the increased number and intensity of regional dust storm events (Sultan et al., 2013; Esmaeil et al., 2014; Farahat et al., 2015; Xian, 2016). In addition, the local topography and atmospheric circulation patterns play a significant role in driving dust distribution across the MENA region (Jiang et al., 2009; Roberts and Knippertz, 2014; Kumar et al., 2018).
Several studies utilized regional climate models to identify dust sources and understand their impacts on the MENA climate (Pérez et al., 2006; Cuesta et al., 2010; Jones et al., 2011; Knippertz and Todd, 2012; Kalenderski and Stenchikov, 2016; Karumuri et al., 2021). However, most of these studies focused on specific cases of dust storms or dust changes over particular periods, such as weeks to seasons, to examine AOD modulations in the region. Studies based on long-term variations and trends in AOD over the MENA region are particularly lacking. Interestingly, significant improvements in aerosol parameterization schemes in successive Coupled Model Intercomparison Project Phase (CMIP) phases have resulted in better AOD simulations over various regions (Sanap et al., 2014; Tilmes et al., 2015; Misra et al., 2016). Specifically, compared to the CMIP5 models, the latest CMIP6 models have demonstrated increased skill in producing realistic simulations of AOD distributions and observed trends (Cherian and Quaas, 2020). In this context, analyzing the outputs from the latest-generation CMIP6 models will help investigate the mean AOD distribution over the MENA region, its long-term variations, and the associated dynamics. Evaluating the fidelity of CMIP6 simulated climatological AODs in relation to observations over the MENA region is a prerequisite for such an analysis.
Here, we examine the fidelity of historical simulations from CMIP6 models in reproducing observed climatological features, seasonal variability, and trends of AOD over the major dust hotspot regions of MENA. We evaluate the AOD simulations from 16 CMIP6 models (Eyring et al., 2016; O’Neill et al., 2016) using satellite AOD data from the Moderate Resolution Imaging Spectroradiometer (MODIS) and Multiangle Imaging Spectroradiometer (MISR), as well as data from the Modern-Era Retrospective analysis for Research and Applications, version 2 (MERRA2). The best set of aerosol models for the MENA region was identified based on Taylor diagram analysis (Martin, 1991; Taylor, 2001). This analysis allowed us to compute a multi-model mean (MME), focusing on the simulated mean Aerosol Optical Depth (AOD) and its interannual variability over the region. Additionally, we assessed the fidelity of the spatial trends of AOD in the CMIP6 historical simulations over the MENA region for the common period (2003–2014) of satellite observations.
Only a few studies have so far assessed future changes in AOD using CMIP6 simulations. For instance, Wang et al. (2021) explored AOD projections until the end of the 21st century and compared them to historical simulations. However, no studies have specifically focused on the MENA region. Hence, future changes in AOD over the MENA region are investigated using four different Shared Socioeconomic Pathway (SSP) scenarios (SSP126, SSP245, SSP370, and SSP585) from CMIP6 models. Leveraging CMIP6 models offers valuable information for understanding the dynamics of aerosols and their impacts on the climate and air quality over MENA, supporting research efforts, policymaking, and mitigation strategies in this region.
The remainder of the study is organized as follows. Section 2 describes the analyzed data from CMIP6 models and the satellite and reanalysis data products. Section 3 presents and discusses the AOD climatology, variability, trends, and future projections over the MENA region as simulated by the MME of selected CMIP6 models. We also further extended the analysis by analyzing the dominant meteorological variables behind the AOD trends in CMIP6 models. Finally, Section 4 concludes the work along with a summary of the main results and a general discussion.
The observed AOD fields are derived from MODIS (MOD08_D3_v6.1) level 3 and combined Dark Target and Deep Blue AOD products at 550 nm with a resolution of 1° × 1° (De Meij and Lelieveld, 2011). MODIS sensors are known to provide the best available aerosol retrievals compared to other satellite sensors (De Meij et al., 2012; Che et al., 2019). In the following discussion, references to satellite observations include both Moderate Resolution Imaging Spectroradiometer (MODIS) and Multi-angle Imaging SpectroRadiometer (MISR).
The MERRA-2 AOD fields (Gelaro et al., 2017) with a resolution of 0.5° × 0.625° are also utilized. MERRA-2 is the latest atmospheric reanalysis dataset provided by NASA’s Global Modeling and Assimilation Office, which incorporates assimilated meteorological and AOD observations from various sources, including MODIS, MISR, Aerosol Robotic Network, and the Advanced Very High-Resolution Radiometer instrument (Buchard et al., 2015). These AOD datasets are analyzed to assess the ability of the CMIP6 models to reproduce the variations in aerosol loading over the MENA region.
The historical simulations from the 16 CMIP6 fully coupled Earth System Models (ESM), which we analyzed cover the period 1850–2014. The outputs of these simulations are publicly available as contributions from different institutions participating in the CMIP6 of the World Climate Research Programme. The CMIP6 simulations consider time-varying externally imposed forcing fields, including solar variability, volcanic aerosols, and changes in atmospheric composition due to greenhouse gases and aerosols generated by human activities (Eyring et al., 2016). Table 1 summarizes the details of the CMIP6 models, parent institutions, and their resolutions. Since the models have different horizontal resolutions, all model outputs are horizontally interpolated onto a common 1° × 1° grid using Climate Data Operator tools. We adopt a multi-model mean (MME) approach following the “climate filter” concept introduced by Lee and Liang (2020). In essence, this concept suggests that the MME should be estimated based on models that demonstrate the best agreement with observations regarding the climate features of interest. Analogous approach have been recently adopted in several studies (Singh et al., 2022). In our case, the MME of AOD at each grid point is computed by averaging the selected model simulations at each time step. Trends are identified through linear regression analysis, and their significance (at a 95% confidence level) is assessed using the Student’s t-test.
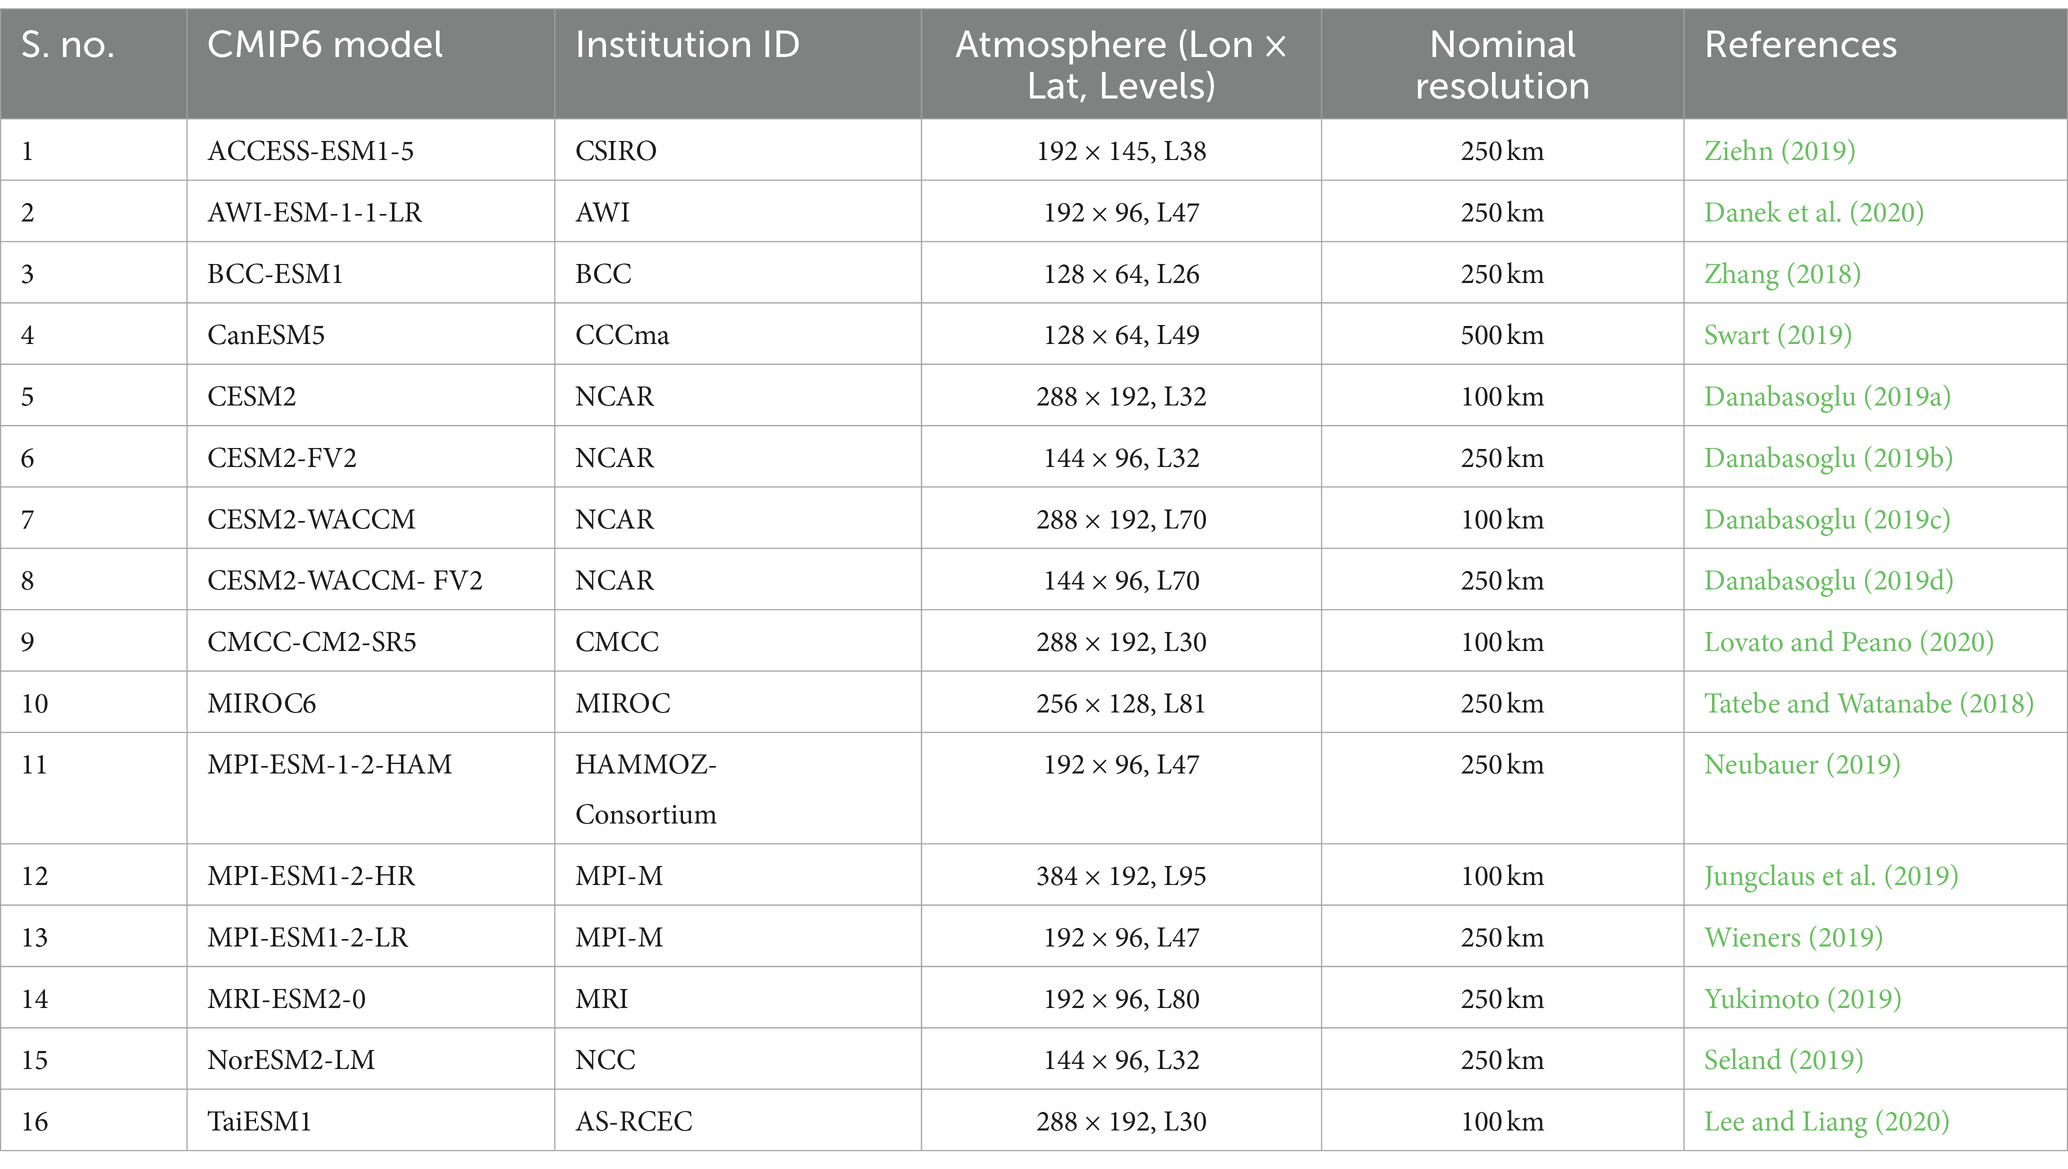
Table 1. Shows the statistics of AOD against all CMIP6 models over the MENA region.
Unless otherwise stated, we utilize monthly mean AOD fields simulated, observed, and reanalyzed at a wavelength of 550 nm. The AOD values presented in this study specifically cover the period of 2003–2014, for which satellite AOD observations are available to validate the models over the historical period.
This section presents an analysis of the AOD distribution and variability in the MENA region based on the CMIP6 model outputs, MODIS and MISR satellite observations, and MERRA-2 data. The CMIP6 AOD fields are first validated against the satellite and reanalysis datasets. Subsequently, a multi-model ensemble (MME) designed from the best suite of CMIP6 models is implemented to examine the climatology, variability, and trends of the AOD, both on seasonal and annual scales. Though the Arabian Peninsula (AP) region is included within the MENA region owing to its distinct characteristic of high dust loading during the summer as well as the distinct climate, the region is given particular emphasis in the analysis as necessary.
Figure 1 illustrates the climatological spatial distribution of the annual AOD obtained from the CMIP6 models, satellite observations, and reanalysis. Satellite observations suggest hotspots with the highest observed aerosol loading located over North Africa and the AP (Figures 1Q,R), with AOD values ranging from 0.2 to 0.6 across the MENA region. These hotspots are also captured by the MERRA-2 reanalysis (Figure 1R) and some of the CMIP6 models, such as CESM2 (Figure 1D), MPI-ESM-HR (Figure 1N), NorESM2-LM (Figure 1P), TaiESM1 (Figure 1H), and AWI-ESM-1-1-LR (Figure 1I). The modeled AOD across the MENA region varies between 0.2 and 0.8. The area-averaged annual climatological AOD value over the MENA region is about 0.35 for satellite observations, while the corresponding simulated values vary between 0.15 and 0.5, which is marginally high in a few regions. The magnitude of the simulated AODs over the major dust loading regions, especially the AP, is close to observations. Conversely, a few CMIP6 models simulate substantially higher AOD values than those observed over the North Africa region; for example, the AOD from CESM2-FV2, CESM2-WACCM-FV2, and CESM2-WACCM models reaches as high as 0.8. Interestingly, while the simulated AOD distribution over North Africa and the AP is in good agreement with the observations and reanalysis, several of the individual models overestimate the AOD distribution in the remaining portions of the broader MENA region. This overestimation is also reflected in the CMIP6 area-averaged AOD values over the MENA region obtained from the CMIP6 models (Table 2), where these values vary between a minimum of 0.14 (MICRO6) and a maximum of 0.75 (CESM2-WACCM-FV2). In comparison, the observed AOD is only 0.32 (MODIS and MISR). Few of the models, such as CESM2-FV2, NorESM2-LM, CESM2, CESM2-WACCM, and TaiESM1, simulate climatological mean AODs close to the satellite observations (~0.32), while other models, such as AWI-ESM-1-1-LR, MIP-ESM-1-2-HR, and MPI-ESM-1-2-LR, provide mean AODs between 0.28 and 0.3.
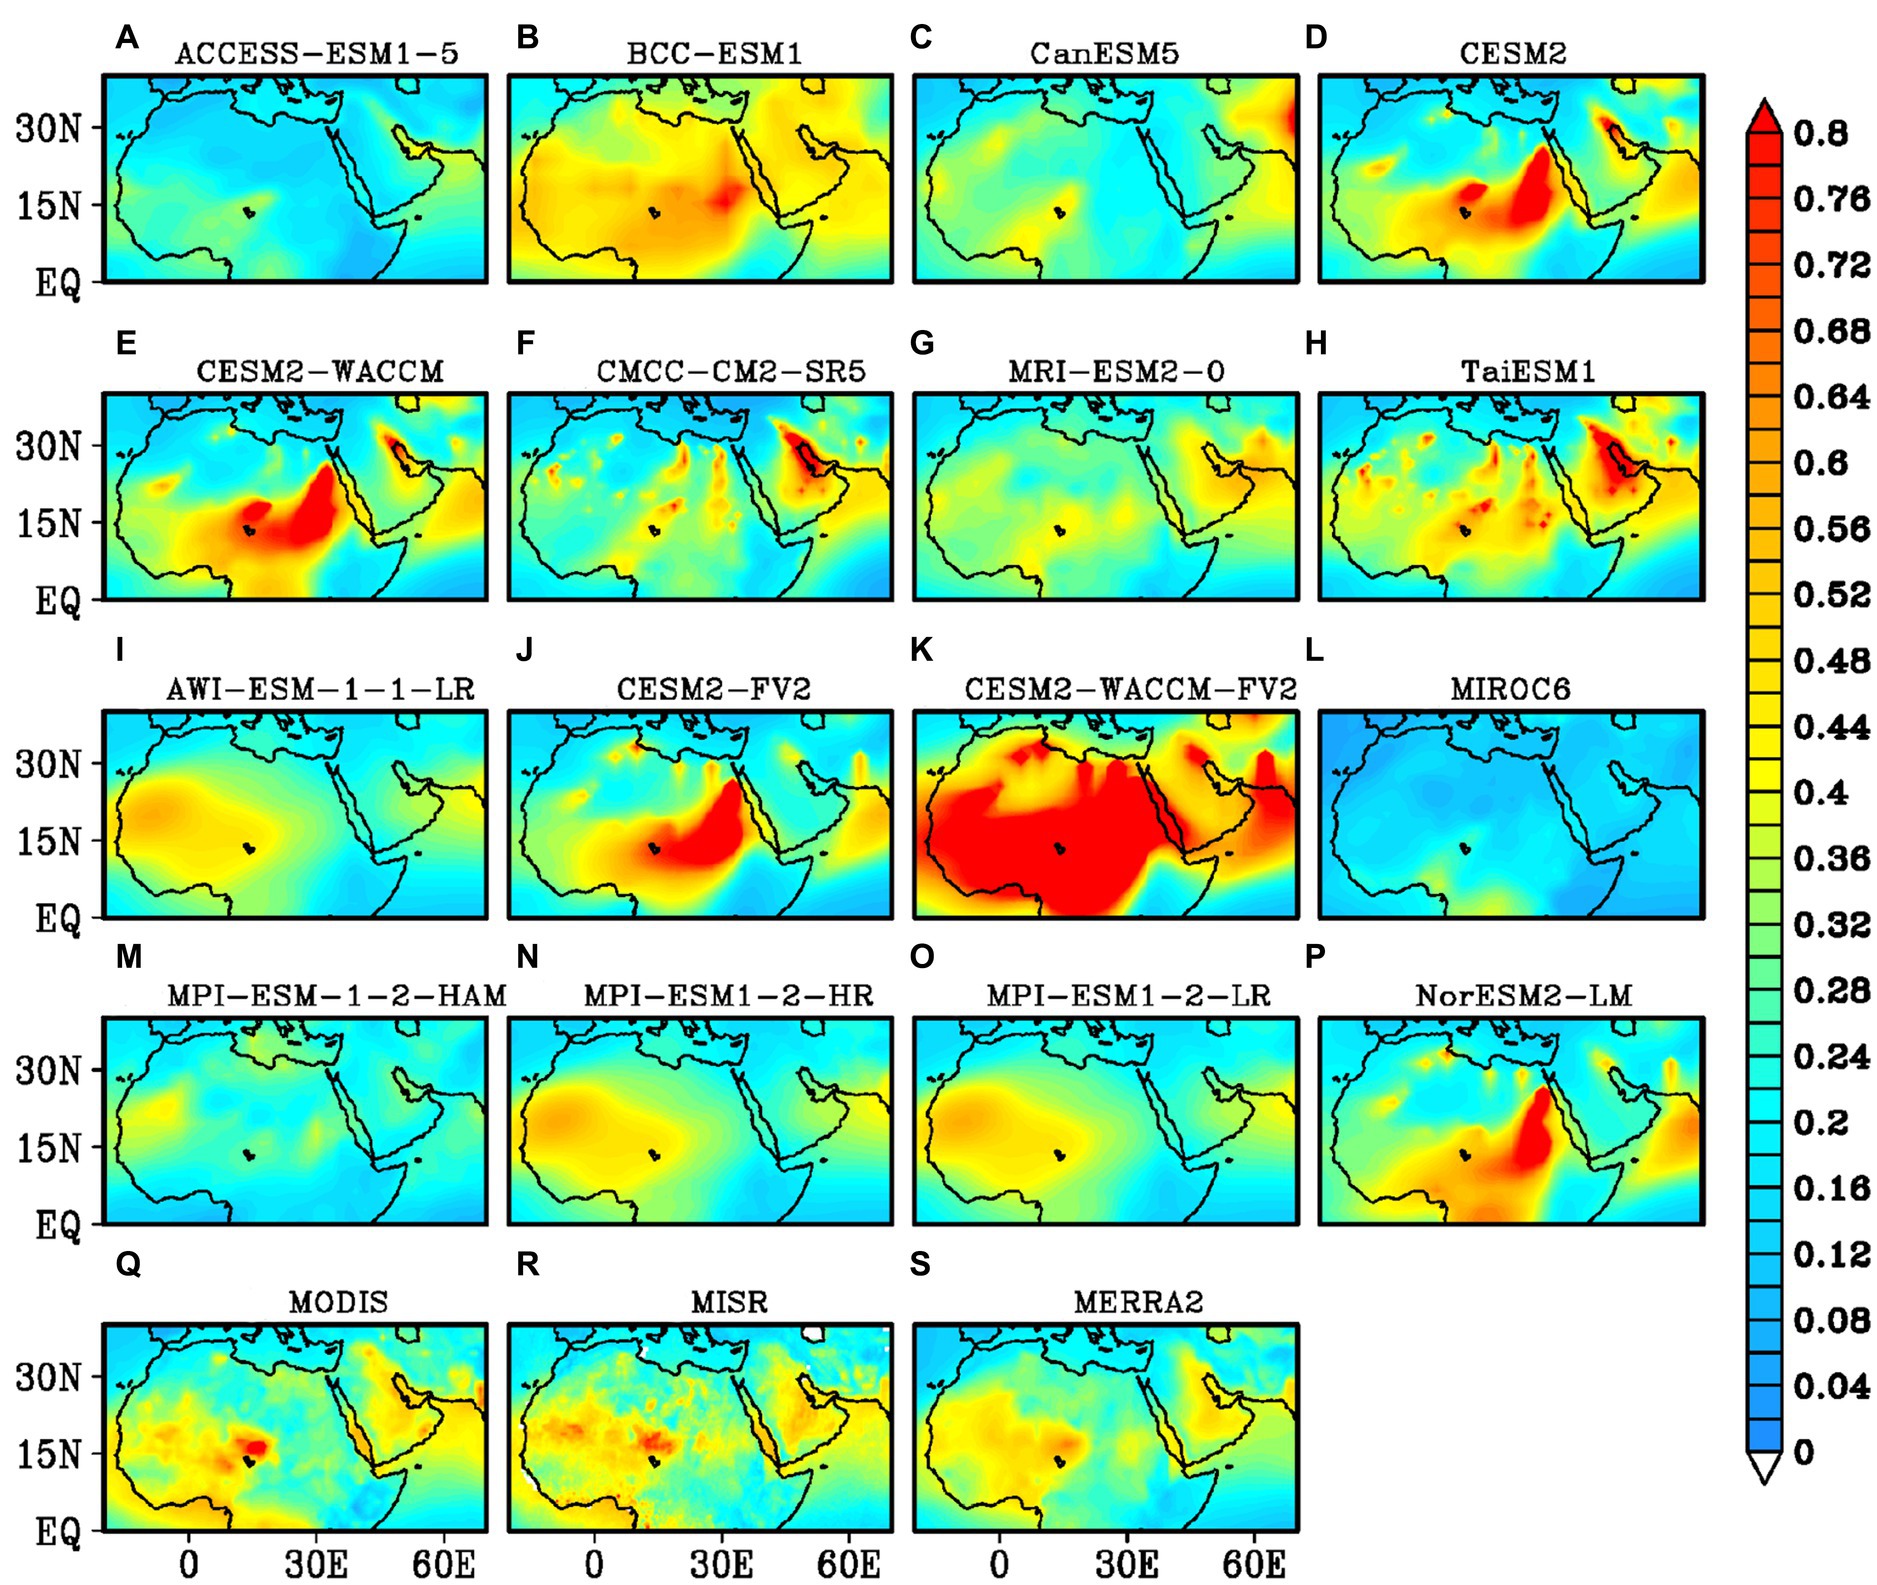
Figure 1. Spatial distribution of annual climatological mean obtained from the CMIP6 models (A-P) along with MODIS (Q) and MISR (R) satellite observations and MERRA2 (S) reanalysis datasets.
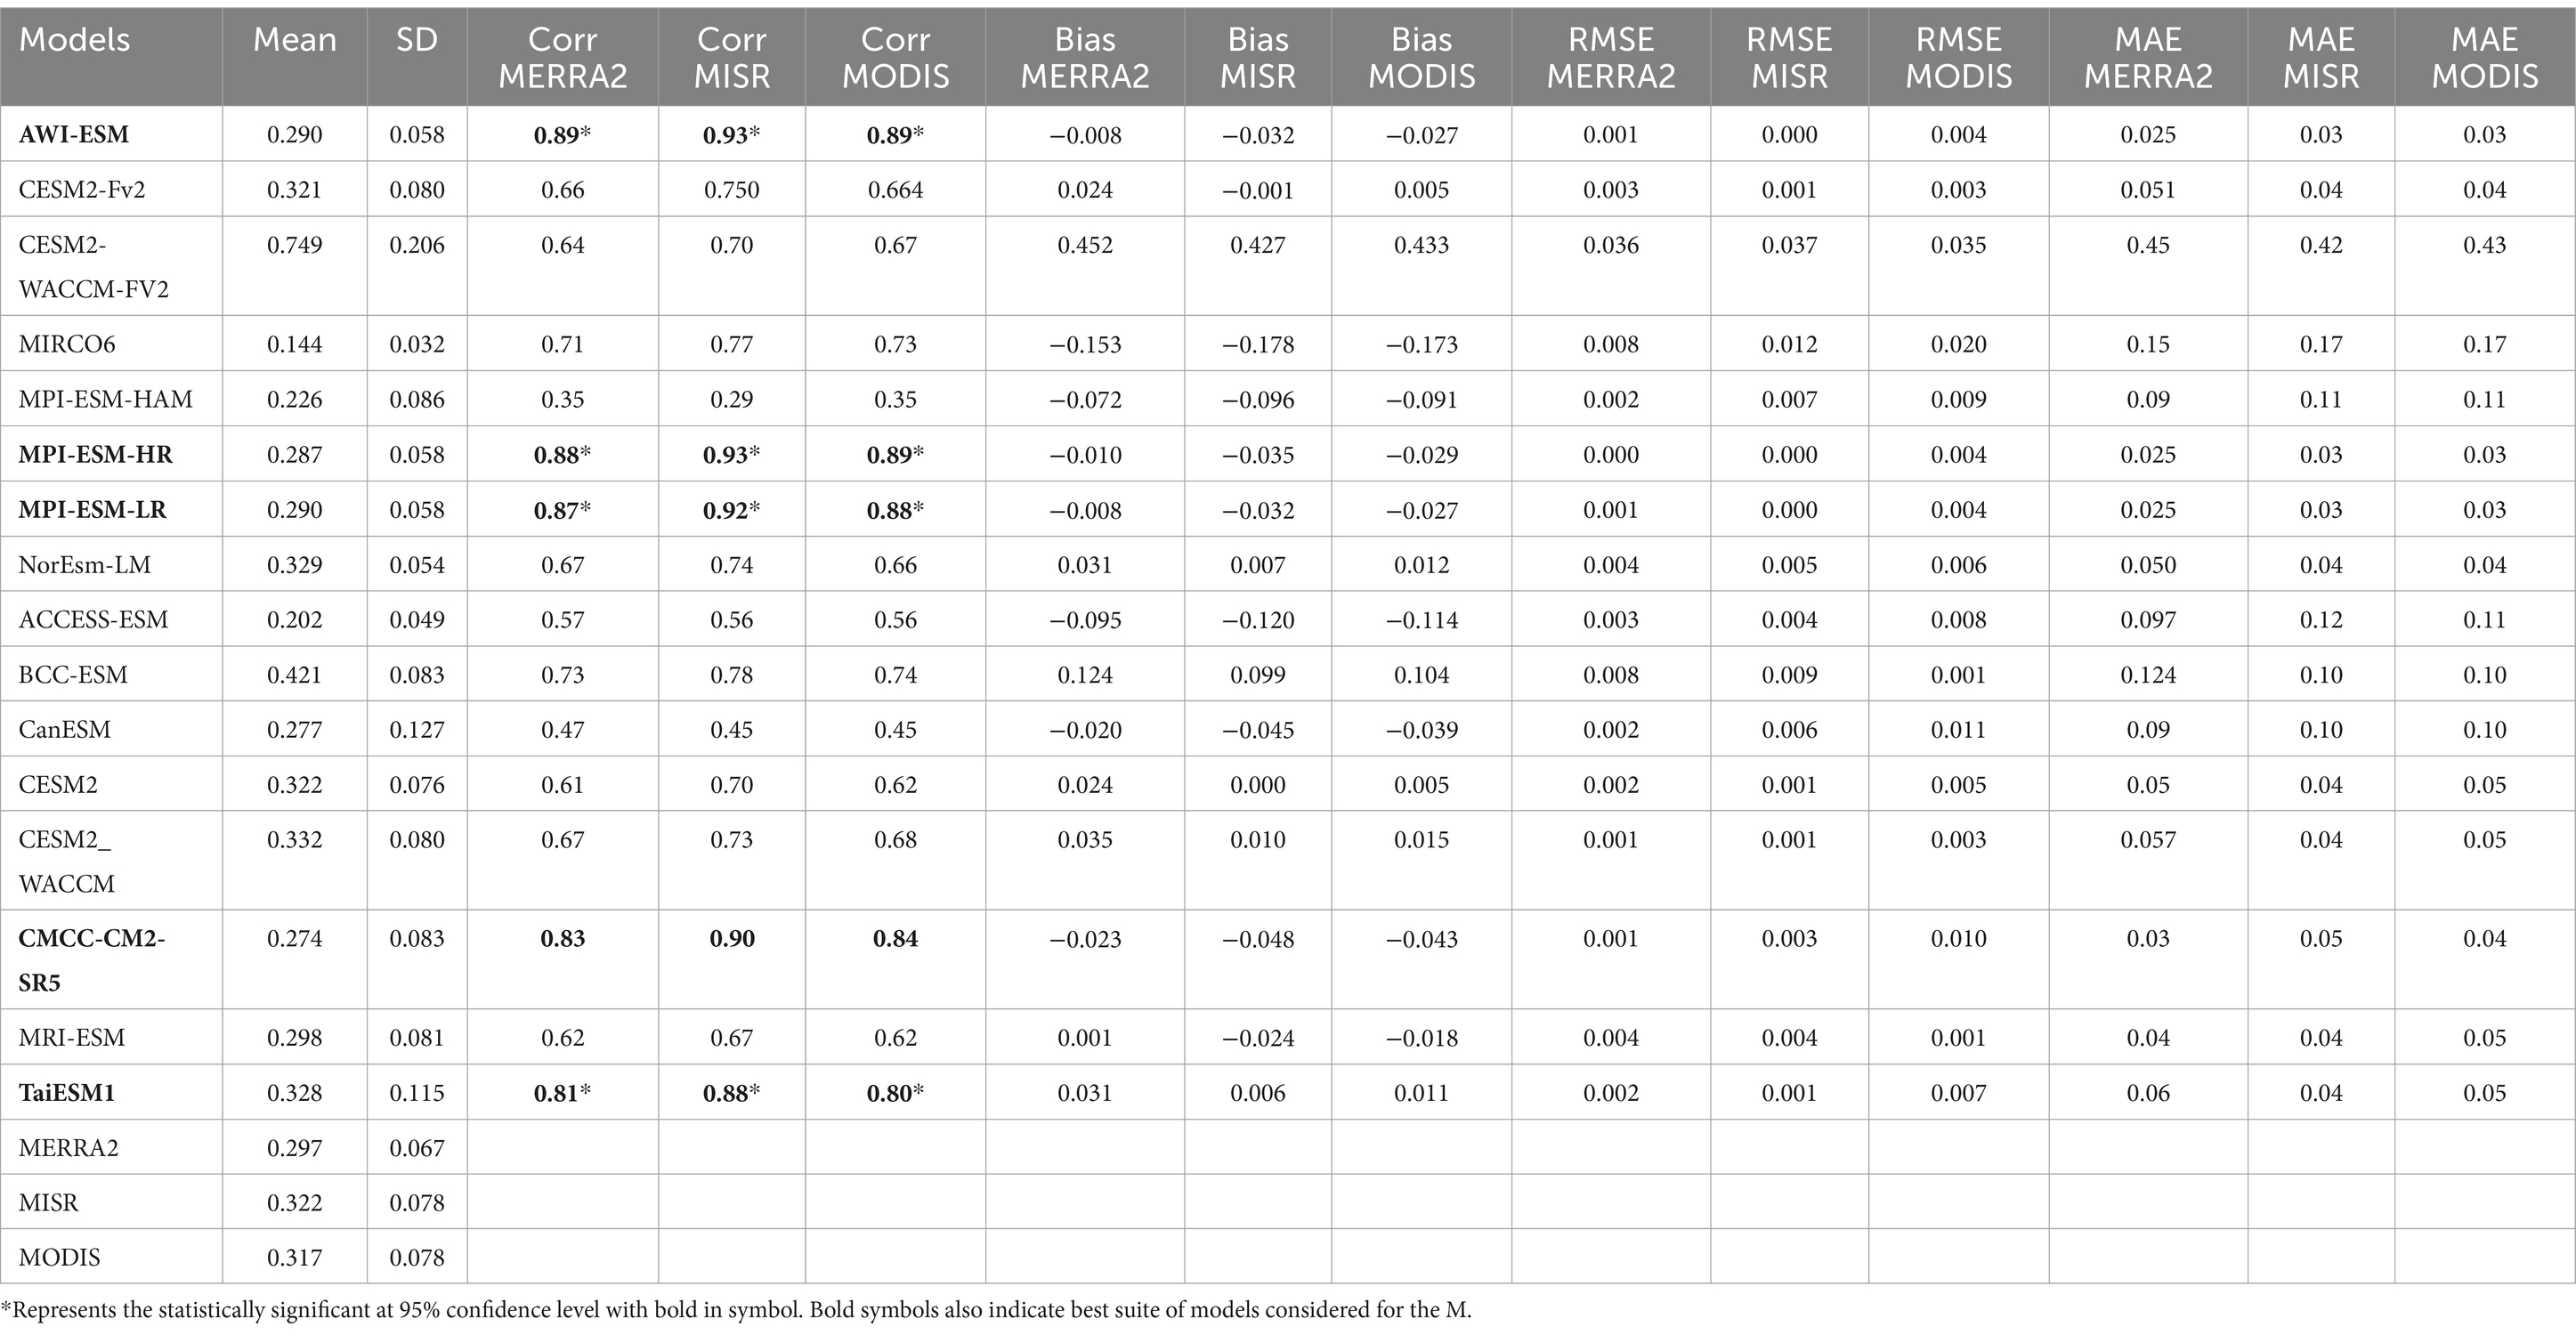
Table 2. Shows the statistics (correlation coefficients, root mean square errors, bias and mean absolute errors) of the AOD between observations and CMIP6 models over MENA region.
The spatial distribution of the standard deviations (SDs) of the annual AOD is from satellite observations and the CMIP6 models, which are now analyzed to examine the variability. The highest SD is observed over North Africa and dust sources regions of the Arabian Peninsula (Figure 2). In contrast, the simulated for most CMIP6 models, the SD varies between 0.1 and 0.4 (Figure 2). CanESM5, CESM2-FV2, CESM2-WACCM-FV2, and MPI-ESM-1-2-HAM models simulate considerably higher SDs (>0.4) than observed. On the other hand, some models, such as ACCESS-ESM1-5, AWI-ESM-1-1-LR, MIROC6, MPI-ESM-1-2-HR, and MPI-ESM-1-2-LR exhibit a low SD of 0.1, half of that than the observed.
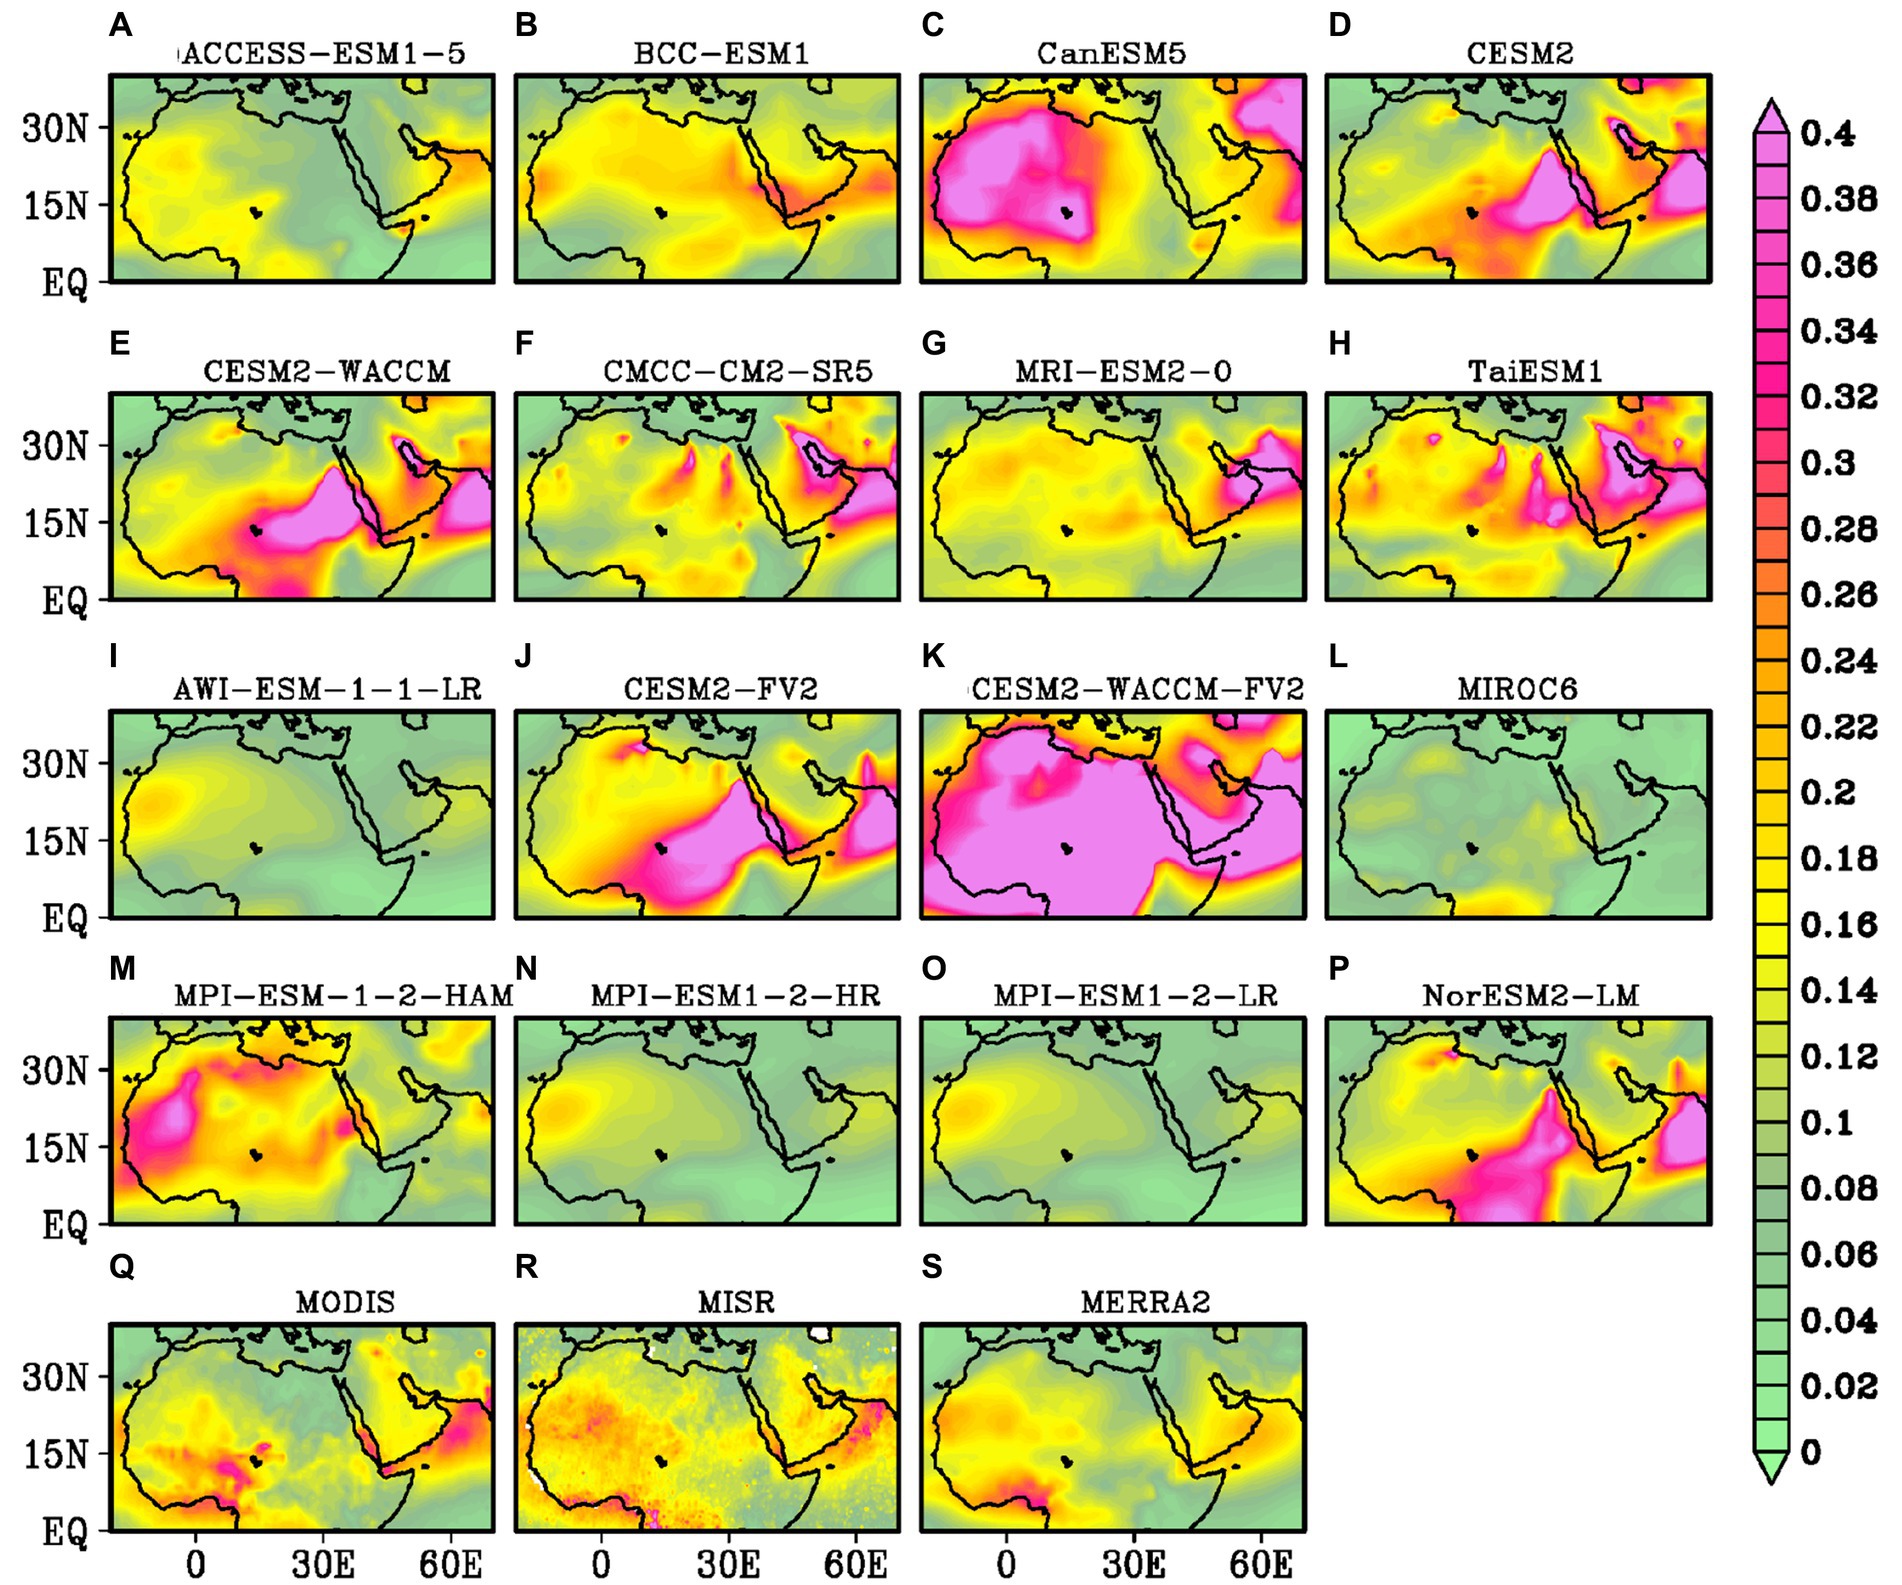
Figure 2. Same as Figure 1, but for standard deviation.
Table 2 lists various statistics used to assess the skill of the CMIP6 models in reproducing the observed AOD variability across the MENA region. This includes standard deviations (SDs), bias, pattern correlation coefficients (CCs), root-mean-square errors (RMSEs), and mean absolute errors (MAEs) of the area-averaged climatological AOD over the MENA region. The area-averaged AOD values for most CMIP6 models range from a minimum of 0.14 (MICRO6) to a maximum of 0.75 (CESM2-WACCM-FV2), compared to 0.32 in the observations (MODIS and MISR). Some models (AWI-ESM1-1-LR, MPI-ESM-1-2-HR, MPI-ESM-1-2-LR, CMCC-CM2-SR5, and TaiESM1) exhibit lower bias and errors (RMSEs and MAEs) compared to satellite observations and the MERRA-2 reanalysis, providing a closer approximation to the observed AOD of ~0.32.
We carry out a Taylor diagrams analysis to compare the pattern correlations between the annual mean AODs from various models and the satellite observations, including the SDs, over the period from 2003 to 2014 are shown in Figure 3. The simulated area-averaged mean AODs from most of the models are significantly correlated with the corresponding observations at the 95–90% confidence level based on a 2-tailed Student’s t-test. The SDs obtained from some of the CMIP6 models (e.g., CMCC-CM2-SR5, BCC-ESM1, CESM2-FV2, CESM-WACCM, MRI-ESM2, and CESM2) agree well with those of satellite observations. The performance of MERRA-2 reanalysis over the MENA region was also assessed and we found that the CMIP6 models are able to produce the similar spatial distributions as compared to MERRA-2. However, these CMIP6 models exhibit higher variability compared to MERRA2. Based on the Taylor diagram analysis (>0.8 pattern correlations against the satellite observations at the 95% confidence level), we identify the five best CMIP6 models (namely AWI-ESM1-1-LR, MPI-ESM-1-2-HR, MPI-ESM-1-2-LR, CMCC-CM2-SR5, and TaiESM1). Most models showed significant correlations (90–95% confidence) and similar standard deviations with MERRA-2. These models are then utilized to generate the MME (Multi-Model Ensemble) mean for further analysis, which is presented in the subsequent sections.
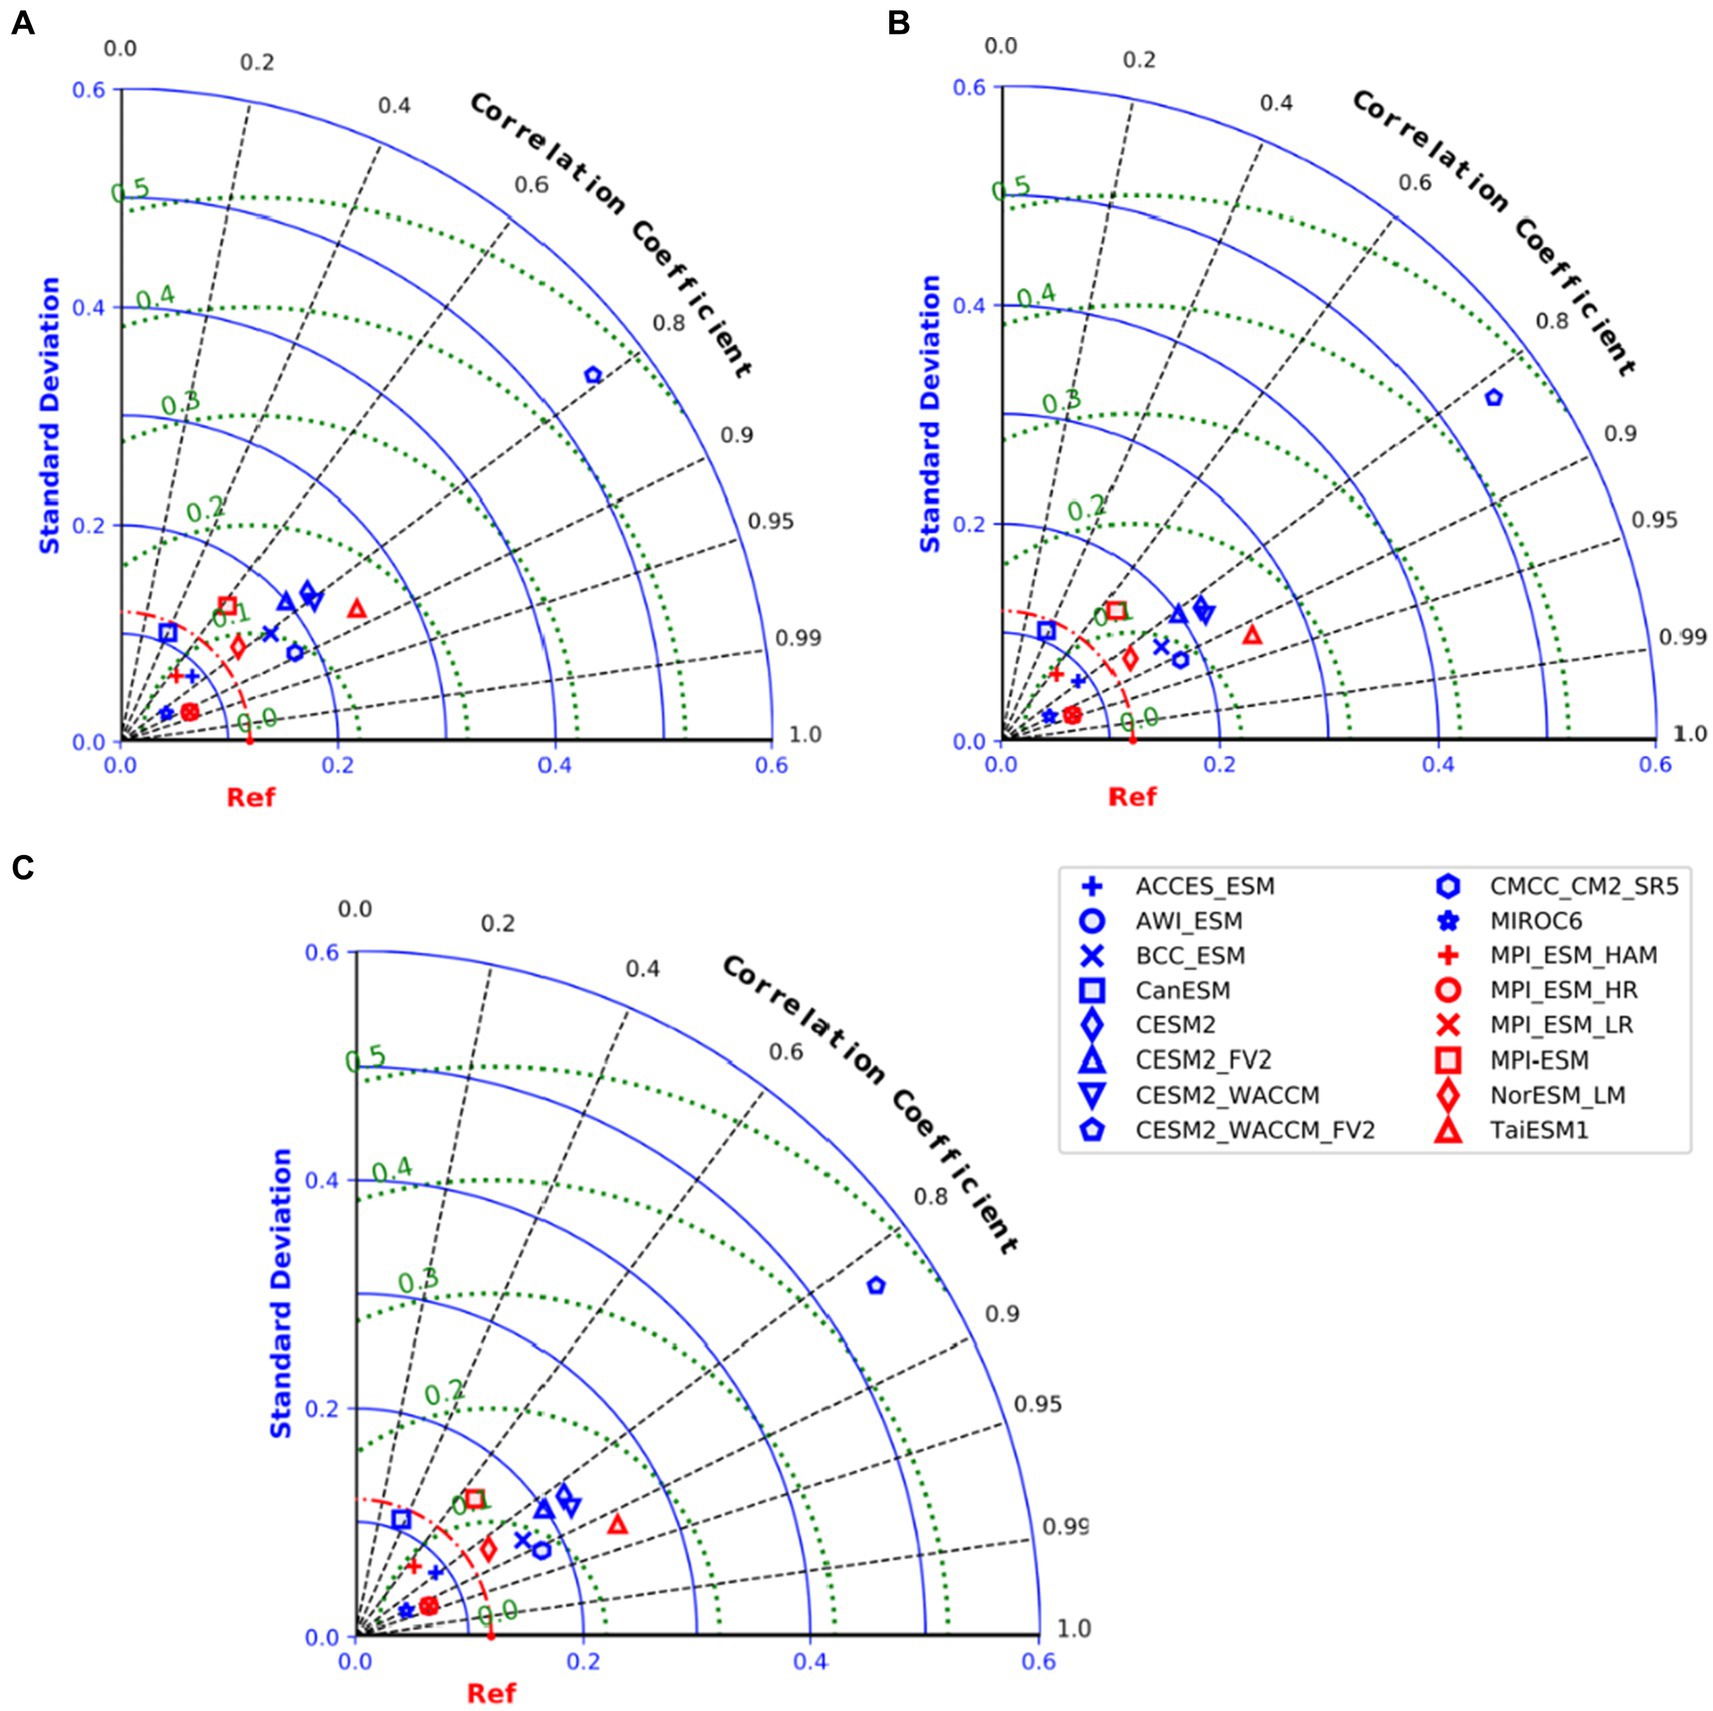
Figure 3. Taylor diagram of AOD for the CMIP6 models with (A) MODIS and (B) MISR satellite observations and (C) MERRA2 reanalysis products over the MENA region.
We also conducted a scatter analysis by comparing AOD from MME with AERONET measurements at two locations: Solar Village (2003–2013) and KAUST campus (2012–2014) within the study region. The results indicate that the MME effectively captures the monthly variations when compared to ground-based observations (Supplementary Figure S1).
In this sub-section, we study the spatial distribution of the climatological annual mean AOD (Figure 4) using the MME outputs, reanalysis, and satellite observations. Due to significant variations across seasons (Kumar et al., 2018), we analyze the AOD in both the summer (June–September) and winter (December–March) seasons in addition to the annual timescales. Figure 4 illustrates the spatial distributions of the climatological annual mean AOD estimated from satellite observations (Figure 4A for MODIS and Figure 4B for MISR), MERRA-2 (Figure 4C), and the CMIP6 MME (Figure 4D). Figures 4A–C are just the replicates of the same as those shown in Figure 1 and are reproduced here for the ease of comparison. The distribution and magnitude of the annual climatological AOD over North Africa and the AP are primarily influenced by the summer AOD values in these regions (Figures 4E–G). The spatial patterns of the annual mean AOD from the MME (Figure 4D) closely resemble the observed patterns. The MME successfully reproduces the maximum values of annual aerosol loading (~0.5–0.6). However, observations suggest less loading (<0.2) over parts of northern and central AP and Sudan (Figures 4A–C), indicating that models overestimate AOD in these regions.
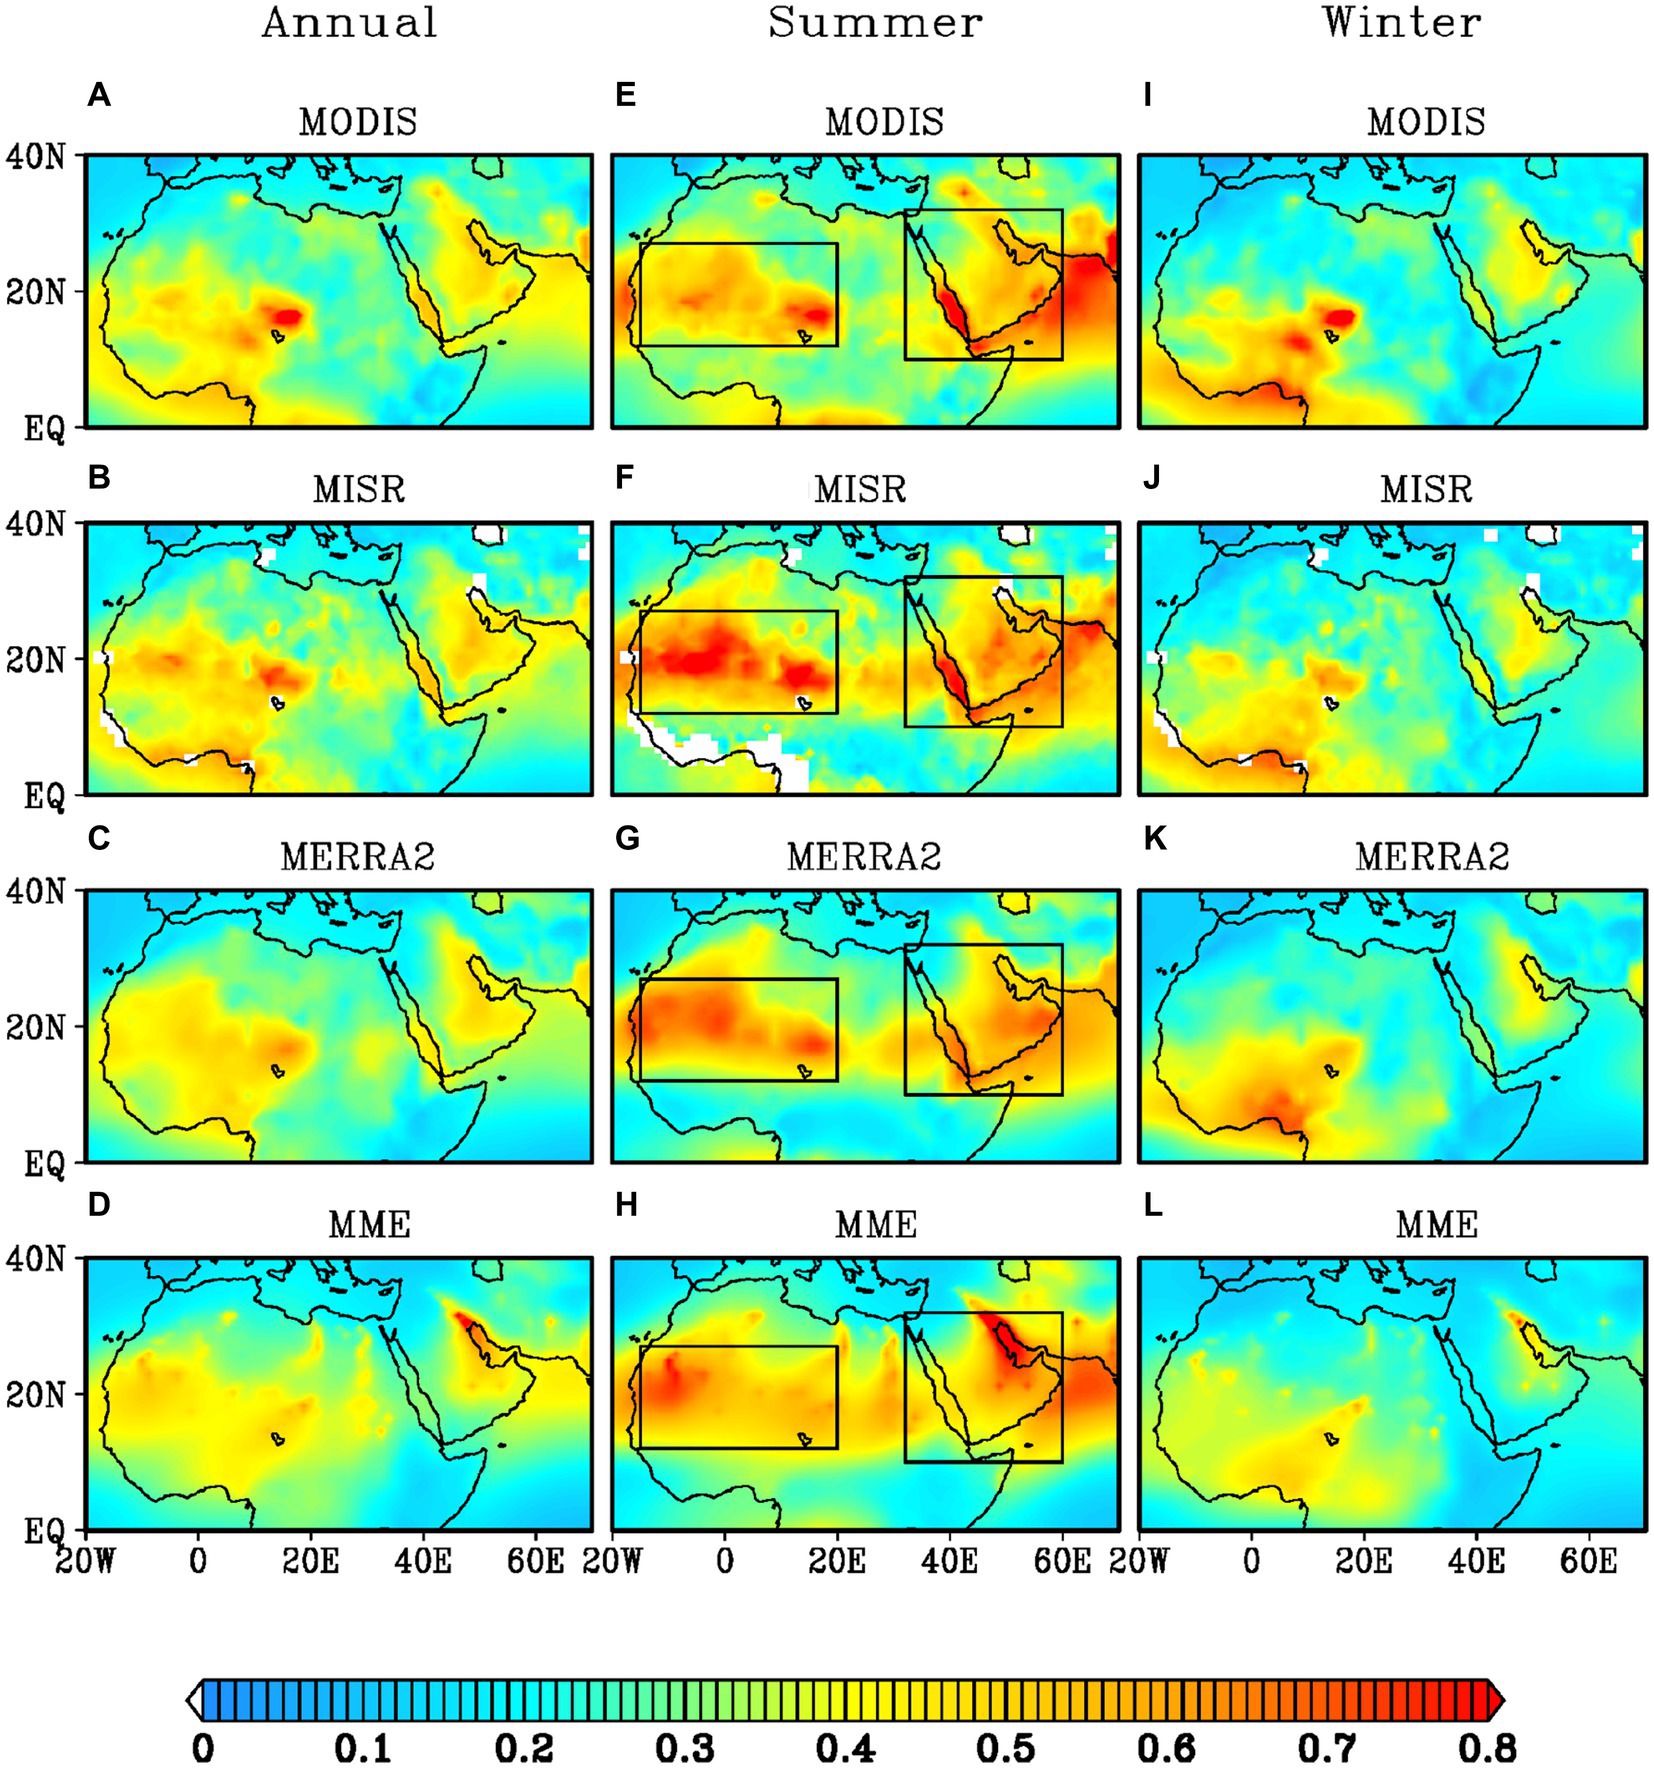
Figure 4. Spatial distribution of annual climatological mean (A–D), summer climatology (E–H) and winter climatology (I–L) obtained from MODIS and MISR satellite observations, MERRA2 reanalysis datasets and CMIP6 Multi Model Ensemble (MME) consisting of best models for the period 2003–2014. The boxes in the central panel represents the Arabian Peninsula (AP) and North West Africa (NWA) regions.
We also examine the spatial distribution of AOD during the summer (Figures 4E–H) and winter seasons (Figures 4I–L). The MME exhibits high AOD loading (0.7–0.8) over North Africa and the AP, in agreement with the observations. However, it fails to reproduce the high AOD over the Southern Red Sea (SRS), which is an AOD hotspot in the AP. The MME successfully captures high aerosol loading over the source regions of Saharan Africa during the summer season, which is generated by strong westerly winds prevailing over the Tokar Gap (Jin et al., 2016; Kumar et al., 2018; Ravi Kumar et al., 2019; Karumuri et al., 2021).
During the winter season, satellite observations (Figures 4I–J) depict a high AOD loading (~0.6) over the Saharan source regions, which is also captured by the MME (Figure 4L). The MME reproduces the high aerosol loading over North Africa, albeit slightly higher values. Over the AP, the MME suggests lower annual mean values (0.1–0.3) that are comparable to the observations, except for the northern AP where the satellite observations are slightly higher (~0.4). Overall, the results indicate that the MME effectively reproduces the mean spatial AOD patterns at annual and seasonal time scales, and these patterns are in good agreement with the observations and reanalysis.
The standard deviation (SD) of the AOD field from MME, MODIS, MISR, and MERRA-2 was also analyzed for the annual mean, summer, and winter seasons (Figure 5). On an annual timescale, a high AOD variability is observed over both Africa and the AP, with an SD of about 0.3, as discussed earlier. The MME adequately reproduces the AOD variability, with SD values ranging between 0.2 and 0.3 over the oceanic regions adjacent to the AP. However, it fails to capture the high variability over the Southern Red Sea (SRS). During the dry season (Figures 5E–H), a stronger variability is observed over the oceanic regions in the MME. While the MME appears to underestimate the observed high variability over some parts of Africa and the Red Sea, it reasonably reproduces the observed weaker variability (0.1–0.2) over most parts of the MENA region. The SD from the MME exhibits significant disparity over the Saharan Africa during the winter season (Figures 5I–L), where the simulated variability (0.15) is lower than those of MODIS, MISR, and MERRA-2 (0.35). Overall, the MME successfully captures the annual variability. However, it underestimates the seasonal variability in some areas of the MENA region, particularly over parts of Africa and the Red Sea.

Figure 5. Same as Figure 4, but for standard deviation.
Figure 6 displays the bias in the MME-derived mean AOD over the MENA region relative to MODIS, MISR, and MERRA-2 on annual as well as seasonal scales. On the annual scale, the MME simulations of the climatological AOD exhibit a positive bias over most parts of the African region and a negative bias over the southern and northern parts of the AP, including the SRS. On the seasonal scale, during the summer season, a positive bias persists over most parts of Africa and the AP; this is in contrast with the SRS, over which a clear negative bias is observed. During the winter season, a negative bias exists throughout the AP region, including the SRS. A positive bias is also seen over Africa, except for the western parts. The largest positive bias of 0.3 is observed in the summer season. The biases shown in Figure 6 are possibly due to potential biases in the simulated circulation patterns in CMIP6 models.
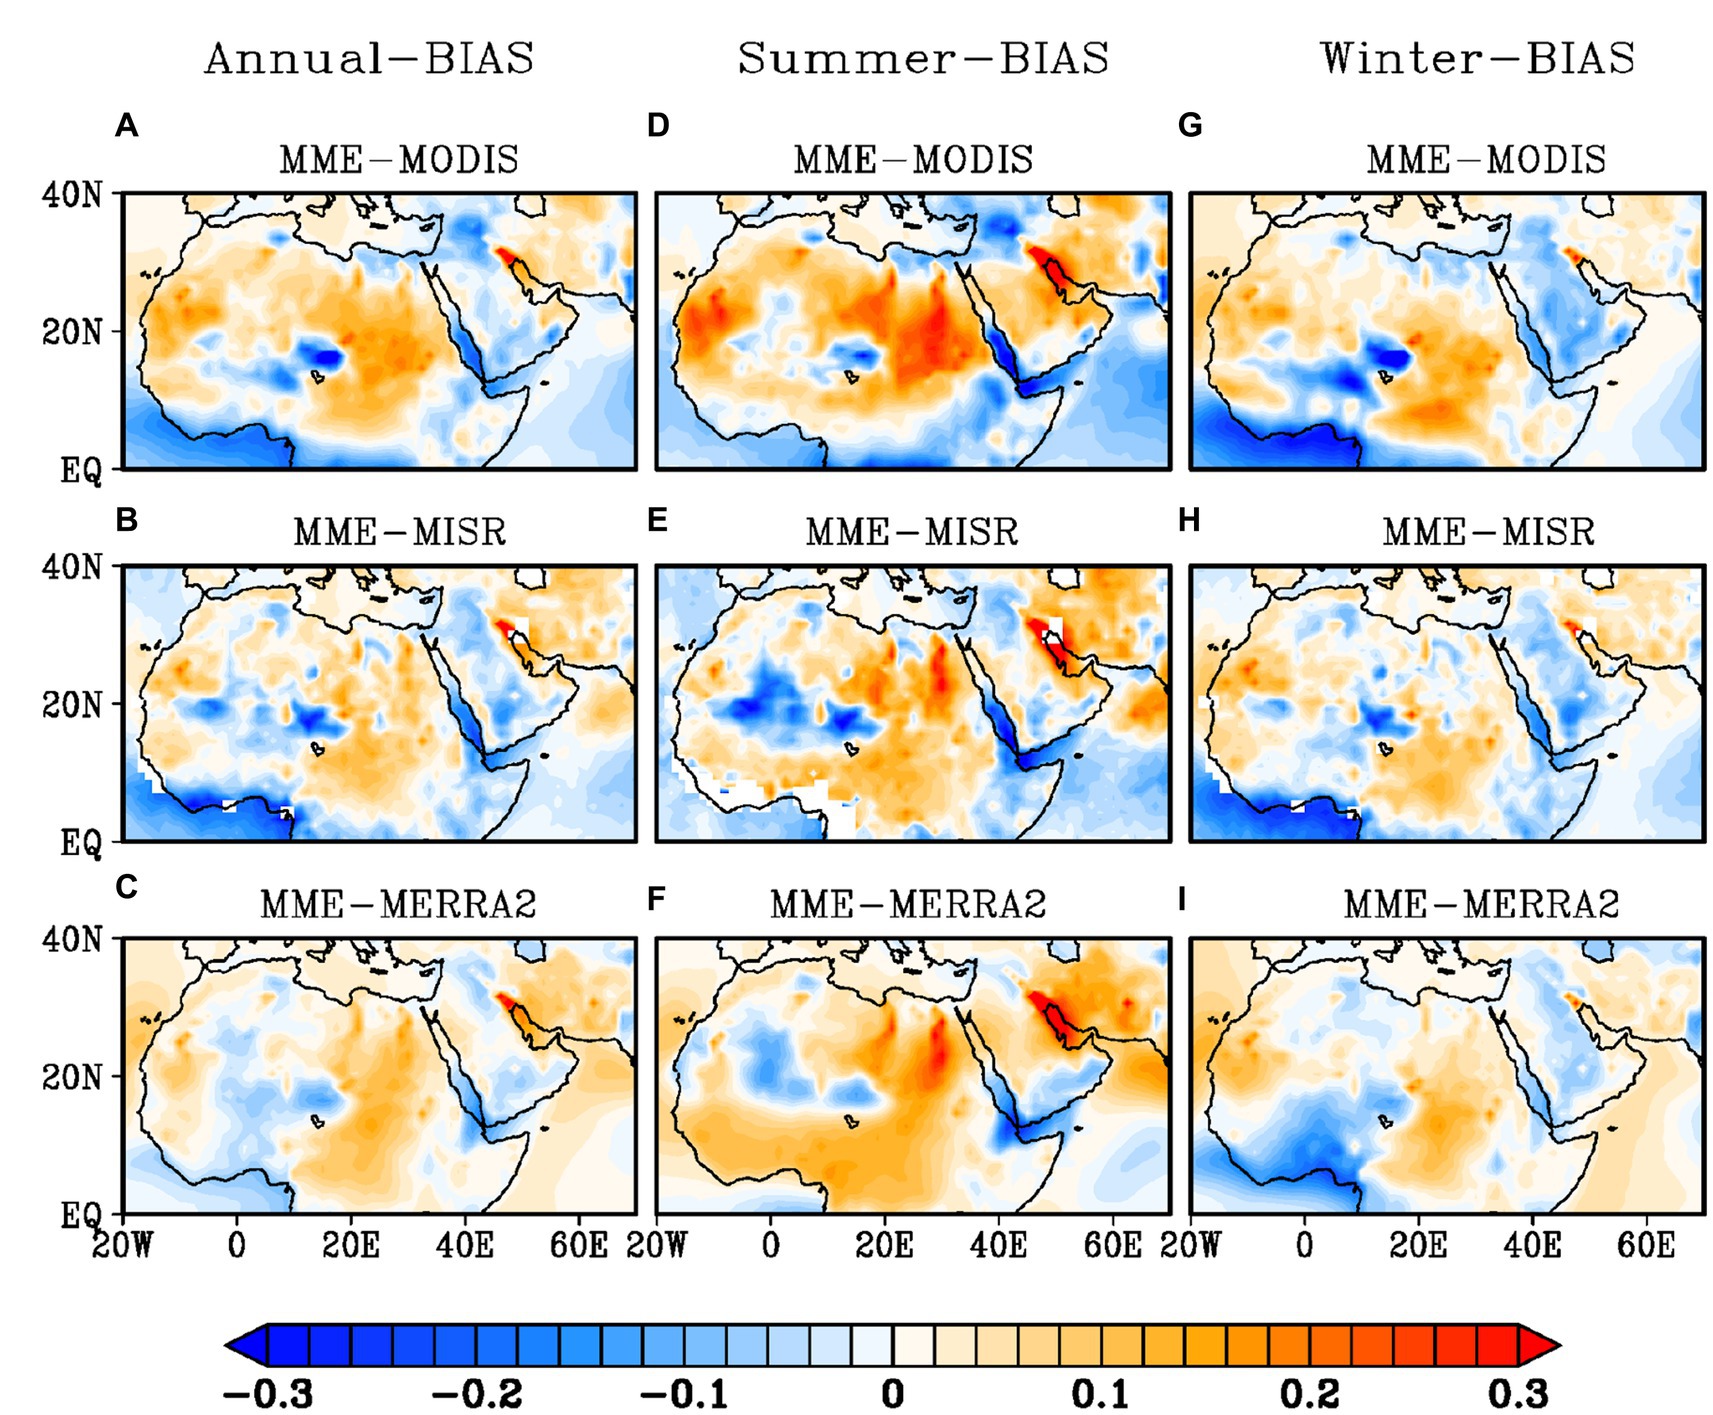
Figure 6. Spatial distribution of mean differences in CMIP6 MME against MODIS, MISR and MERRA2 for annual (A–C), summer (D–F) and winter (G–I) seasons, respectively.
The time series of the area-averaged monthly AOD from MODIS, MISR, MERRA-2 datasets, and the MME over the MENA, AP, and North West Africa (NWA) are further examined (Figure 7). We chose these regions for their significant aerosol loading and AOD variability, allowing us to assess the CMIP6 models’ ability to capture aerosol dynamics and evaluate their skill in simulating regional climate and air quality impacts. The evolution of the simulated AOD annual cycle over the MENA region is comparable to that of the observations (Figure 7A); however, the magnitude of simulated peak in July is slightly lower than those of the satellite observations (0.43) and reanalysis data (0.39). The corresponding monthly SD for July is as low as 0.03, whereas the SDs from the observed values are about 0.07 and 0.09 for MODIS and MISR, respectively (Figure 7). The MME suggests the minimum AOD of 0.18 for the MENA region in November, which is in good agreement with the observed value of 0.2. Although the MME can capture the annual cycle of the AOD over the MENA region, it exhibits some differences in the magnitude of the AOD peak. This indicates that the high aerosol loading over the study region is not well reproduced by the MME, though the minimum is well captured.
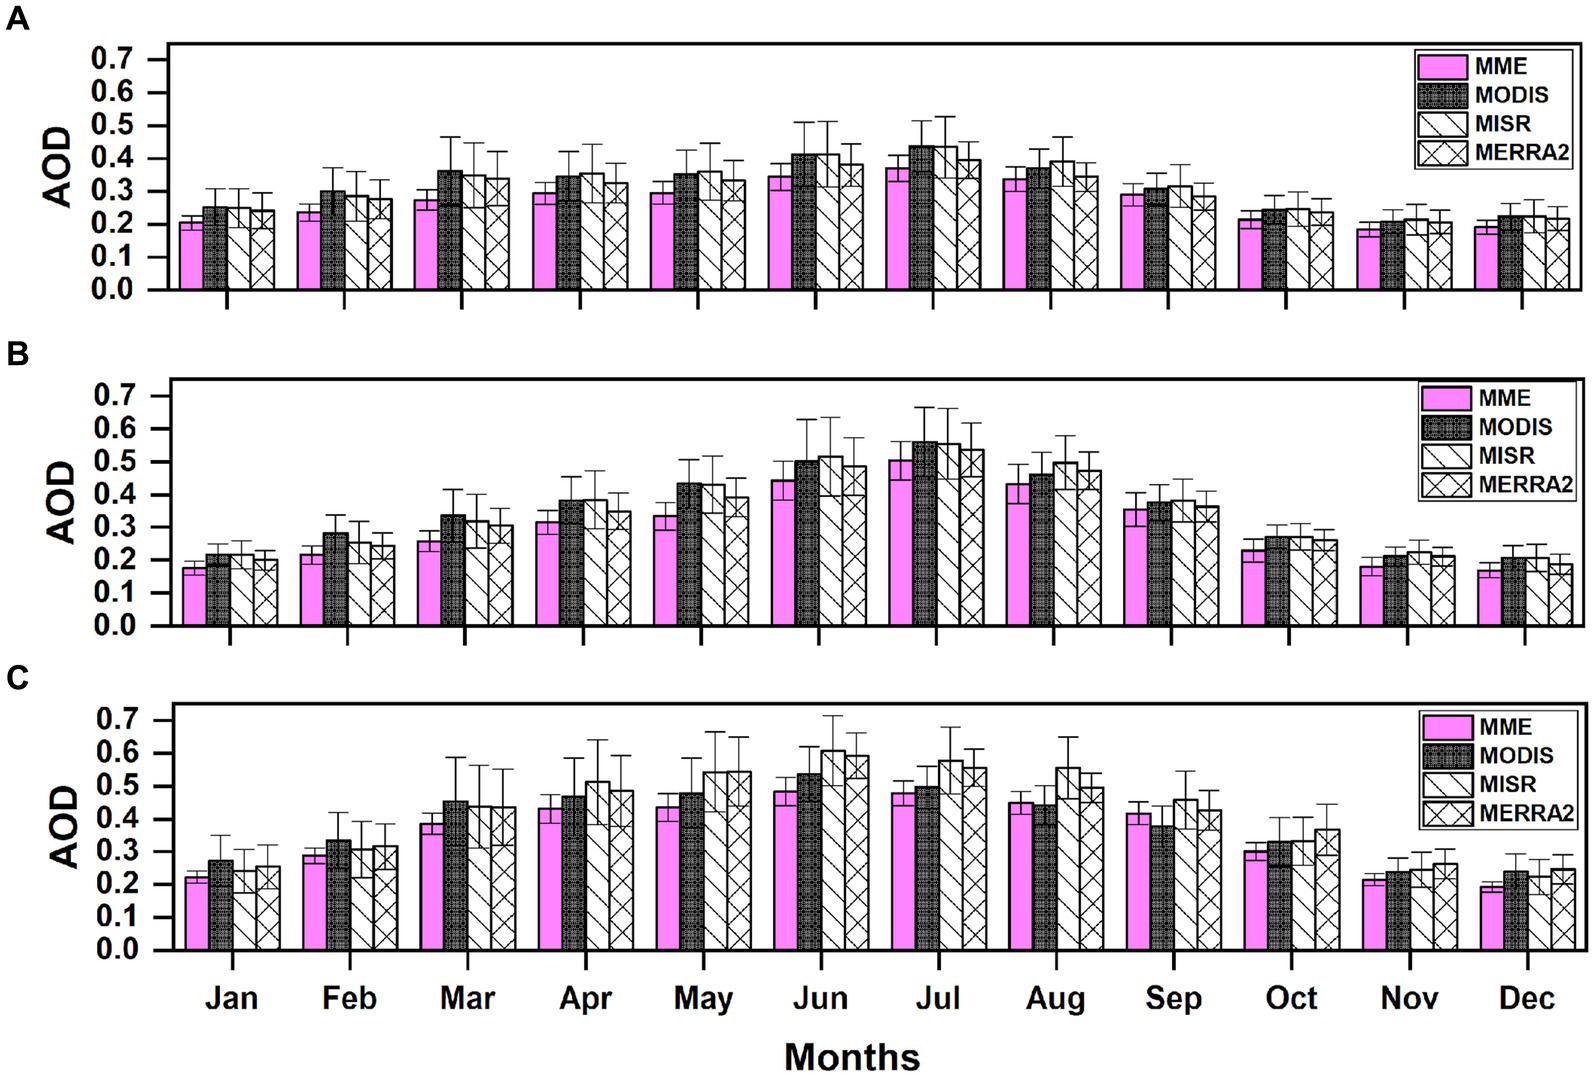
Figure 7. Climatological annul cycle with their standard deviations (error bars) of AOD from MODIS and MISR and MERRA2 reanalysis and CMIP6 MME datasets over (A) MENA, (B) AP, and (C) NWA regions.
The climatological annual cycle for the AP region, which is one of the prominent dust source regions, is also analyzed. In this region, the maximum and minimum monthly AODs occur during July and December, respectively (Kumar et al., 2018). The MME suggests an AOD peak of 0.50 for July, which is comparable to the observed value of 0.56 for both MODIS and MISR. The mean AOD from MERRA-2 for July (0.53) is closer to that of the MME. The AOD maximum in July is higher over the AP (shown with the box in Figure 4) than over the MENA region. The MME simulated SD of the monthly AOD during the peak month of July is about 0.05, while the SD obtained from both MODIS and MISR data is 0.10, and that from MERRA-2 is 0.08.
Over the AP, the simulated monthly climatological AOD minimum during December is 0.16, which is marginally lower than values of 0.2 obtained from MODIS and MISR, and 0.18 from MERRA-2. The AOD SDs during this month are low and vary between 0.02 and 0.04 for all the datasets. Furthermore, the annual cycle of the AOD (Figure 7C) simulated by the MME over the NWA (box shown as in Figure 4), which is another dust source region in MENA, is comparable to the annual AOD cycle from MODIS satellite observations. The simulations correctly capture the peak during the summer season; however, the values are slightly underestimated compared to the MISR observations. Overall, the AOD annual cycle over the MENA, AP, and NWA regions shows that the MME AOD maximum and minimum are in good agreement with the satellite observations and reanalysis products (CC > 0.8 at the 95% confidence level).
The above analysis clearly suggests that the strong seasonal variations in AOD over the MENA region, particularly the AP, are likely associated with dust activities. The variations are highest during summer and lowest during winter (Basart et al., 2009; Rashki et al., 2014). Recent studies have classified the Middle East as a hotspot of mineral dust and have reported a significant increase in AOD activity in recent decades (Klingmüller et al., 2016; Ravi Kumar et al., 2019; Gandham et al., 2020). A spatial trend analysis is presented here for the observed and simulated AODs over the period of 2003–2014 for the MENA region and its sub-regions. Figure 8 shows the spatial distribution of trends in monthly AOD at annual and seasonal scales from the observations, reanalysis, and MME datasets, with dots indicating statistically significant signals at the 95% confidence level.
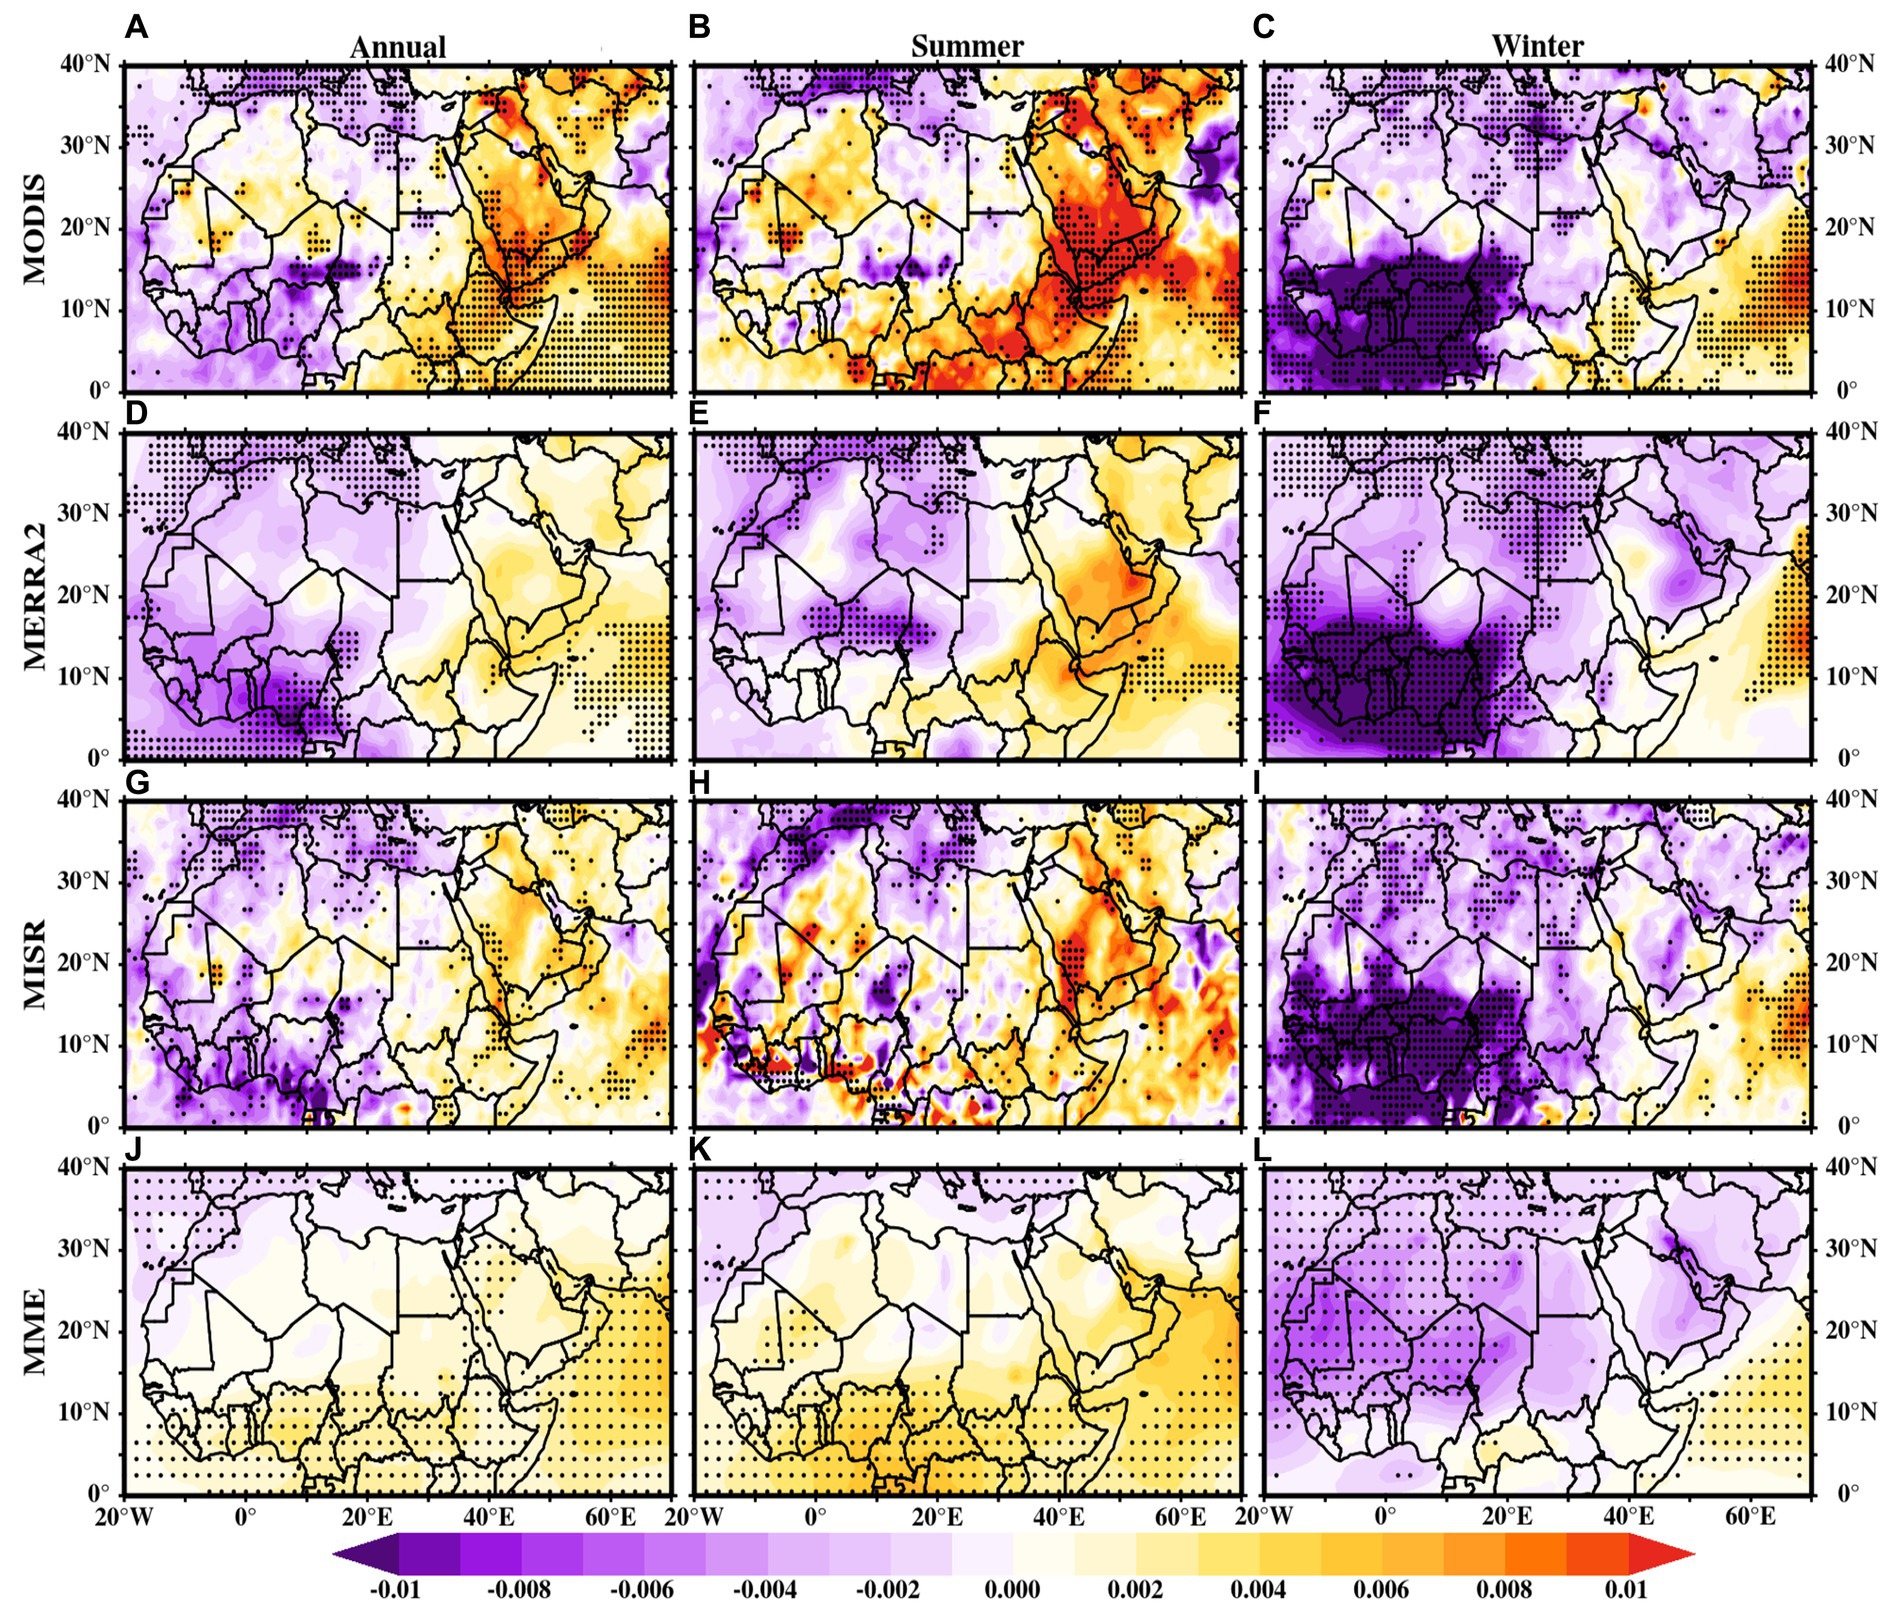
Figure 8. Spatial trends of AOD obtained from MODIS (A–C), MISR (D–F), MERRA2 (G–I) reanalysis and CMIP6 MME (J–L), datasets during annual, summer and winter seasons for the period from 2003 to 2014. The black dots represent the statistical significance at 95% confidence level.
At the annual scale, a significant positive trend exceeding 0.005 yr.−1 is observed over the AP (Figures 8A,D,G) in all datasets. The satellite observations and reanalysis suggest significant negative AOD trends of −0.006 yr.−1 over most of North Africa, Southern Algeria, north Mali, and north Niger, where the AOD shows significant positive trends. The AOD simulates weaker positive trends than those observed over the MENA region, but capture the strong positive trends over the AP are well captured. The MME also indicates significant positive trends over the western Sahel, in contrast to the observations (Figure 8J). During the summer season, the spatial patterns of AOD trends (Figures 8B,E,H,K) replicate the annual AOD trend patterns over the MENA region across all datasets. The strong positive trend of >0.01 yr.−1 observed over the AP is well captured by the MME, albeit slightly underestimated. It is also important to mention that the MME does not capture the observed local-scale negative AOD trends over the North African region.
Most parts of the MENA region show negative AOD trends during the winter season, which are well captured by the MME. During winter, strong and significant negative trends are noticeable over the North African region. The rising trends in AOD over the MENA region are primarily driven by the summer AOD trends. Kumar et al. (2018), Ravi Kumar et al. (2019) reported that low-level northerly winds (Shamal winds) over the northern AP region trigger dust saltation activity over the AP. The recent intensification of westerly winds (Davis et al., 2015) in the western AP apparently drives the observed positive AOD trends in the AP region (Figure 8, central panel). Meanwhile, the negative trends over North Africa in winter (Figure 8, right panel) are mainly attributed to variability in large-scale circulation patterns (Ridley et al., 2014; Mehta et al., 2016) and greening (more precipitation) of the Sahel region (Olsson et al., 2005; Cowie et al., 2013; Ridley et al., 2014). Overall, the selected CMIP6 models in this study successfully simulate the observed AOD trends over the AP on both annual and seasonal scales, despite underestimating the trend over a few regions. These models fail to simulate observed AOD trends over some parts of the North African regions.
Klingmüller et al. (2016) suggested several dominant drivers of AOD trends, and the quality of simulating these drivers is likely to determine the performance of the CMIP6 models (e.g., Zhao et al., 2021). To investigate the factors behind the reduced AOD trends, we further examined the simulated trends in other relevant meteorological factors, such as soil temperature, soil moisture, surface winds, relative humidity, and precipitation, which can potentially influence the local AOD (Figure 9).
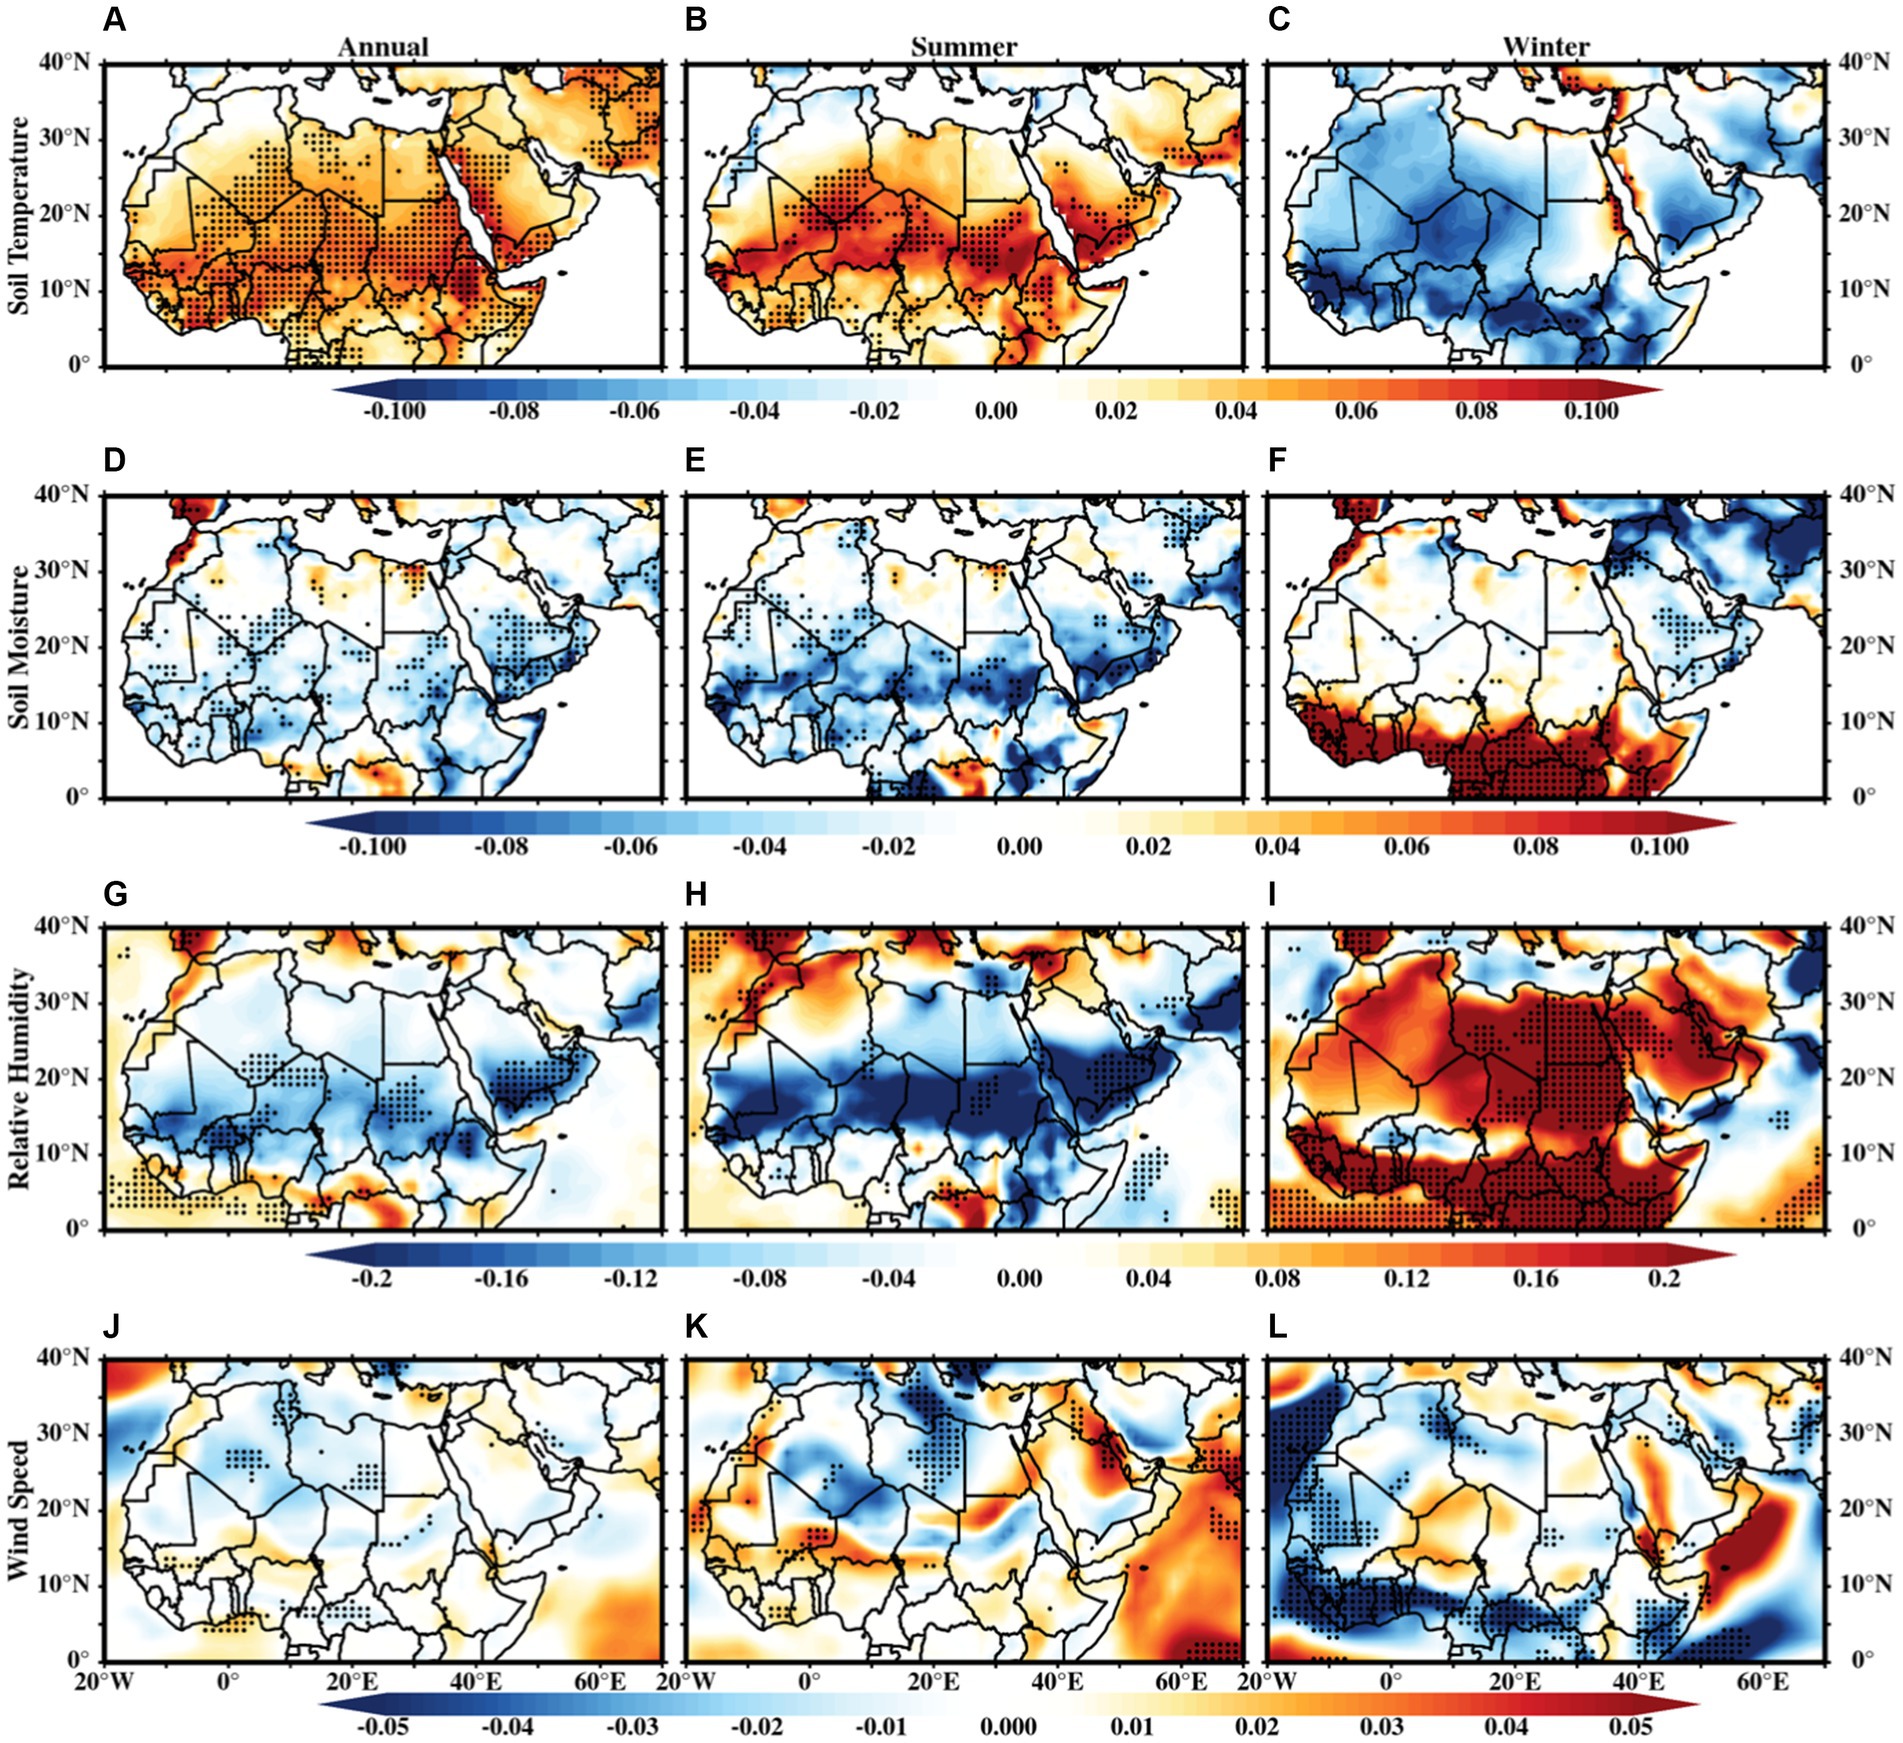
Figure 9. Spatial trends (year−1) of soil temperature (deg K) (A-C), soil moisture (kg m−2) (D-F), relative humidity (%) (G-I) and surface winds (ms−1) (J-L) from CMIP6 MME over the MENA region during annual, summer and winter seasons respectively. The black dots represent the statistical significance at 95% confidence level.
In the CMIP6 MME, soil temperatures exhibit a warming trend exceeding 0.07 K yr.−1 during summer (Figure 9B) as well as on an annual scale (Figure 9A). Conversely, in winter, they exhibit a cooling trend of 0.09 K yr.−1 (Figure 9C). Regarding soil moisture, significant drying trends (>0.06 kg m−2 yr.−1) are observed in summers and on annual scales, while strong soil wetting trends (0.1 kg m−2 yr.−1) are noticeable in the Sahel region. Generally, positive soil temperature trends and negative soil moisture trends favor rising AOD trends, while negative soil temperature trends and positive soil moisture trends mostly influence decreasing AOD trends (Klingmüller et al., 2016).
The CMIP6 MME also indicates negative and positive relative humidity trends for both the summer and winter seasons, respectively and the annual mean over the MENA region. For summer (winter) and annual scales, rising (decreasing) soil temperatures and decreasing (increasing) soil moisture and relative humidity apparently promote evaporation and soil drying. These conditions could favor an increase (decrease) in AOD emissions. Additionally, the reduction (enhancement) in AOD in the CMIP6 MME can be attributed to the weakening (strengthening) of surface winds over the regions of dust sources. The higher AOD in the NWA may also be potentially related to the decreasing rainfall trends reflected in the relative humidity. A further detailed investigation is needed to understand the impact of decreasing rainfall on wet scavenging in the CMIP6 MME.
We finally investigate the projected future evolution of AOD over three regions: MENA, AP, and NWA by analyzing the regionally averaged AOD from four selected SSP scenarios (SSP126, SSP245, SSP370, and SSP585) from CMIP6 MME (Figure 10). Since the interpretations of future projections of MME AOD may be influenced by outlier values, we conduct an analysis of projected area-averaged annual AODs (AAOD), the individual selected models as well the analysis is conducted across different time periods, including the historical period (1995–2014) and three future time slices: near-future (2,021–2,040), mid-future (2,040–2,060), and far-future (2,080–2,100).
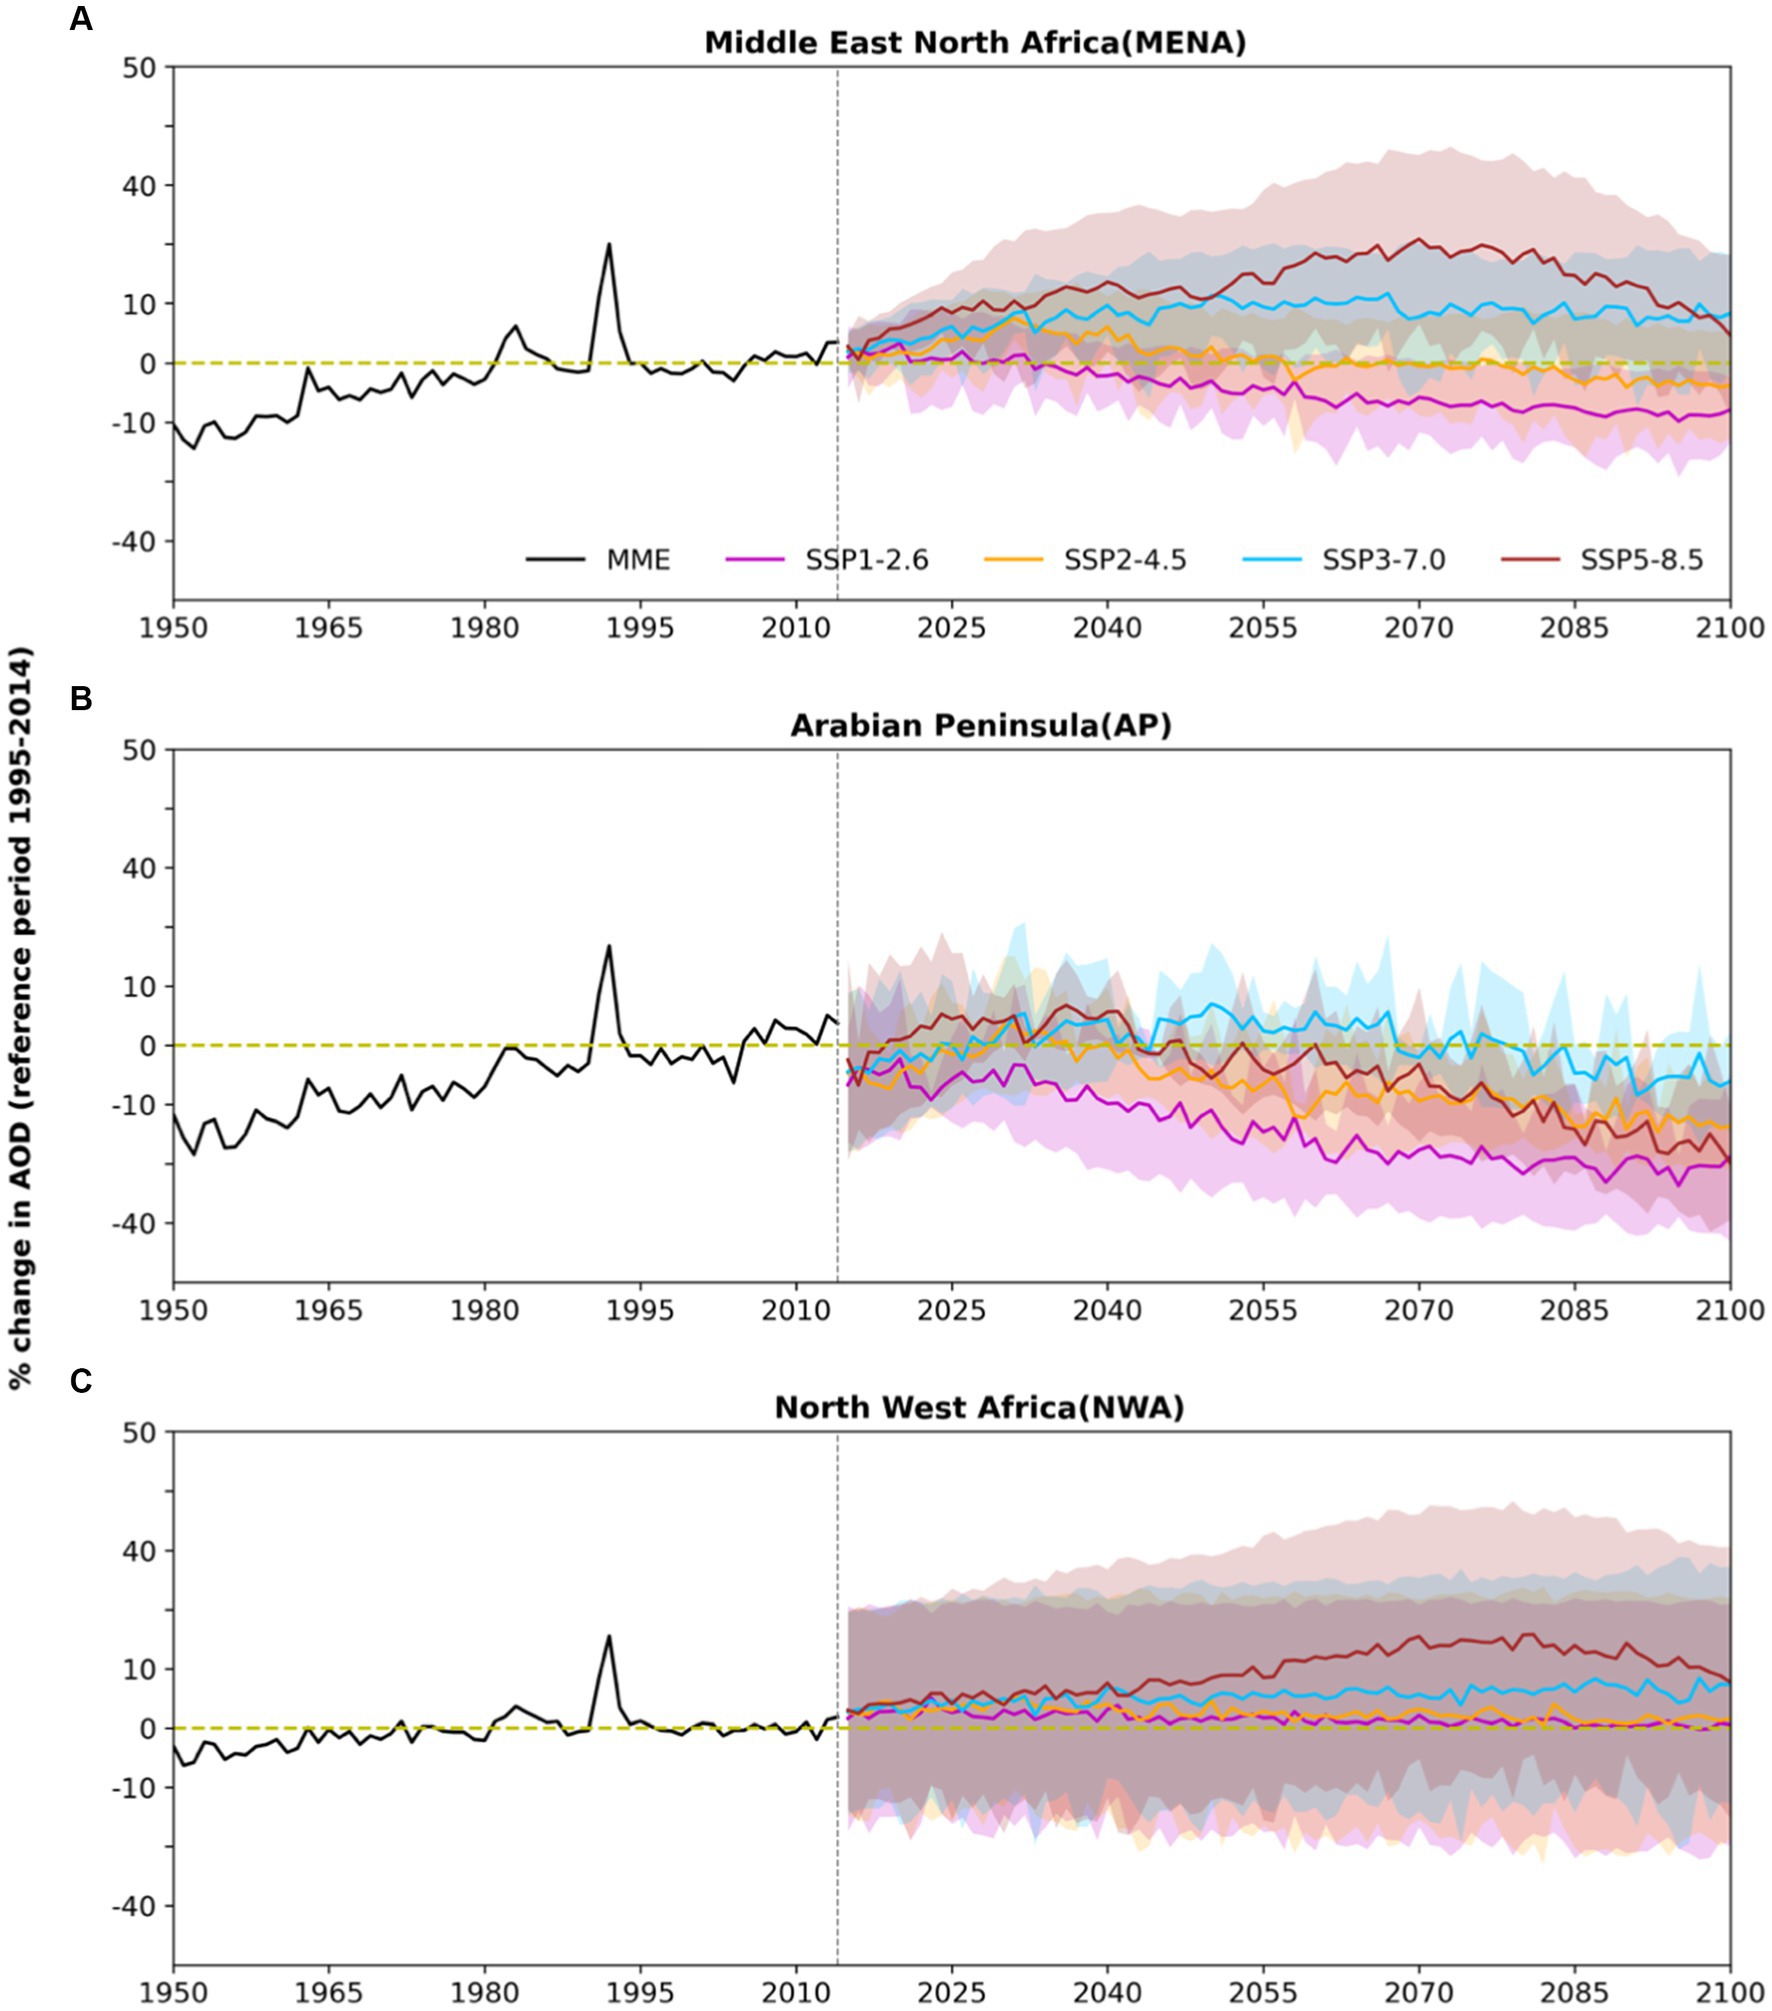
Figure 10. Time series of annual future projections of AOD changes with respect to the (1995–2014) period for all three regions namely (A) MENA, (B) AP, and (C) NWA regions.
Over the MENA region (Figure 10A), the projected evolution of AAOD suggests its increasing tendency over time under the two high emission scenarios SSP370 and SSP585 (Supplementary Figure S2) compared to the historical period (1995–2014). However, it remains relatively constant throughout the study period in SSP245. In contrast, a decrease is projected under the SSP126 scenario (Figure 10A; Supplementary Figure S2). To quantify these projected changes in time, the projected AODs are averaged over each of the three time slices, separately and are shown in Supplementary Figure S2. In the near-future, an estimated increase of 5% for SSP245, 7% for SSP370, and 8% for SSP585 in AAOD is projected to relate to the historical period (Supplementary Figure S2A). Moving to the mid and far-future (Supplementary Figure S2A), AAODs over the MENA are projected to increase by approximately 9% under high emission scenarios, while a noticeable decrement of 5–9% is expected under the lower emission scenario (SSP126).
The AAOD over the AP region is projected to decrease, relative to the historic values, by 7–10% across all future climate change scenarios until the end of the 21st century (Figure 10B). However, the rate of decrease is relatively weak in the SSP370 scenario (Supplementary Figure S2B). The AAOD over the AP region exhibits distinct patterns among the different SSP scenarios (Figures not shown), with a significant decrease of about 8% in projected AOD for the far-future under SSP585. In the case of the NWA (Figure 10C), the AAOD is projected to remain constant throughout the future under the SSP126 and SSP245 scenarios. However, it is indicated to increase, respectively, at a moderate and fast rate under the SSP370 and SSP585 scenarios. The AAOD over NWA is projected to increase by 9% by the end of the century under SSP585 (Supplementary Figure S2C).
We now look for any outliers that may have biased the MME projections. The box-whisker plots presented in Figures 11A–C display the area-averaged AOD from the MME of selected models for each time slice period (historical, near-future, mid-future, and far-future) over the three regions of interest. Unless mentioned otherwise, the upper and lower limits of each box (Figure 11) represent the 75th and 25th percentile values, respectively, while the horizontal line (solid dot) in each box shows the median (mean) of the distributions. Upper and lower whiskers indicate the 90th and 10th percentile values, respectively. Figures 11A–C do not indicate any substantial differences in the mean and median values of the AAODs over the very broad three regions, suggesting that the models exhibit similar AAOD evolutions to the scenario forcings. These results also provide a concise overview of the evolution of median AOD values from the historical to far-future periods, supporting the broad conclusions regarding the projected changes in AOD discussed in the preceding subsection.
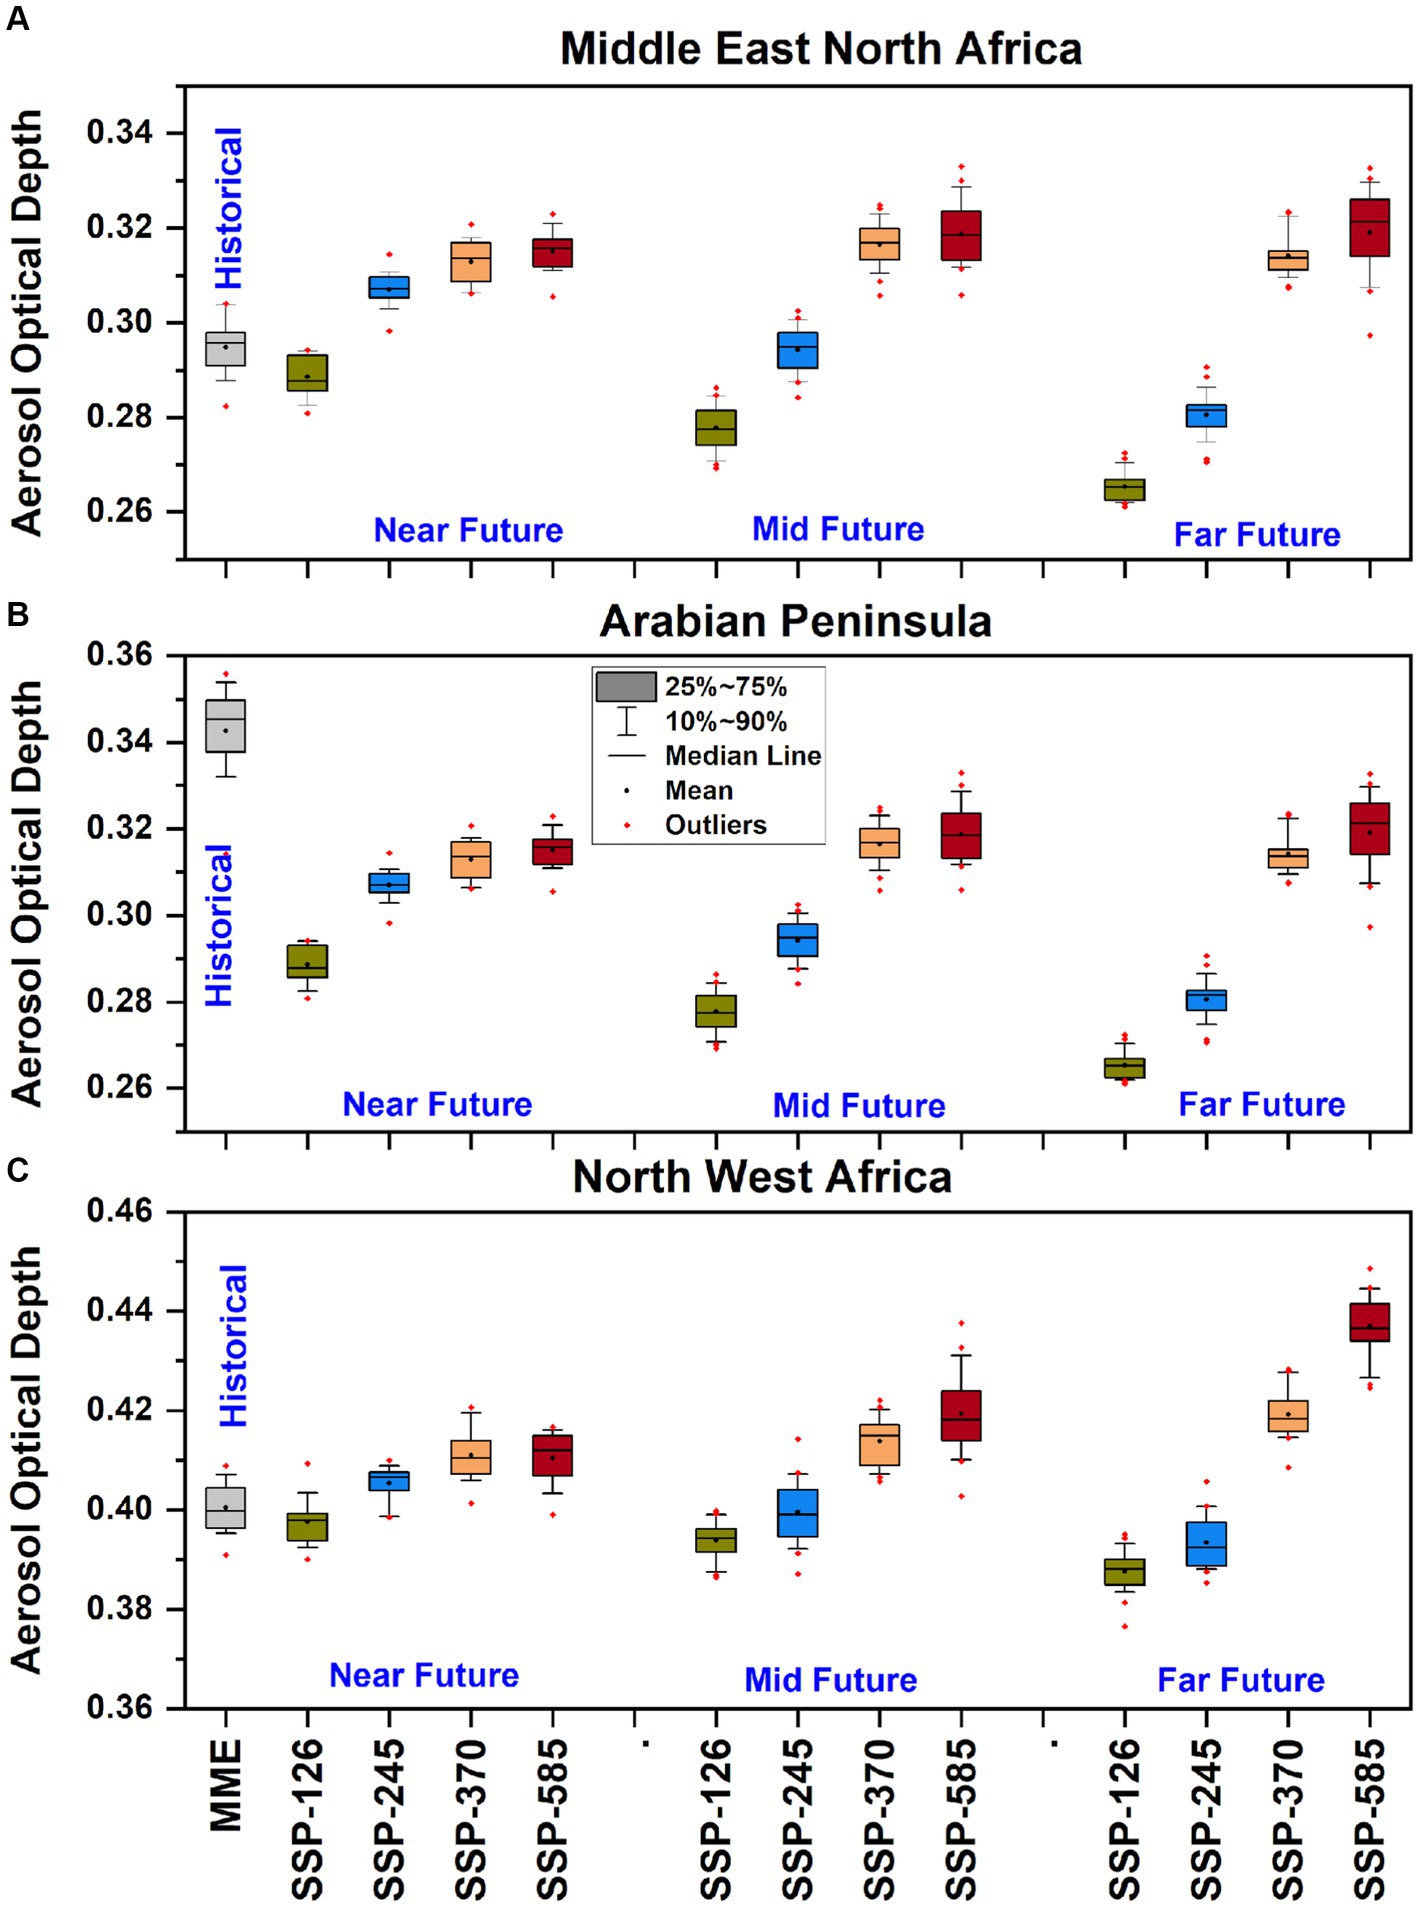
Figure 11. Box-and-whisker plots for the historical and projected AODs over (A) MENA, (B) AP, and (C) NWA regions for near (2,021–2,040), mid (2,061–2,080) and far future (2,081–2,100) time periods under four SSP scenarios. The dots in red color are indicates the extreme AOD years (more than 90 percentile thresholds).
Increasing mean and median AOD values with time is noticeable over the MENA region under the SSP370 and SSP585 scenarios relative to the historical period (Figure 11A). The extreme AOD values also increase in time, as can be discerned by the higher values of the 90th percentile annual AOD, which we deem as the upper threshold for extremes in each of the different future periods. In particular, even the lowest threshold (10 percentile) of the AAOD distribution under the SSP370 and SSP585 scenarios during the future across the MENA region is projected to be higher than the upper threshold for the corresponding historical period. Thus, nearly all the far-future and mid-future periods can be categorized as AAOD extreme periods over the MENA region under these scenarios (also see Supplementary Figure S3). It is worth noting that the extreme AAOD intensity over MENA in the far-future is anticipated to be slightly weaker compared to the mid-future under the SSP370 scenario (Figure 11A; Supplementary Figure S3).
In contrast to the SSP585 scenario, the projected magnitude of extreme AAOD values over the MENA region weakens progressively in the future relative to the historical period under the lower emission scenarios of SSP126 and SSP245 (Figure 11A). The projected future evolution of the extreme annual AOD over NWA under various scenarios (Figure 11B) is qualitatively similar to that over the MENA region, though the rate of the relative increase in the extreme AOD under the SSP585 is higher in this region compared to the MENA region.
However, in contrast to the projections for the NWA and MENA regions, the projected evolution of AOD over the AP under high emission scenarios indicates a decline in the extreme AOD threshold in the future (as shown in Figure 11C). This decline aligns with a similar decrease in the projected mean (as seen in Figure 10) and median AOD values. The declining trend is also projected for the lower emission scenarios. To further explore the projected changes in AOD and its relationship with precipitation, we calculated the percentage changes in future projected AOD and precipitation over the AP. Figure 12 shows a decreasing trend in AOD alongside an increasing trend in precipitation in future scenarios. This projected increase in precipitation over the AP was also noted by Almazroui (2020). Importantly, the SSP585 scenario shows the highest projected area-averaged future precipitation across all scenarios. The projected future precipitation in SSP585 is strongly correlated with concurrent decreases in AOD over the AP, with a correlation coefficient of 0.77. This strong and statistically significant correlation suggests that the projected high rainfall in the future over the AP is likely associated with a weakened AOD through the washout mechanism. However, a further comprehensive investigation is required to ascertain this potential association of the projected decrease in the AOD with that in the rainfall, as changes in AOD can also be influenced by other factors such as transport mechanisms, soil moisture, and seasonality.
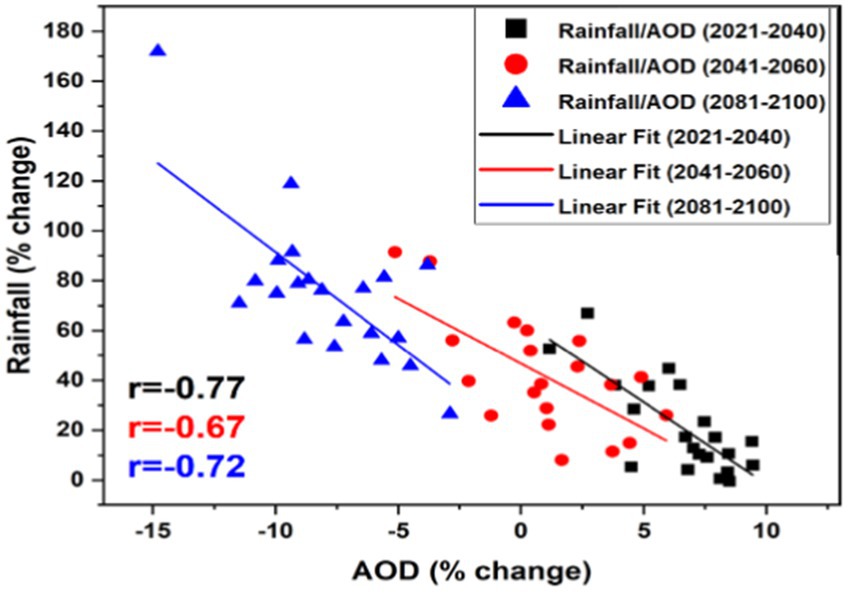
Figure 12. Changes in rainfall and AOD in different future scenarios for the Arabian Peninsula region.
This study evaluated the AOD over the Middle East and North Africa (MENA) region as simulated by 16 CMIP6 models. AOD observations from the MODIS and MISR available between the period 2003 and 2014, as well as the corresponding reanalysis data sets from the MERRA-2, were used in validating the model outputs. The simulated climatology and variability of the AOD and its trends over the MENA region were compared against the observations and reanalysis. The five best models chosen through a Taylor diagram analysis of both simulated and observed AOD demonstrate their ability to quantitatively replicate the mean and variations of the area-averaged observed AOD over these broad regions. Furthermore, using the outputs from the best 5 models, a Multi-Model Ensemble (MME) analysis of various simulated AOD statistics was carried out.
The main findings of this study can be summarized as follows:
1. Observations as well as models show the maximum annual mean AOD in the MENA region occurring over a broad region with MENA, which encompass the AP and North Africa. Most of the mean AOD values simulated by various CMIP6 models vary between 0.2 and 0.8 across the MENA region, which is comparable to the range of 0.2–0.6 from MODIS and MISR observations. On the annual scale, the area-averaged AOD over the MENA region is 0.35 from the satellite observations, while the corresponding value across all the CMIP6 models varies between 0.15 and 0.5. For North Africa, some of these models show substantially higher AOD values, about 1.2–1.5 times the corresponding satellite observations and reanalysis.
2. The aerosol loading regions, especially over the AP, are relatively better captured by some of the CMIP6 models. The mean spatial distributions of the AOD as predicted by MERRA-2 over North Africa and the AP region are in good agreement with the MODIS and MISR observations. Individual CMIP6 models show significant discrepancies in simulating the AOD distributions over the source regions in the MENA. However, the MME average of the simulated AOD reproduces the spatial distribution of the AOD on the annual scale and for the summer and winter seasons reasonably well. In general, the MME also reproduces the AOD variability over the MENA region despite some discrepancies from the observation.
3. The annual cycle of the satellite observations of AOD over the MENA region shows the maximum AOD during the summer season. Although the MME AOD also reproduces this climatological annual cycle, the simulated magnitudes are slightly weaker than the satellite observations.
4. A linear trend analysis of the AOD datasets from the 2003 to 2014 period was conducted. Given the short duration of the data, the identified trends may not so much reflect long-term and decadal variations. However, they help in identifying the slow changes and in evaluating the models’ ability to reproduce observed AOD changes. The analysis reveals that annual AOD values are increasing over the AP and decreasing over North Africa. While the MME successfully reproduces the positive trends over the AP, the simulated trend in annual AOD values over the NWA is relatively weak and exhibits an opposite sign compared to the observations in some regions.
5. The MME (based on historical simulations) reasonably reproduces the summer AOD trends over the AP region, but not over North Africa. The MME suggests significant negative trends in AOD over the AP and North Africa during the winter season, which is consistent with the observed spatial trends. The negative trends over North Africa in winter are possibly due to weakened surface winds and increased rainfall over the dust sources, in agreement with previous studies.
6. The projected AOD in the MENA and NWA regions consistently increase over the 21st century under high emission scenarios (SSP370 and SSP585). However, lower emission scenarios suggest a decrease in AOD starting from the 2040s. In contrast, the projected AOD trends over the AP across all scenarios decreases continuously in the future. Notably, a substantial decrease of approximately 8% in AOD is projected for the distant future under the SSP585 scenario.
7. Our results show that the NWA region is projected to experience more extreme (exceeding the 90th percentile threshold) AOD years in the future under the SSP585 scenario. On the other hand, the projected AOD over the AP region suggests a significant decline in the mean AOD as well as in the magnitudes of the extreme AOD thresholds in the future. This decline in projected AOD over the AP region is likely due to a concurrent increase in annual precipitation. Further investigation is needed to confirm this hypothesis, as projected long-term changes in other factors such as transport mechanisms, soil moisture, and seasonality also influence these future changes in AOD. Similar declines in the projected AOD over the AP are also indicated in lower emission scenarios.
Overall, the findings highlight the reliability of the MME of CMIP6 models in accurately simulating AOD climatology and seasonality across the MENA region. However, certain discrepancies persist in CMIP6 simulated AOD over specific areas within NWA. Furthermore, the results from this study underscore a notable shortcoming in CMIP6 models—their inability to accurately simulate recently observed aerosol trends, both in terms of magnitudes and regional distributions over the NWA and adjoining regions. These disparities could be attributed to various simulated meteorological biases (including land surface physics) and the representation of dust emission inventories in the CMIP6 models. Despite these limitations, these datasets prove input for comprehending aerosol-climate interactions over the broad domain. It is worth noting that some of the limitations of CMIP6 simulations identified in this study, such as the failure to capture observed annual and summer AOD trends (particularly over NWA), underscore the need for further improvement in the model resolution, physics, and updating the anthropogenic aerosol emission inventories, especially in the context of regional studies, and in improving the fidelity of the simulations at the local level and thereby increasing the reliability of the future climate projections locally. Given the potential role of rainfall over AP in the future evolution of AOD, it is worth downscaling the coarser GCM projections with a high resolution (~5–15 km) regional model with explicit convection in order to capture the role of critical moisture transport from the narrow marginal seas. For example, high-resolution chemistry-enabled regional models, such as WRF-Chem, may be useful in addressing these challenges.
The original contributions presented in the study are included in the article/Supplementary material, further inquiries can be directed to the corresponding author.
RKu: Conceptualization, Data curation, Formal analysis, Methodology, Supervision, Writing – original draft, Writing – review & editing. RA: Conceptualization, Investigation, Supervision, Writing – original draft, Writing – review & editing. RKa: Conceptualization, Data curation, Formal analysis, Investigation, Methodology, Software, Validation, Visualization, Writing – original draft, Writing – review & editing. VS: Data curation, Formal analysis, Software, Validation, Writing – review & editing. BS: Formal analysis, Investigation, Writing – review & editing. KA: Supervision, Writing – review & editing, Formal analysis, Validation. IH: Supervision, Writing – review & editing, Funding acquisition.
The author(s) declare that financial support was received for the research, authorship, and/or publication of this article. This research was supported by the Office of Sponsored Research (OSR) at King Abdullah University of Science and Technology (KAUST) under the Virtual Red Sea Initiative (Grant # REP/1/3268-01-01) and the Climate Change Centre (Grant# RCG/03/4829-01-01).
We thank the reviewers and editor for their constructive comments and suggestions helped to improve the manuscript. This research is contribution number 5649 from NOAA’s Pacific Marine Environmental Laboratory and contribution number EcoFOCI-1059 to NOAA’s Ecosystems and Fisheries Oceanography Coordinated Investigations.
The authors declare that the research was conducted in the absence of any commercial or financial relationships that could be construed as a potential conflict of interest.
All claims expressed in this article are solely those of the authors and do not necessarily represent those of their affiliated organizations, or those of the publisher, the editors and the reviewers. Any product that may be evaluated in this article, or claim that may be made by its manufacturer, is not guaranteed or endorsed by the publisher.
The Supplementary material for this article can be found online at: https://www.frontiersin.org/articles/10.3389/fclim.2024.1384202/full#supplementary-material
Ackerley, D., Booth, B. B. B., Knight, S. H. E., Highwood, E. J., Frame, D. J., Allen, M. R., et al. (2011). Sensitivity of twentieth-century Sahel rainfall to sulfate aerosol and CO2 forcing. J. Clim. 24, 4999–5014. doi: 10.1175/JCLI-D-11-00019.1
Alharbi, B. H., Maghrabi, A., and Tapper, N. (2013). The march 2009 dust event in Saudi Arabia: precursor and supportive environment. Bull. Am. Meteorol. Soc. 94, 515–528. doi: 10.1175/BAMS-D-11-00118.1
Almazroui, M. (2020). Assessment of meteorological droughts over Saudi Arabia using surface rainfall observations during the period 1978–2017. Arab. J. Geosci. 12, 1–16. doi: 10.1007/s12517-019-4866-2
Attada, R., Dasari, H. P., Kunchala, R. K., Langodan, S., Kumar, K. N., Knio, O., et al. (2020). Evaluating cumulus parameterization schemes for the simulation of Arabian peninsula winter rainfall. J. Hydrometeorol. 21, 1089–1114. doi: 10.1175/JHM-D-19-0114.1
Attada, R., Kunchala, R. K., Dasari, H. P., Sivareddy, S., Yesubabu, V., Knio, O., et al. (2021). Representation of Arabian peninsula summer climate in a regional atmospheric model using spectral nudging. Theor. Appl. Climatol. 145, 13–30. doi: 10.1007/S00704-021-03617-W
Basart, S., Pérez, C., Cuevas, E., Baldasano, J. M., and Gobbi, G. P. (2009). Aerosol characterization in northern Africa, northeastern Atlantic, mediterranean basin and middle east from direct-sun AERONET observations. Atmos. Chem. Phys. 9, 8265–8282. doi: 10.5194/acp-9-8265-2009
Buchard, V., Da Silva, A. M., Colarco, P. R., Darmenov, A., Randles, C. A., Govindaraju, R., et al. (2015). Using the OMI aerosol index and absorption aerosol optical depth to evaluate the NASA MERRA aerosol reanalysis. Atmos. Chem. Phys. 15, 5743–5760. doi: 10.5194/ACP-15-5743-2015
Burnett, R. T., Arden Pope, C., Ezzati, M., Olives, C., Lim, S. S., Mehta, S., et al. (2014). An integrated risk function for estimating the global burden of disease attributable to ambient fine particulate matter exposure. Environ. Health Perspect. 122, 397–403. doi: 10.1289/ehp.1307049
Chaibou, A. A. S., Ma, X., and Sha, T. (2020). Dust radiative forcing and its impact on surface energy budget over West Africa. Sci. Rep. 10, 12236–12218. doi: 10.1038/s41598-020-69223-4
Che, H., Gui, K., Xia, X., Wang, Y., Holben, B. N., Goloub, P., et al. (2019). Large contribution of meteorological factors to inter-decadal changes in regional aerosol optical depth. Atmos. Chem. Phys. 19, 10497–10523. doi: 10.5194/ACP-19-10497-2019
Cherian, R., and Quaas, J. (2020). Trends in AOD, clouds, and cloud radiative effects in satellite data and CMIP5 and CMIP6 model simulations over aerosol source regions. Geophys. Res. Lett. 47. doi: 10.1029/2020GL087132
Cowie, S. M., Knippertz, P., and Marsham, J. H. (2013). Are vegetation-related roughness changes the cause of the recent decrease in dust emission from the Sahel? Geophys. Res. Lett. 40, 1868–1872. doi: 10.1002/grl.50273
Cuesta, J., Lavaysse, C., Flamant, C., Mimouni, M., and Knippertz, P. (2010). Northward bursts of the west African monsoon leading to rainfall over the Hoggar massif, Algeria. Q. J. R. Meteorol. Soc. 136, 174–189. doi: 10.1002/qj.439
Danabasoglu, G. (2019a). NCAR CESM2 model output prepared for CMIP6 CMIP historical (version 20210201) [data set]. Earth Syst. Grid Feder. doi: 10.22033/ESGF/CMIP6.7627
Danabasoglu, G. (2019b). NCAR CESM2-FV2 model output prepared for CMIP6 CMIP historical (version 20210201) [data set]. Earth Syst. Grid Feder. doi: 10.22033/ESGF/CMIP6.11297
Danabasoglu, G. (2019c). NCAR CESM2-WACCM model output prepared for CMIP6 CMIP historical (version 20210201) [data set]. Earth Syst. Grid Feder. doi: 10.22033/ESGF/CMIP6.10071
Danabasoglu, G. (2019d). NCAR CESM2-WACCM-FV2 model output prepared for CMIP6 historical (version 20210201) [data set]. Earth Syst. Grid Feder. doi: 10.22033/ESGF/CMIP6.11298
Danek, C., Shi, X., Stepanek, C., Yang, H., Barbi, D., Hegewald, J., et al. (2020). AWI AWI-ESM1.1LR model output prepared for CMIP6 historical (version 20210201) [data set]. Earth System Grid Feder. doi: 10.22033/ESGF/CMIP6.9328
Davis, S. R., Pratt, L. J., and Jiang, H. (2015). The Tokar gap jet: regional circulation, diurnal variability, and moisture transport based on numerical simulations. J. Clim. 28, 5885–5907. doi: 10.1175/JCLI-D-14-00635.1
De Meij, A., and Lelieveld, J. (2011). Evaluating aerosol optical properties observed by ground-based and satellite remote sensing over the Mediterranean and the Middle East in 2006. Atmos. Res. 99, 415–433. doi: 10.1016/j.atmosres.2010.11.005
De Meij, A., Pozzer, A., and Lelieveld, J. (2012). Trend analysis in aerosol optical depths and pollutant emission estimates between 2000 and 2009. Atmos. Environ. 51, 75–85. doi: 10.1016/j.atmosenv.2012.01.059
de Ruyter de Wildt, M., Eskes, H., and Boersma, K. F. (2012). The global economic cycle and satellite-derived NO2 trends over shipping lanes. Geophys. Res. Lett. 39. doi: 10.1029/2011GL049541
Engelstaedter, S., Tegen, I., and Washington, R. (2006). North African dust emissions and transport. Earth Sci. Rev. 79, 73–100. doi: 10.1016/j.earscirev.2006.06.004
Esmaeil, N., Gharagozloo, M., Rezaei, A., and Grunig, G. (2014). Review article dust events, pulmonary diseases and immune system. Am. J. Clin. Exp. Immunol. 3, 20–29.
Eyring, V., Bony, S., Meehl, G. A., Senior, C. A., Stevens, B., Stouffer, R. J., et al. (2016). Overview of the coupled model Intercomparison project phase 6 (CMIP6) experimental design and organization. Geosci. Model Dev. 9, 1937–1958. doi: 10.5194/gmd-9-1937-2016
Farahat, A., El-Askary, H., and Al-Shaibani, A. (2015). Study of aerosols’ characteristics and dynamics over the Kingdom of Saudi Arabia using a multisensor approach combined with ground observations. Adv. Meteorol. 2015, 1–12. doi: 10.1155/2015/247531
Gandham, H., Dasari, H. P., Langodan, S., Karumuri, R. K., and Hoteit, I. (2020). Major changes in extreme dust events dynamics over the Arabian peninsula during 2003–2017 driven by atmospheric conditions. J. Geophys. Res. Atmos. 125:e2020JD032931. doi: 10.1029/2020JD032931
Gelaro, R., McCarty, W., Suárez, M. J., Todling, R., Molod, A., Takacs, L., et al. (2017). The modern-era retrospective analysis for research and applications, version 2 (MERRA-2). J. Clim. 30, 5419–5454. doi: 10.1175/JCLI-D-16-0758.1
Ghan, S. J., and Schwartz, S. E. (2007). Aerosol properties and processes: a path from field and laboratory measurements to global climate models. Bull. Am. Meteorol. Soc. 88, 1059–1084. doi: 10.1175/BAMS-88-7-1059
Giannini, A., and Kaplan, A. (2019). The role of aerosols and greenhouse gases in Sahel drought and recovery. Clim. Chang. 152, 449–466. doi: 10.1007/s10584-018-2341-9
Ginoux, P., Prospero, J. M., Gill, T. E., Hsu, N. C., and Zhao, M. (2012). Global-scale attribution of anthropogenic and natural dust sources and their emission rates based on MODIS deep blue aerosol products. Rev. Geophys. 50. doi: 10.1029/2012RG000388
Goudie, A. S., and Middleton, N. J. (2001). Saharan dust storms: nature and consequences. Earth Sci. Rev. 56, 179–204. doi: 10.1016/S0012-8252(01)00067-8
Held, I. M., Delworth, T. L., Lu, J., Findell, K. L., and Knutson, T. R. (2005). Simulation of Sahel drought in the 20th and 21st centuries. Proc. Natl. Acad. Sci. USA 102, 17891–17896. doi: 10.1073/pnas.0509057102
Islam, M. N., and Almazroui, M. (2012). Direct effects and feedback of desert dust on the climate of the Arabian peninsula during the wet season: a regional climate model study. Clim. Dyn. 39, 2239–2250. doi: 10.1007/s00382-012-1293-4
Jiang, H., Farrar, J. T., Beardsley, R. C., Chen, R., and Chen, C. (2009). Zonal surface wind jets across the Red Sea due to mountain gap forcing along both sides of the Red Sea. Geophys. Res. Lett. 36. doi: 10.1029/2009GL040008
Jickells, T., and Moore, C. M. (2015). The importance of atmospheric deposition for ocean productivity. Annu. Rev. Ecol. Evol. Syst. 46, 481–501. doi: 10.1146/annurev-ecolsys-112414-054118
Jin, Q., Yang, Z. L., and Wei, J. (2016). High sensitivity of Indian summer monsoon to Middle East dust absorptive properties. Sci. Rep. 6:30690.
Jones, S. L., Creighton, G. A., Kuchera, E. L., Rentschler, S. A., Jones, S. L., Creighton, G. A., et al. (2011). Adapting WRF-CHEM GOCART for fine-scale dust forecasting. AGUFM 2011, U14A–U06A.
Jungclaus, J., Bittner, M., Wieners, K.-H., Wachsmann, F., Schupfner, F., Legutke, S., et al. (2019). MPI-M MPI-ESM1.2-HR model output prepared for CMIP6 CMIP historical, Earth System Grid Federation. doi: 10.22033/ESGF/CMIP6.6594
Kalenderski, S., and Stenchikov, G. (2016). High-resolution regional modeling of summertime transport and impact of African dust over the red sea and Arabian Ueninsula. J. Geophys. Res. 121, 6435–6458. doi: 10.1002/2015JD024480
Karumuri, R. K., Dasari, H. P., Gandham, H., Viswanadhapalli, Y., Madineni, V. R., and Hoteit, I. (2022). Impact of COVID-19 lockdown on the ambient air-pollutants over the Arabian Peninsula. Front. environ. sci. 10:963145.
Karumuri, R. K., Kunchala, R. K., Attada, R., Dasari, H. P., and Hoteit, I. (2021). Seasonal simulations of summer aerosol optical depth over the Arabian peninsula using WRF-Chem: validation, climatology, and variability. Int. J. Climatol. 42, 2901–2922. doi: 10.1002/JOC.7396
Klingmüller, K., Pozzer, A., Metzger, S., Stenchikov, G. L., and Lelieveld, J. (2016). Aerosol optical depth trend over the Middle East. Atmos. Chem. Phys. 16, 5063–5073. doi: 10.5194/acp-16-5063-2016
Knippertz, P., and Todd, M. C. (2012). Mineral dust aerosols over the Sahara: meteorological controls on emission and transport and implications for modeling. Rev. Geophys. 50. doi: 10.1029/2011RG000362
Kok, J. F., Ward, D. S., Mahowald, N. M., and Evan, A. T. (2018). Global and regional importance of the direct dust-climate feedback. Nat. Commun. 9, 241–211. doi: 10.1038/s41467-017-02620-y
Krishna, R. K., Ghude, S. D., Kumar, R., Beig, G., Kulkarni, R., Nivdange, S., et al. (2019). Surface PM2.5 estimate using satellite-derived aerosol optical depth over India. Aerosol Air Qual. Res. 19, 25–37. doi: 10.4209/aaqr.2017.12.0568
Kumar, K. R., Attada, R., Dasari, H. P., Vellore, R. K., Langodan, S., Abualnaja, Y. O., et al. (2018). Aerosol optical depth variability over the Arabian peninsula as inferred from satellite measurements. Atmos. Environ. 187, 346–357. doi: 10.1016/j.atmosenv.2018.06.011
Lee, W. L., and Liang, H. C. (2020). AS-RCEC TaiESM1.0 model output prepared for CMIP6 CMIP historical (version 20210201) [Data set]. Earth Syst. Grid Feder. doi: 10.22033/ESGF/CMIP6.9755
Li, J., Kahn, R. A., Wei, J., Carlson, B. E., Lacis, A. A., Li, Z., et al. (2020). Synergy of satellite- and ground-based aerosol optical depth measurements using an ensemble Kalman filter approach. J. Geophys. Res. Atmos. 125. doi: 10.1029/2019JD031884
Li, D., Xue, Y., Qin, K., Wang, H., Kang, H., and Wang, L. (2022). Investigating the long-term variation trends of absorbing aerosols over Asia by using multiple satellites. Remote Sens. 14:5832. doi: 10.3390/rs14225832
Lovato, T., and Peano, D. (2020). CMCC CMCC-CM2-SR5 model output prepared for CMIP6 CMIP historical (version 20210201) [data set]. Earth Syst. Grid Feder. doi: 10.22033/ESGF/CMIP6.3825
Mahowald, N. M., Baker, A. R., Bergametti, G., Brooks, N., Duce, R. A., Jickells, T. D., et al. (2005). Atmospheric global dust cycle and iron inputs to the ocean. Glob. Biogeoch. Cycl. doi: 10.1029/2004GB002402
Mashat, A. S., Alamodi, A. O., and Ahmed, H. A. M. (2008). Diagnostic and prognostic study for dust (sand) storms over Saudi Arabia. Tech. Rep. V18_AR-26–89.
Masmoudi, M., Alfaro, S. C., and El Metwally, M. (2015). A comparison of the physical properties of desert dust retrieved from the sunphotometer observation of major events in the Sahara, Sahel, and Arabian peninsula. Atmos. Res. 158-159, 24–35. doi: 10.1016/j.atmosres.2015.02.005
Mehta, M., Singh, R., Singh, A., Singh, N., and Anshumali,. (2016). Recent global aerosol optical depth variations and trends - a comparative study using MODIS and MISR level 3 datasets. Remote Sens. Environ. 181, 137–150. doi: 10.1016/j.rse.2016.04.004
Middleton, N. J. (1985). Effect of drought on dust production in the Sahel. Nature 316, 431–434. doi: 10.1038/316431a0
Misra, A., Kanawade, V. P., and Tripathi, S. N. (2016). Quantitative assessment of AOD from 17 CMIP5 models based on satellite-derived AOD over India. Ann. Geophys. 34, 657–671. doi: 10.5194/angeo-34-657-2016
Neubauer, D. (2019). HAMMOZ-consortium MPI-ESM1.2-HAM model output prepared for CMIP6 CMIP historical (version 20210201) [Data set]. Earth Syst. Grid Feder. doi: 10.22033/ESGF/CMIP6.5016
O’Neill, B. C., Tebaldi, C., Van Vuuren, D. P., Eyring, V., Friedlingstein, P., Hurtt, G., et al. (2016). The scenario model Intercomparison project (ScenarioMIP) for CMIP6. Geosci. Model Dev. 9, 3461–3482. doi: 10.5194/gmd-9-3461-2016
Olsson, L., Eklundh, L., and Ardö, J. (2005). A recent greening of the Sahel - trends, patterns and potential causes. J. Arid Environ. 63, 556–566. doi: 10.1016/j.jaridenv.2005.03.008
Parajuli, S. P., Yang, Z. L., and Lawrence, D. M. (2016). Diagnostic evaluation of the community earth system model in simulating mineral dust emission with insight into large-scale dust storm mobilization in the Middle East and North Africa (MENA). Aeolian Res. 21, 21–35. doi: 10.1016/j.aeolia.2016.02.002
Pérez, C., Nickovic, S., Pejanovic, G., Baldasano, J. M., and Özsoy, E. (2006). Interactive dust-radiation modeling: a step to improve weather forecasts. J. Geophys. Res. Atmos. 111:16206. doi: 10.1029/2005JD006717
Pöschl, U. (2005). Atmospheric aerosols: Composition, transformation, climate and health effects. Angew. Chem. Int. Ed. Engl. 44, 7520–7540. doi: 10.1002/anie.200501122
Prakash, P. J., Stenchikov, G., Kalenderski, S., Osipov, S., and Bangalath, H. (2015). The impact of dust storms on the Arabian peninsula and the Red Sea. Atmos. Chem. Phys. 15, 199–222. doi: 10.5194/acp-15-199-2015
Rashki, A., Kaskaoutis, D. G., Eriksson, P. G., de Rautenbach, C. J., Flamant, C., and Abdi Vishkaee, F. (2014). Spatio-temporal variability of dust aerosols over the Sistan region in Iran based on satellite observations. Nat. Hazards 71, 563–585. doi: 10.1007/s11069-013-0927-0
Ravi Kumar, K., Attada, R., Dasari, H. P., Vellore, R. K., Abualnaja, Y. O., Ashok, K., et al. (2019). On the recent amplification of dust over the Arabian peninsula during 2002–2012. J. Geophys. Res. Atmos. 124, 13220–13229. doi: 10.1029/2019JD030695
Ridley, D. A., Solomon, S., Barnes, J. E., Burlakov, V. D., Deshler, T., Dolgii, S. I., et al. (2014). Total volcanic stratospheric aerosol optical depths and implications for global climate change. Geophys. Res. Lett. 41, 7763–7769. doi: 10.1002/2014GL061541
Roberts, A. J., and Knippertz, P. (2014). The formation of a large summertime saharan dust plume: convective and synoptic-scale analysis. J. Geophys. Res. 119, 1766–1785. doi: 10.1002/2013JD020667
Sanap, S. D., Ayantika, D. C., Pandithurai, G., and Niranjan, K. (2014). Assessment of the aerosol distribution over Indian subcontinent in CMIP5 models. Atmos. Environ. 87, 123–137. doi: 10.1016/j.atmosenv.2014.01.017
Sartelet, K., Legorgeu, C., Lugon, L., Maanane, Y., and Musson-Genon, L. (2018). Representation of aerosol optical properties using a chemistry transport model to improve solar irradiance modelling. Solar Energy 176, 439–452. doi: 10.1016/j.solener.2018.10.017
Seland, (2019). NorESM2-LM model output prepared for CMIP6 CMIP historical (version 20210201) [data set]. Earth Syst. Grid Feder. doi: 10.22033/ESGF/CMIP6.8036
Shukla, K. K., Attada, R., Khan, A. W., and Kumar, P. (2022). Evaluation of extreme dust storm over the northwest indo-Gangetic plain using WRF-Chem model 110, 1887–1910. doi: 10.1007/s11069-021-05017-9
Singh, B. B., Kumar, K. N., Seelanki, V., Karumuri, R. K., Attada, R., and Kunchala, R. K. (2022). How reliable are coupled model intercomparison project phase 6 models in representing the Asian summer monsoon anticyclone? Int. J. Climatol. 42, 7047–7059. doi: 10.1002/JOC.7646
Sultan, B., Roudier, P., Quirion, P., Alhassane, A., Muller, B., Dingkuhn, M., et al. (2013). Assessing climate change impacts on sorghum and millet yields in the Sudanian and Sahelian savannas of West Africa. Environ. Res. Lett. 8:014040.
Swart, N. C. (2019). CCCma CanESM5 model output prepared for CMIP6 CMIP historical (version 20210201) [data set]. Earth Syst. Grid Fede. doi: 10.22033/ESGF/CMIP6.3610
Tatebe, H., and Watanabe, M. (2018). MIROC MIROC6 model output prepared for CMIP6 CMIP historical (version 20210201) [data set]. Earth Syst. Grid Feder. doi: 10.22033/ESGF/CMIP6.5603
Taylor, K. E. (2001). Summarizing multiple aspects of model performance in a single diagram. J. Geophys. Res. Atmos. 106, 7183–7192. doi: 10.1029/2000JD900719
Tilmes, S., Lamarque, J. F., Emmons, L. K., Kinnison, D. E., Ma, P. L., Liu, X., et al. (2015). Description and evaluation of tropospheric chemistry and aerosols in the community earth system model (CESM1.2). Geosci. Model Dev. 8, 1395–1426. doi: 10.5194/GMD-8-1395-2015
Titos, G., Ealo, M., Pandolfi, M., Pérez, N., Sola, Y., Sicard, M., et al. (2017). Spatiotemporal evolution of a severe winter dust event in the western Mediterranean: aerosol optical and physical properties. J. Geophys. Res. 122, 4052–4069. doi: 10.1002/2016JD026252
Vinoj, V., Rasch, P. J., Wang, H., Yoon, J.-H., Ma, P.-L., Landu, K., et al. (2014). Short-term modulation of Indian summer monsoon rainfall by west Asian dust. Nat. Geosci. 7, 308–313. doi: 10.1038/ngeo2107
Wang, C.-S., Wang, Z.-L., Lei, Y.-D., Zhang, H., Che, H.-Z., and Zhang, X.-Y. (2021). Differences in East Asian summer monsoon responses to Asian aerosol forcing under different emission inventories. Adv. Clim. Chang. Res. 13, 309–322. doi: 10.1016/j.accre.2022.02.008
Wieners, K. H. (2019). MPI-M MPI-ESM1.2-LR model output prepared for CMIP6 CMIP historical (version 20210201) [Data set]. Earth Syst. Grid Feder. doi: 10.22033/ESGF/CMIP6.6595
Yu, Y., Notaro, M., Kalashnikova, O. V., and Garay, M. J. (2016). Climatology of summer Shamal wind in the Middle East. J. Geophys. Res. Atmos. 121, 289–305. doi: 10.1002/2015JD024063
Yukimoto, S. (2019). MRI MRI-ESM2.0 model output prepared for CMIP6 CMIP historical (version 20210201) [Data set]. Earth Syst. Grid Feder. doi: 10.22033/ESGF/CMIP6.6842
Zhang, J. (2018). BCC BCC-ESM1 model output prepared for CMIP6 CMIP historical (version 20210201) [data set]. Earth Syst. Grid Feder. doi: 10.22033/ESGF/CMIP6.2949
Zhao, L, Jin, S, Liu, X, Wang, B, Song, Z, Hu, J, et al. (2021). Assessment of CMIP6 Model Performance for Wind Speed in China. Front. Clim. 3:735988. doi: 10.3389/fclim.2021.735988
Keywords: Middle East and North Africa (MENA), aerosol optical depth, CMIP6 models, emission scenarios, meteorological factors, trends
Citation: Kunchala RK, Attada R, Karumuri RK, Seelanki V, Singh BB, Ashok K and Hoteit I (2024) Climatology, trends, and future projections of aerosol optical depth over the Middle East and North Africa region in CMIP6 models. Front. Clim. 6:1384202. doi: 10.3389/fclim.2024.1384202
Edited by:
Didier Swingedouw, UMR5805 Environnements et Paléoenvironnements Océaniques et Continentaux (EPOC), FranceReviewed by:
Yesubabu Viswanadhapalli, National Atmospheric Research Laboratory, IndiaCopyright © 2024 Kunchala, Attada, Karumuri, Seelanki, Singh, Ashok and Hoteit. This is an open-access article distributed under the terms of the Creative Commons Attribution License (CC BY). The use, distribution or reproduction in other forums is permitted, provided the original author(s) and the copyright owner(s) are credited and that the original publication in this journal is cited, in accordance with accepted academic practice. No use, distribution or reproduction is permitted which does not comply with these terms.
*Correspondence: Ibrahim Hoteit, aWJyYWhpbS5ob3RlaXRAa2F1c3QuZWR1LnNh
Disclaimer: All claims expressed in this article are solely those of the authors and do not necessarily represent those of their affiliated organizations, or those of the publisher, the editors and the reviewers. Any product that may be evaluated in this article or claim that may be made by its manufacturer is not guaranteed or endorsed by the publisher.
Research integrity at Frontiers
Learn more about the work of our research integrity team to safeguard the quality of each article we publish.