 Gunnar Myhre
 Caroline Jouan
 Camilla Weum Stjern
 Øivind Hodnebrog
- CICERO Center for International Climate Research, Oslo, Norway
It has previously been shown that trends in sensible heat from climate models have had a substantial contribution to global precipitation changes. We illustrate that this is the case also in the most recent Coupled Model Intercomparison Project Phase 6 (CMIP6). However, we find that over the period since 1980 reanalyses do not support the reduction in sensible heat from the CMIP6 models and rather estimate a global increase in sensible heat which would contribute to a precipitation reduction. Satellite data over a period of two decades over global ocean generally show an opposite sign of the sensible heat trend to the CMIP6 models, similarly to the reanalyses.
1 Introduction
Sensible heat, which involves transfer of heat from the Earth’s surface to the atmosphere without a phase change, depends on factors such as the temperature difference between the surface and the overlying air, turbulence, and convection. It currently ranks among the most uncertain components in the global energy budget (Stephens et al., 2012; L’Ecuyer et al., 2015; Forster et al., 2021), and its response to climate change remains relatively poorly understood. Sensible heat is a key component of the surface energy budget and an important factor for global precipitation changes (O’Gorman et al., 2012). This can be illustrated by the equation linking precipitation (P) and sensible heat (SH) with atmospheric radiative cooling (dQ):
Where L is the constant for latent heat of vaporization. In climate models, the global atmospheric energy budget, unlike budgets for the top of the atmosphere and surface, tends to quickly return to equilibrium following a large perturbation by a climate driver (e.g., a doubling of the CO2 concentration) (Stjern et al., 2023a). This implies that Equation 1 on a global scale is valid in transient climate model simulations. Myhre et al. (2018) showed that the latent heating associated with global mean precipitation change (LdP) was equal to the change in sensible heat (dSH) over the industrial era in Coupled Model Intercomparison Project Phase 5 (CMIP5) model simulations. This means that the radiative cooling term in Equation 1 is zero in the multi-model global mean. Surface warming over the historical period has initiated atmospheric radiative cooling (Mitchell et al., 1987; Allen and Ingram, 2002), but the increase in certain greenhouse gases and aerosols, notably CO2 and black carbon (BC), has initially resulted in atmospheric radiative heating (Myhre et al., 2018). The global mean changes in sensible heat flux and precipitation up to present day relative to pre-industrial are less than 1 Wm−2, but the magnitudes of the atmospheric radiative cooling due to surface temperature increase (and associated warming of the troposphere) and the radiative heating from gases and aerosols both exceed 2 Wm−2 (Myhre et al., 2018). Thus, although the magnitude of the atmospheric cooling and heating terms are individually larger than the sensible heat term, they cancel each other out in the CMIP5 multi-model mean at present day (see Figure 8 in Myhre et al., 2018).
It is important to understand the present and historical contribution of sensible heat to precipitation, as this role is likely to change in the future when the balance of greenhouse gases and aerosols (and thus the balance of atmospheric warming and cooling forcers) shifts.
Several studies have compared sensible heat from the more recent CMIP6 models with sensible heat fluxes from satellite data over ocean (Zhou et al., 2022) and with reanalysis over land (Li et al., 2021). Such comparisons are challenged by observational uncertainties due to insufficient measurements coverage (Bentamy et al., 2017b; Yu, 2019; Forster et al., 2021). Differences in sensible heat between various satellite products can reach up to 5 Wm−2 regionally. However, the aim of these studies has been to quantify the present-day magnitude of fluxes.
Here, we perform an updated version of the analyses in Myhre et al. (2018) using CMIP6 models, focusing on how the relationship between precipitation and sensible heat has evolved over the historical period. To our knowledge, no study has looked at trends in global sensible heat in the CMIP6 models. Furthermore, we compare and evaluate these trends with reanalysis and satellite data to assess how the contribution of sensible heat to global precipitation trends differs between models and observations.
2 Materials and methods
We use CMIP6 data (Eyring et al., 2016; see Supplementary Table S1 for the list of 16 models), and utilize simulations from the historical experiment (1850–2014) combined with SSP370 (O’Neill et al., 2017) for 2015–2100. Reanalysis data from ECMWF Reanalysis 5 (ERA5) (Hersbach et al., 2020) and Modern-Era Retrospective analysis for Research and Application, Version 2 (MERRA2) (Gelaro et al., 2017) are compared to the CMIP6 models. ERA5 is based on the Integrated Forecasting System (IFS) with data going back to 1940. MERRA2 consists of data from 1980.
MERRA2 (Gelaro et al., 2017) is a NASA reanalysis available since 1980 and has a regular grid of 0.50° latitude × 0.625° longitude. It assimilates surface winds through a combination of in-situ and satellite data, including SSM/I, ERS-1(2), ESA QuikSCAT, WindSat and ASCAT surface wind data. Surface layer turbulence parameterization follows the schemes of Lock et al. (2000) and Helfand and Schubert (1995) for unstable and stable conditions, respectively. ERA-5 (Hersbach et al., 2020) is an ECMWF reanalysis available since 1979 to present and has a regular grid of 0.25° latitude × 0.25° longitude. It assimilates surface winds through a combination of in-situ and satellite data, including GMI, SSMI/I, AMSR-2(E), TMI, ERS-1(2), OSCAT, ASCAT, QuikSCAT surface wind data. Surface layer turbulence parameterization follows the Tiled ECMWF Scheme for Surface Exchanges over Land (H-TESSEL) (Balsamo et al., 2015).
We analyze surface sensible heat flux datasets from five satellite-derived products: GSSTF (Goddard Satellite-based Surface Turbulent Fluxes, NASA, United States) version 3.0 (Shie et al., 2009); J-OFURO (Japanese Ocean Flux datasets with Use of Remote sensing Observations, Japan) versions 3.0 (Tomita et al., 2019); IFREMER (Institut Français pour la Recherche et l’Exploitation de la MER, France) version 4.1 (Bentamy et al., 2013; Bentamy et al., 2017a); HOAPS (Hamburg Ocean Atmosphere Parameters and fluxes from Satellite, Germany) version 4.0 (Andersson et al., 2010); and OAFlux (Objectively Analyzed air-sea Fluxes, WHOI, United States) version 3 (Yu and Weller, 2007; Jin et al., 2015).
Supplementary Table S2 compares the major features of the five satellite-derived datasets. Collectively, these products employ a common bulk parameterization method, such as the Coupled Ocean–Atmosphere Response Experiment (COARE) algorithm (Fairall et al., 2003), to estimate turbulent heat fluxes at the ocean surface using satellite data. GSSFTF3 employs its own bulk parameterization method (Shie et al., 2009).
The bulk parametrization algorithm requires input data such as surface wind speed, air temperature, specific humidity (especially for retrieving latent heat flux, which is not our focus here), and sea surface temperature. Surface wind speed is primarily obtained from radiometers like the Special Sensor Microwave/Imager (SSMI/I) and/or scatterometers like the Quick Scatterometer (QuickSCAT). Specific humidity is mainly derived from brightness temperature measurements from satellite radiometers. Sea surface temperature can be sourced from various observations and/or re-analyses, while air surface temperature primarily comes from re-analyses.
The OAFlux product differs from others by combining bulk variables derived both from satellites and those from reanalysis. Analysis focuses on open ocean regions (free of ice) since these satellite products are not able to produce estimates over sea ice.
Uncertainty is given by 95% confidence interval (CI) for re-analysis, as well as for model ensembles, by assuming normal distributions. For re-analysis (only 1 realization), the confidence interval is calculated as where is the standard-error associated with the linear fit, 1.96 is the critical value. For model ensembles (multiple realizations), the model ensemble mean confidence interval is calculated as in Equation 2:
where is the standard-error of trends in the ensemble mean, is the standard-error associated with each linear fits of trends and is the number of realizations in the ensemble. and are added in quadrature since they are supposed to be independent uncertainties.
3 Results
3.1 Precipitation and sensible heat in CMIP6 simulations
Figure 1 presents an updated version of the CMIP5 illustration by Myhre et al. (2018) demonstrating the terms for global means of precipitation and sensible heat from Equation 1, now incorporating CMIP6 data. In the CMIP6 multi-model global mean the cross-over between changes in precipitation and sensible heat is in the period 2020–2030. It is important to note that all CMIP6 models in Figure 1 exhibit a reduction in global mean sensible heat at present relative to pre-industrial conditions.
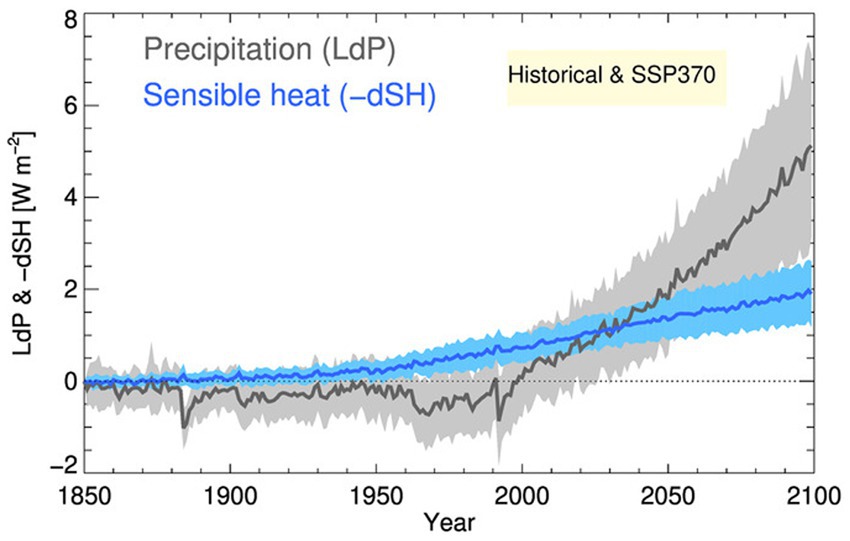
Figure 1. Global mean historical and future precipitation and sensible heat changes from 1850, from a selection of CMIP6 models. Future simulations are based on the SSP370 scenario. The solid line shows the multi-model mean of the CMIP6 models, and ± 1 standard deviation across the model sample is shown as a band. Sensible heat is given as a reduction in the upward surface flux and positive values thus show a contribution to increased precipitation according to Equation 1.
3.2 Comparison of sensible heat between CMIP6 models and re-analysis
Reanalysis data offer a comprehensive view of past weather and climate. They combine observations with short-range weather forecasts. Reanalysis provides continuous records even if there are gaps in some of the observations. ERA5 and MERRA2 are among the most used reanalysis products. Notably, there is a divergence in the trend of sensible heat on a global scale between the two reanalysis and the multi-model mean in CMIP6 over the period from 1980 to 2022 as shown in Figure 2. The pattern in the two reanalysis is somewhat different. ERA5 has a stronger positive trend in the sensible heat (contributing to a global mean precipitation reduction) over land than in MERRA2 and MERRA2 has stronger positive sensible heat trend over ocean than for ERA. In contrast, CMIP6 models display a negative sensible heat trend, contributing to a global mean precipitation increase. This negative trend is particularly prominent over the ocean. Table 1 clearly shows the different land and ocean trends between the two reanalyses. The signs of the trends over land and ocean in the multi-model mean of CMIP6 models are equal to in ERA5, but magnitudes of the trends are very different (see also Supplementary Figure S1). Adding the standard-error associated to the linear fits on the model ensemble means confidence interval, result in relatively large uncertainties over land but not over ocean. The consistent pattern over India across reanalysis and CMIP6 models (see Supplementary Figure S2 with gray shading over non-significant areas), showing a reduction in sensible heat with varying degrees of magnitude and extend beyond India, is likely caused by increasing abundance of aerosols and in particular BC (Myhre et al., 2018). BC stabilizes the lower atmosphere (Myhre et al., 2018) by heating the troposphere while causing less surface warming and, in some cases, even local cooling (Stjern et al., 2017). This process reduces turbulence in the boundary layer (Stjern et al., 2023b) and is likely the primary factor responsible for the reduction in sensible heat caused by BC.
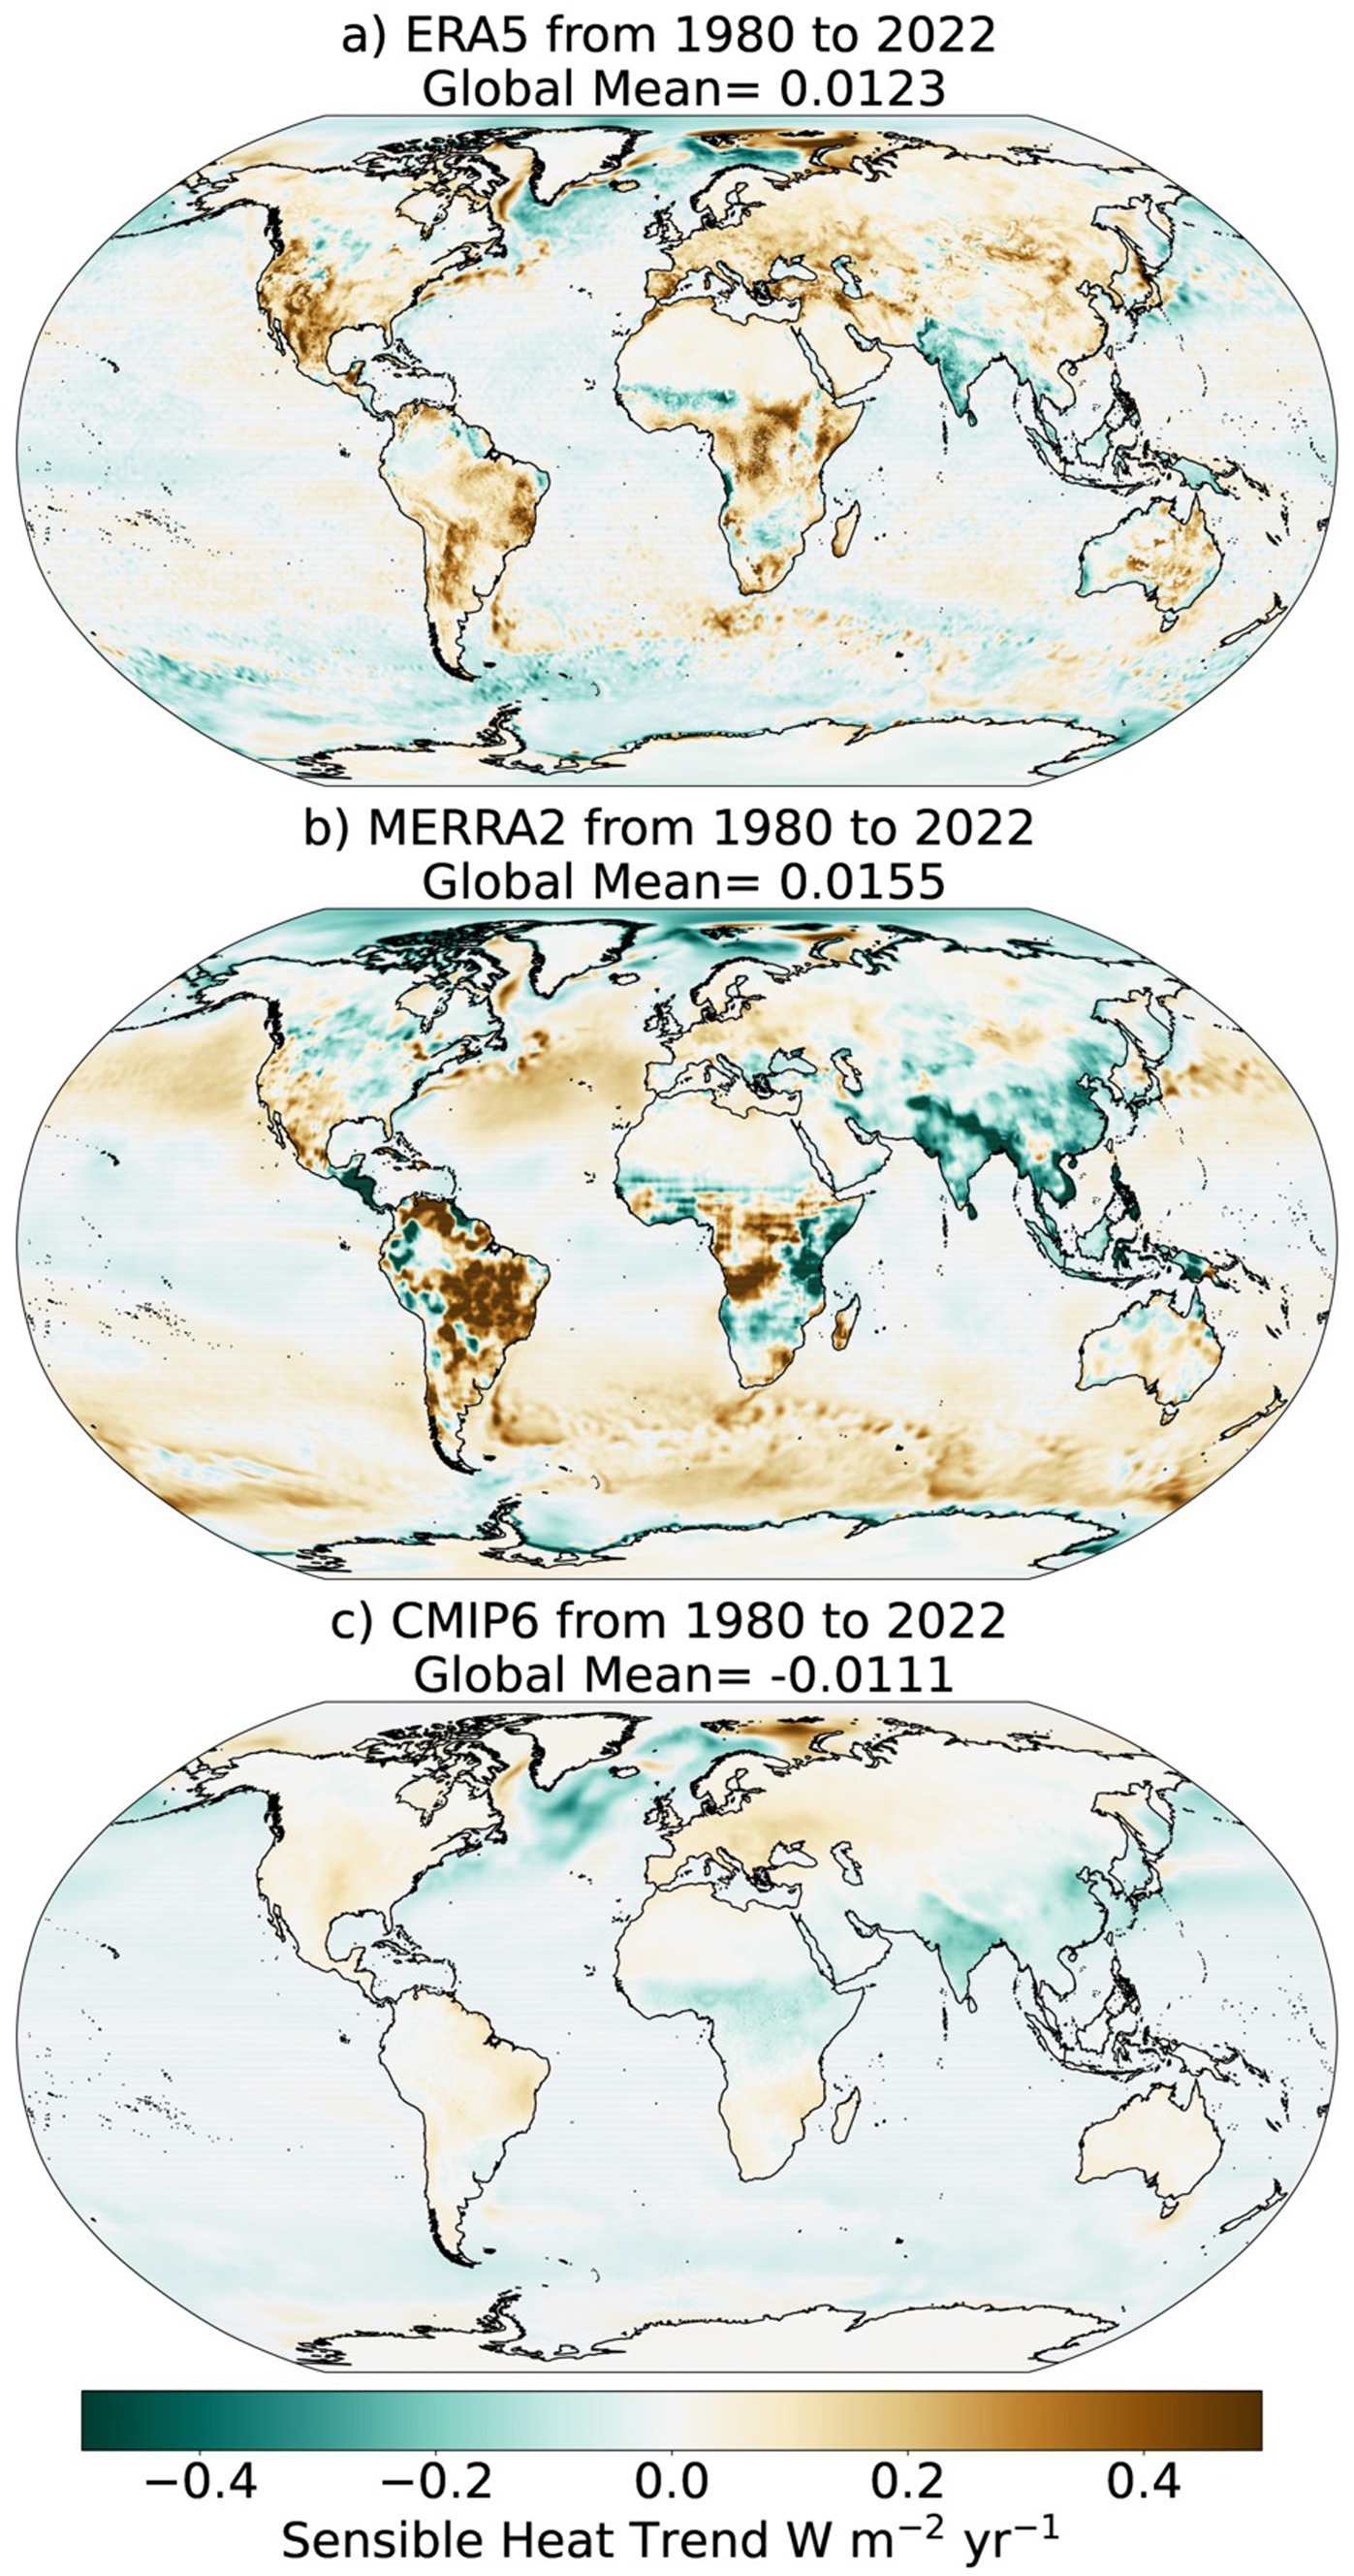
Figure 2. Geographical distribution of the linear trend in sensible heat (W m−2 yr.−1) 1980–2022 for the two reanalysis ERA5 (a) and MERRA (b) and the multi-model mean of CMIP6 models (c).
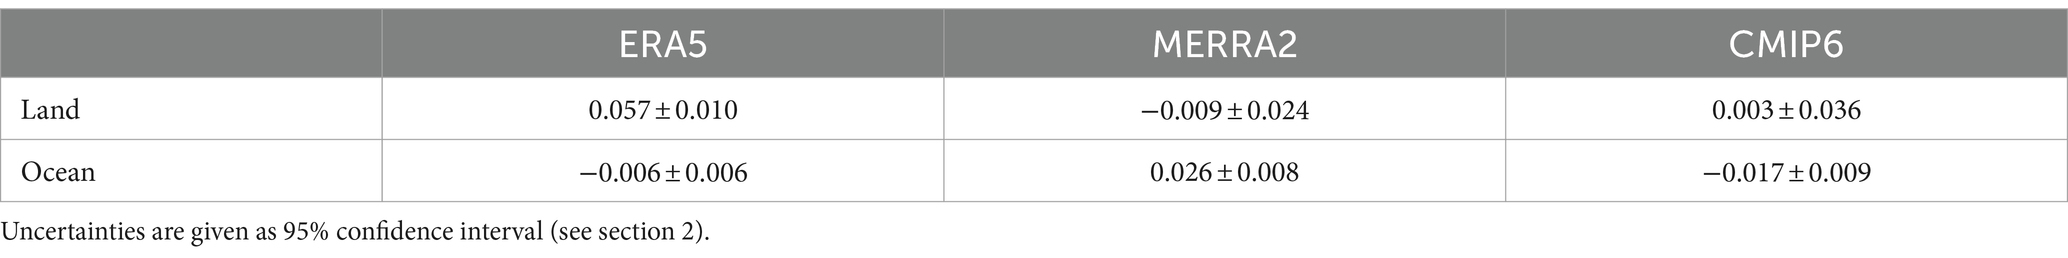
Table 1. Trends in surface sensible heat 1980–2022 (W m−2 yr.−1) for reanalysis (ERA5 and MERRA2) and multi-model mean of 16 CMIP6 models.
Figure 3 shows the change in global mean sensible heat for the period 1980–2022 from the linear trend for individual CMIP6 models and two reanalyses. The magnitude of the sensible heat reduction in the CMIP6 models varies, but all show a reduction which is contrasting the reanalysis.
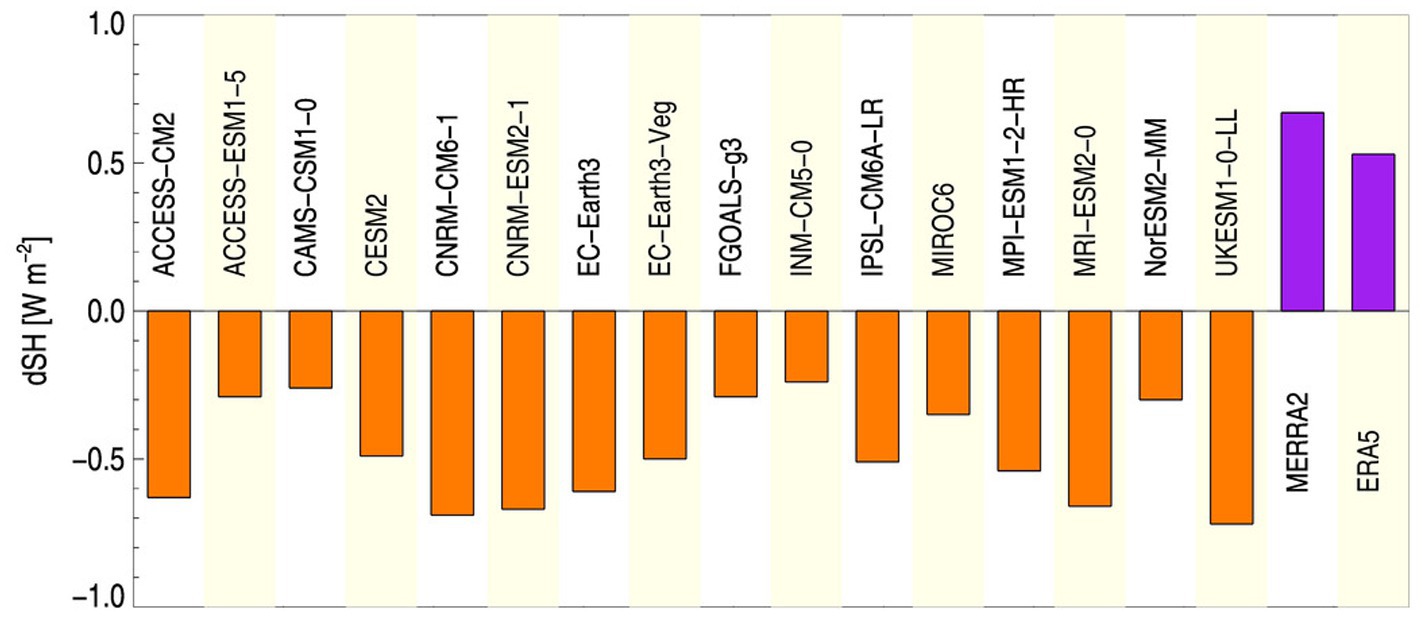
Figure 3. Global mean changes in sensible heat (Wm−2) from a linear trend 1980–2022 for individual CMIP6 models and two reanalyses.
3.3 Comparison of sensible heat between CMIP6 models and satellite data
Figure 4 shows the change in sensible heat over ocean in the period 1988–2008 for four distinct satellite products (GSSTF left out due to sparse coverage), two reanalyses, and the multi-model mean of CMIP6 models. For the period 1988–2008 all satellite products and the two reanalyses have an increase in the surface sensible heat over ocean, with one exception (OAFLUX). OAFLUX has a weak reduction in sensible heat over ocean and in magnitude weaker than the other satellite products. HOAPSv40 has the largest increase in sensible heat over ocean among the satellite products and much larger than the reanalysis. The spatial pattern of change in sensible heat differs strongly among the datasets in Figure 4, with one exception that all datasets have a reduction in the sensible heat south of Greenland, including the multi-model mean of the CMIP6 models. While J-OFURO utilizes diverse satellite sources to retrieve bulk meteorological variables, GSSTF relies primarily on SSM/I radiometer measurements. This may explain the non-uniform GSSTF mask, likely due to missing auxiliary data to fill gaps (see Supplementary Figure S3).
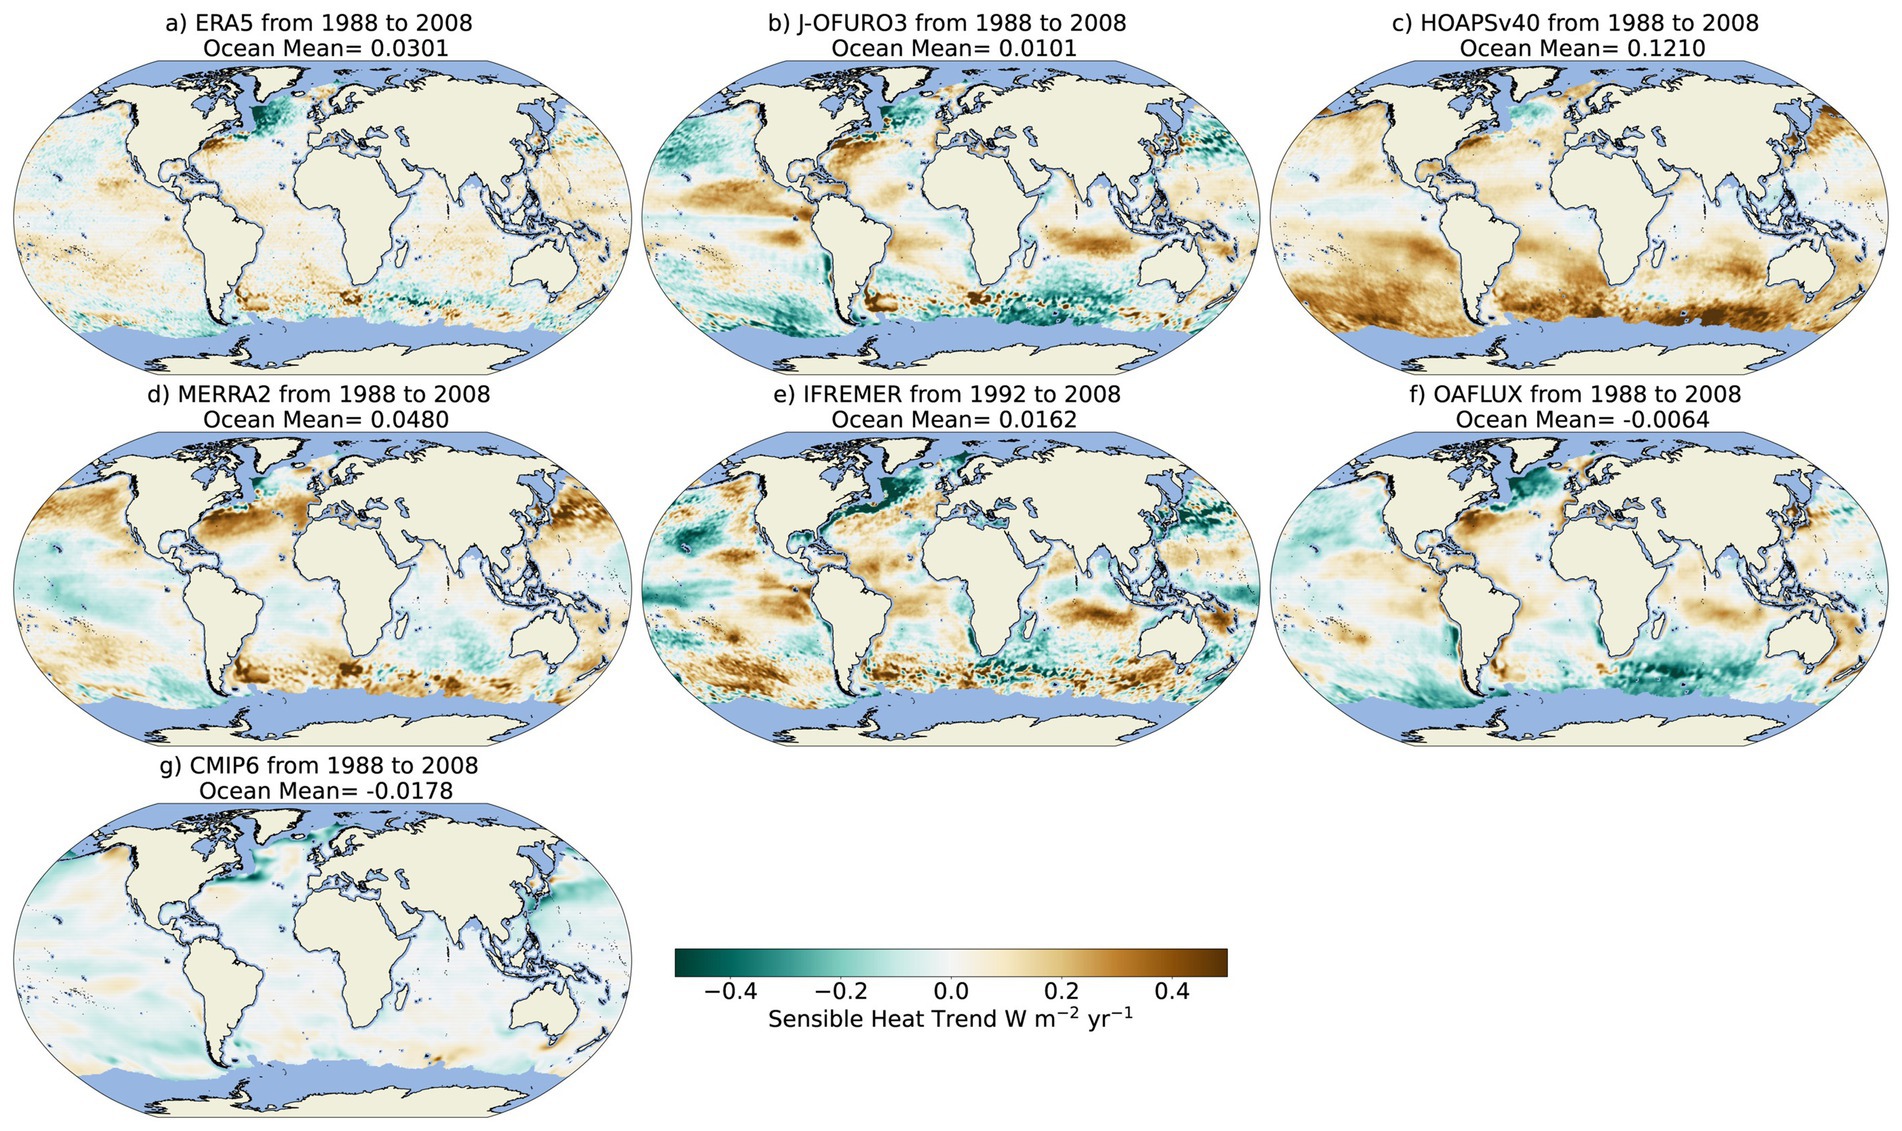
Figure 4. Linear trend in sensible heat (W m−2 yr.−1) over ocean from 1988 to 2008 for four satellite products (b,c,e,f), two reanalysis (a,d), and the multi-model mean from CMIP6 models (g). Data was regridded to a uniform 0.25-degree resolution in latitude and longitude. A mask was then applied to indicate the presence of data in each cell across the four satellite datasets.
4 Discussion and conclusion
We have shown that CMIP6 models similar to CMIP5 exhibit a reduced global surface sensible heat at present relative to the pre-industrial era that is equal to the global mean increase in precipitation. This balance between global precipitation change and sensible heat change implies that the radiative cooling term in Equation 1 is zero. Consequently, atmospheric radiative cooling caused by surface warming and the associated tropospheric temperature change (Allen and Ingram, 2002) and atmospheric radiative heating, mainly from CO2 and BC, are in close balance (Myhre et al., 2018).
Observations also indicate a global precipitation increase (Allan et al., 2020). However, the reduced sensible heat from CMIP6 models is not supported by satellite data and reanalysis. Conversely, these datasets suggest an increase in sensible heat which would contribute to reduced global precipitation.
Myhre et al. (2018) found that changes in lower tropospheric stability are a main factor in driving the size and pattern of the changes in sensible heat. More specifically, different climate drivers exert a different vertical temperature profile, with BC being special due to its strong solar absorption, and thereby heating and stabilization, of the atmosphere (Stjern et al., 2023a; Stjern et al., 2023b). As the increase in global BC emissions in recent decades in CMIP6 emission inventories has later been revised downwards (McDuffie et al., 2020), the effect of BC may be overestimated in the historical experiment in CMIP6 and, thus, exert a too strong stabilization of the lower troposphere. This stabilization could be a contributing factor for the reduction in sensible heat from the surface in CMIP6 models. In contrast, anthropogenic BC emissions are constant from 2006 onwards in MERRA-2 (Randles et al., 2017). However, there is little evidence supporting that the atmospheric radiative heating in CMIP6 models from BC is too strong, it appears to be the opposite (Chen et al., 2022). Potentially different representation of time evolution of other aerosols and greenhouse gas concentrations in CMIP6 and the reanalyses could also influence lower tropospheric stability and sensible heat fluxes. To better assess underlying causes for differences in sensible heat trends between CMIP6 and reanalyses, follow-up work should analyze lower tropospheric stability in the different datasets and also compare other variables important for sensible heat, such as differences in soil moisture (Qiao et al., 2022), which could influence the Bowen ratio and thereby affect sensible heat fluxes over land.
This inconsistency between CMIP6 models and observations on the global atmospheric energy budget is important to understand to achieve confidence in estimates of precipitation changes in CMIP models.
Data availability statement
The original contributions presented in the study are included in the article/Supplementary material, further inquiries can be directed to the corresponding author.
Author contributions
GM: Conceptualization, Formal analysis, Funding acquisition, Validation, Visualization, Writing – original draft, Writing – review & editing. CJ: Formal analysis, Methodology, Visualization, Writing – original draft, Writing – review & editing. CS: Methodology, Validation, Writing – original draft, Writing – review & editing. ØH: Methodology, Validation, Writing – original draft, Writing – review & editing.
Funding
The author(s) declare financial support was received for the research, authorship, and/or publication of this article. This study was supported by the BUDGET project grants no. 325270 and GREAT project grants no. 275589 funded by the Norwegian Research Council.
Conflict of interest
The authors declare that the research was conducted in the absence of any commercial or financial relationships that could be construed as a potential conflict of interest.
The reviewer AM declared a past coauthorship with the author GM to the handling editor.
The author(s) declared that they were an editorial board member of Frontiers, at the time of submission. This had no impact on the peer review process and the final decision.
Publisher’s note
All claims expressed in this article are solely those of the authors and do not necessarily represent those of their affiliated organizations, or those of the publisher, the editors and the reviewers. Any product that may be evaluated in this article, or claim that may be made by its manufacturer, is not guaranteed or endorsed by the publisher.
Supplementary material
The Supplementary material for this article can be found online at: https://www.frontiersin.org/articles/10.3389/fclim.2024.1383337/full#supplementary-material
References
Allan, R. P., Barlow, M., Byrne, M. P., Cherchi, A., Douville, H., Fowler, H. J., et al. (2020). Advances in understanding large-scale responses of the water cycle to climate change. Ann. N. Y. Acad. Sci. 1472, 49–75. doi: 10.1111/nyas.14337
Allen, M. R., and Ingram, W. J. (2002). Constraints on future changes in climate and the hydrologic cycle. Nature 419, 224–232. doi: 10.1038/nature01092
Andersson, A., Fennig, K., Klepp, C., Bakan, S., Graßl, H., and Schulz, J. (2010). The Hamburg Ocean atmosphere parameters and fluxes from satellite data–HOAPS-3. Earth Syst. Sci. Data 2, 215–234. doi: 10.5194/essd-2-215-2010
Balsamo, G., Albergel, C., Beljaars, A., Boussetta, S., Brun, E., Cloke, H., et al. (2015). ERA-interim/land: a global land surface reanalysis data set. Hydrol. Earth Syst. Sci. 19, 389–407. doi: 10.5194/hess-19-389-2015
Bentamy, A., Grodsky, S. A., Elyouncha, A., Chapron, B., and Desbiolles, F. (2017a). Homogenization of scatterometer wind retrievals. Int. J. Climatol. 37, 870–889. doi: 10.1002/joc.4746
Bentamy, A., Grodsky, S. A., Katsaros, K., Mestas-Nuñez, A. M., Blanke, B., and Desbiolles, F. (2013). Improvement in air–sea flux estimates derived from satellite observations. Int. J. Remote Sens. 34, 5243–5261. doi: 10.1080/01431161.2013.787502
Bentamy, A., Piollé, J. F., Grouazel, A., Danielson, R., Gulev, S., Paul, F., et al. (2017b). Review and assessment of latent and sensible heat flux accuracy over the global oceans. Remote Sens. Environ. 201, 196–218. doi: 10.1016/j.rse.2017.08.016
Chen, C., Dubovik, O., Schuster, G. L., Chin, M., Henze, D. K., Lapyonok, T., et al. (2022). Multi-angular polarimetric remote sensing to pinpoint global aerosol absorption and direct radiative forcing. Nat. Commun. 13:7459. doi: 10.1038/s41467-022-35147-y
Eyring, V., Bony, S., Meehl, G. A., Senior, C. A., Stevens, B., Stouffer, R. J., et al. (2016). Overview of the coupled model intercomparison project phase 6 (CMIP6) experimental design and organization. Geosci. Model Dev. 9, 1937–1958. doi: 10.5194/gmd-9-1937-2016
Fairall, C. W., Bradley, E. F., Hare, J. E., Grachev, A. A., and Edson, J. B. (2003). Bulk parameterization of Air–Sea fluxes: updates and verification for the COARE algorithm. J. Clim. 16, 571–591. doi: 10.1175/1520-0442(2003)016<0571:BPOASF>2.0.CO;2
Forster, P., Storelvmo, T., Armour, K., Collins, W., Dufresne, J.-L., Frame, D., et al. (2021). “The Earth’s energy budget, climate feedbacks, and climate sensitivity” in Climate change 2021: the physical science basis. Contribution of working group I to the sixth assessment report of the intergovernmental panel on climate change. eds. V. Masson-Delmotte, P. Zhai, A. Pirani, S. L. Connors, C. Péan, and S. Berger, et al. (Cambridge, United Kingdom, New York, NY, USA: Cambridge University Press), pp. 923–1054.
Gelaro, R., Mccarty, W., Suárez, M. J., Todling, R., Molod, A., Takacs, L., et al. (2017). The modern-era retrospective analysis for research and applications, version 2 (MERRA-2). J. Clim. 30, 5419–5454. doi: 10.1175/JCLI-D-16-0758.1
Helfand, H. M., and Schubert, S. D. (1995). Climatology of the simulated Great Plains low-level jet and its contribution to the continental moisture budget of the United States. J. Clim. 8, 784–806. doi: 10.1175/1520-0442(1995)008<0784:COTSGP>2.0.CO;2
Hersbach, H., Bell, B., Berrisford, P., Hirahara, S., Horányi, A., Muñoz-Sabater, J., et al. (2020). The ERA5 global reanalysis. Q. J. R. Meteorol. Soc. 146, 1999–2049. doi: 10.1002/qj.3803
Jin, X., Yu, L., Jackson, D. L., and Wick, G. A. (2015). An improved near-surface specific humidity and air temperature climatology for the SSM/I satellite period. J. Atmos. Ocean. Technol. 32, 412–433. doi: 10.1175/JTECH-D-14-00080.1
L’ecuyer, T. S., Beaudoing, H. K., Rodell, M., Olson, W., Lin, B., Kato, S., et al. (2015). The observed state of the energy budget in the early twenty-first century. J. Clim. 28, 8319–8346. doi: 10.1175/JCLI-D-14-00556.1
Li, J., Miao, C., Wei, W., Zhang, G., Hua, L., Chen, Y., et al. (2021). Evaluation of CMIP6 global climate models for simulating land surface energy and water fluxes during 1979–2014. J. Adv. Mod. Earth Syst. 13:e2021MS002515. doi: 10.1029/2021MS002515
Lock, A. P., Brown, A. R., Bush, M. R., Martin, G. M., and Smith, R. N. B. (2000). A new boundary layer mixing scheme. Part I: scheme description and single-column model tests. Mon. Weather Rev. 128, 3187–3199. doi: 10.1175/1520-0493(2000)128<3187:ANBLMS>2.0.CO;2
Mcduffie, E. E., Smith, S. J., O'rourke, P., Tibrewal, K., Venkataraman, C., Marais, E. A., et al. (2020). A global anthropogenic emission inventory of atmospheric pollutants from sector- and fuel-specific sources (1970–2017): an application of the community emissions data system (CEDS). Earth Syst. Sci. Data 12, 3413–3442. doi: 10.5194/essd-12-3413-2020
Mitchell, J. F. B., Wilson, C. A., and Cunnington, W. M. (1987). On CO2 climate sensitivity and model dependence of results. Q. J. R. Meteorol. Soc. 113, 293–322.
Myhre, G., Samset, B. H., Hodnebrog, Ø., Andrews, T., Boucher, O., Faluvegi, G., et al. (2018). Sensible heat has significantly affected the global hydrological cycle over the historical period. Nat. Commun. 9:1922. doi: 10.1038/s41467-018-04307-4
O’Gorman, P. A., Allan, R. P., Byrne, M. P., and Previdi, M. (2012). Energetic constraints on precipitation under climate change. Surv. Geophys. 33, 585–608. doi: 10.1007/s10712-011-9159-6
O’Neill, B. C., Kriegler, E., Ebi, K. L., Kemp-Benedict, E., Riahi, K., Rothman, D. S., et al. (2017). The roads ahead: narratives for shared socioeconomic pathways describing world futures in the 21st century. Glob. Environ. Chang. 42, 169–180. doi: 10.1016/j.gloenvcha.2015.01.004
Qiao, L., Zuo, Z., and Xiao, D. (2022). Evaluation of soil moisture in CMIP6 simulations. J. Clim. 35, 779–800. doi: 10.1175/JCLI-D-20-0827.1
Randles, C. A., Da Silva, A. M., Buchard, V., Colarco, P. R., Darmenov, A., Govindaraju, R., et al. (2017). The MERRA-2 aerosol reanalysis, 1980 onward. Part I: system description and data assimilation evaluation. J. Clim. 30, 6823–6850. doi: 10.1175/JCLI-D-16-0609.1
Shie, C.-L., Chiu, L. S., Adler, R., Nelkin, E., Lin, I. I., Xie, P., et al. (2009). A note on reviving the Goddard satellite-based surface turbulent fluxes (GSSTF) dataset. Adv. Atmos. Sci. 26, 1071–1080. doi: 10.1007/s00376-009-8138-z
Stephens, G. L., Li, J., Wild, M., Clayson, C. A., Loeb, N., Kato, S., et al. (2012). An update on Earth's energy balance in light of the latest global observations. Nat. Geosci. 5, 691–696. doi: 10.1038/ngeo1580
Stjern, C. W., Forster, P. M., Jia, H., Jouan, C., Kasoar, M. R., Myhre, G., et al. (2023a). The time scales of climate responses to carbon dioxide and aerosols. J. Clim. 36, 3537–3551. doi: 10.1175/JCLI-D-22-0513.1
Stjern, C. W., Hodnebrog, Ø., Myhre, G., and Pisso, I. (2023b). The turbulent future brings a breath of fresh air. Nat. Commun. 14:3735. doi: 10.1038/s41467-023-39298-4
Stjern, C. W., Samset, B. H., Myhre, G., Forster, P. M., Hodnebrog, Ø., Andrews, T., et al. (2017). Rapid adjustments cause weak surface temperature response to increased black carbon concentrations. J. Geophys. Res. Atmos. 122, 11462–11481. doi: 10.1002/2017JD027326
Tomita, H., Hihara, T., Kako, S. I., Kubota, M., and Kutsuwada, K. (2019). An introduction to J-OFURO3, a third-generation Japanese ocean flux data set using remote-sensing observations. J. Oceanogr. 75, 171–194. doi: 10.1007/s10872-018-0493-x
Yu, L. (2019). Global Air–Sea fluxes of heat, fresh water, and momentum: energy budget closure and unanswered questions. Annu. Rev. Mar. Sci. 11, 227–248. doi: 10.1146/annurev-marine-010816-060704
Yu, L., and Weller, R. A. (2007). Objectively analyzed Air–Sea heat fluxes for the global ice-free oceans (1981–2005). Bull. Am. Meteorol. Soc. 88, 527–540. doi: 10.1175/BAMS-88-4-527
Keywords: sensible heat, precipitation, CMIP6, atmospheric radiation budget, climate models
Citation: Myhre G, Jouan C, Stjern CW and Hodnebrog Ø (2024) Strong contribution from sensible heat to global precipitation increase in climate models is not supported by observational based data. Front. Clim. 6:1383337. doi: 10.3389/fclim.2024.1383337
Edited by:
Renata Goncalves Tedeschi, Vale Technological Institute (ITV), BrazilReviewed by:
Qianrong Ma, Yangzhou University, ChinaAngshuman Modak, Indian Institute of Technology Bombay, India
Copyright © 2024 Myhre, Jouan, Stjern and Hodnebrog. This is an open-access article distributed under the terms of the Creative Commons Attribution License (CC BY). The use, distribution or reproduction in other forums is permitted, provided the original author(s) and the copyright owner(s) are credited and that the original publication in this journal is cited, in accordance with accepted academic practice. No use, distribution or reproduction is permitted which does not comply with these terms.
*Correspondence: Gunnar Myhre, Z3VubmFyLm15aHJlQGNpY2Vyby5vc2xvLm5v