 Zijian Li
 Noah J. Planavsky2
 Christopher T. Reinhard
95% of researchers rate our articles as excellent or good
Learn more about the work of our research integrity team to safeguard the quality of each article we publish.
Find out more
ORIGINAL RESEARCH article
Front. Clim. , 16 August 2024
Sec. Carbon Dioxide Removal
Volume 6 - 2024 | https://doi.org/10.3389/fclim.2024.1380651
In an effort to mitigate anthropogenic climate impacts the U.S. has established ambitious Nationally Determined Contribution (NDC) targets, aiming to reduce greenhouse gas emissions by 50% before 2030 and achieving net-zero emissions by 2050. Enhanced rock weathering (ERW)—the artificial enhancement of chemical weathering of rocks to accelerate atmospheric CO2 capture—is now widely seen as a potentially promising carbon dioxide removal (CDR) strategy that could help to achieve U.S. climate goals. Grinding rocks to smaller particle size, which can help to facilitate more rapid and efficient CO2 removal, is the most energy-demanding and cost-intensive step in the ERW life cycle. As a result, accurate life cycle analysis of ERW requires regional constraints on the factors influencing the energetic and economic demands of feedstock grinding for ERW. Here, we perform a state-level geospatial analysis to quantify how carbon footprints, costs, and energy demands vary among regions of the coterminous U.S. in relation to particle size and regional electricity mix. We find that CO2 emissions from the grinding process are regionally variable but relatively small compared to the CDR potential of ERW, with national averages ranging between ~5–35 kgCO2 trock−1 for modal particle sizes between ~10–100 μm. The energy cost for feedstock grinding also varies regionally but is relatively small, with national average costs for grinding of roughly 0.95–5.81 $ trock−1 using grid mix power and 1.35–8.26 $ trock−1 (levelized) for solar PV for the same particle size range. Overall energy requirements for grinding are also modest, with the demand for grinding 1 Gt of feedstock representing less than 2% of annual national electricity supply. In addition, both cost and overall energy demand are projected to decline over time. These results suggest that incorporating feedstock grinding into ERW deployment at scale in the coterminous U.S. should generally have only modest impacts on lifecycle emissions, cost-effectiveness, and energy efficiency.
The most recent Intergovernmental Panel on Climate Change’s (IPCC) Sixth Assessment Report (IPCC, 2022) definitively demonstrates that immediate and deep reductions in greenhouse gas (GHG) emissions are needed to limit global warming since the preindustrial period to well below 2°C (Framework Convention on Climate Change, 2015; IPCC, 2018). For instance, achieving a goal of 1.5°C warming at end of century will require at least halving global GHG emissions by 2030 and realizing net-zero emissions globally by 2050 (IPCC, 2022). Meeting these goals will require a range of mitigation actions such as decarbonizing the global energy sector, optimizing agricultural systems and land management practices, and curbing non-CO2 greenhouse gas emissions. There is increasing acceptance that intentional carbon dioxide removal (CDR) will also be required in order to mitigate the impacts of so-called “hard-to-abate” sectors and achieve net-zero emissions (IPCC, 2014, 2018; Fuss et al., 2014; NRC, 2015; Williamson, 2016; Fuss et al., 2018; National Academies of Sciences, 2019). A range of CDR strategies with different sequestration potentials and downstream impacts have been proposed, including direct air carbon capture and storage (DACCS), bioenergy with carbon capture and storage (BECCS), biochar, soil organic carbon sequestration, afforestation/reforestation, terrestrial enhanced rock weathering (ERW), and a series of ocean-based CDR techniques that are at present largely at the concept stage (Bach et al., 2019; National Academies of Sciences, 2019; Beerling et al., 2020; Bertram and Merk, 2020; National Academies of Sciences, 2022).
In terrestrial ERW, crushed silicate rock (e.g., basalt) is spread over the land surface, which is meant to speed up natural carbon dioxide sequestration through solubility trapping of atmospheric CO2 as dissolved inorganic carbon and the eventual formation of carbonate minerals in marine sediments (Smith et al., 2019). When deployed on managed lands—and in particular row crop agricultural systems—ERW has a range of potential co-benefits and may improve soil quality, fertility, and crop yield (Kantola et al., 2017; Beerling et al., 2018). Base cation (e.g., Ca2+, Mg2+) and alkalinity export to coastal marine systems may also help to mitigate ongoing anthropogenic ocean acidification (Taylor et al., 2016). Although the global CDR potential of ERW is not well-constrained, existing estimates suggest the potential for CDR at the gigaton scale (Beerling et al., 2020).
However, bringing ERW to scale will require detailed analysis of potential environmental risks and technical/economic feasibility upstream of the development of socially acceptable and economically realistic deployment practices (e.g., Dietzen et al., 2018; Amann and Hartmann, 2019). Although several initial global technoeconomic and environmental analyses of ERW now exist (Moosdorf et al., 2014; Montserrat et al., 2017; Beerling et al., 2018, 2020; Fuss et al., 2018; Strefler et al., 2018; Eufrasio et al., 2022), there is also strong impetus for more detailed analysis of tradeoffs on a regional scale (Beerling et al., 2020; Kantzas et al., 2022) given geospatial heterogeneity in local climatology, feedstock supply, and the carbon intensity of energy. Indeed, countries that are projected to contribute the most to global CO2 emissions in the coming decades, including China, the United States, and India, may also have the greatest potential to sequester carbon via enhanced rock weathering on land (Beerling et al., 2020). There may thus be potential in some cases for relatively tight coupling of incentives to push large-scale deployment on regional scales.
Grinding of feedstock for ERW to smaller particle size distributions increases specific surface area for reaction and can dramatically increase both the rate and overall efficiency of CDR per unit mass of feedstock. However, feedstock grinding is potentially the most energy-and emissions-intensive component of deploying ERW at scale (Fuss et al., 2018; Strefler et al., 2018). Here, we perform a geospatial analysis of the costs, life cycle emissions, and energy demand associated with feedstock grinding for ERW in the coterminous United States. The results yield a starting point for more accurate life cycle analysis (LCA) and a better understanding of the economic and energy supply implications for design of at-scale deployment strategies for ERW in the U.S.
To quantitatively assess the cost and energy demand of feedstock grinding in the U.S., we compile existing plant-and state-level data on net electricity generation, carbon intensity of energy (e.g., the amount of CO2 emitted per unit energy produced), industrial electricity price, and levelized cost of electricity (LCOE) for utility-scale solar photovoltaic (PV) power (IRENA, 2019; EIA, 2019a,b,c,d; Solargis, 2020). We focus on data for 2018, as this represents the latest comprehensive dataset for grid-related CO2 emissions and LCOE of PV. Our analysis focuses on the 48 contiguous U.S. states, excluding Alaska and Hawaii. The cost and logistical demand of feedstock supply beyond the contiguous states, together with the limited areal footprint of Hawaii and the exceptionally low weathering potential of Alaska, render an analysis of ERW deployment in these regions beyond the scope of our analysis.
The critical parameters for our analysis include: (1) net electricity generation, defined as the amount of gross electricity produced by generators minus electricity used for operating power plants; (2) the carbon intensity of grid electricity, defined as the ratio of electricity-related CO2 emissions to electricity produced (e.g., kgCO2 per kWh of energy produced); (3) industrial electricity price; and (4) the levelized cost of electricity (LCOE) for utility-scale solar PV power. Levelized cost provides a measure of the average net present cost of electricity generated from a solar photovoltaic power plant over its lifetime (Branker et al., 2011). All of these parameters vary significantly by region (see Supplementary materials S1, S2).
In our analysis LCOE is formulated commensurate with large-scale ground-mounted solar PV power plants (Equation 1) according to (IRENA, 2019):
where n denotes the lifetime of the PV system, CAPEXt is the capital investment expenditures in year t, OPEXt represents the operation and maintenance expenditures in year t, PVOUTt is the electricity generation by PV (in the unit of specific yield kWh kWp−1, meaning kilowatt-hours generated per kilowatt-peak) in year t, and d is the discount rate used interchangeably with weighted average cost of capital (WACC). We assume an operational lifetime of 25 years based on linear PV performance degradation. The harmonized CAPEX value of a U.S. utility-scale PV power plant for the year 2018 is 1,549 $ kWp-1 30, which considers inflation but excludes local incentives. We adopt a nationwide OPEX value of 15 $ kWp−1 yr.−1, aligning with existing estimates for utility-scale PV projects (Bolinger et al., 2015). The discount rate d (or WACC) takes the value of 7.5% for the OECD countries including the U.S., which is calculated with both share and cost of equity and debt (IRENA, 2019).
For a fixed rock type, the particle size distributions of the initial feedstock and the end product will determine the energy required for feedstock grinding. We parameterize the energy demand of feedstock grinding by fitting to previously published simulations from the comminution software JKSimMet (Moosdorf et al., 2014), which correlate grinding energy with specific surface area (SSA) and SSA with the particle size distribution of the feedstock. The latter is described via a particle size P80, defined as the particle size below which 80% of the feedstock mass will pass when screened.
The relationship between grinding energy (GE in kWh trock−1) and specific surface area (SSA in m2 g−1) from the comminution simulations can be fitted with a polynomial function (R2 = 0.9631; Figure 1A) according to:
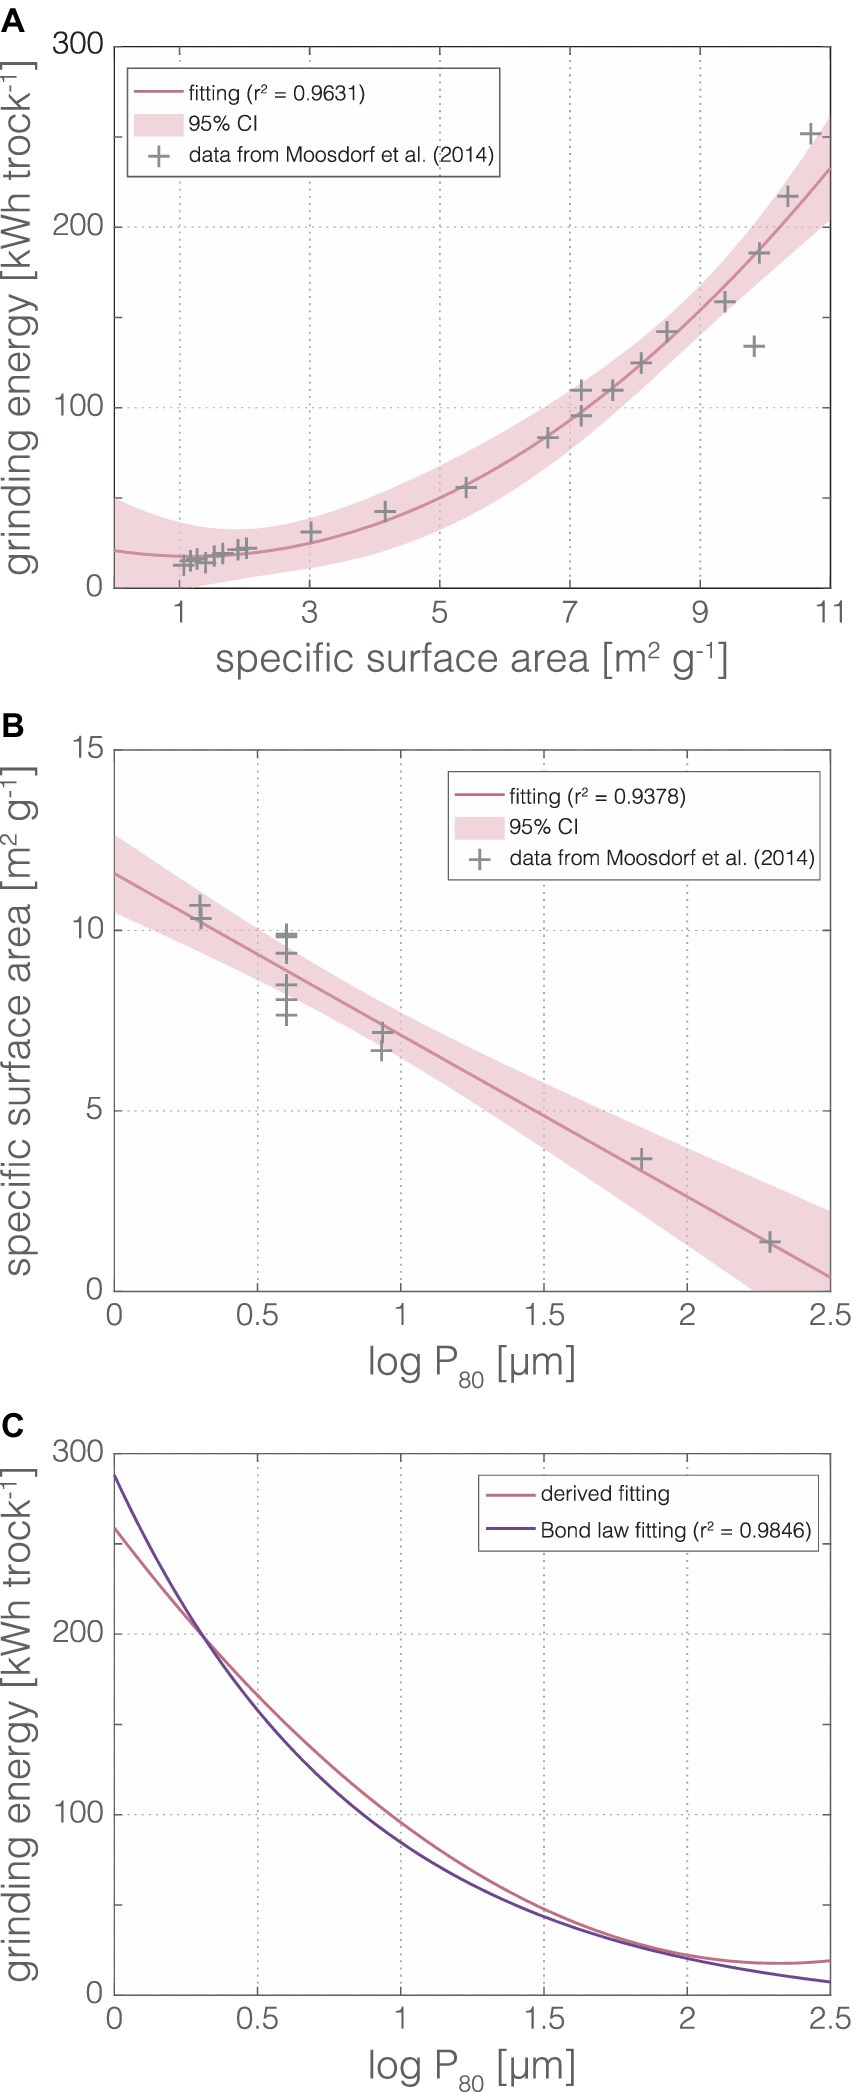
Figure 1. Operational relationships between grinding energy and specific surface area (A), specific surface area and log-scale product particle size [P80; (B)], and grinding energy and log-scale product particle size [P80; (C)] used in our geospatial analysis. The parameters of each fitting are summarized in Supplementary Table S2.
The relationship between specific surface area and the log P80 of the product feedstock (in μm) can be fitted with a linear model (R2 = 0.9631; Figure 1B) according to:
Combining these fits results in an empirical relationship between grinding energy and the particle size distribution of the product feedstock (Figure 1C).
An alternative approach that also incorporates the potential for variation in the particle size distribution of the starting feedstock is the conventional Bond law (Bond, 1961), defined according to:
where W is the necessary energy input for grinding (in kWh trock−1), Wi is the Bond work index of the rock (in kWh trock−1), and F80 is the particle size below which 80% of the initial feedstock grains pass when screened. Prescribing an F80 value of 1,000 μm and a Bond work index of Wi = 29.75 kWh trock−1 yields an R2 = 0.9846 when fit against the comminution simulation fits given by Equations 2, 3 (Figure 1C; see Supplementary Table S2 for fitted parameters).
In what follows, we use the Bond law formulation together with geospatial data on electricity production, energy cost, and carbon intensity to estimate the cost and energy demand associated with grinding ERW feedstock to a range of final particle sizes. We focus on scenario in which the source feedstock particle size index (F80) is 300 μm, which we refer to here as our ‘waste fine’ scenario. Waste fines from aggregate quarrying of basalt are an ideal feedstock for ERW, as they are relatively low-cost, have high surface reactivity and capture potential, and circularize a waste stream produced in aggregate production. The selection of 300 μm for the particle size of waste fines is based on a substantial amount of aggregate fines, construction and demolition wastes (CDW), cement particles, and steel slag having grain size no larger than 300 μm (Zhang, 2011; De Rossi et al., 2019; Ragipani et al., 2019; Huo et al., 2022). However, it is possible that the supply of waste fines will become limiting if ERW is deployed on large scales, such that materials with larger initial particle sizes may be required to support potential demand. We thus also compare our salient results from the “waste fine” scenario to a “coarse aggregate” scenario in which the source feedstock F80 is an order of magnitude larger (3 mm) (Zhang et al., 2019) (see Supplementary material S4).
We calculate the amount of carbon dioxide emitted during the process of feedstock grinding as a result of electricity consumption (in kgCO2 trock−1) by multiplying the carbon intensity of a given energy source by the unit energy consumption associated with feedstock grinding. Since a universal value of unit grinding energy (derived from our parameterized Bond law) is adopted for all states, the geographical pattern of carbon footprint is linked most strongly to regional variation in the carbon intensity of the energy mix (Figure 2 and Supplementary Figure S1). Predictably, emissions increase with diminishing final particle size due to the higher energy requirement of comminuting feedstock to finer particle sizes (Figure 2). The CO2 emissions associated with feedstock grinding for the coterminous U.S. range from 0.18 to 71.36, 0.06 to 23.10, and 0.03 to 11.67 kgCO2 trock−1 for feedstock particle sizes (P80 values) of 10, 50, and 100 μm, respectively, with corresponding national average values of 34.24, 11.08, and 5.60 kgCO2 trock−1 (Figure 2 and Supplementary Table S4). The states with relatively low grinding-based CO2 emissions are clustered in the Northeast and Pacific Northwest (Figure 2), the latter of which are proximate to significant basalt rock reserves (e.g., Columbia River Basalt and Modoc Plateau Basalt) which would minimize carbon penalties associated with feedstock transport. In any case, the CO2 emissions associated with grinding estimated here are much less than the carbon capture efficiency (RCO2) of conventional ERW feedstocks. For instance, the RCO2 value of basalt is ~300 kgCO2 trock−1 (Strefler et al., 2018), which is roughly an order of magnitude larger than the national average per-ton emissions of grinding feedstock down to a P80 of 10 μm (Figure 2A).
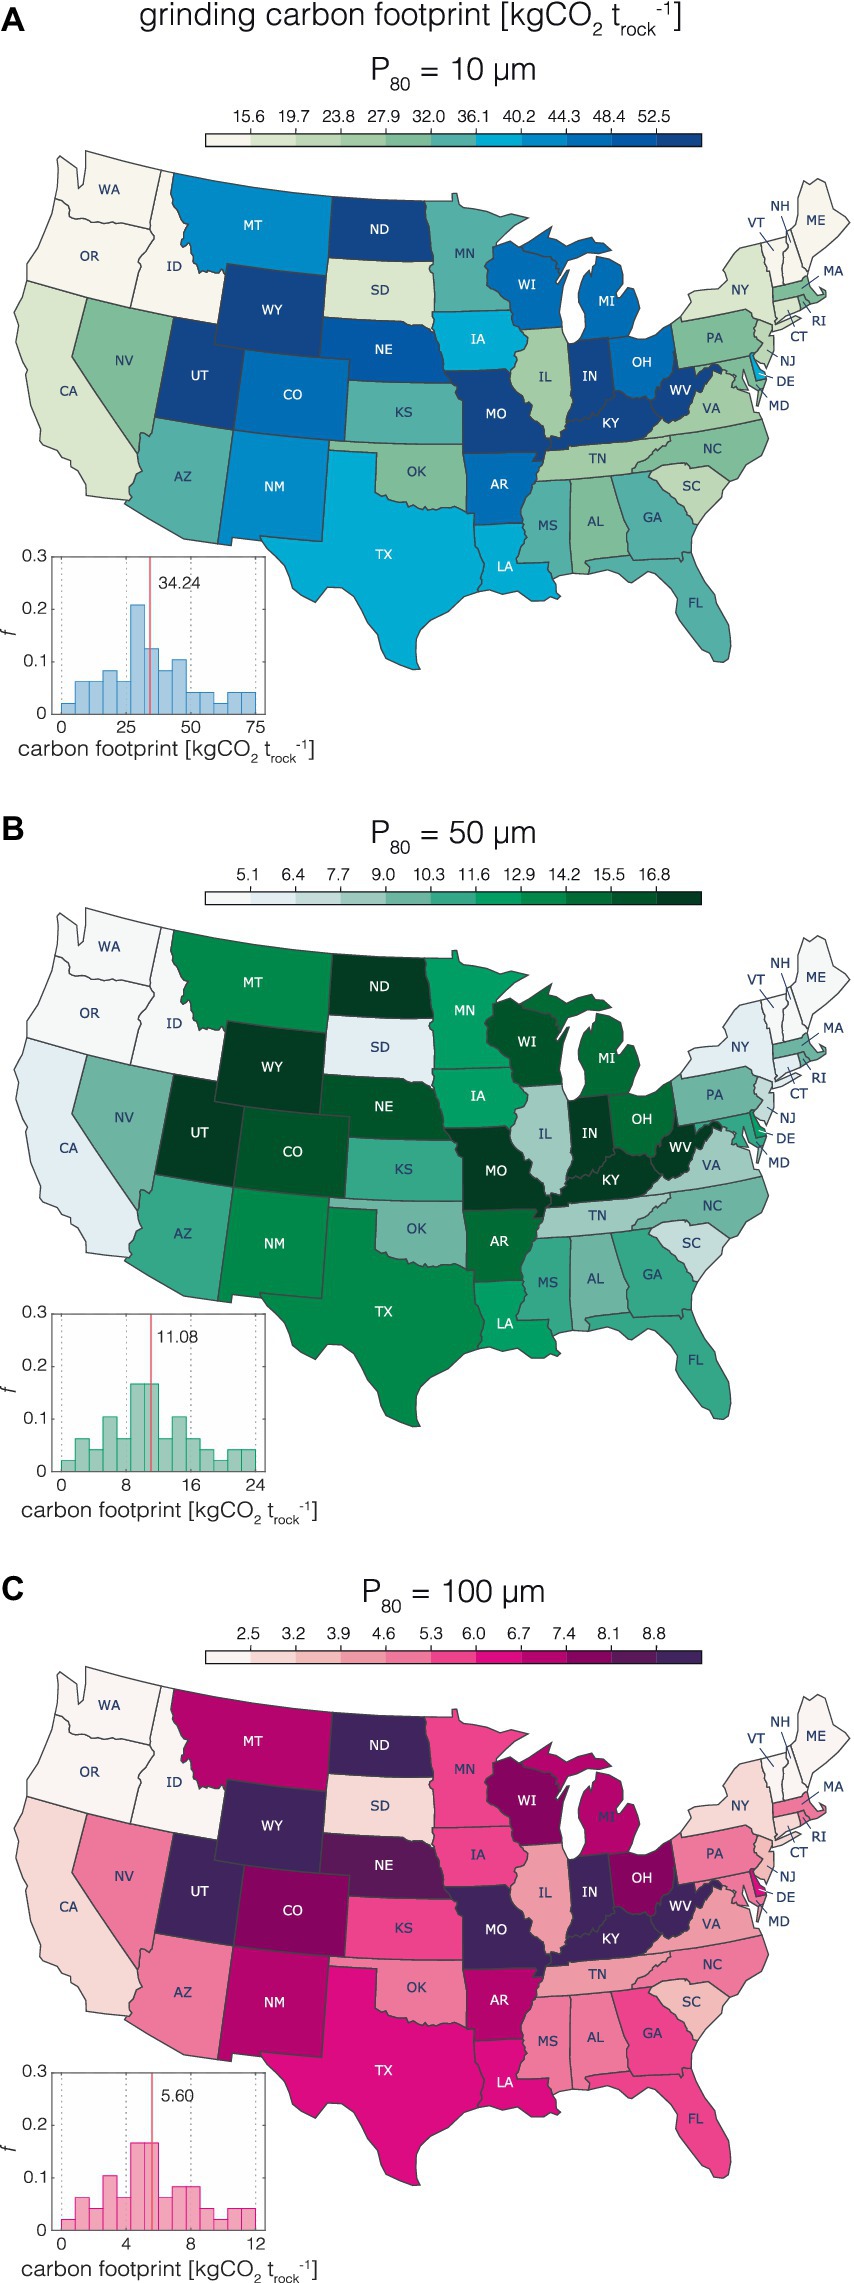
Figure 2. State-level map and histogram of lifecycle CO2 emissions (in kgCO2 trock−1) of feedstock grinding operated on electrical grid for the coterminous U.S. Results are shown for the “waste fine” scenario (with the feed particle size F80 of 300 μm) and for product final particle sizes P80 of 10 μm (A), 50 μm (B), and 100 μm (C).
Although we focus here on grinding-based CO2 emissions calculated from annual average carbon intensity, we note that optimizing feedstock grinding based on seasonal and/or diurnal variation in carbon intensity could potentially reduce overall lifecycle impacts. Specifically, shifts in energy sources supplied to the power grid on seasonal and hourly timescales cause variations in electricity-related CO2 emissions. For instance, monthly fluctuations in carbon intensity for the U.S. electric power sector were on the order of ~10% (from April to July) in 2018 (Scott Institute for Energy Innovation, n.d.), which is ascribed to continuous variation in primary energy sources, transmission and in-plant loss (consumption), and plant operating time regulated by demand levels (EIA, 2019d; Lee and Lee, 2021). Significant variation in the carbon intensity of energy also occurs on seasonal timescales. As a result, optimizing the timing of feedstock grinding for periods with low carbon intensity (and subsequent stockpiling for later deployment) could contribute to a non-trivial reduction in the life-cycle emissions of ERW application in the coterminous U.S.
The annual carbon intensity of U.S. electricity generation shows an overall downward trend (Scott Institute for Energy Innovation Power Sector Carbon Index, n.d.), which is implies a decreasing carbon footprint of feedstock grinding with time. Taking the U.S. carbon intensity in 2005 as a benchmark (0.6 kgCO2 kWh−1), carbon intensity drops 28.7% in 2018 and declines to a 38.7% reduction in 2020 (Scott Institute for Energy Innovation Power Sector Carbon Index, n.d.). This decrease in carbon intensity results from energy mix optimization, particularly the continued retirement of coal-fired power plants, which is driven in turn by environmental regulations aimed at reducing emissions (EIA, 2022). The share of natural gas-fired generation in the U.S. is projected to decrease slightly from 37% in 2021 to 34% in 2050 (EIA, 2022). According to forecasts from the U.S. Energy Information Administration (EIA), renewables are the fastest growing energy source (replacing coal), with the renewable share of the U.S. electricity generation mix projected to more than double from 21% in 2020 to 44% in 2050 (EIA, 2022). Wind is projected to contribute two thirds of the increase in renewable electric generation from 2020 to 2024, with the Inflation Reduction Act of 2022 (H.R.5376) extending the production tax credit (PTC) phaseout for wind to the end of 2024. At the same time, solar generation is projected to expand its share in U.S. electric capacity significantly from 7% in 2020 to 29% in 2050 and will transcend wind energy as the largest source of renewable generation by 2040. Collectively, renewables will surpass natural gas to become the leading pathway of electricity generation by 2030. It is expected that the carbon intensity and the resulting carbon footprint of grinding (operated on the grid) will continually decrease on a national scale with the U.S. electricity mix transitioning to less fossil-based energy [from 60% in 2020 to 44% in 2050 according to some estimates (EIA, 2022)].
The grinding cost in this study refers specifically to the cost of electricity for powering milling machines (in $ trock−1), which is the product of electricity consumption (in kWh trock−1) and the prevailing industrial electricity price/LCOE of PV (in $ kWh−1). Assuming an identical energy efficiency of grinding for all milling plants (as derived from our fitting of JKSimMet simulation data (Moosdorf et al., 2014); see Supplementary Table S3 for energy requirement values), the electricity demand for grinding feedstock to a given fixed particle size (both source and product) is independent of location. Hence, the geographical differences in grinding cost can be attributed exclusively to regional variations in the overall price of electricity.
For our ‘waste fine’ scenario (F80 = 300 μm), the costs of grinding operated on the electric grid range from 3.63 to 11.84, 1.18 to 3.83, and 0.59 to 1.94 $ trock−1 for feedstock particle sizes (P80) of 10, 50, and 100 μm, with a national average of 5.81, 1.88, and 0.95 $ trock−1, respectively (Figures 3A,C,E and Supplementary Table S5). In comparison, the costs of grinding powered by autonomous solar PV range from 6.55 to 9.48, 2.07 to 3.07, and 1.07 to 1.55 $ trock−1 for product particle size of 10, 50, and 100 μm, with the U.S. mean of 8.26, 2.67, and 1.35 $ trock−1, respectively (Figures 3B,D,F and Supplementary Table S5). The average grinding cost for autonomous solar PV is ~42% higher than that for the grid but with a lower variance (Figure 3), which results from the higher overall price but more narrow range in the LCOE of autonomous solar PV across states relative to the industrial electricity tariff (Supplementary Figures S1C,D).
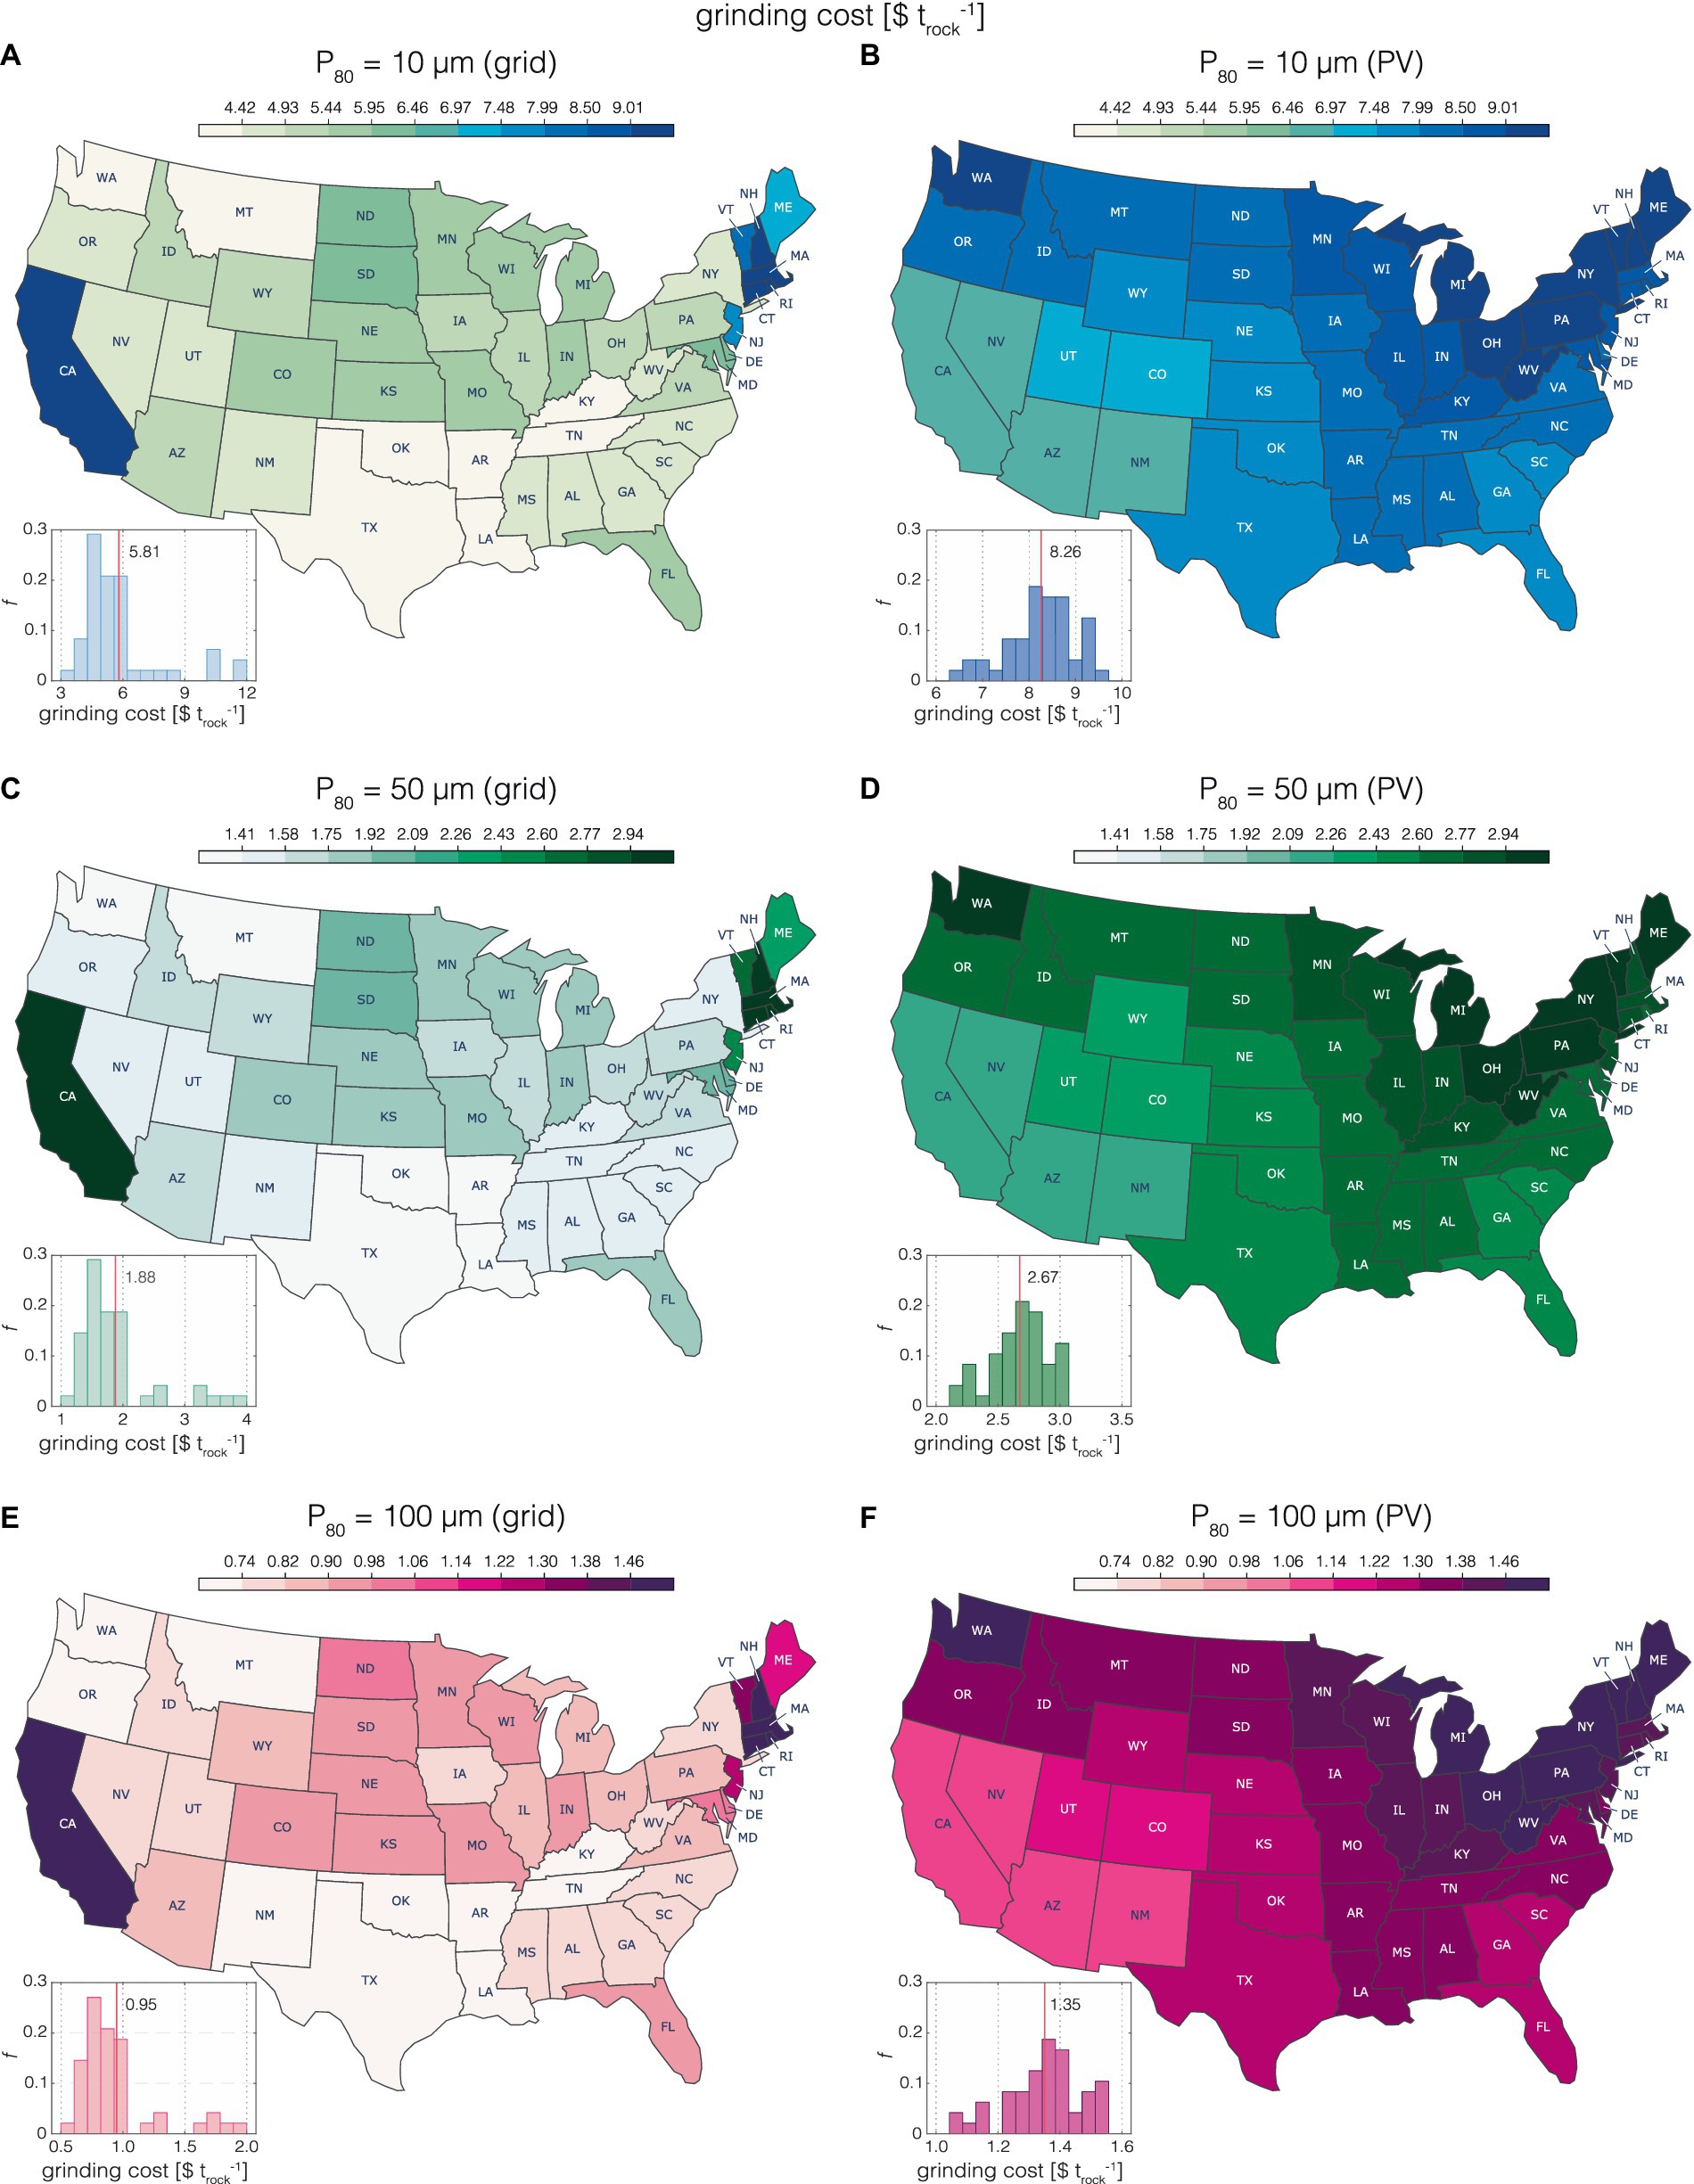
Figure 3. State-level map and histogram of grinding cost powered by the electrical grid (A,C,E) and autonomous solar PV (B,D,F) for the coterminous U.S. Results are shown for the “waste fine” scenario (with the feed particle size F80 of 300 μm) and for product final particle sizes P80 of 10 μm (A,B), 50 μm (C,D), and 100 μm (E,F).
The state-level distribution pattern of grinding costs (for operation on both the grid and autonomous solar) resembles that of the corresponding electricity price. States with low grinding cost via grid power are located in the Northwest and Southeast, while California and some Northeastern states (e.g., Rhode Island, Massachusetts, Connecticut, and New Hampshire) have the most expensive cost of grinding on the grid. In comparison, the grinding costs via autonomous solar for mid-latitude western states (e.g., California, Nevada, Arizona, and New Mexico) are generally cost-competitive. An increasing trend of grinding cost is observed from southwest to northeast (Figures 3B,D,F), which is directly attributed to the geographical distribution of the LCOE of PV. Although feedstock grinding conducted on the electric grid is more cost-effective on a national average basis (Figure 3), the selection of energy source for grinding should be based on the comparative cost advantage of the two electricity supply systems at a state level. For instance, the operational cost of grinding powered by autonomous solar PV in California is around 32% cheaper than that operated on the grid (Figure 3).
Our economic assessment of grinding is comparable with cost estimates in previous studies. Strefler et al. (2018) reported the energy costs of grinding range from 3.26 to 38.8 and 0.38 to 7.75 $ trock−1 for feedstock grain sizes of 10 and 50 μm, with national average costs of 10.9 and 1.67 $ trock−1, respectively, taking a 30-year mean of the regional median electricity price of 8.57 ¢ kWh−1 (which falls between the industrial electricity price and the LCOE of PV in this study). Our estimated costs of feedstock grinding operated on the grid (for P80 of 10 and 50 μm) fall within the range of their corresponding estimates but with small discrepancies. The national average cost in our analysis is roughly half of the best estimate reported in Strefler et al. (2018) for a P80 of 10 μm, and is slightly higher for a P80 of 50 μm, which can be attributed to differences in both electricity demand [127.78 kWh trock−1 for P80 of 10 μm and 19.44 kWh trock−1 for P80 of 50 μm in Strefler et al. (2018)] for grinding and variations in electricity price. Kantzas et al. (2022) estimates a process cost associated with feedstock grinding in the UK of £52–60 and £33–40 per tonne of CO2 captured for grain sizes (P80) of 10 and 100 μm, respectively. This is roughly equivalent to 16.01–19.01 $ trock−1 and 8.89–11.51 $ trock−1, based on the subtraction of other breakdown costs (e.g., CAPEX, OPEX, diesel fuel, and personnel) from the process cost and assuming a currency exchange rate of 1 British £ = 1.25 US $ and CO2 capture potential of 0.3 tCO2 trock−1 for UK-specific basalt feedstock. In any case, the electricity cost of grinding for both grid and autonomous solar PV in the U.S. is much cheaper than that in the UK, indicating the cost of feedstock grinding will not be a major unit cost barrier to extensive deployment of ERW in the coterminous U.S.
The U.S. industrial electricity price is projected to gradually decrease from 7.6 ¢ kWh−1 in 2018 to 6.3 ¢ kWh−1 in 2050 with a compound annual growth rate (CAGR) approximating −0.6% (EIA, 2022) (Supplementary Table S7), which will lead to ~17% reduction in electricity cost of grinding by 2050 compared to 2018. The decreasing trend of industrial electricity tariff is consistent with modelled projections for the UK (Kantzas et al., 2022). The projected drop in electricity price is ascribed to the continuous transition of electricity generation from fossil fuel-based to renewable-dominated (renewables consisting of 17% in 2018 and 44% in 2050). The LCOE (including tax incentives) for renewable power sources such as wind and solar PV is increasingly falling, making them cost-competitive with conventional generation technologies that burn fossil fuels, and this is expected to continue through the end of the century (IEA, 2020; EIA, 2022). In other words, the cost (OPEX) estimates for feedstock grinding provided here very likely represent maximum values and the overall cost of feedstock grinding on the grid should decrease over time.
The cost of grinding powered by autonomous solar PV is also projected to decline substantially in the U.S. over the coming years, rendering solar PV electric supply system a promising potential alternative to the grid. The U.S. weighted-average LCOE of utility-scale solar PV has fallen by 66% in the last decade, from 20.15 ¢ kWh−1 in 2010 to 6.77 ¢ kWh−1 in 2019 (IRENA, 2020). This dramatic reduction is primarily driven by decreases in module prices (have fallen by 57% since 2013) together with other soft costs including installation expenditures (have declined by 77% since 2010) (IRENA, 2020). A 7% year-on-year decline in LCOE of autonomous solar PV from 2019 is estimated for the U.S., based on solar incentives [30% investment tax credit (ITC) through 2023 (EIA, 2022)] along with technology cost reduction (Bolinger et al., 2020; Walker et al., 2020), module and capacity improvement (Bolinger et al., 2019; EIA, 2020), and manufacturing optimization (IRENA, 2020). Projections suggest that the LCOE of utility-scale solar PV is likely to drop down to 2.8–4.1 ¢ kWh−1 (Lazard, 2021). Together with projections for industrial electricity price, the falling electricity cost of grinding will further help to reduce the unit costs for at-scale deployment of ERW in the U.S.
As for carbon emissions (see above) electricity prices (both industrial and utility-scale solar PV) can vary significantly by locality and over short-term time scales, which affords opportunities to minimize the cost of grinding operations via prioritization of site and time. The availability of power plants and fuels, local fuel costs, solar radiation and PV system costs, and pricing regulations determine the electricity price of a region. Though to a lesser degree compared to the residential and commercial sectors, industrial electricity price of the U.S. has seasonal variations with more expensive price occurring in summer [increasing by 11.5% between April and July in 2018 (EIA, 2018)] as a result of supply and demand control and time-variable pricing. Therefore, spring and fall are economically optimal seasons to conduct feedstock grinding that is powered by electric grid. Solar PV will also be characterized by significant diurnal and seasonal variations in electricity generation. The operation of feedstock grinding with solar power during high-production times (daytime and months with strong solar radiation) is likely to lower overall electricity cost, as PV excess can be stored for later use or sold to electric company for compensating the grinding cost. This impact could be gradually deepened with solar PV forecasted to enlarge its share in the electricity generation mix over time (EIA, 2022).
We can assess the overall energy demand of rock grinding by estimating the percentage of net electricity production of each state required for grinding one million ton (Mt) of rock (in % Mtrock−1). For our “waste fine” scenario (F80 = 300 μm), the energy demand of grinding feedstock to the finest grain size considered here (P80 = 10 μm) has a national average of 0.26% (0.02–3.53%) Mtrock−1 (Figure 4A and Supplementary Table S6). The mean energy demand for grinding feedstock to particle sizes (P80) of 50 and 100 μm is 0.08% (0.01–1.14%) and 0.04% (0.00–0.58%) Mtrock−1, which are, respectively, 69 and 85% less than that of P80 = 10 μm scenario (Figures 4B,C), implying a significant impact of product grain size on overall energy consumption. The geospatial pattern of overall energy demand is similar to that of net electricity generation and inherits its signature of relatively large state-to-state variation (over one order of magnitude) (Figure 5 and Supplementary Figure S1A). States with high net electricity production (e.g., Texas, Florida, Pennsylvania, California, and Illinois) show commensurately low overall energy demand for processing a given volume of feedstock (Figure 4).
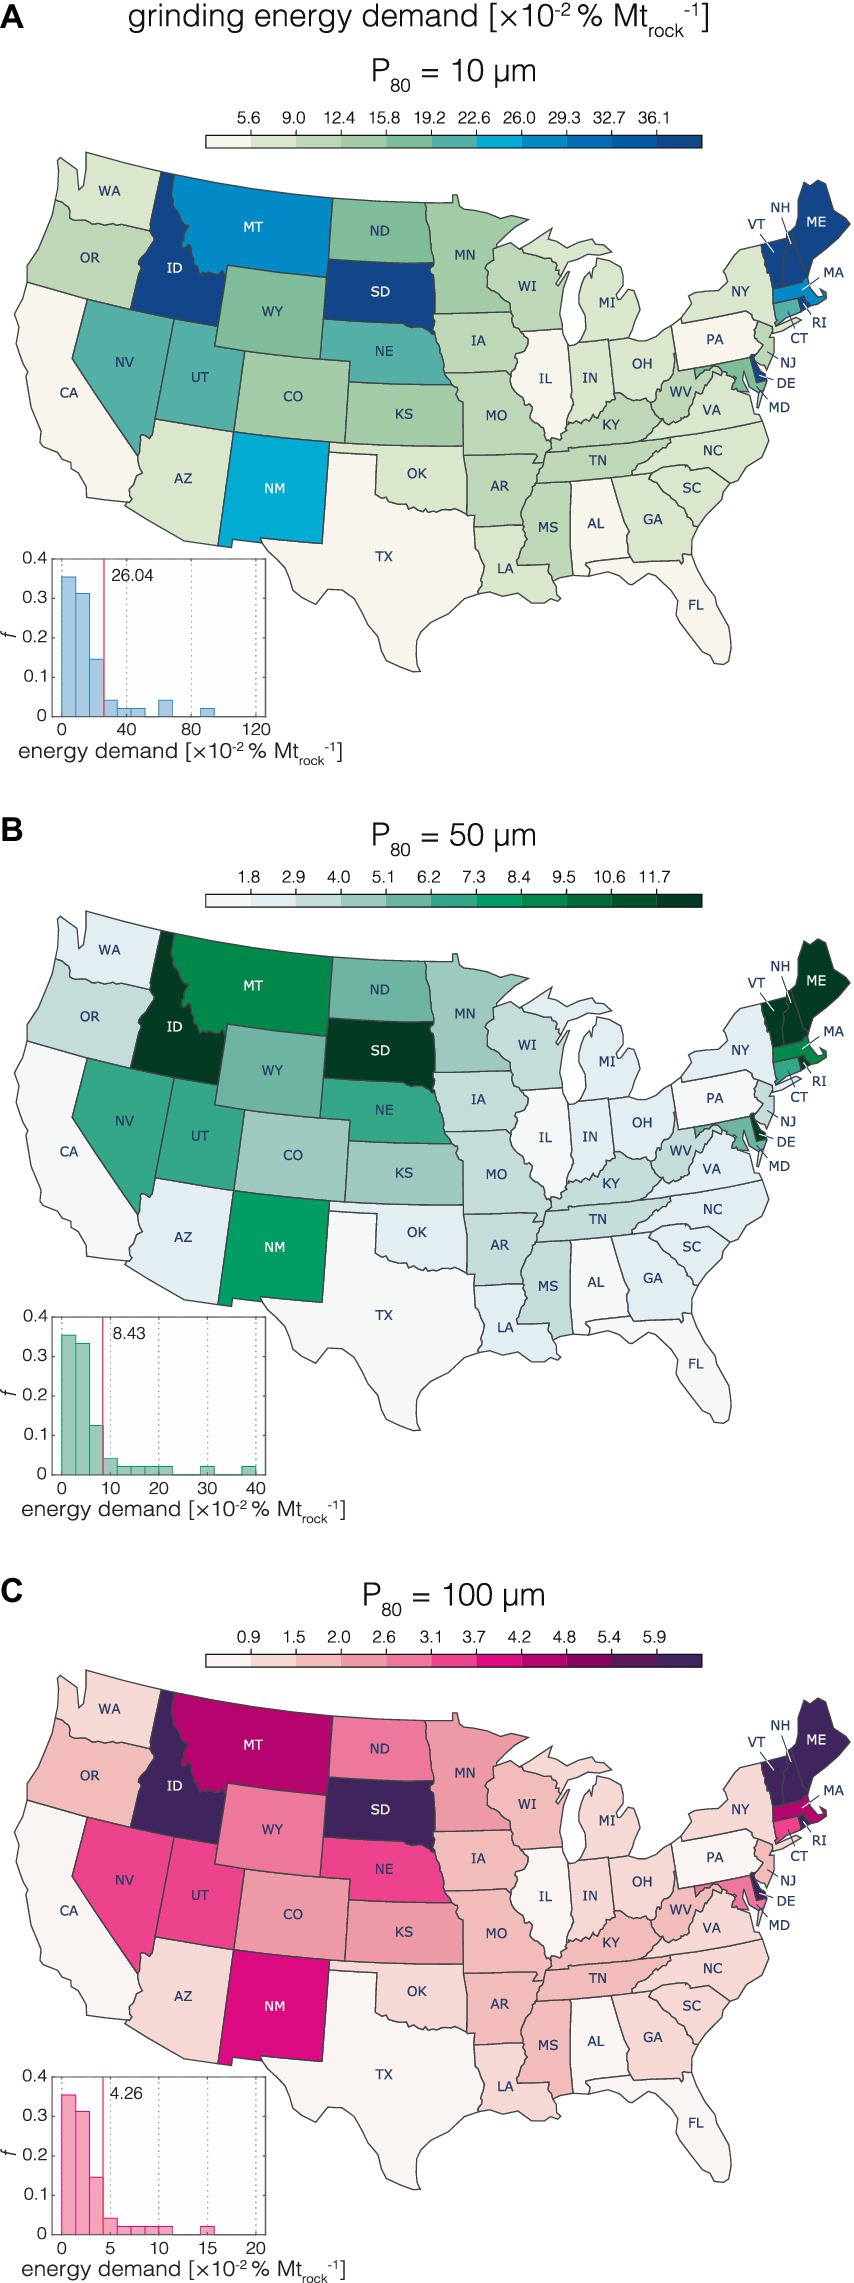
Figure 4. State-level map and histogram of percentage of annual grid electricity generation required for grinding 1 Mt. rock for the coterminous U.S. Results are shown for the “waste fine” scenario (with the feed particle size F80 of 300 μm) and for product final particle sizes P80 of 10 μm (A), 50 μm (B), and 100 μm (C).
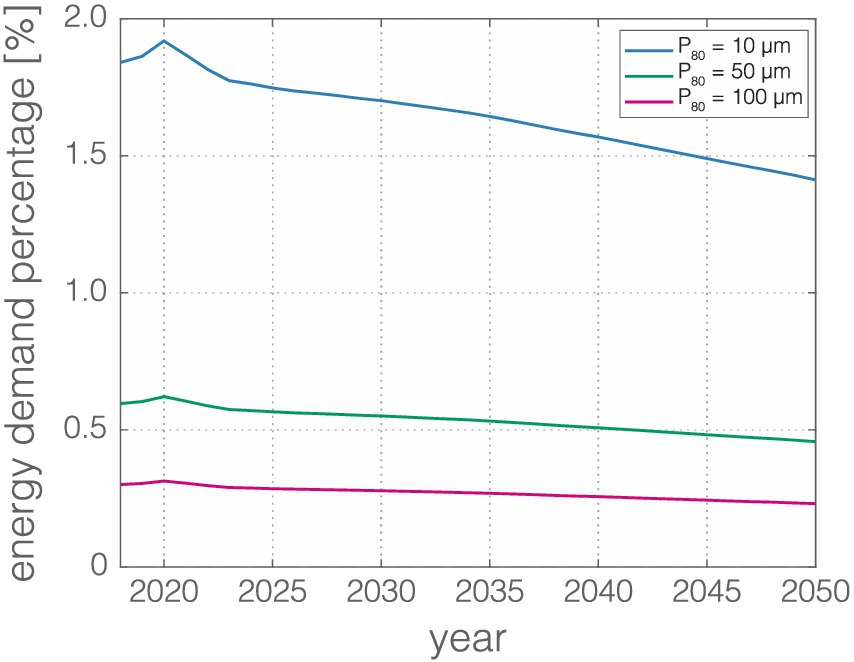
Figure 5. Time series of relatively overall electricity demand (denoted as percentage of annual national electricity supply) required for grinding 1 Gt rock in the U.S. Results are shown for the “waste fine” scenario (with the feed particle size F80 of 300 μm) across a range of final particle sizes.
The national average energy requirement for grinding 1 Gt rock in the U.S. is 1.84% of annual electricity generation in 2018 for a P80 of 10 μm (the values for P80 of 50 and 100 μm are 0.60 and 0.30%, respectively) (Figure 5 and Supplementary Table S6). In comparison, the projected percentage share of annual UK electricity supply required for grinding 166 Mt. rock (the scenario of the most ambitious basalt extraction rate) for P80 of 10 μm is 2.3–2.5% from 2050 to 2070 (Kantzas et al., 2022), which can be translated to 13.86–15.06% for grinding 1 Gt rock. This implies that relative overall energy demand is roughly one order of magnitude lower for the coterminous U.S. as it is in the UK for processing the same feedstock volume.
The time-series energy demand for rock grinding in the U.S. gradually decreases with time over the course of 32 years (except for 2020), declining by ~23% between 2018 and 2050 (Figure 5). This drop in the overall energy demand of feedstock grinding is attributable to the steady increase of U.S. electricity supply (~30% from 2018 to 2050) according to EIA projections (EIA, 2022) (Supplementary Table S7). The increase in grinding energy demand in 2020 compared to 2019, contrary to the overall decreasing trend, is caused by a 3% decline in U.S. electricity generation due to lockdown measures instituted during the COVID-19 pandemic (Jiang et al., 2021; Buechler et al., 2022). The electricity demand steadily recovered in 2021 as these measures gradually softened. The long-term increase in electricity supply over time is driven by expanding demand as a result of continuous economic and population growth combined with climate conditions (colder winters and warmer summers) and patterns of human activity. Additions to wind and solar generation capacity are responsible for the majority of the power generation increase with the rest contributed by slow growth in natural gas-fired generation (EIA, 2022).
It is anticipated that short-term (hourly, daily, and seasonal) variations in U.S. electricity consumption will cause relatively minor perturbations to the overall industrial electricity load for grinding. Unlike the residential and commercial sectors, industrial electricity use is more dependent on economic variables rather than weather-related factors (temperature and humidity) and variations in human activity. Industrial facilities usually run continuously (24 h) to meet manufacturing requirements or avoid ramp-up times, thus demand for electricity in the industrial sector rarely shows diurnal pattern (on-peak or off-peak hours). Since only a minor fraction of industrial electricity consumption is devoted to space heating and cooling, the seasonal pattern is less obvious with a small increase in summer (21.8% variation in industrial use as compared to 54.7% for residential and 27.6% for commercial) and almost no winter peak (EIA, 2013). However, some industries with seasonal manufacturing processes (e.g., cotton ginning, coffee, sugar) may cause fluctuations in the electricity load for grinding and the impact of this would vary regionally.
In any case, our results suggest that feedstock grinding for at-scale deployment of ERW in the coterminous U.S. would lead to relatively low overall relatively energy demand, minimizing any impacts of large-scale ERW deployment on energy security (Cox and Edwards, 2019). Indeed, an implicit assumption in our time-series forecast for grinding energy demand is that the energy efficiency of grinding remains constant. However, improvements in the operation efficiency of grinding via enhancing performance of mill technology and designing energy-efficient grinding circuits could further reduce the load of electricity for grinding.
Our geospatial assessment estimates the U.S. national average carbon footprint, cost, and relative overall energy demand of feedstock grinding operated on the grid to be 5.60–34.24 kgCO2 trock−1, 1.35–8.26 $ trock−1, and 0.04–0.26% Mtrock−1, respectively. These results suggest that feedstock grinding for deployment of ERW at scale in the coterminous U.S. has relatively low process CO2 emissions and is generally cost-effective and energy efficient. With projected declines in electricity price (both in the industrial sector of the grid and for LCOE of solar PV), the costs of grinding should become more competitive over time, while progressive decarbonization of the electrical grid should lead to further reductions in lifecycle CO2 emissions.
Moving forward, it will be important to analyze in more detail potential non-linearities in cost and lifecycle impacts with increasing scale. For example, compared to waste fines (F80 = 300 μm), coarse aggregates (F80 = 3 mm) consume 47.2% more energy for grinding initial feedstocks to the same product particle size (see Supplementary material). Although our analysis suggests that the overall impacts of grinding on lifecycle CO2 emissions, unit costs, and energy demand will still be modest in this case, there is significant uncertainty in the scale horizon at which feedstock sourcing will need to be sourced from courser starting materials. Regardless, our findings highlight the importance of joint consideration of feedstock availability (silicate waste fine production and course rock extraction) and local electricity mix for identifying optimal regions to operate feedstock processing.
In addition, regional variability in the cost effectiveness of feedstock processing may not overlap with the most active deployment regions. For example, in the autonomous PV case the region with the lowest feedstock processing costs overall (the Southwest; Figures 3B,D,F) is very unlikely to be a key region for ERW deployment given the background climate, hydrological, and soil conditions. Similarly, there is significant adjacent state-to-state variability in the carbon intensity of feedstock grinding across the Midwest (Figure 2), a region very likely to be central for attempts to scale ERW deployment. There is thus a need to evaluate end-to-end carbon intensity and technoeconomic impacts of feedstock transport in a regional context that are informed by realistic deployment scenarios (e.g., Lefebvre et al., 2019), which represents a critical topic for future work.
The original contributions presented in the study are included in the article/Supplementary material, further inquiries can be directed to the corresponding author.
ZL: Data curation, Formal analysis, Investigation, Methodology, Visualization, Writing – original draft, Writing – review & editing. NP: Investigation, Project administration, Writing – review & editing. CR: Conceptualization, Investigation, Methodology, Project administration, Supervision, Visualization, Writing – original draft, Writing – review & editing, Data curation, Formal analysis, Funding acquisition.
The author(s) declare that financial support was received for the research, authorship, and/or publication of this article. CTR and NJP would like to acknowledge funding from the U.S. Department of Energy EarthShot Program (Grant DE-SC0024709) and the Grantham Foundation.
The authors wish to acknowledge support from the Partnership for an Advanced Computing Environment (PACE) at the Georgia Institute of Technology and the Yale Center for Natural Carbon Capture (YCNCC).
The authors declare that the research was conducted in the absence of any commercial or financial relationships that could be construed as a potential conflict of interest.
All claims expressed in this article are solely those of the authors and do not necessarily represent those of their affiliated organizations, or those of the publisher, the editors and the reviewers. Any product that may be evaluated in this article, or claim that may be made by its manufacturer, is not guaranteed or endorsed by the publisher.
The Supplementary material for this article can be found online at: https://www.frontiersin.org/articles/10.3389/fclim.2024.1380651/full#supplementary-material
SUPPLEMENTARY MATERIAL S1 | Net electricity generation and carbon intensity.
SUPPLEMENTARY MATERIAL S2 | Industrial electricity price and LCOE of solar PV.
SUPPLEMENTARY MATERIAL S3 | Energy requirement of feedstock grinding.
SUPPLEMENTARY MATERIAL S4 | Impact of feed particle size (F80).
NDC, Nationally Determined Contribution; ERW, enhanced rock weathering; CDR, carbon dioxide removal; IPCC, Intergovernmental Panel on Climate Change; GHG, greenhouse gas; DACCS, direct air carbon capture and storage; BECCS, bioenergy with carbon capture and storage; LCA, life cycle analysis; LCOE, levelized cost of electricity/energy; PV, photovoltaic; CAPEX, capital expenditure; OPEX, Operational expenditure; PVOUT, PV power output; WACC, weighted average cost of capital; OECD, Organization for Economic Cooperation and Development; SSA, specific surface area; GE, grinding energy; CDW, construction and demolition waste; EIA, Energy Information Administration; PTC, production tax credit; CAGR, Compound annual growth rate.
Amann, T., and Hartmann, J. (2019). Ideas and perspectives: synergies from co-deployment of negative emission technologies. Biogeosciences 16, 2949–2960. doi: 10.5194/bg-16-2949-2019
Bach, L. T., Gill, S. J., Rickaby, R. E. M., Gore, S., and Renforth, P. (2019). CO2 removal with enhanced weathering and ocean alkalinity enhancement: potential risks and CO-benefits for marine pelagic ecosystems. Front. Clim. 1:1. doi: 10.3389/fclim.2019.00007
Beerling, D. J., Kantzas, E. P., Lomas, M. R., Wade, P., Eufrasio, R. M., Renforth, P., et al. (2020). Potential for large-scale CO2 removal via enhanced rock weathering with croplands. Nature 583, 242–248. doi: 10.1038/s41586-020-2448-9
Beerling, D. J., Leake, J. R., Long, S. P., Scholes, J. D., Ton, J., Nelson, P. N., et al. (2018). Farming with crops and rocks to address global climate, food and soil security. Nat. Plants 4, 138–147. doi: 10.1038/s41477-018-0108-y
Bertram, C., and Merk, C. (2020). Public perceptions of ocean-based carbon dioxide removal: the nature-engineering divide? Front. Clim. 2:2. doi: 10.3389/fclim.2020.594194
Bolinger, M., Seel, J., and Robson, D. (2019). Utility-scale solar: Empirical trends in project technology, cost, performance, and PPA pricing in the United States–2019 edition. Berkeley, CA (United States): Lawrence Berkeley National Lab (LBNL).
Bolinger, M., Seel, J., Robson, D., and Warner, C. (2020). Utility-scale solar data update (2020 edition). Berkeley, CA: Lawrence Berkeley National Lab (LBNL).
Bolinger, M., Weaver, S., and Zuboy, J. (2015). Is $50/MWh solar for real? Falling project prices and rising capacity factors drive utility-scale PV toward economic competitiveness. Prog. Photovolt. 23, 1847–1856. doi: 10.1002/pip.2630
Branker, K., Pathak, M. J. M., and Pearce, J. M. (2011). A review of solar photovoltaic levelized cost of electricity. Renew. Sust. Energ. Rev. 15, 4470–4482. doi: 10.1016/j.rser.2011.07.104
Buechler, E., Powell, S., Sun, T., Astier, N., Zanocco, C., Bolorinos, J., et al. (2022). Global changes in electricity consumption during COVID-19. iScience 25:103568. doi: 10.1016/j.isci.2021.103568
Cox, E., and Edwards, N. R. (2019). Beyond carbon pricing: policy levers for negative emissions technologies. Clim. Pol. 19, 1144–1156. doi: 10.1080/14693062.2019.1634509
De Rossi, A., Ribeiro, M. J., Labrincha, J. A., Novais, R. M., Hotza, D., and Moreira, R. F. P. M. (2019). Effect of the particle size range of construction and demolition waste on the fresh and hardened-state properties of fly ash-based geopolymer mortars with total replacement of sand. Process. Saf. Environ. Prot. 129, 130–137. doi: 10.1016/j.psep.2019.06.026
Dietzen, C., Harrison, R., and Michelsen-Correa, S. (2018). Effectiveness of enhanced mineral weathering as a carbon sequestration tool and alternative to agricultural lime: an incubation experiment. Int. J. Greenh. Gas Control 74, 251–258. doi: 10.1016/j.ijggc.2018.05.007
EIA (2019c). Annual electric power industry report, form EIA-861. Washington, DC: US Energy Information Administration.
EIA (2019d). U.S. Energy-Related Carbon Dioxide Emissions 2018. Washington, DC: US Energy Information Administration.
EIA (2020). Capital cost and performance characteristic estimates for utility scale electric power generating technologies. Washington, DC: US Energy Information Administration.
Eufrasio, R. M., Kantzas, E. P., Edwards, N. R., Holden, P. B., Pollitt, H., Mercure, J.-F., et al. (2022). Environmental and health impacts of atmospheric CO2 removal by enhanced rock weathering depend on nations’ energy mix. Commun. Earth Environ. 3:106. doi: 10.1038/s43247-022-00436-3
Framework Convention on Climate Change. (2015). Adoption of the Paris Agreement, 21st Conference of the Parties.
Fuss, S., Canadell, J. G., Peters, G. P., Tavoni, M., Andrew, R. M., Ciais, P., et al. (2014). Betting on negative emissions. Nat. Clim. Chang. 4, 850–853. doi: 10.1038/nclimate2392
Fuss, S., Lamb, W. F., Callaghan, M. W., Hilaire, J., Creutzig, F., Amann, T., et al. (2018). Negative emissions—part 2: costs, potentials and side effects. Environ. Res. Lett. 13:063002. doi: 10.1088/1748-9326/aabf9f
Huo, B., Luo, Y., Li, B., Chen, C., and Zhang, Y. (2022). Influence of particle size on the reactivity of chemical modified steel slag powder. J. Sustain. Cem.-Based Mater. 12, 62–70. doi: 10.1080/21650373.2021.2014368
IEA (2020). Projected costs of generating electricity −2020 edition. Paris: International Energy Agency.
IPCC. (2014) Climate Change: Mitigation of climate change. Contribution of working group III to the fifth assessment report of the intergovernmental panel on climate change, 2014, 1454, 147.
IPCC. (2018). Global warming of 1.5oC. An IPCC special report on the impacts of global warming of 1.5oC above pre-industrial levels and related global greenhouse gas emission pathways, in the context of strengthening the global response to the threat of climate change, sustainable development, and efforts to eradicate poverty. [In press].
IPCC (2022). Climate change 2022: Mitigation of climate change. Contribution of working group III to the sixth assessment report of the intergovernmental panel on climate change. Cambridge, UK and New York, NY, USA: IPCC.
IRENA (2019). Renewable power generation costs in 2018. Abu Dhabi: International Renewable Energy Agency.
IRENA (2020). Renewable power generation costs in 2019. Abu Dhabi: International Renewable Energy Agency.
Jiang, P., Fan, Y. V., and Klemeš, J. J. (2021). Impacts of COVID-19 on energy demand and consumption: challenges, lessons and emerging opportunities. Appl. Energy 285:116441. doi: 10.1016/j.apenergy.2021.116441
Kantola, I. B., Masters, M. D., Beerling, D. J., Long, S. P., and DeLucia, E. H. (2017). Potential of global croplands and bioenergy crops for climate change mitigation through deployment for enhanced weathering. Biol. Lett. 13:20160714. doi: 10.1098/rsbl.2016.0714
Kantzas, E. P., Val Martin, M., Lomas, M. R., Eufrasio, R. M., Renforth, P., Lewis, A. L., et al. (2022). Substantial carbon drawdown potential from enhanced rock weathering in the United Kingdom. Nat. Geosci. 15, 382–389. doi: 10.1038/s41561-022-00925-2
Lee, K. M., and Lee, M. H. (2021). Uncertainty of the electricity emission factor incorporating the uncertainty of the fuel emission factors. Energies 14:5697. doi: 10.3390/en14185697
Lefebvre, D., Goglio, P., Williams, A., Manning, D. A. C., de Azevedo, A. C., Bergmann, M., et al. (2019). Assessing the potential of soil carbonation and enhanced weathering through life cycle assessment: a case study for Sao Paulo state, Brazil. J. Cleaner Prod. 233, 468–481. doi: 10.1016/j.jclepro.2019.06.099
Montserrat, F., Renforth, P., Hartmann, J., Leermakers, M., Knops, P., and Meysman, F. J. (2017). Olivine dissolution in seawater: implications for CO2 sequestration through enhanced weathering in coastal environments. Environ. Sci. Technol. 51, 3960–3972. doi: 10.1021/acs.est.6b05942
Moosdorf, N., Renforth, P., and Hartmann, J. (2014). Carbon dioxide efficiency of terrestrial enhanced weathering. Environ. Sci. Technol. 48, 4809–4816. doi: 10.1021/es4052022
National Academies of Sciences (2019). Medicine, negative emissions technologies and reliable sequestration: A research agenda. Washington, DC: The National Academies Press, 510.
National Academies of Sciences (2022). Medicine, a research strategy for ocean-based carbon dioxide removal and sequestration. Washington, DC: The National Academies Press, 322.
NRC (2015). Climate intervention: carbon dioxide removal and reliable sequestration. Washington, DC: National Academies Press.
Ragipani, R., Bhattacharya, S., and Suresh, A. K. (2019). Kinetics of steel slag dissolution: from experiments to modelling. Proc. R. Soc. A 475:20180830. doi: 10.1098/rspa.2018.0830
Scott Institute for Energy Innovation. (n.d.) Power Sector Carbon Index. Available at: https://www.emissionsindex.org
Smith, P., Adams, J., Beerling, D. J., Beringer, T., Calvin, K. V., Fuss, S., et al. (2019). Land-management options for greenhouse gas removal and their impacts on ecosystem services and the sustainable development goals. Annu. Rev. Environ. Resour. 44, 255–286. doi: 10.1146/annurev-environ-101718-033129
Strefler, J., Amann, T., Bauer, N., Kriegler, E., and Hartmann, J. (2018). Potential and costs of carbon dioxide removal by enhanced weathering of rocks. Environ. Res. Lett. 13:034010. doi: 10.1088/1748-9326/aaa9c4
Taylor, L. L., Quirk, J., Thorley, R. M. S., Kharecha, P. A., Hansen, J., Ridgwell, A., et al. (2016). Enhanced weathering strategies for stabilizing climate and averting ocean acidification. Nat. Clim. Chang. 6, 402–406. doi: 10.1038/nclimate2882
Walker, H., Lockhart, E., Desai, J., Ardani, K., Klise, G., Lavrova, O., et al. (2020). Model of operation-and-maintenance costs for photovoltaic systems. Golden, CO: National Renewable Energy Lab (NREL).
Williamson, P. (2016). Emissions reduction: scrutinize CO2 removal methods. Nature 530, 153–155. doi: 10.1038/530153a
Zhang, H. (2011). Building materials in civil engineering. Sawston, United Kingdom: Woodhead Publishing.
Keywords: rock grinding, particle size, geospatial analysis, electricity cost, solar PV, energy demand
Citation: Li Z, Planavsky NJ and Reinhard CT (2024) Geospatial assessment of the cost and energy demand of feedstock grinding for enhanced rock weathering in the coterminous United States. Front. Clim. 6:1380651. doi: 10.3389/fclim.2024.1380651
Edited by:
Etsushi Kato, Institute of Applied Energy, JapanReviewed by:
Haifeng Liu, Tianjin University, ChinaCopyright © 2024 Li, Planavsky and Reinhard. This is an open-access article distributed under the terms of the Creative Commons Attribution License (CC BY). The use, distribution or reproduction in other forums is permitted, provided the original author(s) and the copyright owner(s) are credited and that the original publication in this journal is cited, in accordance with accepted academic practice. No use, distribution or reproduction is permitted which does not comply with these terms.
*Correspondence: Christopher T. Reinhard, Y2hyaXMucmVpbmhhcmRAZWFzLmdhdGVjaC5lZHU=
Disclaimer: All claims expressed in this article are solely those of the authors and do not necessarily represent those of their affiliated organizations, or those of the publisher, the editors and the reviewers. Any product that may be evaluated in this article or claim that may be made by its manufacturer is not guaranteed or endorsed by the publisher.
Research integrity at Frontiers
Learn more about the work of our research integrity team to safeguard the quality of each article we publish.