
95% of researchers rate our articles as excellent or good
Learn more about the work of our research integrity team to safeguard the quality of each article we publish.
Find out more
ORIGINAL RESEARCH article
Front. Clim. , 23 April 2024
Sec. Climate Adaptation
Volume 6 - 2024 | https://doi.org/10.3389/fclim.2024.1368456
This article is part of the Research Topic Coastal Climate Monitoring and Downscaling for Adaptation Planning in the Adriatic Sea View all 12 articles
 Leonardo Aragão1,2*
 Lorenzo Mentaschi1
 Nadia Pinardi1,2
 Giorgia Verri3
 Alfonso Senatore4
 Silvana Di Sabatino1
The present study reconstructs the river discharge climatology and its respective historical series for all rivers of the Adriatic Sea with averaged climatological daily river discharge above 1 m3s−1, to reach a better representation of the Adriatic rivers in hydrodynamic models and, consequently, to develop a more realistic freshwater balance in the different regions of the hydrographic basin. Based on the European Flood Awareness System (EFAS) data set, a careful method of identification and selection of the Adriatic rivers, followed by a rigorous assessment against observational data, was developed to evaluate the current state of the Adriatic river discharges and their respective trends throughout several climate indicators from 1991 to 2022. Observational data are limited to 85% of the identified rivers, totaling 98% of the overall freshwater input into the Adriatic Sea. The results confirm that the Shallow Northern Adriatic receives the largest freshwater inputs with a daily average exceeding 2,400 m3s−1, which amounts to 61% of the overall Adriatic discharges. Consequently, this region guides the freshwater seasonal cycle of the Adriatic Sea, which presents a well-defined pattern of two flood peaks in late autumn and late spring, separated by a minimum discharge period at mid-summer. From the Central to the Southern Adriatic subregions, the absence of snow-melting effects prevents the secondary flood peak during the spring, shaping the seasonal cycle of river discharges from a single flood peak in late autumn to a drought period in August. The 32 years of continuous river discharge data reveal a negligible trend in the overall Adriatic Sea but a negative trend for the last decade (2013–2022). This decadal decrease is driven by the extreme drought that drastically pounded the northern Adriatic in 2022.
The Mediterranean Sea is a semi-enclosed hydrological basin connected to the Atlantic Ocean through the relatively shallow Strait of Gibraltar and to the Black Sea through the Bosphorus and Dardanelles straits (Tanhua et al., 2013), making it a predominantly evaporative region whose surface water balance strongly depends on the precipitation regime and river discharges (Peixoto et al., 1982). Although the Mediterranean Sea’s watershed comprises other smaller seas, bays, deltas, and countless rivers, 62% of freshwater inputs originate in the Adriatic Sea, the Gulf of Lion, and the Aegean Sea. At the river level, according to Struglia et al. (2004), the primary contributions to Mediterranean discharge are from the Rhone, Po, and Nile Rivers (about 1700, 1,500, and 1,200 m3s−1, respectively). The Po River is the largest in the Adriatic basin and alone is responsible for 2/3 of the daily river discharges, which in extreme cases can exceed 10,000 m3s−1 as observed in 1951 in Pontelagoscuro, a hydrological station about 70 km from the Adriatic coast (Provini et al., 1992; Montanari, 2012).
Located in the central Mediterranean Sea, the Adriatic is also a semi-enclosed sea that experiences complex water circulation patterns, exchanging waters at the Strait of Otranto by horizontally separated two-layer flows (Cessi et al., 2014). The exchange is characterised by high salinity waters inflowing at the Otranto Strait eastern side and a surface fresher water outflow at the western Strait side (Verri et al., 2018; Vodopivec et al., 2022). These circulation patterns are both wind and thermohaline-driven, placing the unique hydrodynamics of the Adriatic Sea as the mainframe in shaping its diverse marine ecosystem, which makes it one of the three primary regions in dense water formation within the Mediterranean Sea and the one with the densest water (Artegiani et al., 1997; Vested et al., 1998; Vilibić and Supić, 2005; Querin et al., 2013). During the winter, the air-sea interactions produce different types of dense waters, some reaching even the deep waters of the Eastern Mediterranean Sea (Pinardi et al., 2023).
The positive water budget frames the Adriatic Sea as an estuarine basin, meaning precipitation and river runoffs exceed evaporation. However, in exceptional situations of large freshwater discharges from Po River, the dense water formation processes change the dynamics of the Adriatic Sea conveyor belt, decreasing the induced vertical circulation in amplitude (Verri et al., 2018). Therefore, the first step toward understanding the impacts of climate change on the Adriatic basin involves a reasonable estimate of river discharges and how much the freshwater supply has already changed in the last climatological period.
Since the 1970s, the hydrological balance of the Adriatic Sea has been the subject of several modelling studies regarding the thermohaline circulation (Sanchez-Gomez et al., 2011; Verri et al., 2018; Vodopivec et al., 2022), the formation of dense waters (Vested et al., 1998; Querin et al., 2013; Carniel et al., 2016; Vilibić et al., 2016), the basin biogeochemistry (Polimene et al., 2006; Lazzari et al., 2012; Mussap et al., 2016), the sea level extremes (Terrado et al., 2014; Ferrarin et al., 2019, 2023), and climate change trends (Gualdi et al., 2013; Coppola et al., 2014; Vezzoli et al., 2015; Vilibić et al., 2019; Denamiel et al., 2020; Dunić et al., 2023). Most of these studies use river discharges as climatological estimates based on time series data from Raicich (1996) and Ludwig et al. (2009) without considering exceptional periods of flooding and drought. Given its importance not only for hydrology but also for local society and economy, the Po River Basin’s vulnerability to climate change has been the target of several studies that explored the IPCC’s variety of future scenarios. According to Coppola et al. (2014), by the end of 2050, the seasonal cycle of river discharge in the Northern Adriatic Sea is expected to present the spring flood peak 1 month in advance due to earlier snow-melting in the Alpine and Apennine chains. Furthermore, the autumn discharge peak is expected to occur later, during the winter months, due to increasingly extended hydrological summer drought periods. In 2100, the Po River is projected to experience a severe reduction in discharge from May to November, whilst the rest of the year will see an increase of up to 60% due to changes in precipitation patterns and increasing heavy precipitation events. On the other hand, during summer, extreme drought levels will become more common and result in a significant water deficit (Vezzoli et al., 2015). Recent projections confirm these seasonal cycle trends to the end of the century and extend them to the other north Adriatic rivers, mainly those in the shallow north Adriatic Sea, which is currently experiencing substantial warming as indicated by observed temperature trends and is more sensitive to radiational increase expected in future climate (Vilibić et al., 2019; Dunić et al., 2023).
River discharge not only provides freshwater access to coastal ecosystems but also delivers an essential supply of nutrients that play a crucial role in regulating their hydrology, biogeochemistry, and productivity. The amount and timing of fresh water and nutrients provided by rivers can significantly influence the physical, chemical, and biological conditions of coastal ecosystems, affecting the growth and survival of species, the cycling of nutrients, and the ecosystem’s overall health (Ludwig et al., 2009; Cozzi et al., 2012). The northern Adriatic region experiences significant nutrient loads from various rivers, not only the Po, where this nutrient-rich environment leads to the development of a thriving phytoplankton community during the autumn and winter seasons (Zavatarelli et al., 1998). The high levels of nutrients in the water provide an ideal environment for these microscopic organisms to grow and thrive, which plays a crucial role in the overall health and productivity of the region’s aquatic ecosystem. Another relevant aspect of the river discharge in the Adriatic Sea regards its dilution basin characteristics, where rivers contribute to an average freshwater input gain of about 1 m year−1 (Artegiani et al., 1997). This balance is achieved since evaporation and precipitation almost offset each other, allowing the basin to maintain equilibrium (Raicich, 1996; Zavatarelli et al., 1998; Verri et al., 2018).
Inaccurate estimates of river discharges in a hydrological system as complex as the Adriatic Sea can lead to entirely different perceptions in all aspects discussed above. As demonstrated by Verri et al. (2018), a complete cessation of riverine freshwater loads has the potential to abruptly strengthen the Adriatic-Ionian anti-estuarine Thermohaline Cell (AITHC, Orlić et al., 2006). Otherwise, if the river discharge doubles, it may produce a positive buoyancy flow, sinking the net energy and, consequently, weakening the anti-estuarine circulation. According to Vilibić et al. (2016), the low quality of runoff climatologies limits the capability to represent the Adriatic Sea dynamics, where an overestimation of the riverine freshwater input may unreasonably reduce or prevent the local dense water formation.
Considering the lack of recent estimates of the Adriatic Sea river discharges, the main objective of the present study is to reconstruct the river discharge climatology and its respective historical series, not only for the principal rivers of the Adriatic Sea basin but for all rivers with average climatological discharges above 1 m3s−1. The analysis will be based on the European Flood Awareness System (EFAS) reconstructions from 1991 to 2022 and a careful method of identifying and selecting the Adriatic rivers, followed by a rigorous assessment against observational hydrological station data. Thus, it is expected that the new climatology of river discharge into the Adriatic Sea can contribute to a better representation of rivers in general circulation models and their biogeochemical counterparts and, consequently, construct a more realistic freshwater balance in the different regions of the hydrographic basin.
This section presents the study region and proposes its division into four subregions based on the geomorphology of the Adriatic basin. Then, the hydrological model used to estimate river discharges in the Adriatic Sea (EFAS) is described in detail, as well as the method of river identification and data extraction and assessment for each river considered. Finally, the climate indicators are defined to construct the climatology of river discharges at different spatial and temporal scales.
According to Artegiani et al. (1997), the Adriatic Sea can be divided into three subregions based on bathymetry measurements. The first, Southern Adriatic (SAd), starts in the Strait of Otranto (Figure 1), where the Adriatic Sea exchanges waters with the Mediterranean Sea through the Otranto Channel, extending ~350 km north up to Vieste, in the Gargano Peninsula. The SAd is the deepest subregion of the Adriatic, where the largest portion presents depths greater than 800 m, and the deepest point reaches 1,200 m.
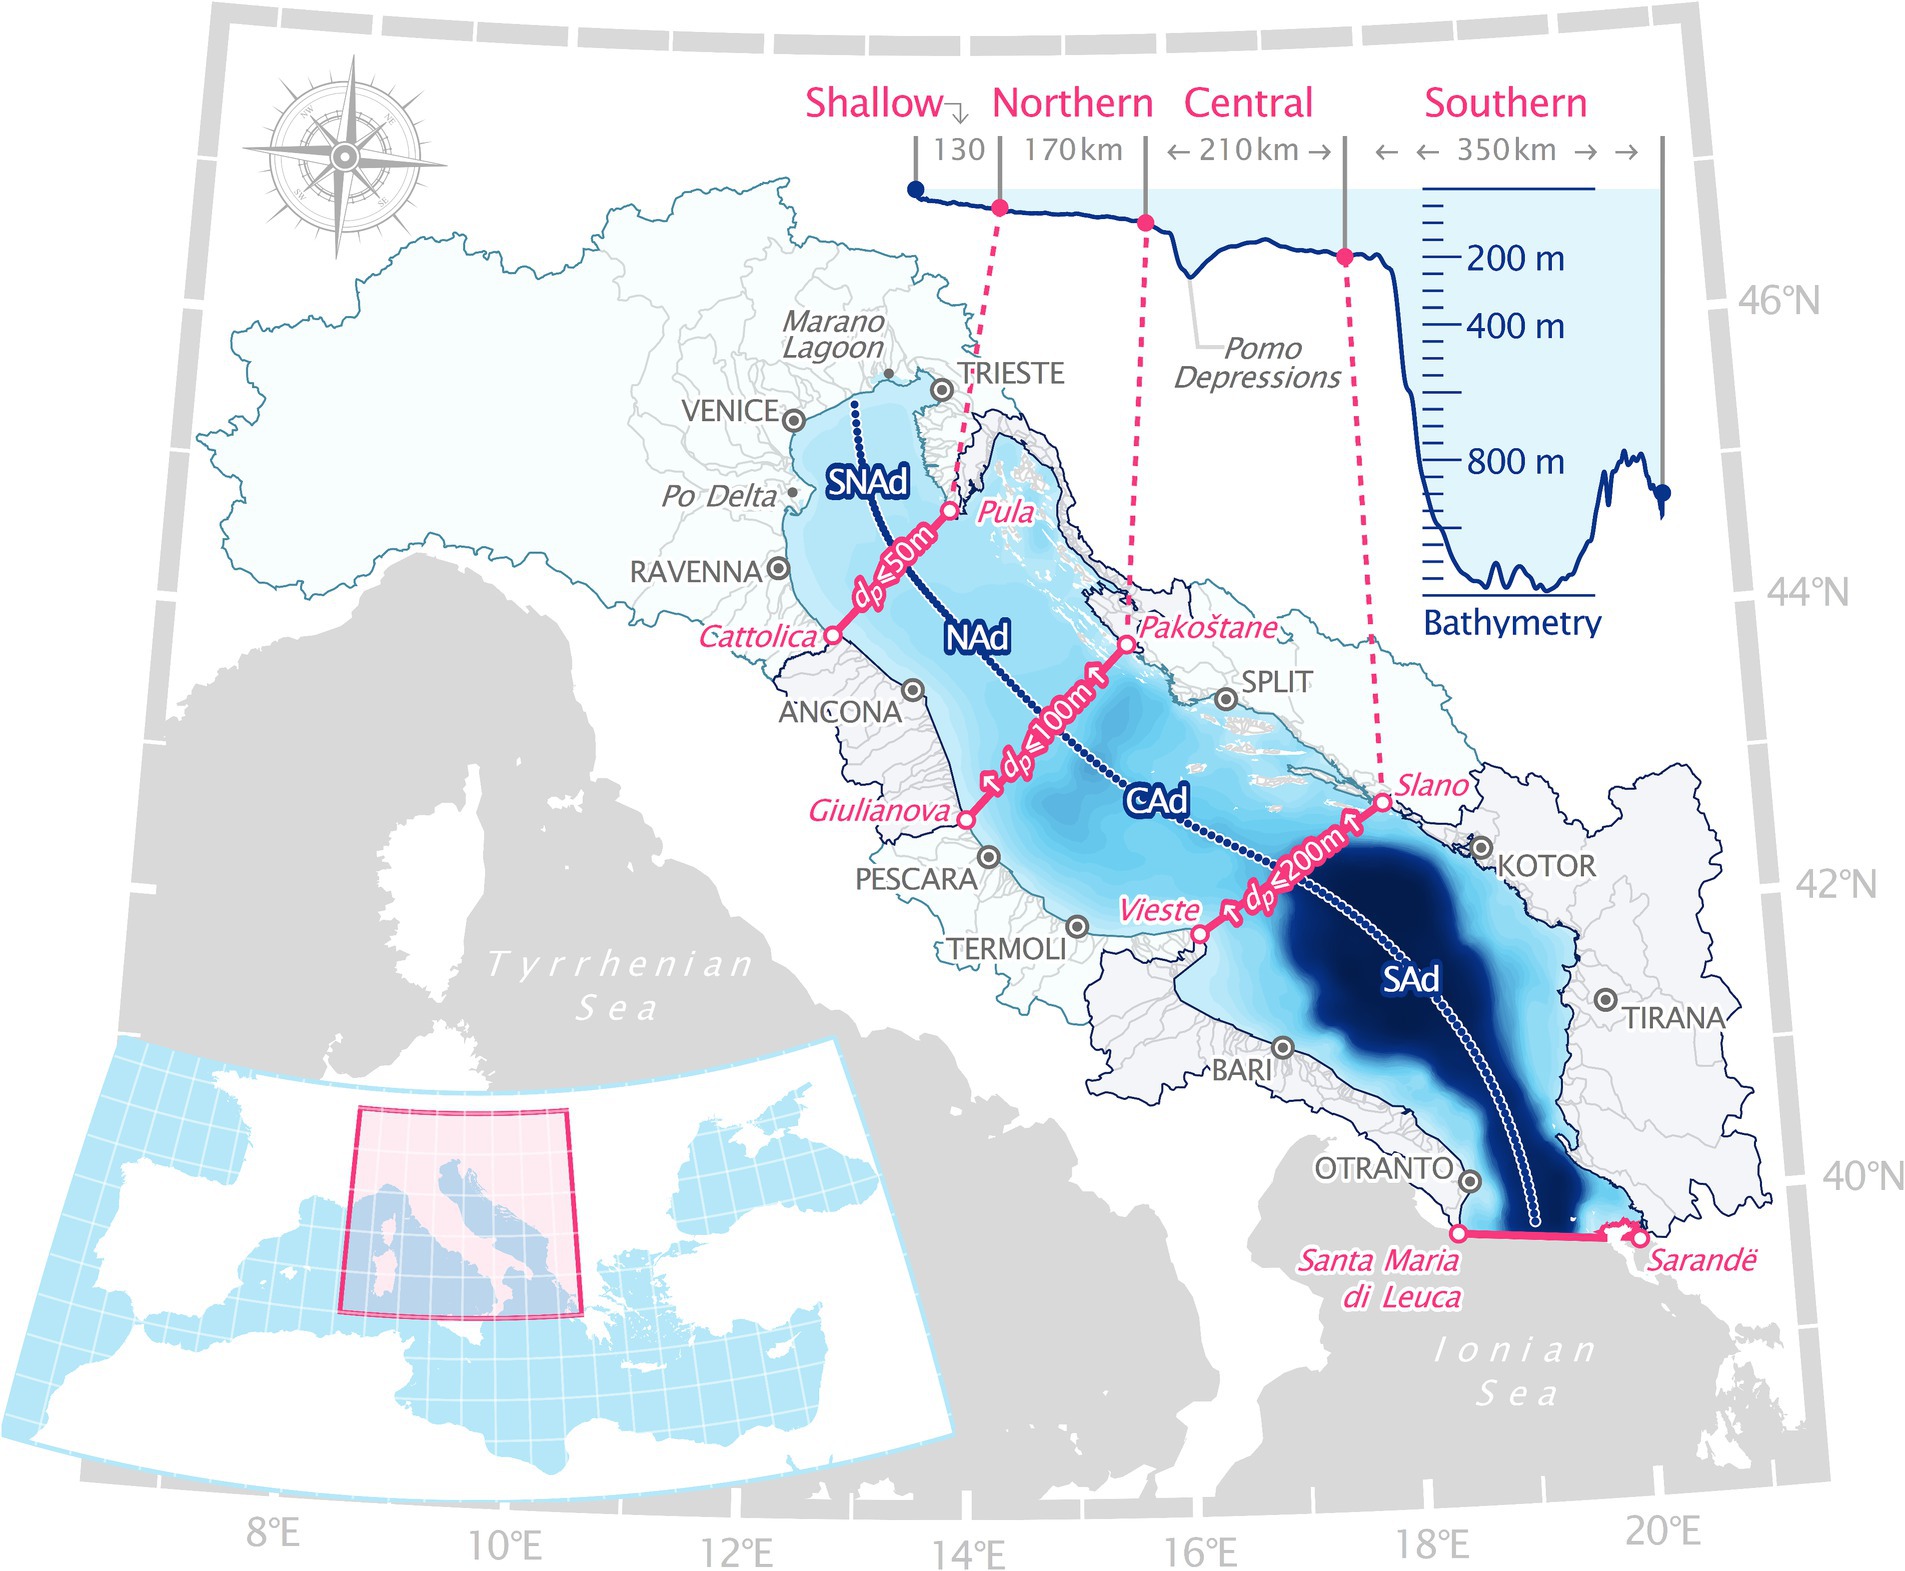
Figure 1. Adriatic Sea subregions defined by bathymetry: Shallow Northern Adriatic Sea (SNAd), Northern Adriatic Sea (NAd), Central Adriatic Sea (CAd), and Southern Adriatic Sea (SAd). The shaded areas represent the hydrological catchments of each subregion, whilst the embedded graphics show the bathymetry along the blue circles’ path (top) and the domain position within the Mediterranean Region (bottom).
The second subregion, Central Adriatic (CAd), comprises the northern coast of the Gargano Peninsula and the Pomo Depressions, presenting an extension of approximately 210 km. In this transition region between deep and shallow Adriatic areas, the depths are heterogeneous but limited to 100 down to 200 m, except for the areas related to the Pomo Depressions that reach 260 m.
The last subregion extends 300 km north until the Gulf of Venice, distributed over a very shallow and gently sloping area, with an average bottom depth of around 35 m but no deeper than 100 m. This region is well-known for the high density of its waters, the densest in the entire Mediterranean Sea (Robinson et al., 1992), resulting from a constant transport of sediments from the Delta of Po and the Lagoons of Venice (Zavatarelli et al., 1998; Struglia et al., 2004). For this reason, this subregion will be split into two subregions following Vilibić and Supić (2005) and Denamiel et al. (2021): (i) the Northern Adriatic (NAd), comprising areas with depths between 50 and 100 m and extending for 170 km north from the Central Adriatic subregion; and (ii) the Shallow Northern Adriatic (SNAd) referring to areas with depths under 50 m, which extends for another 130 km north up to the Venetian coastline. A summary of the four Adriatic Sea subregions and their respective hydrological catchments is presented in Figure 1, whilst Table 1 shows the coordinates regarding the Adriatic Sea subregion divisions.
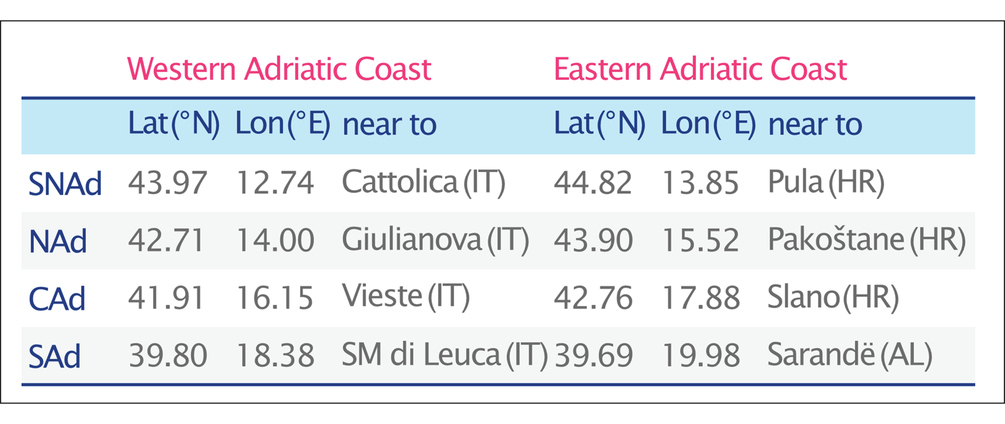
Table 1. Adriatic Sea subregions coordinates in Figure 1.
In this study, the analysis of the river discharge into the Adriatic Sea was based on EFAS, the European Flood Awareness System (Bartholmes et al., 2009; Thielen et al., 2009), an operational early-warning system part of the COPERNICUS Emergency Management Service (CEMS) that provides gridded modelled sub-daily and daily hydrological time series forced with meteorological reanalysis, analysis and forecasts. Available from January 1991 to the present (6 days delayed), the primary data set describes the hydrological processes in terms of river discharge, moisture for three soil layers, and snow water equivalent into a domain that covers most of the European continent on a 5 × 5 km equal-area grid. Additionally, an auxiliary data set completes this list with other static variables such as the upstream area, elevation, soil depth, wilting capacity and field capacity.
EFAS is driven by LISFLOOD (DeRoo et al., 2000; Van Der Knijff et al., 2010), a GIS-based hydrological rainfall-runoff-routing model which simulates the hydrological processes within a catchment using as initial conditions information on soils, land cover, topography, hydrology and meteorology. Its operational implementation in EFAS is continuously calibrated by recent observed meteorological fields such as precipitation, temperature, wind speed, solar radiation and vapour pressure, and land surface data, including land surface information and model parameters. The EFAS forecasts are forced by high-resolution ensemble forecasts from the European Centre of Medium-range Weather Forecasts (ECMWF) with 51 ensemble members, high-resolution forecasts from the Deutsches Wetter Dienst (DWD) and the ensemble forecasts from the COSMO Local Ensemble Prediction System (COSMO-LEPS) with 20 ensemble members. In this case, the delivered forecast reaches 5–15 days, depending on the forcing numerical weather prediction model, but its real-time data are only available to EFAS partners. For historical periods, the EFAS simulations are forced by hydro-meteorological observations taking advantage of the Meteorological Archival and Retrieval System (MARS), the main repository of hydro-meteorological data at ECMWF. According to Wetterhall and Di Giuseppe (2018), seamless forecasts such as EFAS show better overall skill and a lower bias over most areas in Europe.
For our purposes, the EFAS river discharge data were collected at the maximum temporal and horizontal resolution using the historical simulations (hereafter, reconstructions), version 4.0 (6-hourly and 5 × 5 km, respectively). It is worth mentioning that, after the development of the present study, the EFAS operational version 5.0 was released on 20/09/2023 with an increased horizontal resolution (~1.5 × 1.5 km). The data set was initially obtained for the entire domain from the Copernicus Climate Change Service (C3S) and then reduced to allow a faster semi-automatic river mouth detection along the Adriatic Sea coastline (described in the next section). The analysis covers the last 32-year period (1991–2022) and comprises all entire-year data available at C3S.
Identifying river streamflows through river discharge data is only possible because EFAS was designed as a one-dimensional channel routing model where the water exchange between grid cells occurs only in one direction (Van Der Knijff et al., 2010). Consequently, the watercourse is always channelled from one grid cell to another, highlighting the main streamflow, allowing channel unifications, and preventing bifurcations downstream. Following the terrain elevation, these rivers always flow until they reach another lower water body (flooding area, another river, lake, sea, or ocean), and at this position, we define the river mouth.
In the present study, we developed a semi-automatic method to identify river mouths from the EFAS data set, which starts from a domain reduction to 38.0–47.5°N and 6.5–21.5°E (Figure 1). Then, using the flag-assigned grid cells, we delimited the Adriatic Sea and defined the coastline grid cells belt from Sarandë (Albania) to Santa Maria di Leuca (Italy), as presented in Table 1. To avoid subgrid and border issues, we created the coastline belt with six grid cells of thickness. For each grid cell surrounding this belt, we computed the climatological daily averaged river discharge from 1991 to 2022 and assigned every grid cell presenting quantities above 1 m3s−1 as a river-mouth candidate.
A list containing the 67 main Adriatic Sea rivers gathering information from Ludwig et al. (2009) and Verri et al. (2018) was verified, and each actual river-mouth position was identified from satellite images. Then, these actual river-mouth positions were associated with four candidates along the Adriatic Sea coastline belt using the nearest neighbour method, where the candidate with the highest averaged river discharge was selected. The automatic identification was submitted to a subjective analysis when two or more different river mouths had mutual candidates. This procedure was to select the best grid cell for each river mouth and avoid the selection of bogus candidates.
Figure 2 shows an example where the method effectively defined the Adige River grid cell according to the average daily river discharges monitored at the CNR ISMAR stations (Verri et al., 2018). However, it failed for the Brenta River as its mouth is located only 3 km to the north of the Adige River mouth, a distance shorter than the EFAS resolution (5 km). In this case, the subjective analysis allowed the selection of another inland grid cell positioned along the river’s course. The candidates not assigned to the 67 main rivers of the Adriatic Sea were analysed similarly and allowed us to add 19 other rivers to our list, whose names were assigned following OpenStreetMap information.1
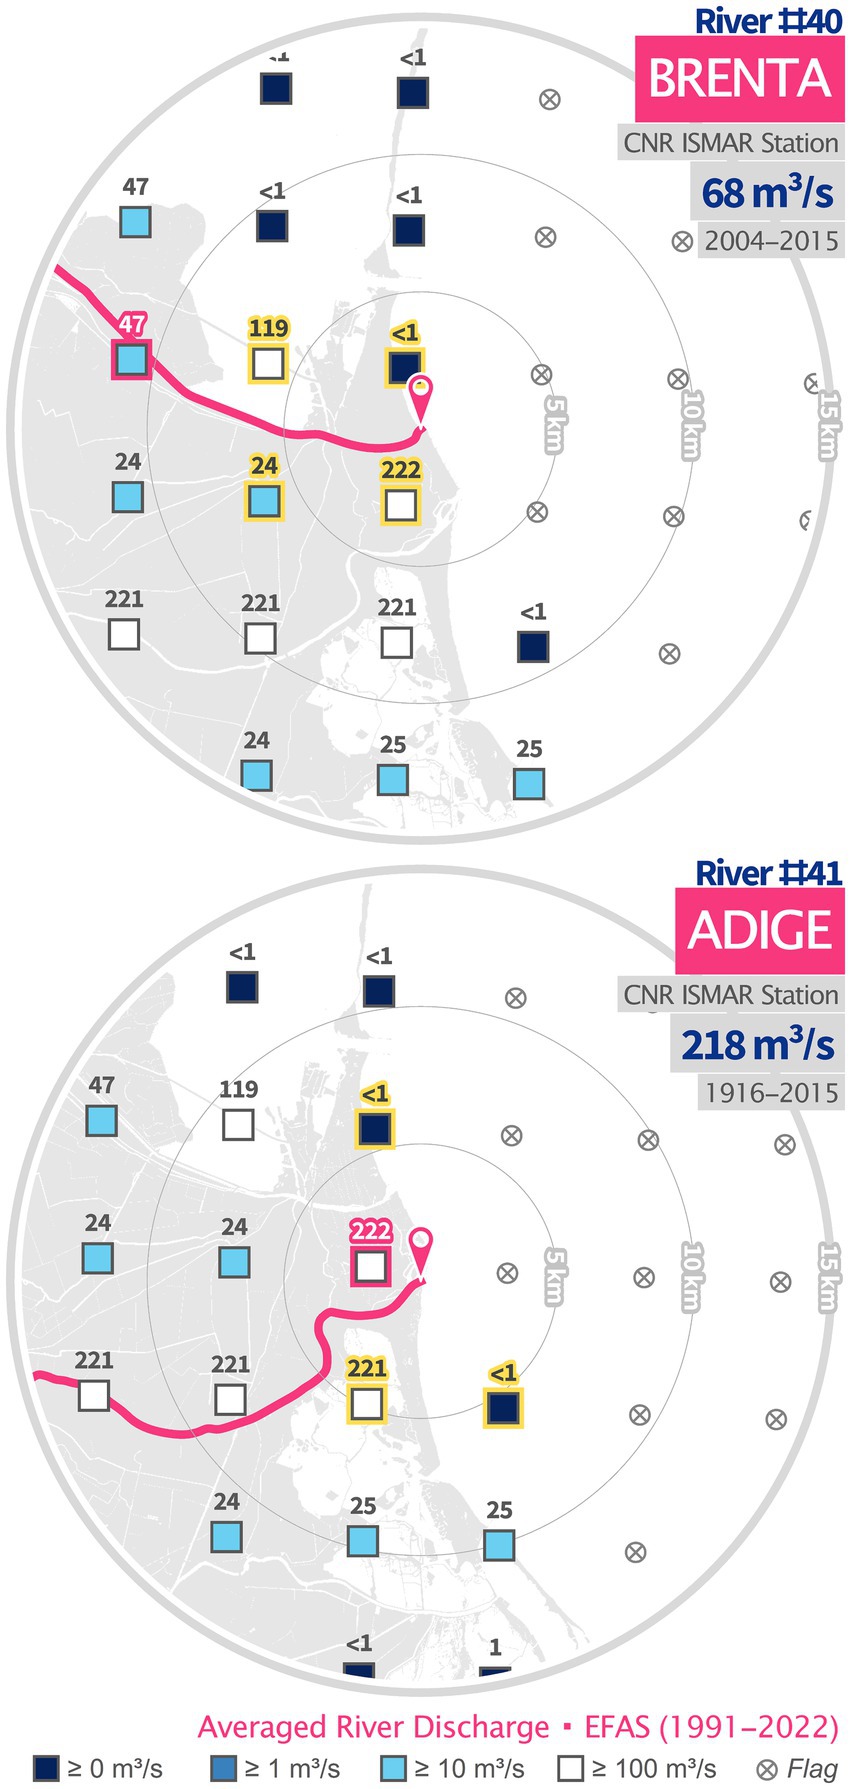
Figure 2. Examples of the EFAS grid cell selection method for Brenta (automatic + subjective) and Adige (automatic) Rivers. The magenta lines and the pins represent the rivers’ actual course and mouths, respectively, whilst the coloured squares are the grid cells’ centre. The cells highlighted in yellow are those four identified by the nearest neighbour method (automatic), whilst the one highlighted in magenta is the chosen grid cell to represent the river mouth.
Finally, all 86 rivers identified by the described method were submitted to another subjective analysis to confirm if the selected grid cell represents the river-mouth position and daily river discharge well. Excluding the nine branches of the Po River identified exclusively by the subjective analysis, the rivers that did not have their mouth position selected automatically were Zrnovnica (Croatia), Isonzo, Porto Buso, Canale dei Lovi, Porto di Chioggia, Brenta, Bevano, Uso, Misa, and Cervaro (Italy).
The spatial distribution of these river-mouths along the Adriatic Sea coastline is presented in Figure 3, highlighting the Po Delta and its nine branches between the Po di Levante and Po di Volano Rivers. Additionally, the embedded table shows the total of rivers by Adriatic Sea subregions and their respective catchment area. The SNAd sums up 50% of the considered rivers supported by more than 54% of the Adriatic Sea inland catchment area. It is also worth mentioning the small number of river mouths along the eastern coastline due to the complex topography within the Balkans that favours the water collection by the Danube River, which discharges on the Black Sea (Struglia et al., 2004). The SAd western coastline also presents a few rivers (Candelaro, Cervaro, Carapelle and Ofanto). According to Verri et al. (2017), this region has low hydraulic conductivity and high soil permeability, which tend to drain water into groundwater and restrict its surface transport through rivers and streams.
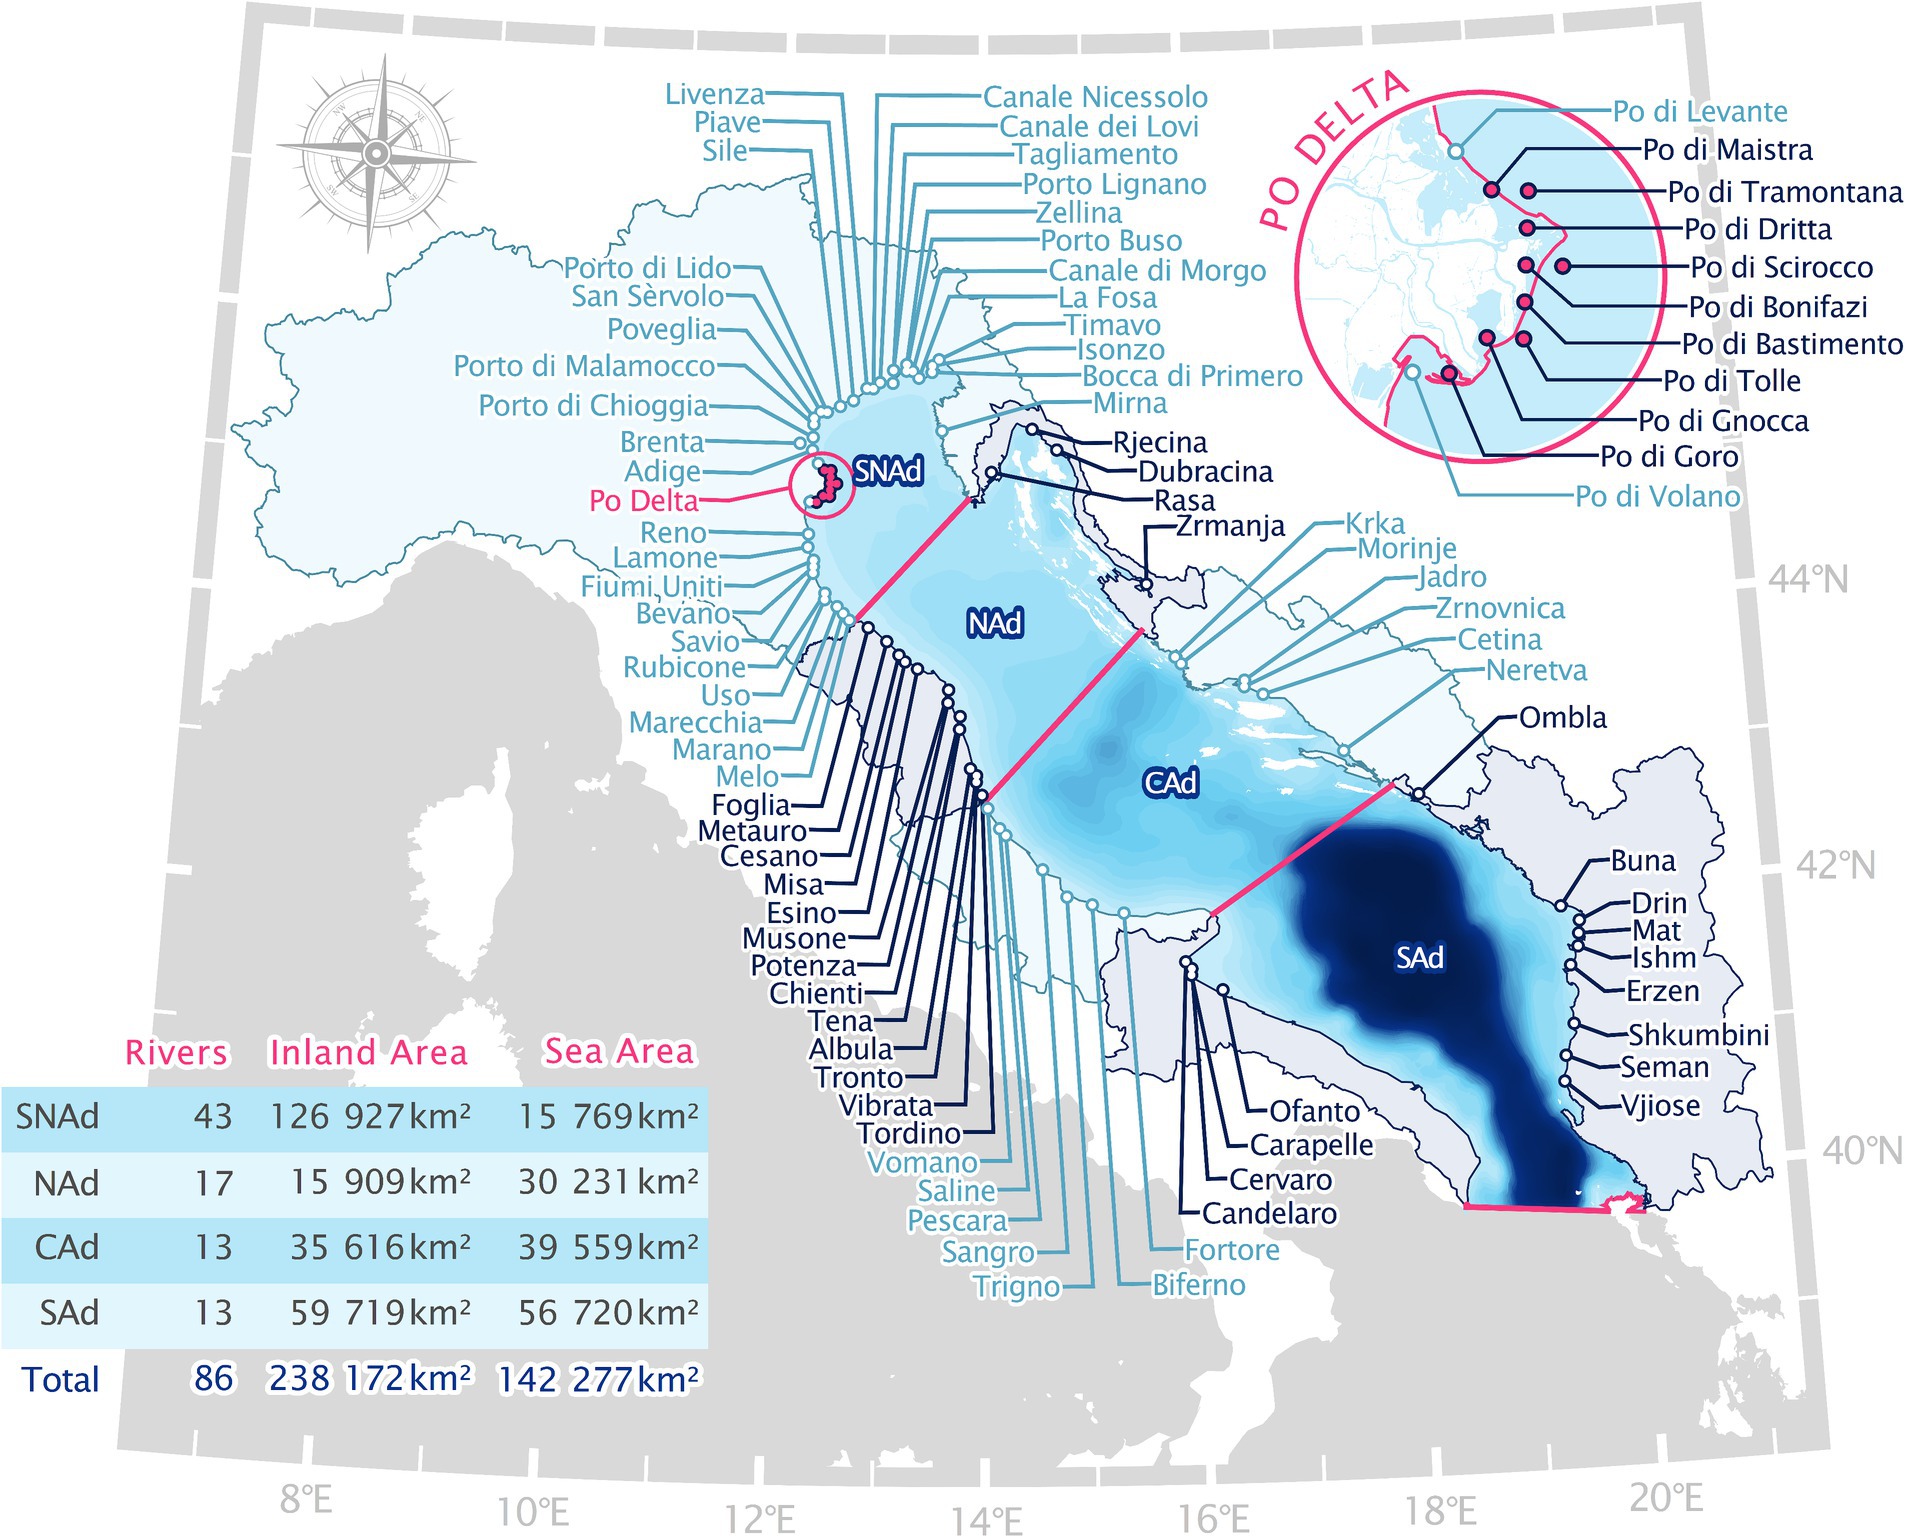
Figure 3. Distribution of the 86 river mouths (circles) considered in this study within the four Adriatic Sea subregions. The main river (Po) is represented by nine branches (magenta points) between the Po di Volano and Po di Levante Rivers.
Given the channel routing concept that does not allow EFAS to represent river branches, discharges regarding the Po River were extracted from the nearest gridpoint to Pontelagoscuro Station (44.8883°N, 11.6081°E) and distributed along the nine tributaries of the Po River (from Maistra to Goro, Figure 3) as in Provini et al. (1992). Observation-based parameterisations prevent a river’s entire freshwater volume from being discharged by only one branch and allow the use of EFAS appropriately for the spatial representation of river discharges along deltas.
The EFAS river discharge data obtained at each river-mouth position in the Adriatic Sea were submitted to a detailed assessment process performed in two levels. The first compares directly the climatological daily river discharge available in the literature (Ludwig et al., 2009; Verri et al., 2018) to quantify the number of rivers monitored and identify the Adriatic regions with the highest uncertainties of the overall riverine discharges.
The second-level assessment evaluates daily river discharge through time-series analysis and statistical indices to verify the EFAS skill in representing seasonal cycles, statistical distributions, and extreme events thresholds. The statistical indexes include bias, root-mean-square error (RMSE), Pearson correlation (RR), Nash–Sutcliffe efficiency coefficient (NSE) and Kling-Gupta efficiency (KGE). At the same time, the distribution parameters consider the average (Avg), the first quartile (Q1, or lower quartile), the second quartile (Q2, or median), the third quartile (Q3, or upper quartile), and the 95th lower and upper percentiles (P05 and P95).
Unfortunately, the lack of open-source monitoring data limited the analysis for a small number of rivers evaluated for different periods. As discharge measurements at the river mouth are rare and sometimes distanced by more than 100 km, additional EFAS data were considered (exclusively for this analysis) using the nearest neighbour gridpoints to the hydrological station positions.
To understand and quantify the Adriatic Sea climate freshwater balance, the river discharges were analysed through monthly climatology, monthly trends, and long-term climate indicators, where single river contributions were aggregated by the overall Adriatic Sea and its subregions. The current climatology presents the monthly means of the daily averaged river discharge from 1991 to 2022, whilst the river discharge trends present the monthly averaged time series for the same period.
The long-term climate indicator is calculated as the Standardised Flow Index (SFI, Shukla and Wood, 2008), estimated using river discharge applied into a set of moving average periods (1, 3, 6, 12, 24 and 48 months) normalised by the standard deviation obtained from its gamma distribution. The SFI is computed as the Standardised Precipitation Index (SPI) described in McKee et al. (2013), replacing the monthly accumulated precipitation with the monthly averaged river discharge. The results can be framed into several drought categories ranging from extremely wet to extremely dry conditions, providing extreme event severity and return period (see Svoboda et al., 2012 for more details).
Considering the set of 67 rivers extracted from Ludwig et al. (2009) and Verri et al. (2018), and reducing the nine Po Delta rivers to Po River at Pontelagoscuro due to the absence of long-term observational data, Figure 4 shows the comparison between the average daily river discharge (m3s−1) obtained in the literature (observations) and those proposed in the present study based on EFAS (also presented in Table 2). Although the observed data refer to different periods (many of them before 1991), these river discharge data are often used as initial and boundary conditions in several modelling studies (Lazzari et al., 2012; Gualdi et al., 2013; Terrado et al., 2014; Rodellas et al., 2015), underlining the importance of reviewing the freshwater supply to the Adriatic Sea.
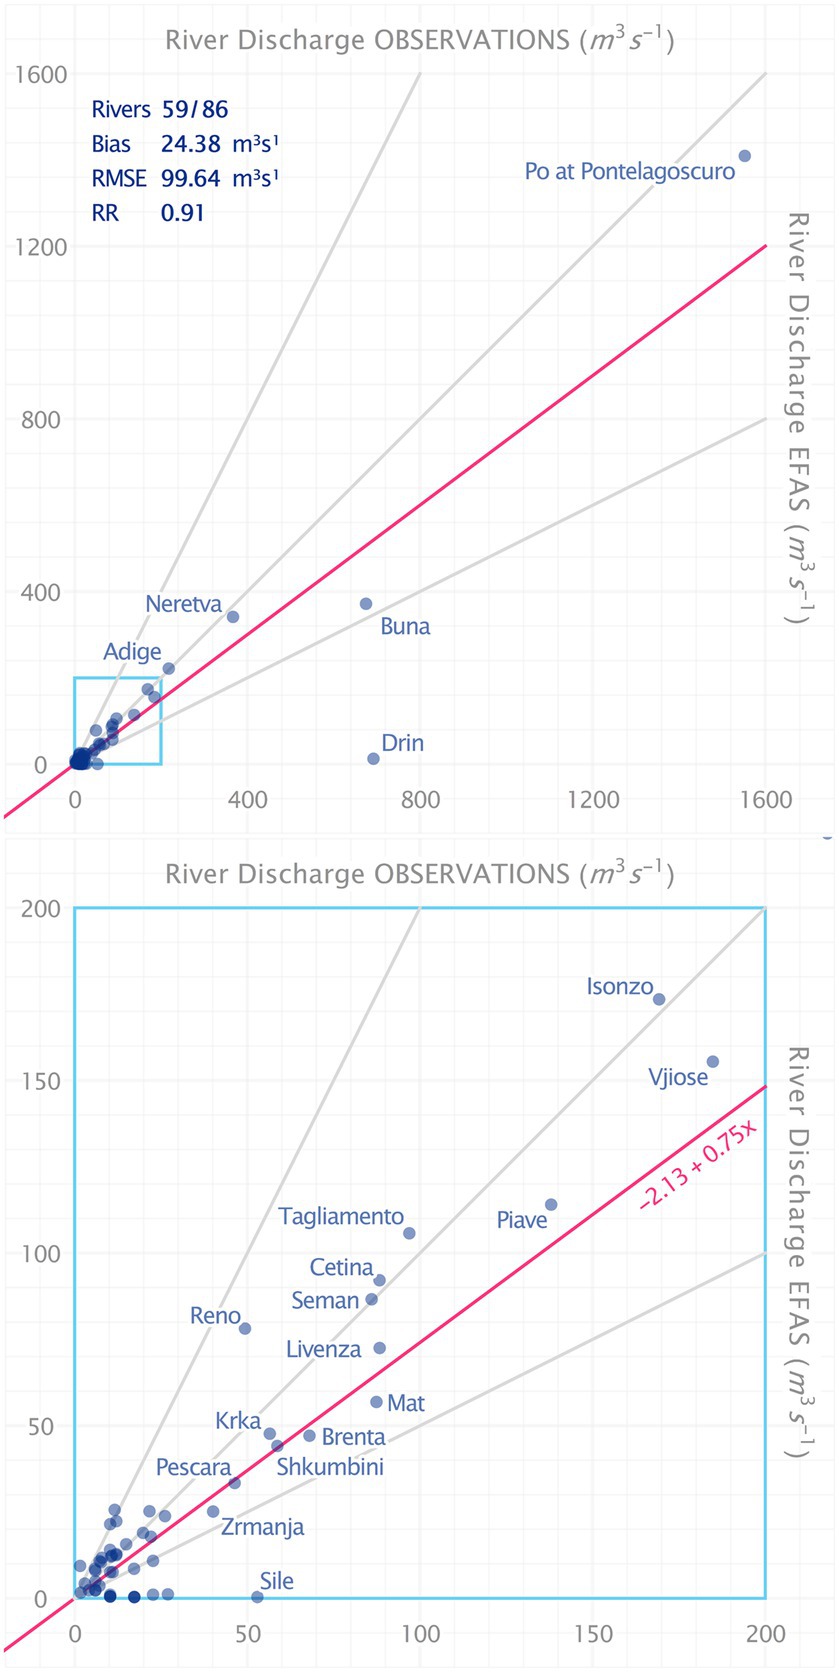
Figure 4. Comparison between averaged daily river discharge (m3s−1) from observations and EFAS reconstructions. The upper panel presents all evaluated discharges, whilst the lower panel presents only those smalle.
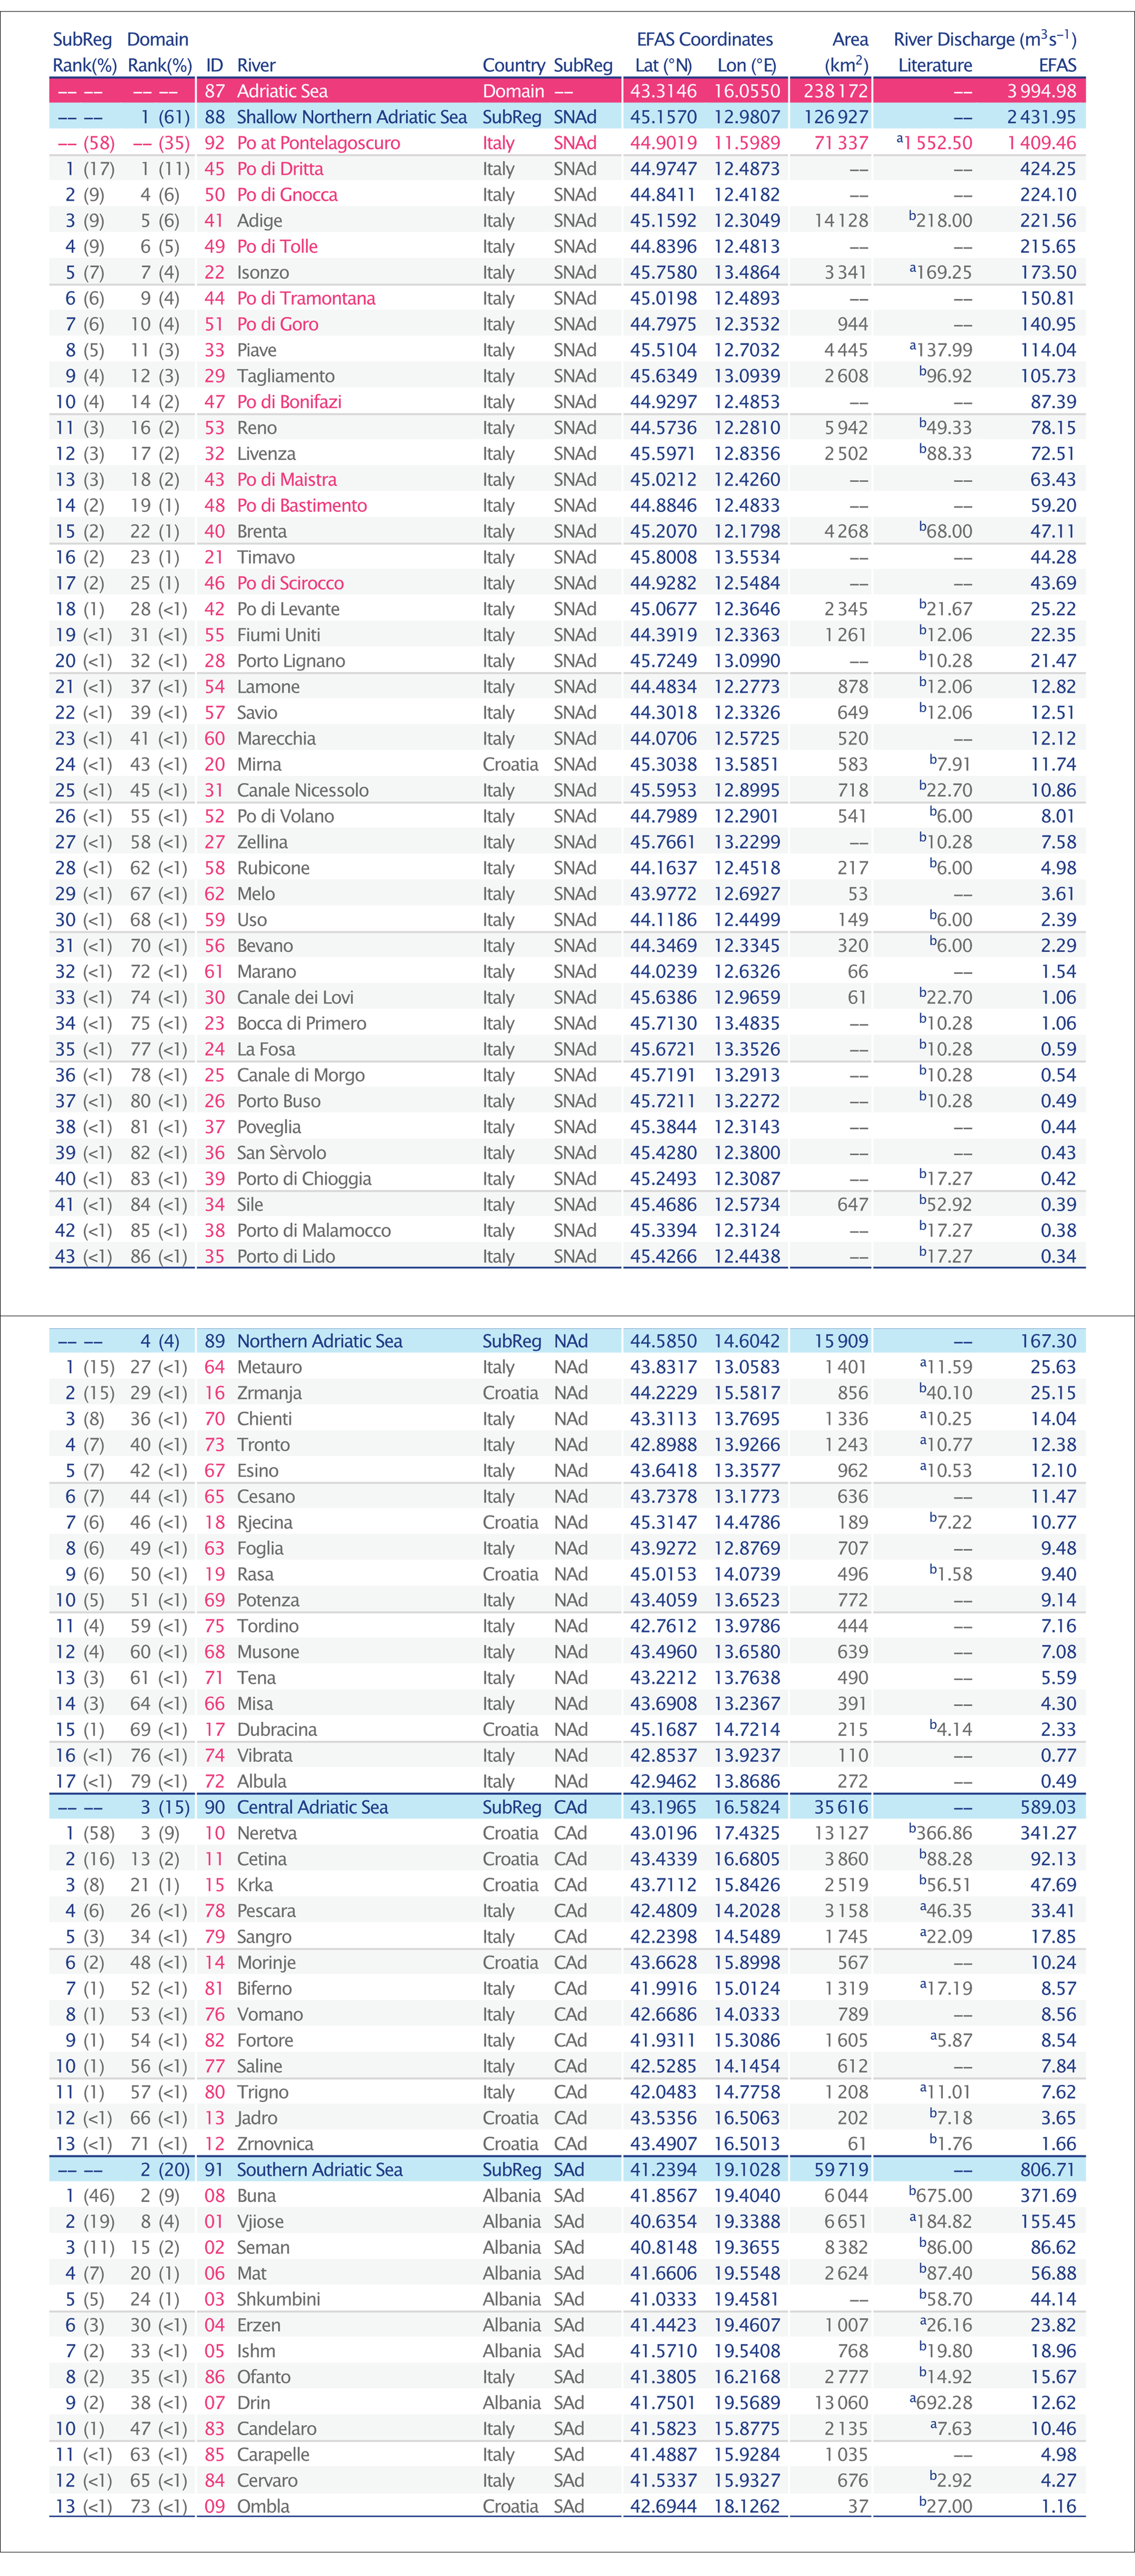
Table 2. Adriatic Sea rivers considered in the present study ranked by averaged daily river discharge from EFAS reconstructions and Adriatic Sea subregions. The rank-related percentages report the participation in the overall river discharge into the domain and each subregion of the Adriatic Sea. Po River discharges at Pontelagoscuro are presented only as a reference and have not been accounted for in the SNAd and Adriatic Sea totals. The reference literature are (a) Ludwig et al. (2009) and (b) Verri et al. (2018, Table 2).
Figure 4 includes 58 rivers plus the Po River at Pontelagoscuro (split into nine rivers), amounting to 67 of the 86 rivers analysed in this study (78%). However, their participation in freshwater discharges into the Adriatic Sea easily overcomes 96% (3,846 of 3,995 m3s−1, Table 2). The linear regression shows a slight EFAS underestimation concerning observations, whilst the statistical indices show a correlation of 0.91 and relatively small errors regarding the overall Adriatic river discharge. The EFAS estimates were consistent for rivers with observed discharges above 200 m3s−1, except for the Albanian rivers. The courses and discharges of the Buna and Drin Rivers were modified by constructing three dams around the Shkoder Lake for hydropower production (Vau Dejës in 1975, Fierzë in 1978, and Kaman in 1985), and a large part of Drin discharges was shifted to the Buna River (Vodopivec et al., 2022). Since 100% of the energy consumed in Albania comes from hydropower and a 20% reduction in runoff implies a 60% reduction in energy production, the water uses and the current discharges in these rivers diverge a lot in the literature (Knez et al., 2022).
For discharges under 200 m3s−1 (Figure 4, lower panel), EFAS agrees with observations within a factor of two, which justifies the satisfactory statistical parameters. There are a few cases where EFAS underestimated the river discharge, all of them located in the Venice Lagoon and the Marano Lagoon: Bocca di Primero, La Fosa, Canale di Morgo, Porto Buso, Canale dei Lovi, Sile, Porto di Lido, Porto di Malamocco, Porto di Chioggia. In this case, the difference is explained by the station’s position inland, far from its lagoon outlets. Moreover, the present study analyses only river mouths distributed along the Adriatic Sea coastline, not those with discharges toward lagoons. As a reference, excluding the above mentioned rivers, the linear regression adjusts to 1.57 + 0.91x, and bias, RMSE and RR improve to 5.56, 23.82 and 1.00, respectively. This result portrays how EFAS estimates are confident and similar to the observational river discharges in the Adriatic Sea. On the other hand, it is not yet possible to validate or make a fair comparison of river discharge estimates in regions of the Adriatic Sea deltas and lagoons due to the lack of monitoring data near the river mouths (Cozzi and Giani, 2011) and the lagoons outlets where actual freshwater releases occur.
Regarding the Albanian rivers, a recent publication updated the discharges of the Seman, Buna, and Drin Rivers, providing their monthly climatological runoff (Vodopivec et al., 2022). However, as the monitoring station measures the Shkoder Lake outflow, the individual discharges of Buna and Drin are unavailable, explaining the label Buna+Drin addressed to these data. Figure 5 compares these data with the EFAS estimates, exploring the statistical indices computed using the monthly averaged river discharges. A strong correlation was found between the observed and the reconstructed discharge’s seasonal cycle for the Seman River (Figure 5A). The high NSE (0.78) indicates that the reconstructed data, not only represent the observed mean river discharge well, but also can adequately describe its seasonal variations. The updated mean discharge of Seman River is remarkably close to Verri et al. (2018), Table 2, and does not change the first-level assessment result, but expands its validity to the seasonal cycle. On the other hand, the sum of the average discharges of the Buna and the Drin Rivers in Table 2 (1,367 m3s−1) exceeds twice that updated by Vodopivec et al. (2022), 671 m3s−1, which doubles the EFAS reconstructions (384 m3s−1, where 372 m3s−1 is discharged only by Buna). Despite this, the seasonal cycle estimated by EFAS proved quite satisfactory compared to the updated observed data (Figure 5B; RR = 0.92), even with the disparity in its average values, which explains the negative NSE. This only confirms that divergences concerning the Albanian river discharges persist, and its monitoring station is still not integrated and assimilated on EFAS.
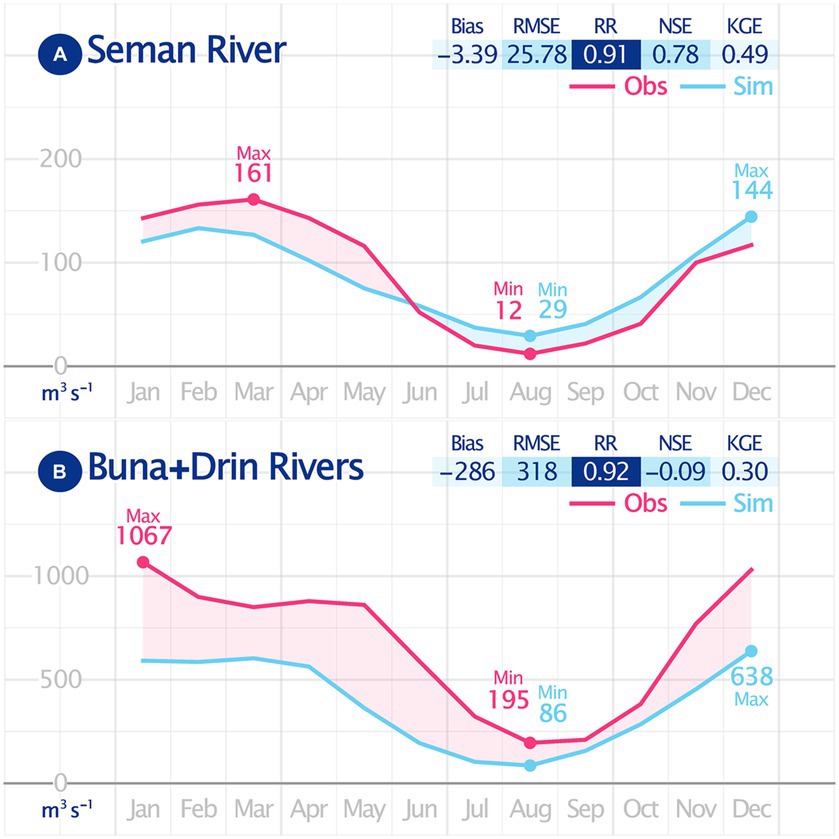
Figure 5. River discharge monthly climatology (m3s−1) of the Albanian rivers considering the observation data updated by Vodopivec et al. (2022).
Table 2 shows each river and subregion’s contributions to freshwater discharges into the Adriatic Sea. In a certain way, the contribution of each subregion is relatively proportional to the catchment area, where the SNAd appears in the first place, with 61% of river discharge into the Adriatic Sea collected by 53% of its hydrological basin. The Po River (at Pontelagoscuro) alone is responsible for 58% of the SNAd discharges, with about 1,410 of 2,432 m3s−1. These EFAS estimates agree with other reference studies (Raicich, 1996; Struglia et al., 2004; Ludwig et al., 2009; Montanari, 2012) and the observational data measured at Pontelagoscuro station about 70 km from the river mouth, highlighting the importance of long and continuous time series for runoff modelling.
Other significant Alpine rivers in the SNAd with discharges above 100 m3s−1 are Adige, Isonzo, Piave and Tagliamento. Despite the disparity regarding the Po River discharges, these four rivers have proper estimates by EFAS and tally about 16% of the Adriatic Sea discharge, exceeding those reported for NAd and CAd. Six of the nine branches of Po River complete the top 10 discharges within SNAd, showing the Po River’s importance not only for the SNAd but the entire Adriatic Sea. As Vilibić and Supić (2005) argue, the reliable representation of these river discharges is fundamental in sediment modelling, especially under the recent and worrying decreases in river discharges, which increasingly require continuous monitoring and modelling efforts to trace the exact location of dense water generation in the SNAd.
Due to its small catchment area, NAd is responsible for only 4% of discharges into the Adriatic Sea (Table 2). Assuming 1% of the overall discharge of the Adriatic Sea as a threshold to classify a river as small, all 17 NAd rivers would be classified as minor. Its principal rivers are the Metauro (Italy) and the Zrmanja (Croatia), accounting for 30% of the freshwater input collected in the basin. The EFAS estimates proved quite realistic for the western coast rivers compared to the literature (Ludwig et al., 2009; Verri et al., 2018). However, the same cannot be said about the Croatian coast discharges, where the EFAS underestimated by 37 and 44% the observed values in the Zrmanja and Dubracina Rivers, respectively, and overestimated by 5x discharges from the Rasa River. All these rivers present measurements referring to 1947–2000 (Verri et al., 2018), allowing an overlap for only 10 years with the present study period (1991–2022). Despite the outdated literature values, another river with data from the same source (Rjecina) presented satisfactory estimates with EFAS.
The CAd’s catchment area doubles the NAd subregion, but its freshwater discharge potential into the Adriatic Sea is three times higher than NAd and SAd subregions. Much of this potential comes from the Neretva River (Croatia), which alone adds 58% of the river discharges from the CAd. Other Croatian rivers, such as Cetina and Krka, add a further 27% due to the larger catchment area on the east coast. Almost all rivers in this subregion have river discharge values available in the literature, which allows for classifying the EFAS estimates as consistent for the entire CAd. The only exceptions were the Biferno (Italy) and Jadro (Croatia) Rivers, whose observations were underestimated by 50%.
SAd has a larger catchment area than NAd and CAd combined (Figure 3), and its contribution to the freshwater input into the Adriatic Sea follows this proportion (Table 2). However, as already discussed, this contribution could be more significant if discrepancies between literature data and EFAS estimates on discharges from Buna and Drin Rivers were overcome. On the other hand, considering the other subregion rivers, EFAS provided estimations in line with the referenced values again, especially when assessing the Albanian rivers that govern river discharges in SAd.
In this subsequent assessment phase, time series of daily averaged river discharges obtained from the hydrological monitoring networks along the Adriatic Sea basin are compared with EFAS reconstructions to assess the model skill to represent seasonal cycles, interannual and decadal trends, and the distribution parameters to classify extreme events. Unfortunately, the absence of daily discharge data reduced the number of rivers considered in this second-level assessment to 19, all located at SNAd and the western NAd from Isonzo River up to Tronto River (Figure 3).
The statistical indices obtained by comparing the observational data with the EFAS-modelled data are summarised in Table 3. The monitoring stations are 1.7 to 61.6 km from their respective river mouths (EFAS gridpoints), but only one-third are positioned up to 10 km. On the other hand, the availability of the observation time series ranges from 1 to 20 years (366 to 7,494 days), of which two-thirds have about 10 years or more. However, only the Po River at Pontelagoscuro station has data covering the 32 years (11,545 days) evaluated in the present study.
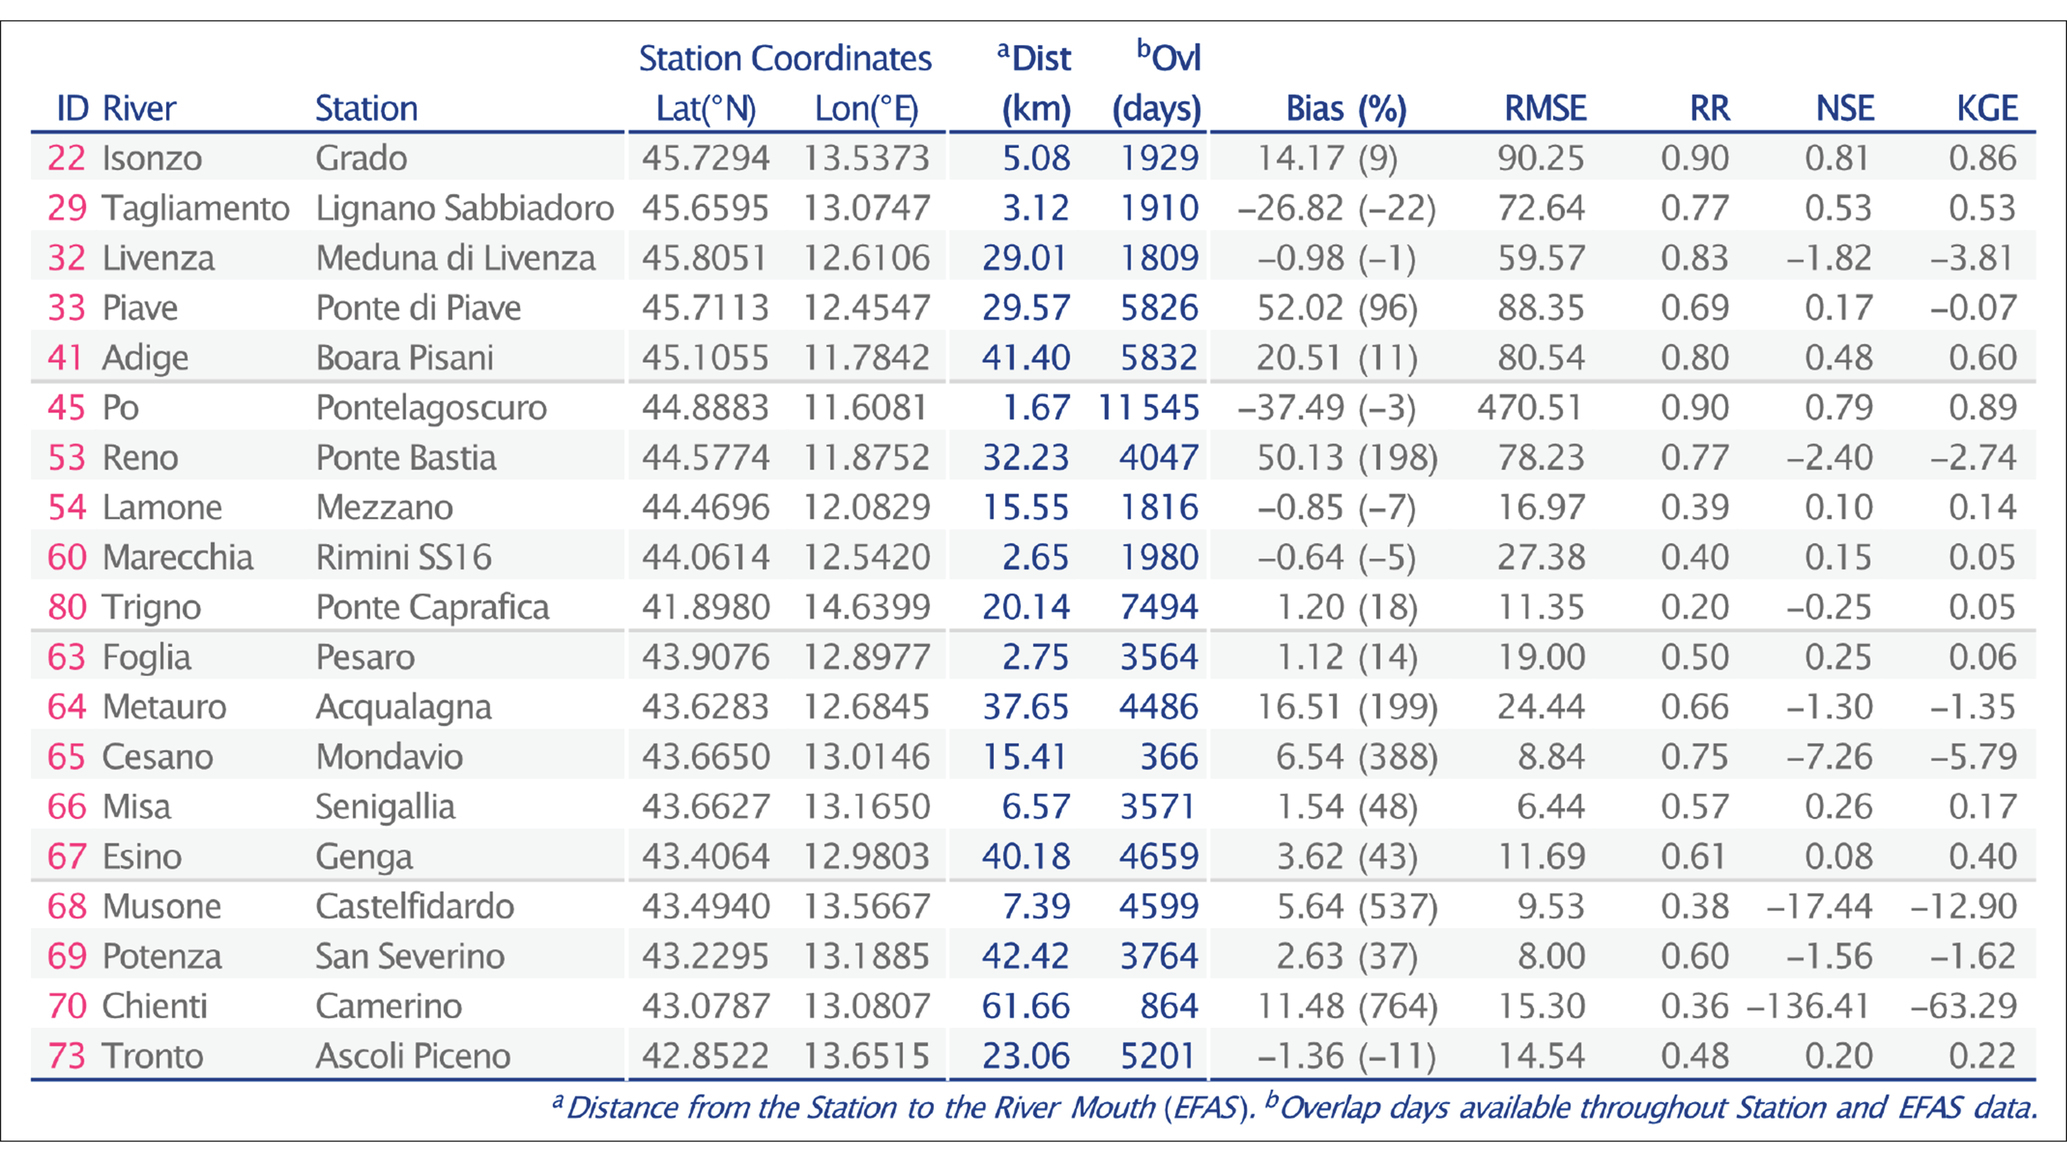
Table 3. Statistical Indices computed for 19 Adriatic rivers with observational river discharges available daily.
Generally, the integrated analysis of statistical indices is quite complex and often points in different directions. Not all reconstructions well correlated with observed data present low bias and RMSE, or NSE and KGE close to ideal (1). For example, the Cesano River reaches RR = 0.75, but the bias overestimates by almost 5x and explains the strongly negative NSE and KGE (Table 3). It is true that high correlations and small bias result in high NSE and KGE (see the indices for Isonzo, Tagliamento, Adige, and Po Rivers). None of the small rivers showed high NSE and KGE. Most presented values close to zero, indicating a good representation of average river discharges but not their seasonal variations (Knoben et al., 2019). The other part showed strongly negative NSE and KGE, meaning neither the average is well represented in these reconstructions.
To explore the relationship between observed and reconstruction data, Figure 6 shows the daily average river discharges of three particular rivers presented in Table 3: the Isonzo, Po and Potenza Rivers. The Isonzo, also known as Soča, has the 7th and 5th largest freshwater discharge in the Adriatic Sea and SNAd, respectively (Table 2), and was selected to represent rivers with discharge observations near the river mouth. The 5 km separating the monitoring station (Grado) and the river mouth is amongst the shortest analysed in Table 3 (about 8 km following the river course) and presents discharge data since September 2015.2 In these 5 years of observed data (Figure 6), two annual river discharge peaks can be noticed, with the highest daily values reported during the winter (>600 m3s−1). The same applies to EFAS estimates, which correctly simulated the seasonal discharge cycle with a positive bias of 8.1% regarding the average discharge and good correlation, NSE and KGE (0.90, 0.81, and 0.86, respectively). An overestimation of autumnal discharges explains the positive bias. For example, the observed discharges were lower than expected in 2016 and 2019. However, as shown by the distribution parameters, EFAS was consistent with river discharges measured in Grado station, also providing realistic thresholds for extreme events of drought (P05) and flooding (P95). These suitable estimates result from a fair comparison where the short distance between Grado station and the river mouth (EFAS) minimises changes related to evaporation and human activities.
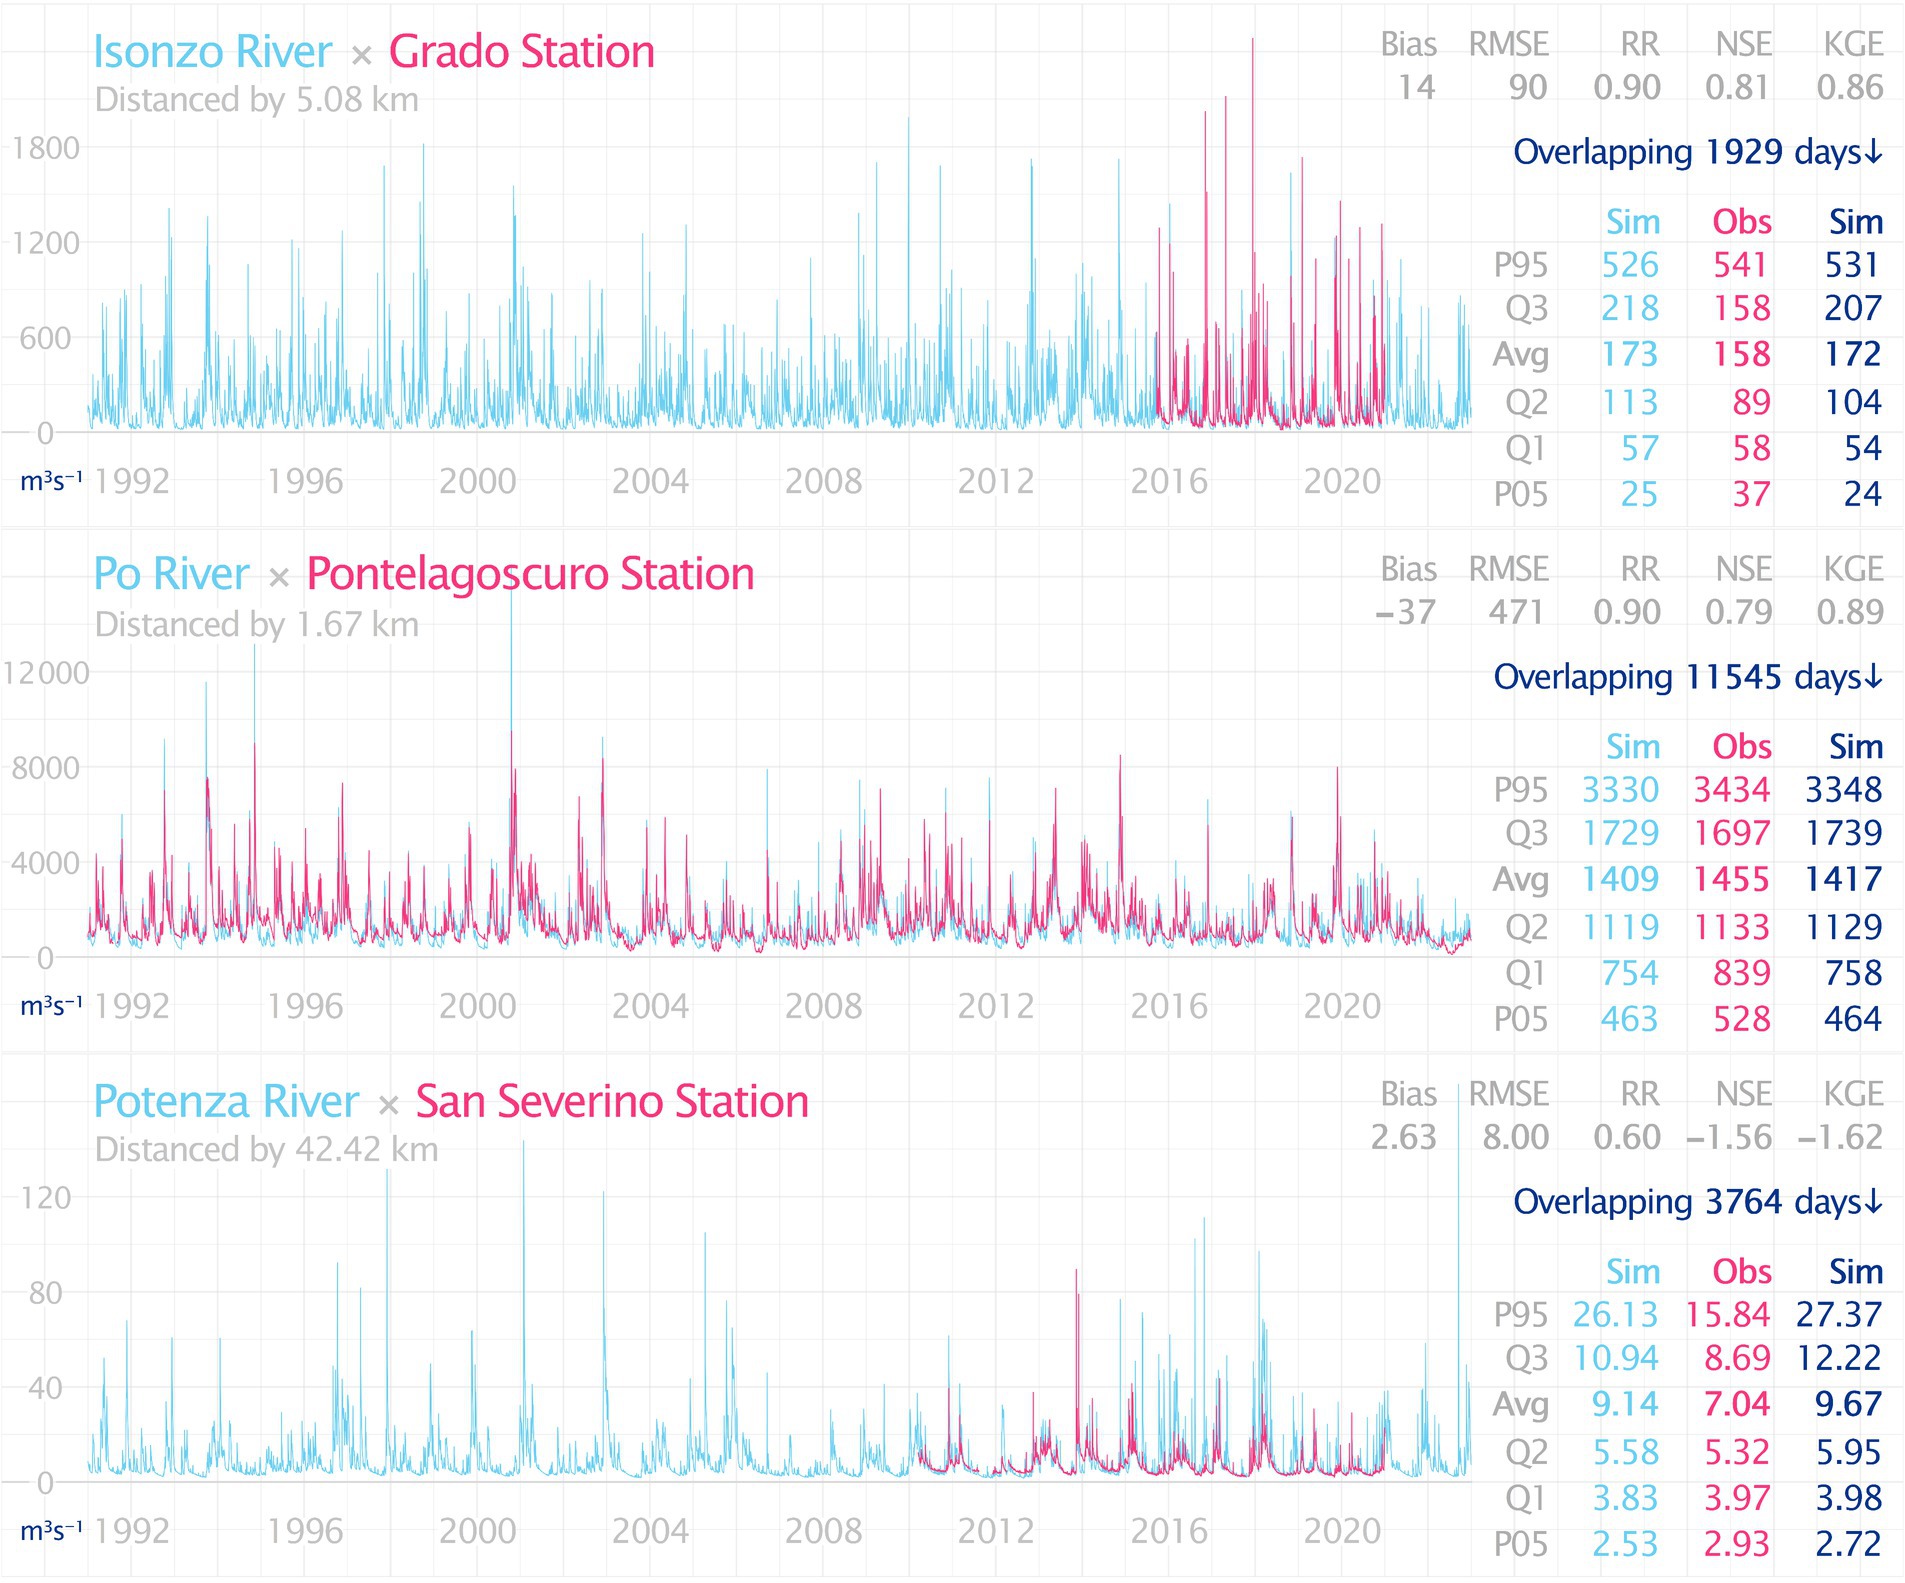
Figure 6. Daily averaged river discharge (m3s−1) of Isonzo, Po, and Potenza Rivers at the river mouth (EFAS gridpoint) and the monitoring station. EFAS reconstructions cover 1991–2022 (blue lines), whilst observations (magenta lines) include only the available period on each station. The embedded table shows the statistical indexes (grey) and the distribution parameters for the available period on EFAS (Sim, blue) and observations (Obs, magenta) and on EFAS but for the overlapping period with observations (Sim, dark blue).
The second time series in Figure 6 assesses the daily average discharges of Po River at Pontelagoscuro, chosen for its extended set of observed data. It is the only river in which the EFAS estimates were extracted from a gridpoint far from the Adriatic coast (~70 km) due to the model concept that makes the representation of deltas unfeasible. It is also worth remembering that Po River discharges are partitioned into nine branches based on the estimated value in Pontelagoscuro (about 1.67 km from the monitoring station, Figure 6). The discharge measurements in Pontelagoscuro date back to the 1920s and allow EFAS to be assessed over the whole analysis window.3 The Po is the main river in the Adriatic basin and is responsible for 35% of freshwater discharge. Like the Isonzo River, its seasonal cycle has two annual peaks with exceptional discharges (P95) that exceed twice the average. Again, EFAS estimates showed exemplary skill in representing these features during the 32 years evaluated. Notably, the historical measurements at Pontelagoscuro were used on EFAS calibration and partially explained the low bias and RMSE (about 2.6 and 33.4% regarding the average discharge, respectively) and the high correlation, NSE and KGE highlighted in Figure 6.
Finally, Figure 6 compares the daily average discharges of the Potenza River estimated by EFAS and measured in San Severino Station, 42 km from the river mouth.4 The river dimension justifies this selection. Although amongst the lowest river discharge in the Adriatic, this river represents an essential group of small rivers on the western coast, which collect 8% of the freshwater delivered in the Adriatic Sea. With small catchments along the Apennines, these rivers usually exhibit a seasonal cycle with a single maximum discharge during the winter and a minimum in the summer. Since snow accumulation appears at low altitudes, its melting occurs in late winter, and the spring’s secondary maximum discharge is less evident than in Alpine rivers (Ricci et al., 2022). That is precisely what is observed at the San Severino station and estimated by EFAS for Potenza River over the 10+ years of available river discharge data. During this period, EFAS estimates satisfactory represented observational discharges, especially during droughts, so critical for rivers of these characteristics. On the other hand, as indicated by the RR and RMSE, the flash flood cases (typical of Apennine rivers) were often overestimated and notably increased the average river discharge, Q3 and P95. Additionally, the negative values of NSE and KGE indicate that EFAS is a good predictor only for the mean discharge of Potenza River and not for its variations.
Every day from 1991 to 2022, the Adriatic Sea received about 3,995 m3s−1 of freshwater discharges from hundreds of rivers and streams, besides the various water exchange channels along the Po River delta and the lagoon systems of Venice and Marano (Figure 7A). Throughout the year, two wet periods are observed in late autumn (Nov, 5,620 m3s−1) and in mid-spring (May, 4,545 m3s−1), mainly governed by the SNAd seasonal cycle, and interrupted by a dry period with minimum river discharges during the summer months (Aug, 2,257 m3s−1). This pattern had already been reported previously by Struglia et al. (2004) but with different peak values (3,500, 1,600 and 3,000 m3s−1 in May, August and November, respectively). We argue the difference is because their study evaluated only 78% of river discharges in the Adriatic Sea.
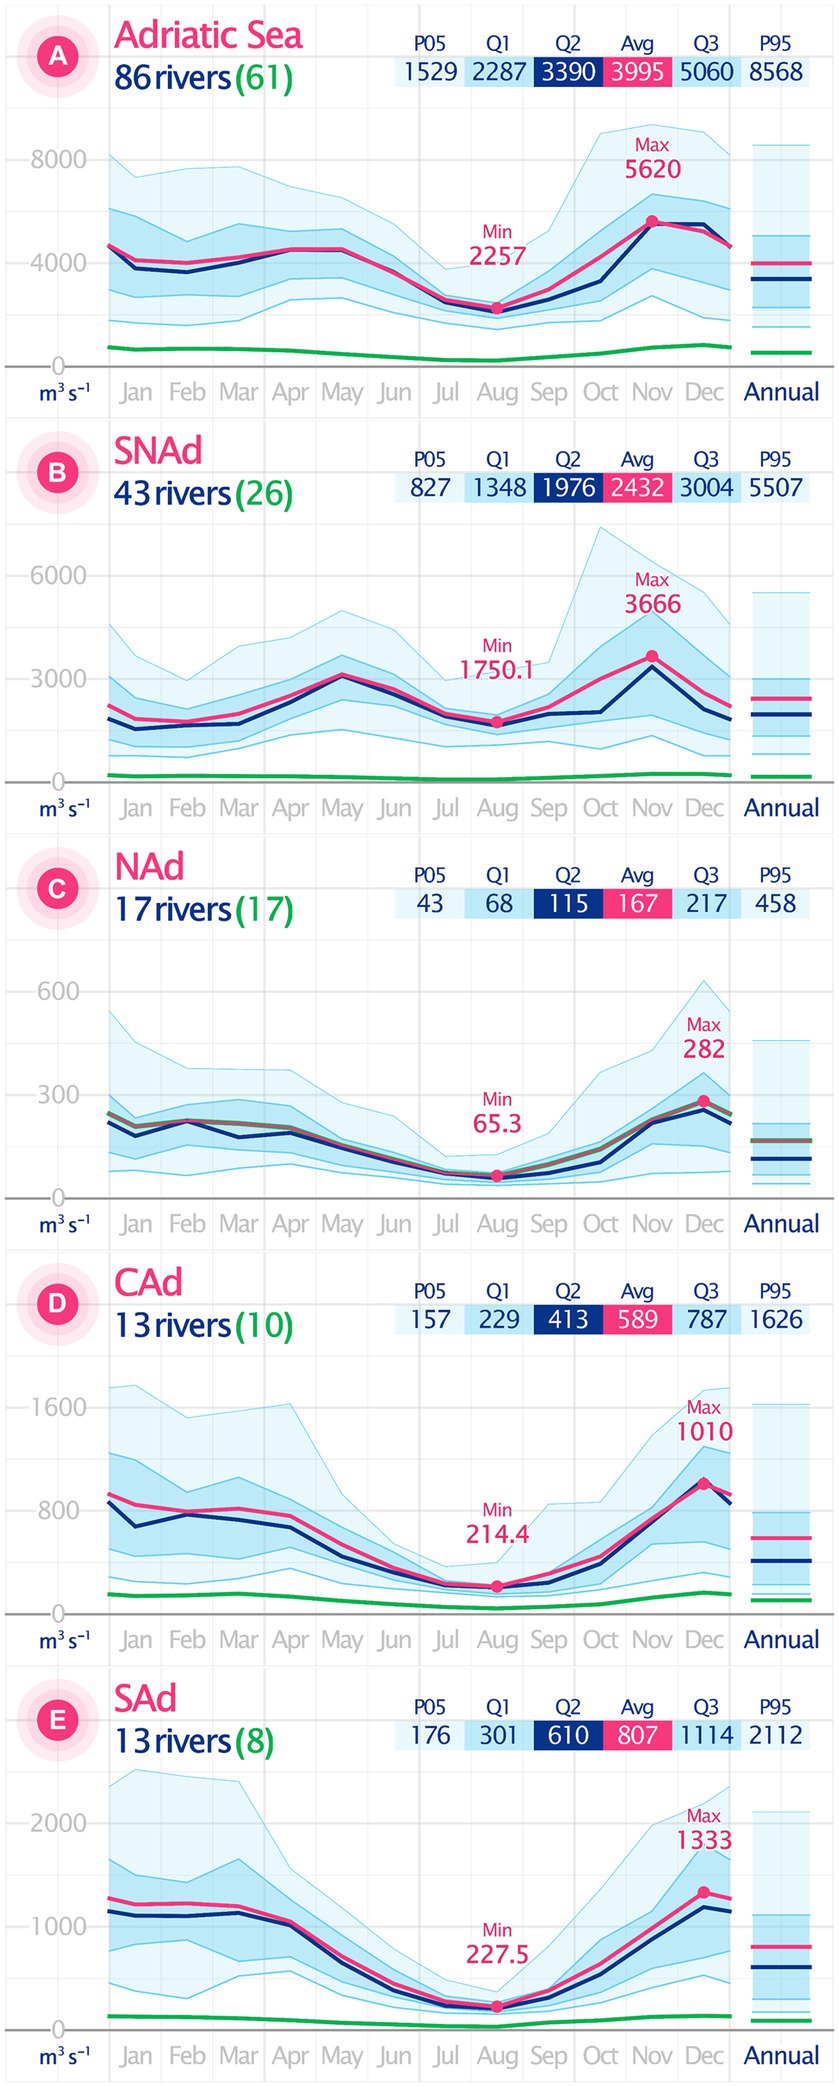
Figure 7. Monthly climatology of the overall river discharge (m3s−1) into (A) the Adriatic Sea, (B) SNAd, (C) NAd, (D) CAd, and (E) SAd during 1991–2022, shown by average (Avg, magenta line), median (Q2, blue line), 1st (Q1) and 3rd (Q3) quantiles (blue area), and bottom (P05) and top (P95) 95th percentiles (light blue area). Additionally, the overall river discharge considering only small rivers (annual discharges <1% of Adriatic Sea discharges) is presented (green line). The respective annual averaged river discharges are presented in the last column and the embedded table.
In November, the daily river discharge overcomes the annual average by 41%, often reaching 6,672 m3s−1 (Q3) and exceeding 9,368 m3s−1 in extreme cases (P95, Figure 7A). This increase, in large part, arises from the higher frequency of extratropical cyclones crossing the Adriatic Sea in late autumn (Aragão and Porcù, 2022), which, consequently, increases the precipitation collected by Alpine and Apennine rivers distributed along SNAd (Figure 7B) and NAd (Figure 7C) basins. The slight detachment of the average (Avg) and median (Q2) curves in the previous months (quite evident in October, Figure 7B) is an indication of brief but intense rainfalls typically associated with cyclones, which are intense enough to increase the averaged river discharge but not often to modify its median.
In the following months (Jan-Mar), the freshwater input into the Adriatic Sea gradually decreases to its annual levels, mainly sustained by the CAd and SAd rivers (Figures 7D,E). Unlike the SNAd and NAd rivers, which experienced a significant decrease in this period (Figures 7B,C), the Central and Southern Adriatic rivers preserve their discharges about 50% above their annual averages throughout the winter, also supported by small rivers (annual discharges <1% of Adriatic Sea discharges), which present their highest participation within the overall discharge during these months. This winter behaviour, added by the low influence of snowmelt during spring (Ricci et al., 2022), defines the annual cycle of discharges within CAd and SAd catchments, i.e., a long and continuous period of 8 months (Oct–May) in which daily average river discharges range about 30–50% above average, interrupted by intense dry spells peaking in August when discharges often drop to a meagre 25–30% of annual levels.
Before facing the dry summer months, the SNAd rivers receive an essential contribution of freshwater accumulated throughout the winter in the form of snow, which produces a secondary high-discharge peak during spring due to snow melting stored in catchment areas along the Alps and Apennines (Raicich, 1996; Struglia et al., 2004; Vilibić and Supić, 2005). Although the distribution parameters Q1 and Q3 (Figure 7B) present values close to the average discharge for May, the recent years have been marked by a significant reduction in snow accumulation during the winter in the Eastern Alps due to climate warming, suggesting that the current seasonal cycle may change in the coming years (Cozzi et al., 2012).
The dry period is the common feature amongst the seasonal cycles of river discharges in the four subregions of the Adriatic Sea. During the summer, the precipitation regime in the Central Mediterranean tends to be governed by thermal lows, which produce isolated rains inland (Aragão and Porcù, 2022) but are insufficient to supply the water demand. Only a tiny part of these waters reaches the riverbeds since the major part evaporates, is absorbed by soil and vegetation, or is withdrawn for irrigation (Provini et al., 1992; Montanari, 2012). Consequently, all rivers flowing to the Adriatic Sea present significant reductions in their discharges with a minimum in August when the statistical parameters show a discharge distribution with the slightest deviation in the 32 years evaluated. In this critical month, the Adriatic Sea experiences a 44% reduction in the freshwater input, mainly due to a significant reduction at the SNAd rivers (28%), which are responsible for 61% of the overall discharges. A 44% reduction is reasonable compared to the 36% reported by Struglia et al. (2004), valid for 78% of the overall discharges into the Adriatic Sea. In the other subregions, the discharge reductions are much more pronounced, CAd (61%), SAd (71%), and NAd (72%), since these regions are characterised by few rivers loaded by small catchment areas.
Amongst the 86 rivers evaluated, 61 were classified as minor. These rivers are highly susceptible to long periods of drought and may even experience zero flows in some months. As drought impacts are numerous and cumulative, Section 6 delves deeper into this topic and provides additional insights and trends with the help of a long-term climate indicator.
Since the EFAS reconstructions date back to the early 1990s, assessing how much river discharges have changed in the past three decades and which subregions were most influenced is essential to understanding the current freshwater dynamics in the Adriatic Sea. Figure 8 presents the monthly averages of river discharges into 1991–2022 for the Adriatic Sea and its subregions, as well as the statistical distribution parameters and the respective trends expressed by linear regression for the entire analysis period (32 years) and the last decade.
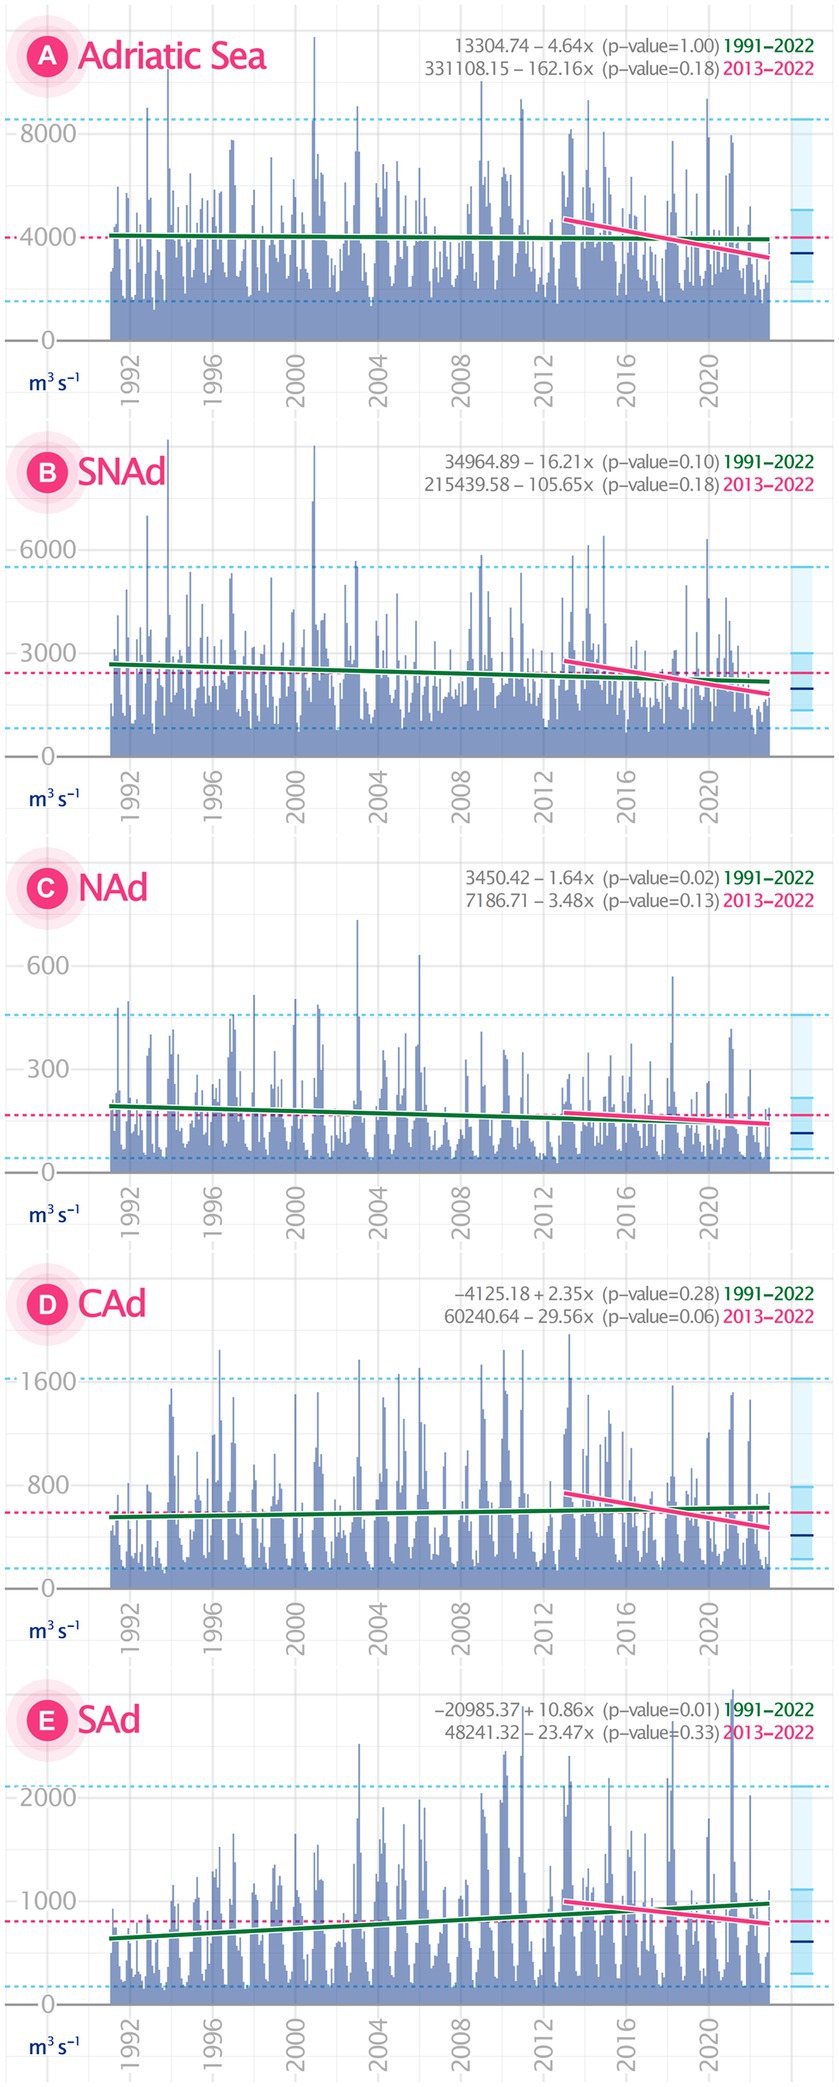
Figure 8. Monthly averaged river discharges (m3s−1, dark blue bars) into (A) the Adriatic Sea, (B) SNAd, (C) NAd, (D) CAd, and (E) SAd during 1991–2022. The monthly river discharge trends are presented for the last 32 years (green line, the whole period) and only for the last 10 years (magenta line). As a reference, the distribution parameters are presented in the sidebar (as in Figure 7).
In general, the time series presented in Figure 8 aligns with the previously discussed seasonal climatology, where the SNAd tends to guide the overall river discharge in the Adriatic Sea with two yearly peaks. Moving south (Figures 8C–E), the number of yearly peaks decreases gradually, reaching a clear single annual peak in CAd and SAd. Although the river discharge into the Adriatic Sea during the 32 years evaluated indicates a non-statistically significant negative trend, different responses are observed between the northern and southern subregions supported by statistically significant trends (except CAd). In the northern region, both SNAd and NAd (Figures 8B,C) have exhibited a decreasing trend over time, in agreement with the results of Giani et al. (2012), Appiotti et al. (2014) and Djakovac et al. (2015). The negative trend in SNAd is more than three times that of the Adriatic Sea. According to Montanari (2012), who analysed almost 100 years of observational discharges of the main Adriatic river, Po River at Pontelagoscuro, the non-significant trend for the 32 years raises concerns as it results from a fragile balance between intense drought and flood periods. On the other hand, the southern subregions, CAd and SAd, recorded positive trends, especially for SAd rivers (Figure 8E), with continuously ascendent discharges from Buna, Vjiose and Seman. These positive trends derive from two particular dry periods in southern Italy during the early 90s and the early 00s (Mendicino et al., 2008).
Reducing the analysis period to the last 10 years (2013–2022), negative trends are observed in river discharges from all subregions of the Adriatic, including the overall trend that shows a 170 m3s−1 drop by year (Figure 8A). In this case, all trends met the statistical significance criterion of 95% and had the lowest river discharges of the last 32 years in 2022, driving the strong negative trend. Proportionally, these trends point to a 10-year accumulated drop of 36, 24, 43 and 29% in SNAd, NAd, CAd and SAd (Figures 8B–E), resulting in a 35% reduction in river discharges from the Adriatic Sea since 2013. According to Pintori and Serpelloni (2023), only the Po River basin lost about 80 billion tons of freshwater during the 2021–2022 drought as a result not only of the lack of precipitation but also the water use in manifold activities of local economies deeply dependent of water resources (see Crovella et al., 2022; Mazzoni et al., 2022 and Pronti and Berbel, 2023).
Another noteworthy piece of information extracted from Figure 8 concerns extreme events. Taking the upper and lower 95th percentiles as a reference, it is possible to assess the frequency of flood and drought events over the 32 years evaluated. For example, comparing the SNAd river discharges of the first and the last 10 years analysed (Figure 8B), there are only three records under the P05 threshold in the first decade against five records in the last decade, showing that extreme drought event frequency almost doubled within the three decades analysed. Although these numbers suggest an increase in months with low discharges and follow the negative trend for the SNAd, this relationship appears somewhat unbalanced with the extreme flooding events. In the last 10 years (2013–2022), the SNAd experienced a double of months exceeding the P95 regarding the first decade evaluated (1991–2000), showing that the total number of extreme events is continually growing, regardless of whether it is a drought or flood event. This result reinforces the fragile balance highlighted by Montanari (2012), where average river discharges tend to increasingly compensate alternating extreme events of low and high discharges.
Conversely, Figure 8E shows five records under the P05 threshold in the first decade compared to only one recorded in the last decade, following Mendicino et al. (2008) results. Combining these numbers with seven records exceeding the P95 in the last decade and the absence of such records during the first decade, a compelling explanation can be established for the positive trend observed in the SAd. In this case, as SAd presents a seasonal cycle of river discharge with a single annual peak, months with high discharge are often consecutive by two to four consecutive months, which could be understood as exceptional seasons instead of exceptional months. This feature distinguishes the south Adriatic Sea subregions by its well-defined seasonal cycle of river discharges, whilst the north subregions tend to present isolated single months with exceptionally high discharges.
As discussed before, to understand the climate river discharge changes, the analysis must go further than identifing the number and frequency of months with discharges under a specific threshold. For this reason, Figure 9 shows the Standardised Flow Index considering a time window of 12 months (SFI12) computed using the monthly averaged river discharge presented in Figure 8. The time window could be easily modified to aggregate 3 or 6 months to assess short and medium-term moisture and precipitation conditions. Nevertheless, once the target here frames the climatological scale and the seasonal cycle was widely discussed in Section 4, the 12-month aggregation was applied to identify long-term precipitation patterns which could influence river discharges, reservoir levels and groundwater levels (Marcos-Garcia et al., 2017).
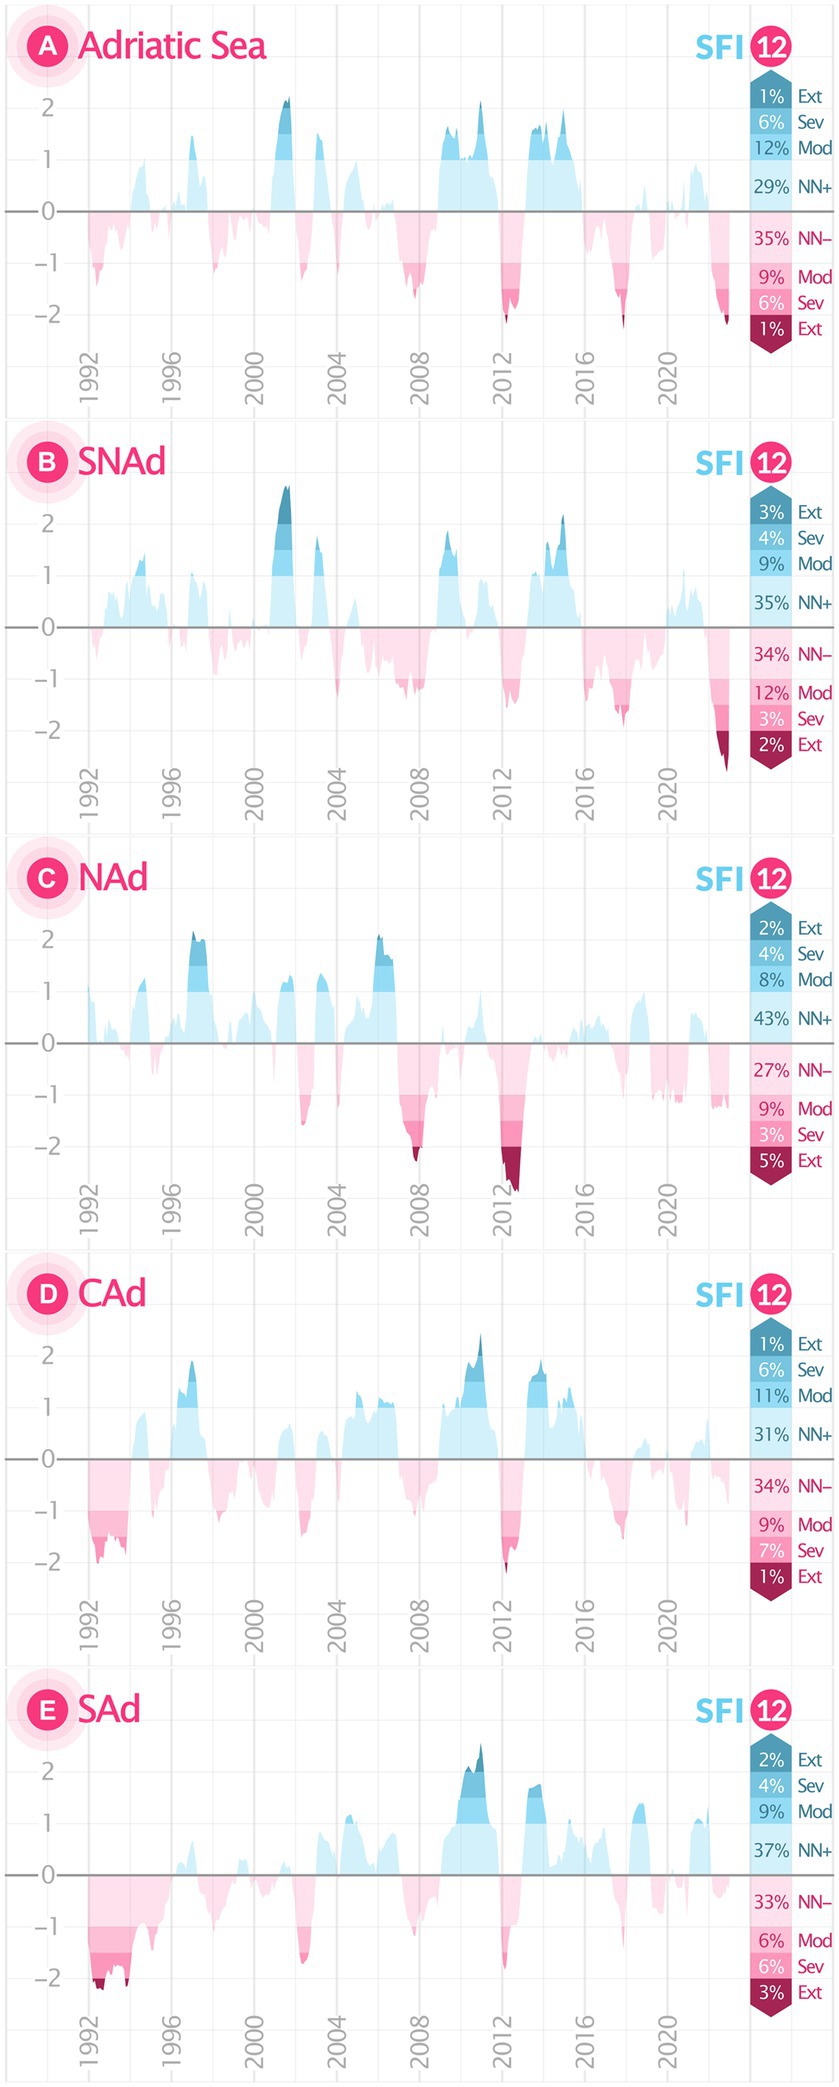
Figure 9. Standardised Flow Index (SFI) for (A) the Adriatic Sea, (B) SNAd, (C) NAd, (D) CAd, and (E) SAd from 1991 to 2022 with a 12-month timescale. Positive values represent wet months (blue areas), whilst negative values represent dry months (magenta areas). The intensity scale ranges from Near Normal (NN+ and NN-) to Moderate (Mod ±1.0), Severe (Sev ± 1.5) and Extreme (Ext ± 2.0), and their respective frequencies are presented in the sidebar.
As expected for a large river basin such as the Adriatic Sea, the last 32 years of river discharges showed a balanced SFI12 alternating between wet and dry periods. However, the SFI12 trend indicates an increasing intensification and extension of wet and dry periods, i.e., presenting shorter and near-normal intensities in the first decade analysed and more extended and intense periods in the last 10 years (Figure 9A). Although the SFI12 distribution shows about 18% of months under moderate to extreme wet conditions against 16% under dry conditions, the last presents a constantly increasing intensity since 2008 with a cyclic frequency of about 4–5 years. It is worth mentioning that the balanced SFI12 found for the Adriatic Sea is a result of its hydrological basin dimensions, which comprise river discharge deficits of some sub-basins constantly neutralised for high discharges in others, and vice-versa. As the analysed catchment area decreases, the range of variability on sub-basin discharges increases, triggering accumulated effects of wet and dry periods on the hydrological basin.
The long and dry period identified between 2008 and 2022 in the Adriatic Sea primarily responds to continuous reductions in the SNAd river discharges. As indicated in Figure 9B, the period was the longest and the only one with negative SFI12 reaching extreme values in 2022. According to Bonaldo et al. (2022), as drought periods are increasing in frequency, events like the one of 2022 will become ordinary in the relatively near future. This result supports Pintori and Serpelloni (2023), who also pointed out the period as the most extreme drought in recent decades, but based on observational data through the Standardised Precipitation and Evapotranspiration Index (SPEI) also for 12 months, proving once again the accuracy of the EFAS model in identifying the most relevant extreme events. In 2020, the SNAd’s SFI12 shifted, whilst the Adriatic Sea oscillated through positive and negative values in response to the low discharges still registered along other Adriatic subregions (Figures 9C–E), following their river discharge trends (Figure 8).
As discussed in Section 5, the vulnerability of NAd rivers to drought events is even more prominent in Figure 9C (2007–2013), when two periods of intense drought caused more than 18 months with SFI12 at extremely negative levels. This result postulates the NAd rivers as the most exposed to extreme drought events. According to Ricci et al. (2022), these systematic reductions in freshwater inputs in NAd derive from modifications in the seasonal precipitation cycle. Additionally, this vulnerability is amplified given the characteristics of most of NAd rivers (western coast), which naturally reduce their levels during the summer months (some of them dry completely), exposing the entire coastal region to deficits of biomass loads, increases of salinity in surface waters and, consequently, significant changes in the vertical distribution of nutrients (Zavatarelli et al., 1998; Cozzi and Giani, 2011).
Whilst 2008–2022 was marked by extreme drought events in the northern subregions of the Adriatic Sea (SNAd and NAd), the CAd and SAd subregions experienced exceptionally wet periods, with some months classified as extremely wet in both subregions during 2010 (Figures 9D,E). In 2012, the SFI12 accumulated in CAd and SAd also presented negative values but not as intense as in SNAd and NAd and then shifted to positive for 3–4 years. Despite the substantial difference between the total volume of freshwater delivered at each Adriatic Sea subregion, several pieces of evidence suggest that the whole Adriatic Sea discharge is governed by a balanced relationship between discharges from the northern (SNAd and NAd) and southern (CAd and SAd) regions, triggered by changes in the seasonal cycle of precipitation which rarely presents the same trend simultaneously in both areas. Many studies in the literature show the Mediterranean precipitation variability intensely correlated with several atmospheric teleconnections, such as El Niño Southern Oscillation (ENSO), North Atlantic Oscillation (NAO), East Atlantic Pattern (EAP), Scandinavian (SCA) and others (Quadrelli et al., 2001; Philandras et al., 2011; Krichak et al., 2014; Sánchez and Aragão, 2021). According to Kalimeris et al. (2017), along the Adriatic coast, most of the variability in local precipitation occurs at bi-decadal scales, when the SCA effects weaken due to the dominant Bora circulation, but the EA can temporarily affect the decadal variability during winter. On the other hand, at short time scales (months), precipitation strongly correlates with NAO and other Atlantic patterns rather than Arctic patterns (Romano et al., 2022). Nevertheless, it is essential to highlight the lack of studies dedicated to the Adriatic Sea that provide a detailed evaluation of the interaction of these teleconnection components through different temporal scales.
This study revisited the freshwater inputs into the Adriatic Sea via river discharges over the last climatological period (1991–2022) obtained from the EFAS reconstructions and a careful and accurate method for identifying rivers, allowing accounting discharges of all rivers with average daily runoff exceeding 1 m3s−1. In total, 86 rivers compose the freshwater balance in the Adriatic Sea, evaluated individually and by each Adriatic subregion, and taking advantage of dedicated climate indicators computed daily, monthly and annually to quantify river discharge’s extreme levels (wet and dry) and classify seasonal cycles within a climatological scale.
The data extraction method proved to be a necessary step for a suitable representation of river discharges in all subregions of the Adriatic Sea and the most diverse classes of river basins. The assessment against observational data was possible for 67 of 86 identified rivers, which account for more than 96% of freshwater inputs into the Adriatic Sea. The EFAS estimates proved reliable even for small rivers, supported by relatively small errors and a correlation of 0.91. EFAS strongly underestimated the river discharges in the Venice and the Marano Lagoons, showing that the representation of lake and lagoon outflows is still imprecise due to the lack of observational measurements in situ, i.e., along the coast (outlets) and river mouths. Concerning the most significant rivers (those with average river discharges over 5% of the Adriatic overall or 200 m3s−1), only the Albanian rivers (Buna and Drin) presented discharge estimates conflicting with observational data, justified by several river course modifications for hydroelectric plant purposes after the free available data on literature. Although Vodopivec et al. (2022) have recently updated the monthly climatology of discharges from the Buna+Drin and Seman Rivers, these data have not yet been assimilated by EFAS. Furthermore, they are still insufficient to quantify River Drin discharges individually, resulting in the most significant bias between observed (692 m3s−1, Ludwig et al., 2009) and reconstructed (13 m3s−1, EFAS) mean river discharges found throughout the Adriatic Sea. Given the relevance of these rivers to the Adriatic hydrographic basin, the free availability of continuous and updated measurements of river discharges is exceptionally urgent for a better representation of these rivers in hydrological models.
The seasonal cycle analysis allowed the identification of two river discharge regimes in the Adriatic Sea. The first is characterised by two annual flood peaks in November and May, separated by a dry peak in August, whilst the second presents only one flood peak in December and a dry peak in August. The regime with two annual floods is exclusively found in the 43 rivers of the SNAd, which, given their dimensions, govern 61% of the overall discharges in the Adriatic Sea and lead the entire basin to this regime. However, due to the successive reduction in snow accumulation over the Alpine and Apennine areas during the winter months, there is a high risk of the secondary flood peak disappearing in May.
Over the past 32 years, river discharges have shown different trends along the Adriatic Sea subregions, where a delicate balance between dry seasons in some subregions has been slightly balanced by flood seasons in others and vice versa. This delicate balance, combined with the diversity of its river basins, prevents us from estimating a trend with statistical significance for the Adriatic Sea. However, the river discharge trends are forthright when computed individually for each subregion, balancing slightly negative trends in the northern subregions (−0.6% and − 1.0% per year in SNAd and NAd) with intriguingly positive trends in the southern subregions (+0.4% and + 1.3% per year in CAd and SAd). When the analysis window narrows to the last decade (2013–2022), the balance breaks down, and a strong negative trend emerges across the entire Adriatic Sea, without exception, indicating reductions of −4.2% per year in freshwater input throughout the river basin. According to the SFI results, a climate indicator used to estimate the long-term impact of drought and flood periods on river discharges, 2022 was crucial for the last negative decadal trend. During this year, the northern Adriatic experienced the driest period in the last 32 years, whilst the southern Adriatic experienced river discharge reductions during flood months. Nevertheless, the most worrying element about the extreme drought of 2022 is that this year is part of a drought cycle that has continuously reduced freshwater availability in the Adriatic Sea every 4–5 years since 2008.
Finally, it is noteworthy that the study comprises data on the daily river discharges of 86 rivers, including the corresponding discharges per subregion (SNAd, NAd, CAd, and SAd) and the entire Adriatic Sea, defining the framework for monitoring the hydrological cycle trends and the indicators that might allow reveal sudden changes. Furthermore, the data set provides the geographical coordinates of each river mouth and the Adriatic subregion to which it pertains. The data span from January 1, 1991, to December 31, 2022, with daily frequency and are expected to improve the representation of riverine freshwater inputs in hydrodynamic, biogeochemical, and oceanographic simulations dedicated to the Adriatic Sea. It will be interesting to continue this work for years to come and connect with the ocean circulation-induced changes, as shown by Verri et al. (2024).
The datasets presented in this study can be found in online repositories. The names of the repository/repositories and accession number(s) can be found at: https://erddap.cmcc-opa.eu/erddap/search/index.html?page=1&itemsPerPage=1000&searchFor=AdriaClim+Indicators+%7C+RD+and+MH.
LA: Conceptualization, Data curation, Formal analysis, Investigation, Methodology, Resources, Software, Supervision, Validation, Visualization, Writing – original draft, Writing – review & editing. LM: Conceptualization, Formal analysis, Investigation, Methodology, Resources, Writing – original draft, Writing – review & editing. NP: Conceptualization, Funding acquisition, Investigation, Methodology, Project administration, Supervision, Writing – review & editing. GV: Formal analysis, Resources, Writing – review & editing, Methodology. AS: Formal analysis, Writing – review & editing, Methodology. SS: Project administration.
The author(s) declare financial support was received for the research, authorship, and/or publication of this article. This work is carried out under the AdriaCLIM project (ID 10252001) funded by the Italy-Croatia Interreg Cooperation Programme through the European Regional Development Fund.
The authors would like to thank ECMWF and Copernicus for making the EFAS data set available. We also thank the two reviewers of this paper for their comments, which helped us to improve the manuscript.
The authors declare that the research was conducted in the absence of any commercial or financial relationships that could be construed as a potential conflict of interest.
All claims expressed in this article are solely those of the authors and do not necessarily represent those of their affiliated organizations, or those of the publisher, the editors and the reviewers. Any product that may be evaluated in this article, or claim that may be made by its manufacturer, is not guaranteed or endorsed by the publisher.
Appiotti, F., Krželj, M., Russo, A., Ferretti, M., Bastianini, M., and Marincioni, F. (2014). A multidisciplinary study on the effects of climate change in the northern Adriatic Sea and the Marche region (Central Italy). Reg. Environ. Chang. 14, 2007–2024. doi: 10.1007/s10113-013-0451-5
Aragão, L., and Porcù, F. (2022). Cyclonic activity in the Mediterranean region from a high-resolution perspective using ECMWF ERA5 dataset. Clim. Dyn. 58, 1293–1310. doi: 10.1007/s00382-021-05963-x
Artegiani, A., Paschini, E., Russo, A., Bregant, D., Raicich, F., and Pinardi, N. (1997). The Adriatic Sea general circulation. Part I: Air–Sea interactions and water mass structure. J. Phys. Oceanogr. 27, 1492–1514. doi: 10.1175/1520-0485(1997)027<1492:TASGCP>2.0.CO;2
Bartholmes, J., Thielen, J., Ramos, M., and Gentilini, S. (2009). The European flood alert system EFAS – part 2: statistical skill assessment of probabilistic and deterministic operational forecasts. Hydrol. Earth Syst. Sci. 13, 141–153. doi: 10.5194/hess-13-141-2009
Bonaldo, D., Bellafiore, D., Ferrarin, C., Ferretti, R., Ricchi, A., Sangelantoni, L., et al. (2022). The summer 2022 drought: a taste of future climate for the Po valley (Italy)? Reg. Environ. Chang. 23, 1–6. doi: 10.1007/s10113-022-02004-z
Carniel, S., Benetazzo, A., Bonaldo, D., Falcieri, F., Miglietta, M., Ricchi, A., et al. (2016). Scratching beneath the surface while coupling atmosphere, ocean and waves: analysis of a dense water formation event. Ocean Model. 101, 101–112. doi: 10.1016/j.ocemod.2016.03.007
Cessi, P., Pinardi, N., and Lyubartsev, V. (2014). Energetics of semienclosed basins with two-layer flows at the strait. J. Phys. Oceanogr. 44, 967–979. doi: 10.1175/JPO-D-13-0129.1
Coppola, E., Verdecchia, M., Giorgi, F., Colaiuda, V., Tomassetti, B., and Lombardi, A. (2014). Changing hydrological conditions in the Po basin under global warming. Sci. Total Environ. 493, 1183–1196. doi: 10.1016/j.scitotenv.2014.03.003
Cozzi, S., Falconi, C., Comici, C., Čermelj, B., Kovac, N., Turk, V., et al. (2012). Recent evolution of river discharges in the Gulf of Trieste and their potential response to climate changes and anthropogenic pressure. Estuar. Coast. Shelf Sci. 115, 14–24. doi: 10.1016/j.ecss.2012.03.005
Cozzi, S., and Giani, M. (2011). River water and nutrient discharges in the northern Adriatic Sea: current importance and long term changes. Cont. Shelf Res. 31, 1881–1893. doi: 10.1016/j.csr.2011.08.010
Crovella, T., Paiano, A., and Lagioia, G. (2022). A meso-level water use assessment in the Mediterranean agriculture. Multiple applications of water footprint for some traditional crops. J. Clean. Prod. 330:129886. doi: 10.1016/j.jclepro.2021.129886
Denamiel, C., Tojčić, I., and Vilibić, I. (2020). Far future climate (2060–2100) of the northern Adriatic air–sea heat transfers associated with extreme bora events. Clim. Dyn. 55, 3043–3066. doi: 10.1007/s00382-020-05435-8
Denamiel, C., Tojčić, I., and Vilibić, I. (2021). Balancing accuracy and efficiency of atmospheric models in the northern Adriatic during severe bora events. J. Geophys. Res. Atmos. 126, 1–25. doi: 10.1029/2020JD033516
DeRoo, A., Wesseling, C., and Van Deursen, W. (2000). Physically based river basin modelling within a GIS: the LISFLOOD model. Hydrol. Process. 14, 1981–1992. doi: 10.1002/1099-1085(20000815/30)14:11/12<1981::AID-HYP49>3.0.CO;2-F
Djakovac, T., Supić, N., BernardiAubry, F., Degobbis, D., and Giani, M. (2015). Mechanisms of hypoxia frequency changes in the northern Adriatic Sea during the period 1972–2012. J. Mar. Syst. 141, 179–189. doi: 10.1016/j.jmarsys.2014.08.001
Dunić, N., Supić, N., Sevault, F., and Vilibić, I. (2023). The northern Adriatic circulation regimes in the future winter climate. Clim. Dyn. 60, 3471–3484. doi: 10.1007/s00382-022-06516-6
Ferrarin, C., Davolio, S., Bellafiore, D., Ghezzo, M., Maicu, F., Mc Kiver, W., et al. (2019). Cross-scale operational oceanography in the Adriatic Sea. J. Oper. Oceanogr. 12, 86–103. doi: 10.1080/1755876X.2019.1576275
Ferrarin, C., Orlić, M., Bajo, M., Davolio, S., Umgiesser, G., and Lionello, P. (2023). The contribution of a mesoscale cyclone and associated meteotsunami to the exceptional flood in Venice on November 12, 2019. Q. J. R. Meteorol. Soc. 149, 2929–2942. doi: 10.1002/qj.4539
Giani, M., Djakovac, T., Degobbis, D., Cozzi, S., Solidoro, C., and Umani, S. F. (2012). Recent changes in the marine ecosystems of the northern Adriatic Sea. Estuar. Coast. Shelf Sci. 115, 1–13. doi: 10.1016/j.ecss.2012.08.023
Gualdi, S., Somot, S., Li, L., Artale, V., Adani, M., Bellucci, A., et al. (2013). The CIRCE simulations: regional climate change projections with realistic representation of the Mediterranean Sea. Bull. Am. Meteorol. Soc. 94, 65–81. doi: 10.1175/BAMS-D-11-00136.1
Kalimeris, A., Ranieri, E., Founda, D., and Norrant, C. (2017). Variability modes of precipitation along a Central Mediterranean area and their relations with ENSO, NAO, and other climatic patterns. Atmos. Res. 198, 56–80. doi: 10.1016/j.atmosres.2017.07.031
Knez, S., Štrbac, S., and Podbregar, I. (2022). Climate change in the Western Balkans and EU green Deal: status, mitigation and challenges. Energy Sustain. Soc. 12, 1–14. doi: 10.1186/s13705-021-00328-y
Knoben, M. W. J., Freer, E. J., and Woods, A. R. (2019). Technical note: inherent benchmark or not? Comparing Nash-Sutcliffe and Kling-Gupta efficiency scores. Hydrol. Earth Syst. Sci. 23, 4323–4331. doi: 10.5194/hess-23-4323-2019
Krichak, S. O., Breitgand, J. S., Gualdi, S., and Feldstein, S. B. (2014). Teleconnection–extreme precipitation relationships over the Mediterranean region. Theor. Appl. Climatol. 117, 679–692. doi: 10.1007/s00704-013-1036-4
Lazzari, P., Solidoro, C., Ibello, V., Salon, S., Teruzzi, A., Béranger, K., et al. (2012). Seasonal and inter-annual variability of plankton chlorophyll and primary production in the Mediterranean Sea: a modelling approach. Biogeosciences 9, 217–233. doi: 10.5194/bg-9-217-2012
Ludwig, W., Dumont, E., Meybeck, M., and Heussner, S. (2009). River discharges of water and nutrients to the Mediterranean and Black Sea: major drivers for ecosystem changes during past and future decades? Prog. Oceanogr. 80, 199–217. doi: 10.1016/j.pocean.2009.02.001
Marcos-Garcia, P., Lopez-Nicolas, A., and Pulido-Velazquez, M. (2017). Combined use of relative drought indices to analyse climate change impact on meteorological and hydrological droughts in a Mediterranean basin. J. Hydrol. 554, 292–305. doi: 10.1016/j.jhydrol.2017.09.028
Mazzoni, F., Marsili, V., Alvisi, S., and Franchini, M. (2022). Exploring the impacts of tourism and weather on water consumption at different spatiotemporal scales: evidence from a coastal area on the Adriatic Sea (northern Italy). Environ. Res. Infrastruct. Sustain. 2:025005. doi: 10.1088/2634-4505/ac611f
McKee, T., Doesken, N., and Kleist, J. (2013). The relationship of drought frequency and duration to time scales. Proceedings of the 8th Conference on Applied Climatology, 17 179–183, Anaheim
Mendicino, G., Senatore, A., and Versace, P. (2008). A groundwater resource index (GRI) for drought monitoring and forecasting in a Mediterranean climate. J. Hydrol. 357, 282–302. doi: 10.1016/j.jhydrol.2008.05.005
Montanari, A. (2012). Hydrology of the Po River: looking for changing patterns in river discharge. Hydrol. Earth Syst. Sci. 16, 3739–3747. doi: 10.5194/hess-16-3739-2012
Mussap, G., Zavatarelli, M., Pinardi, N., and Celio, M. (2016). A management oriented 1-D ecosystem model: implementation in the Gulf of Trieste (Adriatic Sea). Reg. Stud. Mar. Sci. 6, 109–123. doi: 10.1016/j.rsma.2016.03.015
Orlić, M., Dadić, V., Grbec, B., Leder, N., Marki, A., Matić, F., et al. (2006). Wintertime buoyancy forcing, changing seawater properties, and two different circulation systems produced in the Adriatic. J. Geophys. Res. Oceans 111, 1–21. doi: 10.1029/2005JC003271
Peixoto, J., DeAlmeida, M., Rosen, R., and Salstein, D. (1982). Atmospheric moisture transport and the water balance of the Mediterranean Sea. Water Resour. Res. 18, 83–90. doi: 10.1029/WR018i001p00083
Philandras, C. M., Nastos, P. T., Kapsomenakis, J., Douvis, K. C., Tselioudis, G., and Zerefos, C. S. (2011). Long term precipitation trends and variability within the Mediterranean region. Nat. Hazards Earth Syst. Sci. 11, 3235–3250. doi: 10.5194/nhess-11-3235-2011
Pinardi, N., Estournel, C., Cessi, P., Escudier, R., and Lyubartsev, V. (2023). “Dense and deep water formation processes and Mediterranean overturning circulation” in Oceanography of the Mediterranean Sea (Amsterdam, Netherlands: Elsevier), 209–261.
Pintori, F., and Serpelloni, E. (2023). Drought-induced vertical displacements and water loss in the Po river basin (northern Italy) from GNSS measurements. ESS Open Archive 1-23. doi: 10.22541/essoar.168606938.84604867/v1 [Pre-print].
Polimene, L., Pinardi, N., Zavatarelli, M., and Colella, S. (2006). The Adriatic Sea ecosystem seasonal cycle: validation of a three-dimensional numerical model. J. Geophys. Res. Oceans 112:C03S19. doi: 10.1029/2005JC003260
Pronti, A., and Berbel, J. (2023). The impact of volumetric water tariffs in irrigated agriculture in northern Italy. Environ. Impact Assess. Rev. 98:106922. doi: 10.1016/j.eiar.2022.106922
Provini, A., Crosa, G., Marchetti, R., Vollenweider, R., Marchetti, R., and Viviani, R. (1992). Nutrient export from the Po and Adige river basins over the last 20 years. Sci. Total. Environ. 1, 291–313. doi: 10.1016/B978-0-444-89990-3.50027-4
Quadrelli, R., Pavan, V., and Molteni, F. (2001). Wintertime variability of Mediterranean precipitation and its links with large-scale circulation anomalies. Clim. Dyn. 17, 457–466. doi: 10.1007/s003820000121
Querin, S., Cossarini, G., and Solidoro, C. (2013). Simulating the formation and fate of dense water in a midlatitude marginal sea during normal and warm winter conditions. J. Geophys. Res. Oceans 118, 885–900. doi: 10.1002/jgrc.20092
Raicich, F. (1996). On the fresh balance of the Adriatic Sea. J. Mar. Syst. 9, 305–319. doi: 10.1016/S0924-7963(96)00042-5
Ricci, F., Capellacci, S., Campanelli, A., Grilli, F., Marini, M., and Penna, A. (2022). Long-term dynamics of annual and seasonal physical and biogeochemical properties: role of minor river discharges in the north-western Adriatic coast. Estuar. Coast. Shelf Sci. 272:107902. doi: 10.1016/j.ecss.2022.107902
Robinson, A. R., Malanotte-Rizzoli, P., Hecht, A., Michelato, A., Roether, W., Theocharis, A., et al. (1992). General circulation of the eastern Mediterranean. Earth Sci. Rev. 32, 285–309. doi: 10.1016/0012-8252(92)90002-B
Rodellas, V., Garcia-Orellana, J., Masque, P., Feldman, M., and Weinstein, Y. (2015). Submarine groundwater discharge as a major source of nutrients to the Mediterranean Sea. Proc. Natl. Acad. Sci. 112, 3926–3930. doi: 10.1073/pnas.1419049112
Romano, E., Petrangeli, A. B., Salerno, F., and Guyennon, N. (2022). Do recent meteorological drought events in Central Italy result from long-term trend or increasing variability? Int. J. Climatol. 42, 4111–4128. doi: 10.1002/joc.7487
Sánchez, P.L., and Aragão, L. (2021). North Atlantic oscillation-related impacts on precipitation over the Italian peninsula during the 1979-2020 period. EGU General Assembly 2021, 9183. Vienna, Austria.
Sanchez-Gomez, E., Somot, S., Josey, S., Dubois, C., Elguindi, N., and Déqué, M. (2011). Evaluation of Mediterranean Sea water and heat budgets simulated by an ensemble of high resolution regional climate models. Clim. Dyn. 37, 2067–2086. doi: 10.1007/s00382-011-1012-6
Shukla, S., and Wood, A. (2008). Use of a standardised runoff index for characterising hydrologic drought. Geophys. Res. Lett. 35, 1–17. doi: 10.1029/2007GL032487
Struglia, M. V., Mariotti, A., and Filograsso, A. (2004). River discharge into the Mediterranean Sea: climatology and aspects of the observed variability. J. Clim. 17, 4740–4751. doi: 10.1175/JCLI-3225.1
Svoboda, M., Hayes, M., and Wood, D. (2012). Standardised precipitation index user guide. World Meteorological Organization, 1090, 1–16. Geneva
Tanhua, T., Hainbucher, D., Schroeder, K., Cardin, V., Alvarez, M., and Civitarese, G. (2013). The Mediterranean Sea system: a review and an introduction to the special issue. Ocean Sci. 9, 789–803. doi: 10.5194/os-9-789-2013
Terrado, M., Acuna, V., Ennaanay, D., Tallis, H., and Sabater, S. (2014). Impact of climate extremes on hydrological ecosystem services in a heavily humanised Mediterranean basin. Ecol. Indic. 37, 199–209. doi: 10.1016/j.ecolind.2013.01.016
Thielen, J., Bartholmes, J., Ramos, M., and de Roo, A. (2009). The European flood alert system – part 1: concept and development. Hydrol. Earth Syst. Sci. 13, 125–140. doi: 10.5194/hess-13-125-2009
Van Der Knijff, J., Younis, J., and De Roo, A. (2010). LISFLOOD: a GIS-based distributed model for river basin scale water balance and flood simulation. Int. J. Geogr. Inf. Sci. 24, 189–212. doi: 10.1080/13658810802549154
Verri, G., Furnari, L., Gunduz, M., Senatore, A., Santos da Costa, V., De Lorenzis, A., et al., (2024). Climate projections of the Adriatic Sea: the role of river release. Front. Clim.. Under review.
Verri, G., Pinardi, N., Gochis, D., Tribbia, J., Navarra, A., Coppini, G., et al. (2017). A meteo-hydrological modelling system for the reconstruction of river runoff: the case of the Ofanto river catchment. Nat. Hazards Earth Syst. Sci. 17, 1741–1761. doi: 10.5194/nhess-17-1741-2017
Verri, G., Pinardi, N., Oddo, P., Ciliberti, S., and Coppini, G. (2018). River runoff influences on the Central Mediterranean overturning. Clim. Dyn. 50, 1675–1703. doi: 10.1007/s00382-017-3715-9
Vested, H., Berg, P., and Uhrenholdt, T. (1998). Dense water formation in the northern Adriatic. J. Mar. Syst. 18, 135–160. doi: 10.1016/S0924-7963(98)00009-8
Vezzoli, R., Mercogliano, P., Pecora, S., Zollo, A., and Cacciamani, C. (2015). Hydrological simulation of Po River (North Italy) discharge under climate change scenarios using the RCM COSMO-CLM. Sci. Total Environ. 521-522, 346–358. doi: 10.1016/j.scitotenv.2015.03.096
Vilibić, I., Mihanović, H., Janeković, I., and Šepić, J. (2016). Modelling the formation of dense water in the northern Adriatic: sensitivity studies. Ocean Model. 101, 17–29. doi: 10.1016/j.ocemod.2016.03.001
Vilibić, I., and Supić, N. (2005). Dense water generation on a shelf: the case of the Adriatic Sea. Ocean Dyn. 55, 403–415. doi: 10.1007/s10236-005-0030-5
Vilibić, I., Zemunik, P., Šepić, J., Dunić, N., Marzouk, O., Mihanović, H., et al. (2019). Present-climate trends and variability in thermohaline properties of the northern Adriatic shelf. Ocean Sci. 15, 1351–1362. doi: 10.5194/os-15-1351-2019
Vodopivec, M., Zaimi, K., and Peliz, Á. (2022). The freshwater balance of the Adriatic Sea: a sensitivity study. J. Geophys. Res. Oceans 127:e2022JC018870. doi: 10.1029/2022JC018870
Wetterhall, F., and Di Giuseppe, F. (2018). The benefit of seamless forecasts for hydrological predictions over Europe. Hydrol. Earth Syst. Sci. 22, 3409–3420. doi: 10.5194/hess-22-3409-2018
Keywords: river discharge, Adriatic Sea, EFAS, climatology, climate indicators, seasonal cycle
Citation: Aragão L, Mentaschi L, Pinardi N, Verri G, Senatore A and Di Sabatino S (2024) The freshwater discharge into the Adriatic Sea revisited. Front. Clim. 6:1368456. doi: 10.3389/fclim.2024.1368456
Edited by:
Francesco Marcello Falcieri, National Research Council (CNR), ItalyReviewed by:
Giovanna Pisacane, Energy and Sustainable Economic Development (ENEA), ItalyCopyright © 2024 Aragão, Mentaschi, Pinardi, Verri, Senatore and Di Sabatino. This is an open-access article distributed under the terms of the Creative Commons Attribution License (CC BY). The use, distribution or reproduction in other forums is permitted, provided the original author(s) and the copyright owner(s) are credited and that the original publication in this journal is cited, in accordance with accepted academic practice. No use, distribution or reproduction is permitted which does not comply with these terms.
*Correspondence: Leonardo Aragão, bGVvbmFyZG8uYXJhZ2FvQHVuaWJvLml0
Disclaimer: All claims expressed in this article are solely those of the authors and do not necessarily represent those of their affiliated organizations, or those of the publisher, the editors and the reviewers. Any product that may be evaluated in this article or claim that may be made by its manufacturer is not guaranteed or endorsed by the publisher.
Research integrity at Frontiers
Learn more about the work of our research integrity team to safeguard the quality of each article we publish.