 Yan Ma
 Lina Guo2
95% of researchers rate our articles as excellent or good
Learn more about the work of our research integrity team to safeguard the quality of each article we publish.
Find out more
ORIGINAL RESEARCH article
Front. Clim. , 14 May 2024
Sec. Climate Monitoring
Volume 6 - 2024 | https://doi.org/10.3389/fclim.2024.1361511
The climatic characteristics of tropical cyclones affecting Qingdao, China, were analyzed from the aspects of frequency, period, and intensity of the tropical cyclones and their impact on rainfall in Qingdao by referring to the Typhoon Yearbook, the tropical cyclone data of China during 1949–2020 as well as surface meteorological observations. The results showed that the frequency of tropical cyclones affecting Qingdao during 1949–2020 took on an overall decreasing trend and mostly exhibited a significant variation period of 2–4 year. Tropical cyclones with the track of turning after landfall and continuing northward after landfall accounted for 47.9%. In July, there were tropical cyclones mainly followed tracks of continuing northward after landfall, and tracks turning after landfall mostly occurred in September. The intensity of the tropical cyclones showed an overall weakening feature with distinct inter-decadal variations, and it did not change much when the northward tropical cyclones close affecting Qingdao. The different track of tropical cyclones had spatially heterogeneous, strong rainfall in Qingdao with the track of continuing northward after landfall brought the highest daily and process rainfall to Qingdao, while the tropical cyclones turning nearshore or advancing offshore before landfall had relatively little rainfall.
While the global climate is undergoing a process of change characterized by warming (Ding and Dai, 1994; Chen et al., 1998), the potential destructive power of tropical cyclones is growing much stronger, the proportion of super typhoons is notably increasing (Emanuel, 2005; Webster et al., 2005), and losses due to typhoon activity in the coastal regions are rising (Zhang et al., 2005). The International Workshop on Tropical Cyclones (IWTC) of the World Meteorological Organization (WMO) predicted that the increase in greenhouse gasses would reduce the frequency of global tropical cyclones by 6 to 34%, but increase the proportion of strong typhoons (Knutson et al., 2020).
China is adjacent to the northwestern Pacific Ocean, and tropical cyclones affect China coastal areas from south to north in spring and summer (Yan et al., 2007; Li et al., 2012). The ESCAP/WMO Typhoon Committee believes that the tropical cyclones and typhoons in the northwestern Pacific Ocean have a smaller annual frequency and that the tropical cyclones landing on mainland China show a decreasing frequency, a weakening maximum intensity, but no clear trend in their average intensity (Lee et al., 2001). Lei Xiaotu and Ming (2009) pointed out that the frequency of tropical cyclones affecting and landing in China showed a weak decreasing trend, but the frequency of tropical cyclones with the grade of typhoon landing in China did not change much or increased. Based the data of 1955–2006, Ying et al. (2011) pointed out that tropical cyclones affecting Northeast China are significantly rarer, while the frequency and the distribution of tropical cyclones in other regions of China have not changed significantly. They also found that the frequency of tropical cyclones has dropped significantly in northwestern South China Sea, Guangdong Province and Shandong Peninsula. Typhoons bring the maximum rainfall in the central-eastern part of Taiwan Island and parts of Hainan Island and bring the minimum rainfall to parts of Inner Mongolia, Shanxi and Sichuan Provinces (Wang et al., 2008).
The northward tropical cyclones can move across the 50°N zone after landing in China, and approximately 2.1% of them land in Shandong Province (Li et al., 2004). Tracks turning at mid-latitude, tracks turning at high latitude, and tracks moving directly northward are the main tracks of typhoons that cause strong rainfall and strong winds in northern China (Gao et al., 2017), and typhoons continuing northward after landfall produce heavy rainfall without fail (Gu et al., 1999). Jin et al. (2006), Wang and Jun (2006), and Zhou and Yang (2007) analyzed the intermonthly, interannual, and interdecadal climatic changes in the northward tropical cyclones based on observations from meteorological stations in different periods and summarized the temporal and spatial heterogeneities of the effects of the northward tropical cyclones. In view of the climatic characteristics of tropical cyclones affecting Shandong Province, Cong Chunhua and Wei (2016) pointed out that the typhoons that landed in the Shandong area were mainly distributed in southeastern Shandong and the southern coastal areas of the Shandong Peninsula and that the rainstorms brought by them were mainly concentrated in southeastern Shandong and the southern and eastern Shandong Peninsula. Gao et al. (2018) also shown that in 1949–2015, typhoons moving northward before landfall and typhoons filling after landfall accounted for the largest and smallest proportions of typhoons affecting Shandong, respectively, and that typhoons affecting Shandong exhibited significant cyclical periods of 26-year on the interdecadal scale and 5-year on the interannual scale.
The above studies mostly focused on the climatic characteristics of tropical cyclones affecting China, whereas the overall characteristics and regional characteristics of tropical cyclones affecting China are greatly different due to the vast territory of China and the large regional differences in the effects of tropical cyclones. Qingdao is located on the southeastern Shandong Peninsula, surrounded by sea on three sides, so it is affected by northward typhoons. In recent years, studies on tropical cyclones affecting Qingdao have focused on individual cases of weather processes affected by tropical cyclones (Bi et al., 2014; Zhen et al., 2019) and rarely analyzed the climatic characteristic of tropical cyclones in a systematic manner. Moreover, due to the limitations of the time period of statistical data, the conclusions in the above studies have had limited scope. In this paper, we used the tropical cyclone data of 1949–2020 to analyze the characteristics of frequency, track, and intensity of tropical cyclones affecting Qingdao over 72 years and the rainfall brought by them as well as the activity pattern and climatic characteristics of tropical cyclones affecting Qingdao. This study are also expected to provide some information for risk management related to tropical cyclones in Qingdao and a better understanding of the region’s vulnerability to tropical cyclones.
The tropical cyclones affecting Qingdao were selected from typhoon events that occurred during 1949–2020 (a total of 72 years) based on the Typhoon Yearbook and the Tropical Cyclone Yearbook compiled by the China Meteorological Administration (1949/2019). The selection criteria were as follows: the cyclone resulted in rainfall above 5 mm at more than five observation stations in Qingdao or caused wind with an average strength of 10.8 m·s−1 or above or wind gusts with strength of 17.2 m·s−1at more than five observation stations in Qingdao. There were 76 tropical cyclones selected and Table 1 shows their information. The tropical cyclones were graded based on the Grade of Tropical Cyclones (GB/T 19201–2006) (Qian et al., 2006) and the intensity of tropical cyclone affecting Qingdao was defined as the strongest grade during the period from the formation of the tropical cyclone to the removal of its numbering from the watch list. Moreover, the grade of a tropical cyclone affecting Qingdao was defined as the strongest grade of the tropical cyclone in the period when it started to cause rainfall and strong wind in Qingdao.
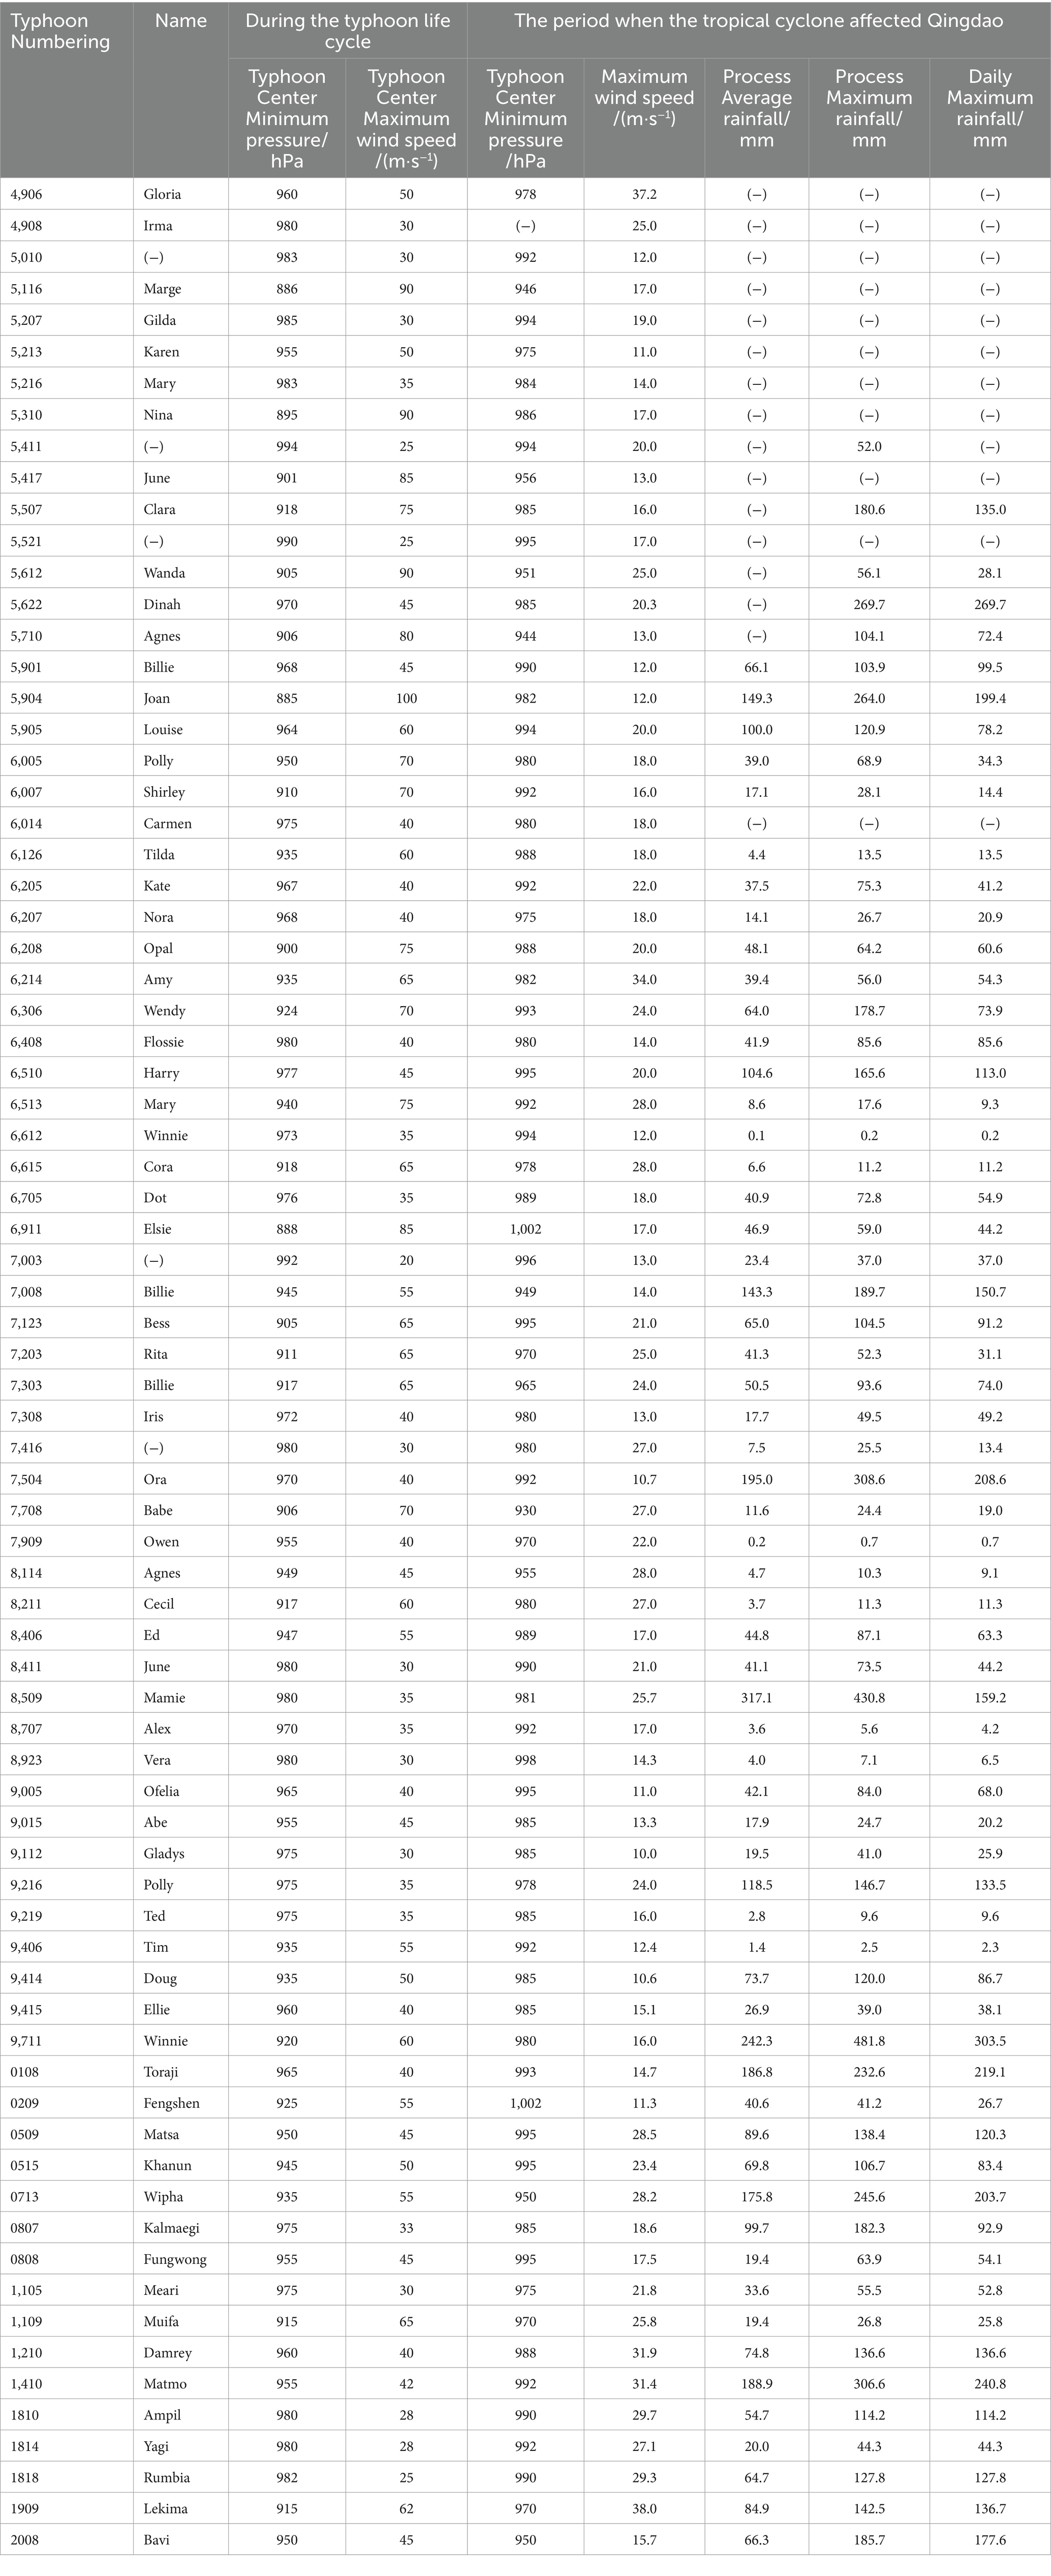
Table 1. Information of 76 tropical cyclones affecting Qingdao.
During 1949–2020, a total of 76 tropical cyclones affected Qingdao with an annual average of 1.06. There were 4 tropical cyclones appeared in 1962,which was the year with the most tropical cyclone impacts around the region of Qingdao. There were 23 years without tropical cyclone impacts, accounting for 30.3% of the study years. The period from 1949 to 1973 was a high-frequency period of tropical cyclones affecting Qingdao, and 40 tropical cyclones affected Qingdao over these 25 years with an annual average of 1.6. Particularly, from 1959 to 1963, there were 12 tropical cyclones with an annual average of 2.4. Afterward, the frequency of tropical cyclones began to decrease, even though the influence of tropical cyclones increased slightly in the early 1990s (Figure 1). Since 1995, the impact of tropical cyclones has remained relatively low. There were only 17 tropical cyclones in the 26 years from 1995 to 2020 with the annual average 0.7, which is significantly less than the annual average 1.06 in the 72 years. In general, tropical cyclones had frequent impacts from the 1950s to the early 1970s, and the tropical cyclone impacts from the 1980s to the present decreased significantly. From 1949 to 2020, the frequency of tropical cyclones affecting Qingdao overall decreased, which is evidenced by the 3-year moving average series of the frequency of typhoons. The frequency of tropical cyclones decreased linearly at 1.643 every 10-year. Because only 76 tropical cyclones affected Qingdao over the 72 years and the number of tropical cyclones was relatively small, the trend did not pass the significance test.
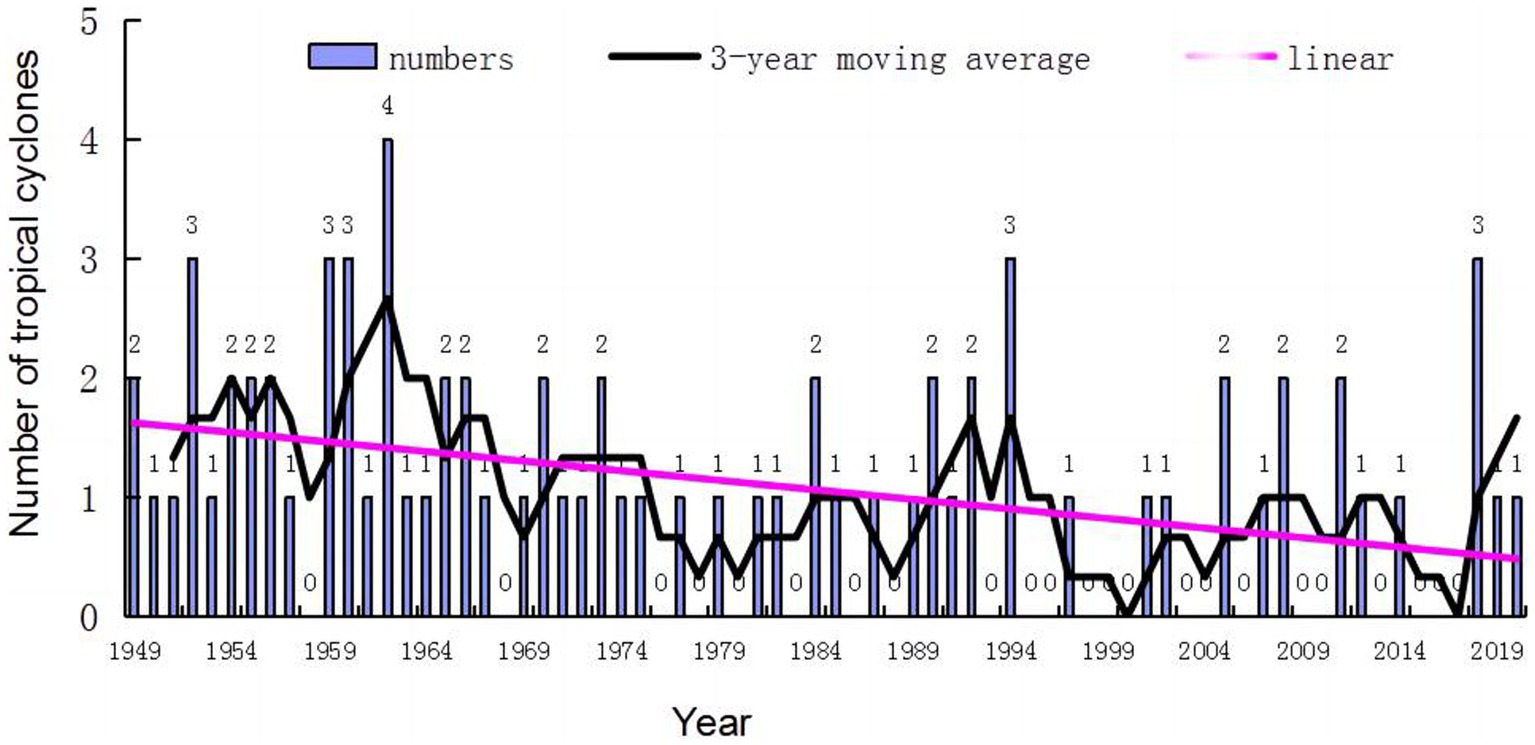
Figure 1. Time series of the numbers of tropical cyclones affecting Qingdao during 1949–2020.
Morlet wavelet power spectrum analysis and cross-wavelet analysis were used to analyze the periodic variation in the number of tropical cyclones affecting Qingdao. Figure 2 indicates that the number of tropical cyclones affecting Qingdao showed significant periodicity of 2–4 year from 1949 to the early 1970s, from the 1980s to the end of the last century, and from the beginning of this century to the present. Due to the boundary effect, the periods of the number of tropical cyclones in the early 1950s and the last 5 years of this century needed to be determined separately.
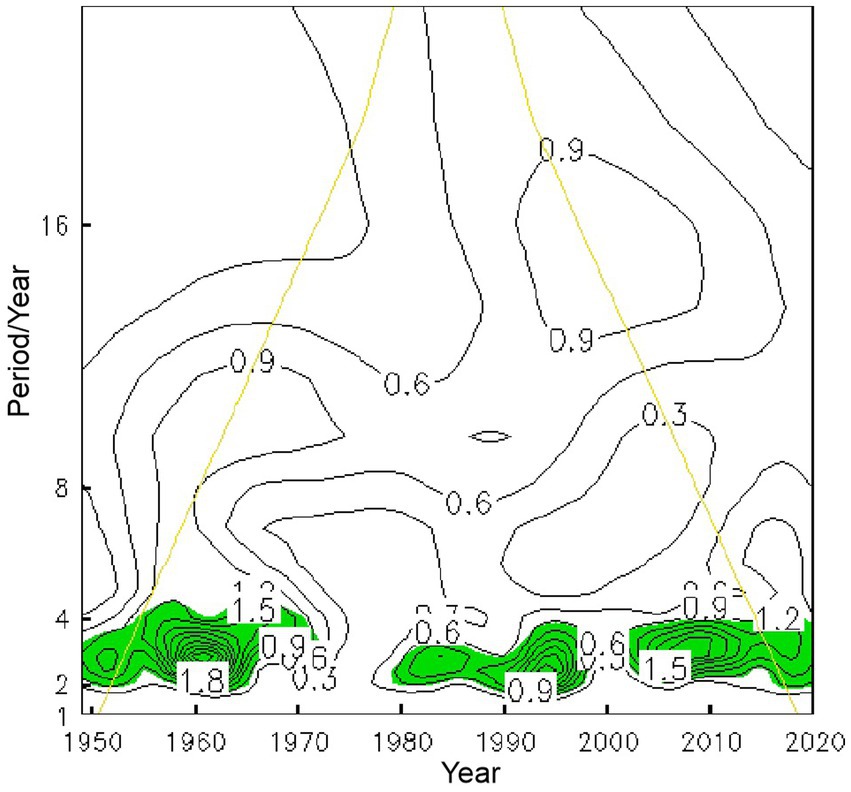
Figure 2. Morlet wavelet power spectrum analysis of tropical cyclones affecting Qingdao, Green shadings denote passing the red noise test at the 95% confidence level; the area below the thin yellow arc is the cone of influence at the wavelet head.
The tropical cyclones landed in Shandong mostly from mid-July to late August, and the number of tropical cyclones landing in Shandong was highest in late July, accounting for 40% of the annual tropical cyclones landing in Shandong (Gao et al., 2008). Based on the tropical cyclones data from 1949 to 2020,the tropical cyclones affecting Qingdao occurred earliest in June and latest in October, particularly. The number of tropical cyclones affecting Qingdao was the highest in August, accounting for 45.1% of the total tropical cyclones affecting Qingdao. Since 1949, there are four tropical cyclones, namely Shirley (6007), Mamie (8509), Toraji (0108), and Lekima (1909), have landed in Qingdao. They all occurred in August, and three of the four landed in Qingdao in the first 10 days of August especially.
The track classification of tropical cyclone (TC) is based on three criteria. The first criterion defines a TC that turns westward or northwestward after turning as a “westward bending”TC. The second criterion distinguishes TCs that turn northeastward south of 30°N as “turning” TCs, those between 30°and 35°N turning northeastward as “northward” TCs, and those north of 35°N turning or continuing northwestward as “high-latitude westward proceeding” TCs. The third criterion categorizes TCs that enter the coastal areas of China without making landfall into “nearshore” and “offshore” TCs based on the 125°E meridian (Cong et al., 2016). According to the trajectories of 76 tropical cyclones, the tracks of tropical cyclones affecting Qingdao are divided into eight types, namely turning after landfall (Type I), continuing northward after landfall (Type II), proceeding westward at high latitude (Type III), turning westward in the Yellow Sea (Type IV), turning nearshore before landfall (Type V), proceeding northward nearshore before landfall (Type VI), filling after landfall (Type VII), and proceeding offshore (Type VIII), as shown in Figure 3.
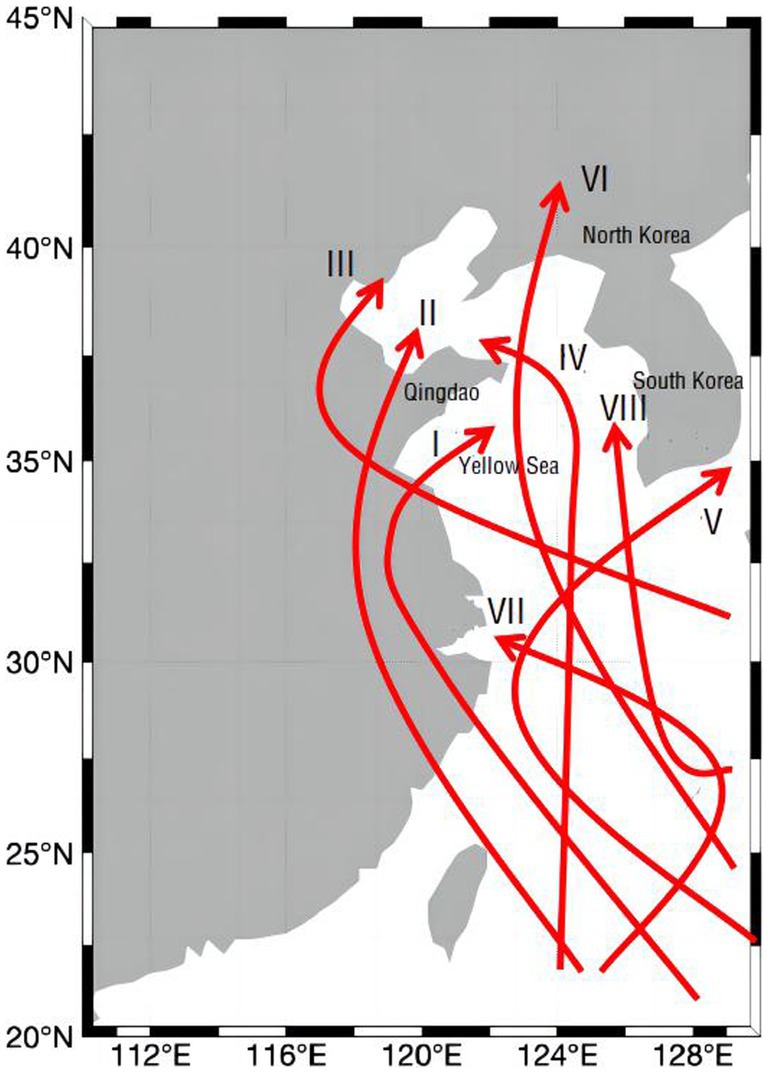
Figure 3. Schematic diagram of the eight types tracks of tropical cyclone.
Among the tropical cyclones affecting Qingdao, tropical cyclones with Types I and II tracks accounted for the highest proportion of 47.9%. 56% tropical cyclones with Type II tracks occurred in July, and 38% occurred in August. 61% tropical cyclones with Type I tracks occurred in September, and the rest occurred in other months. All tropical cyclones with Type III tracks occurred in July and August. 80% tropical cyclones with Type VI tracks appeared in August. 86% tropical cyclones with Type V tracks appeared in August. Among the four tropical cyclones that landed in Qingdao, Shirley (6007) had the feature of Type I track, Mamie (8509), Toraji (0108), and Lekima (1909) had the feature of Type II track. In summary, the tropical cyclones affecting Qingdao in July mostly had Type II track, the tropical cyclones affecting Qingdao in September mostly had Type I track. Although all types of tropical cyclone tracks might occur in August, Types II, V, and VI tracks were most common in August.
During 1949–2020, 30 tropical cyclones (41.5%) were at the super typhoon level, 13 (13.5%) were at the strong typhoon level, and 19 (26.6%) were at the typhoon level (Figure 4; Table 2). The tropical cyclones affecting Qingdao were mostly at the typhoon level or above. Among them, more than 60% of the tropical cyclones of five track types (Type I, Type II, Type IV, Type VII and Type VIII) were at the level of strong typhoon or above. Among the four tropical cyclones that landed in Qingdao, Shirley (6007) and Lekima (1909) were at the tropical storm level at the time of landfall, Mamie (8509) was at the severe tropical storm level at the time of landfall, and Toraji (0108) weakened to the tropical depression level at the time of landfall. It is difficult for tropical depressions and tropical storms to affect Qingdao regardless of their track types.
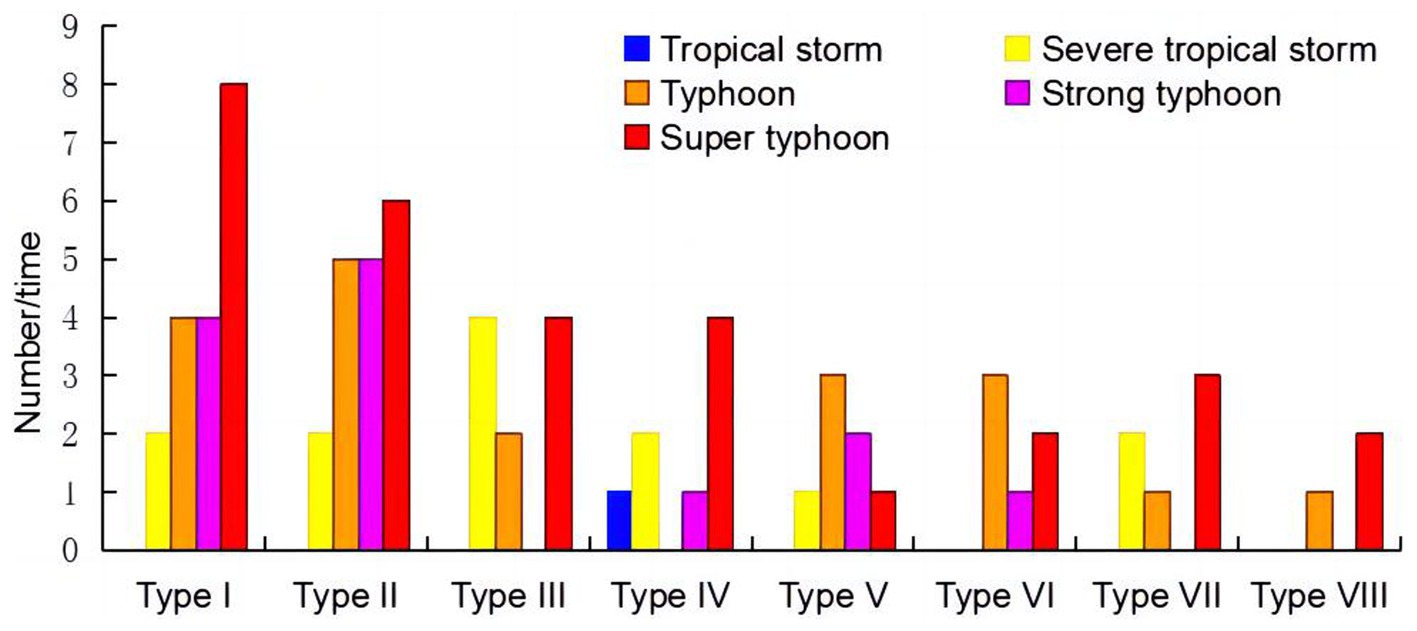
Figure 4. Frequencies for tropical cyclones of eight track types at each intensity level.
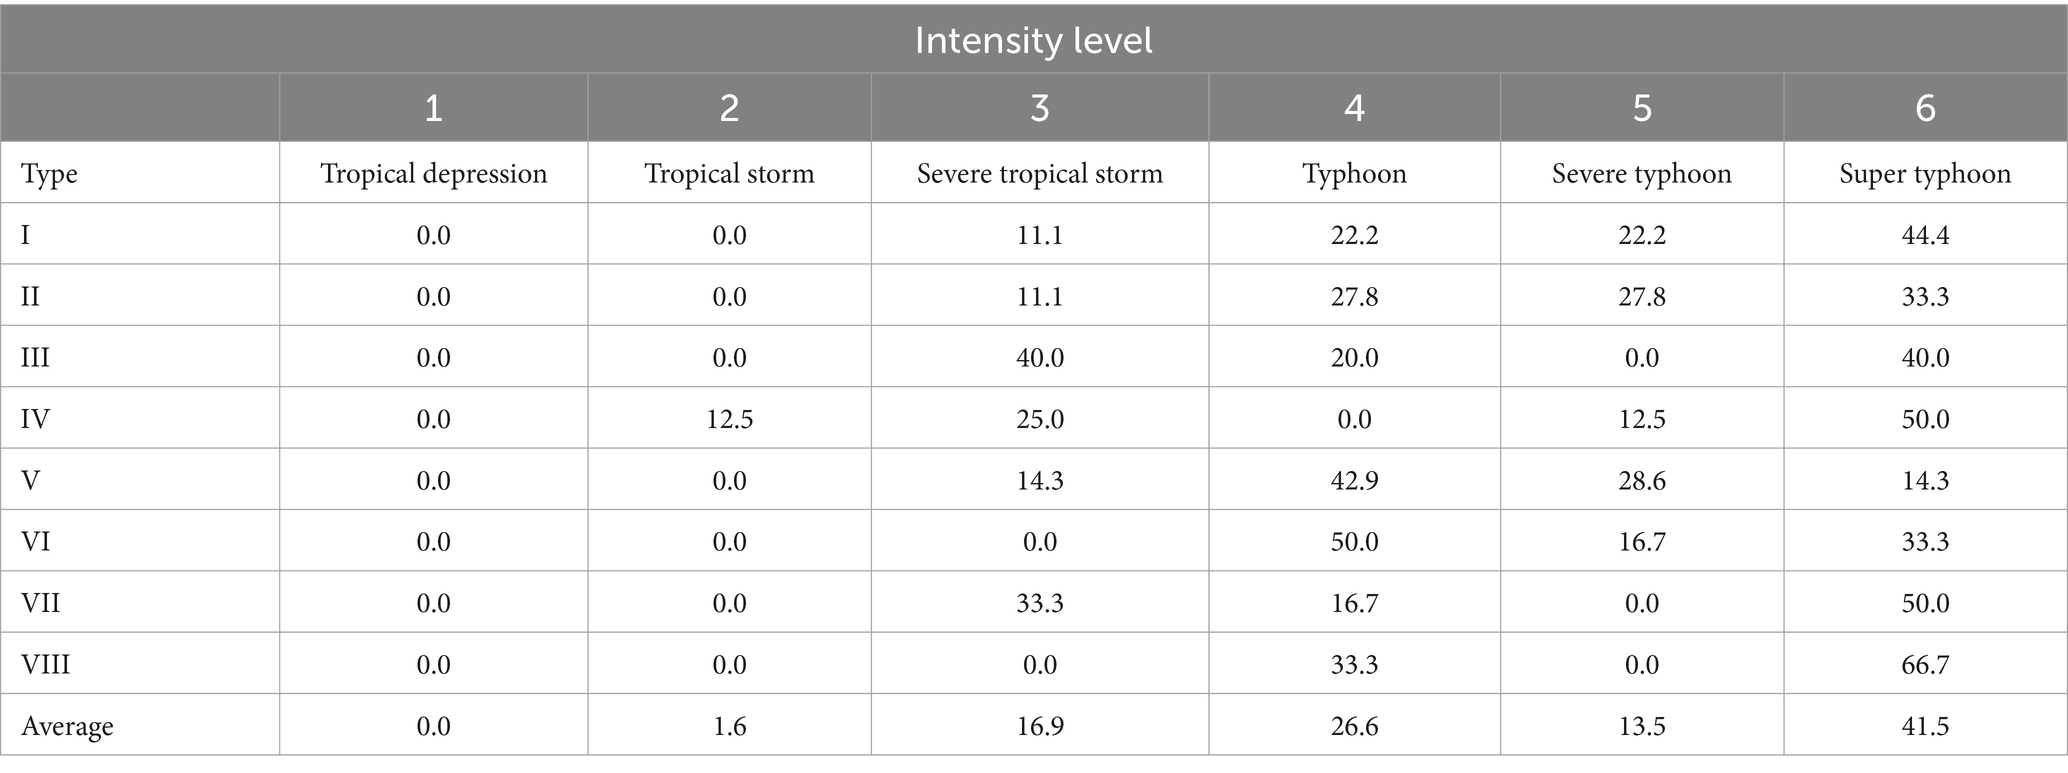
Table 2. Percentages for tropical cyclones of the eight track types at six intensity level (%).
Figure 5 shows how the intensity levels of tropical cyclones affecting Qingdao varied during 1949–2020. Figure 5A shows the strongest intensity levels of the 76 tropical cyclones from their formation in the source region to the time when they affected Qingdao, while Figure 5B shows the strongest intensity levels of the 76 tropical cyclones when they were causing rainfall and strong winds actually in Qingdao. Although multiple tropical cyclones affected Qingdao in some years, this paper only counted the one with the strongest intensity level among them in each year. The overall intensity of the tropical cyclones affecting Qingdao decreased at 0.117 levels per decade after their formation in the source area (Figure 5A); they showed distinct interdecadal variation characteristics, namely, increasing trends of tropical cyclone intensity in the 1950s, 1990s, and 2000s and decreasing trends of tropical cyclone intensity in 1960s, 1970s, 1980s, and 2010s. Figure 5B shows that the average intensity of tropical cyclones when they were affecting Qingdao was approximately with the level of 3, which was significantly weaker than the average intensity of level 5 shown in Figure 5A. This is related to the facts that the intensity of tropical cyclones usually weakens due to their interaction with mid-latitude atmosphere and the drag and cooling effect of the underlying surface during the northward propagation of tropical cyclones. During the past 72 years, the intensity of northward tropical cyclones when they were affecting Qingdao did not show an obvious interannual trend (Figure 5B), but their interdecadal characteristics took on a weakening of intensity in the 1980s and the 2010s and a rise in intensity in the other decades.
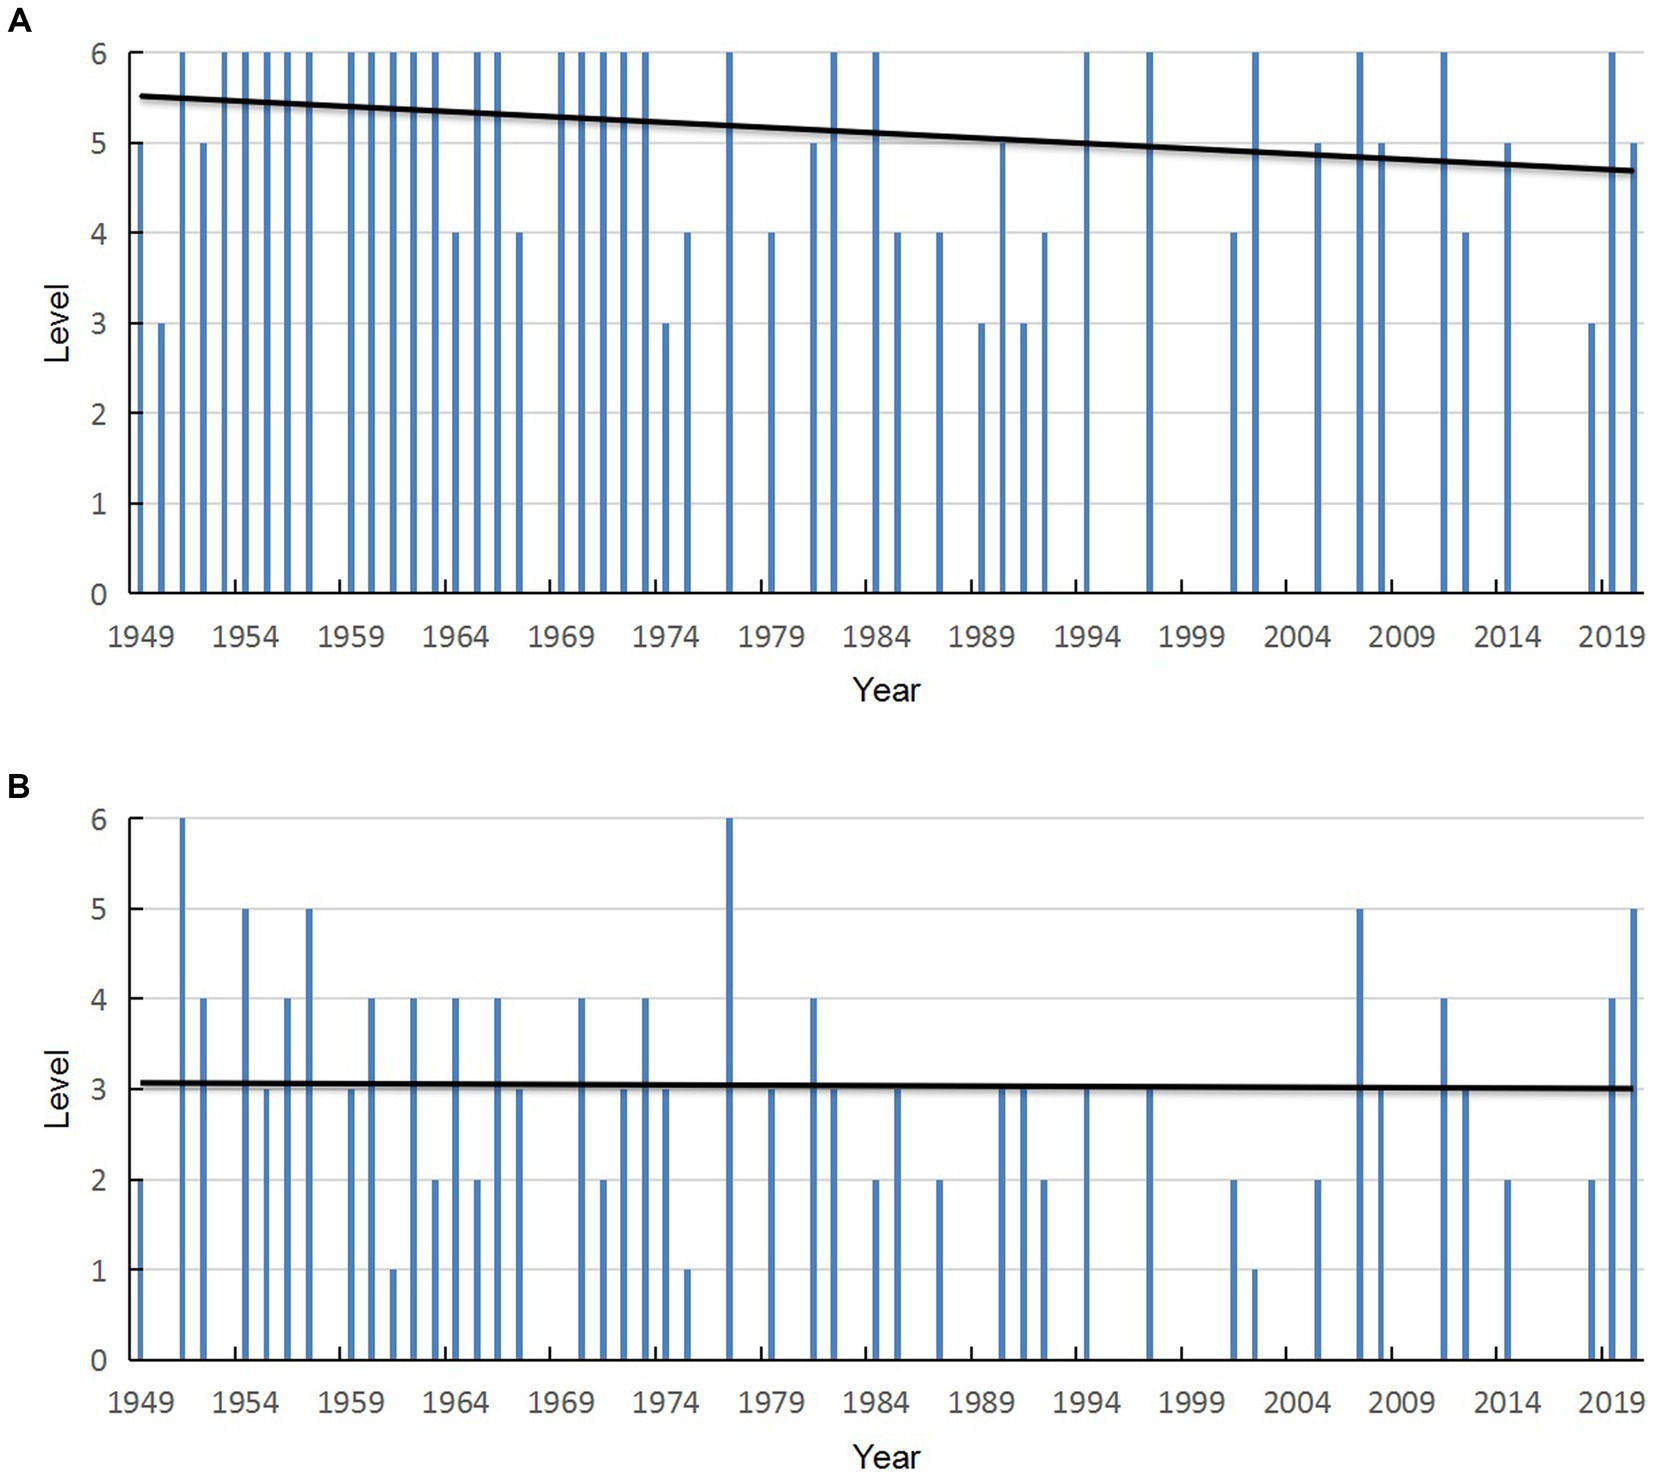
Figure 5. (A). The strongest intensity levels of the tropical cyclones that affected Qingdao. (B) The strongest levels of the tropical cyclones when they were affecting Qingdao during 1949–2020.
Since the rainfall data of Qingdao from 1961 to 2020 was complete and reliable, the maximum process rainfall at a single station in Qingdao affected by 52 tropical cyclones from 1961 to 2020 was analyzed. The maximum process rainfall at a single station varied greatly, from 5.6 mm to 481.8 mm. In particular, tropical cyclones with Type II tracks took high maximum process rainfall with an average of 182.5 mm, while tropical cyclones with Type V tracks took low maximum rainfall to a single station with an average of 18.5 mm (Figure 6A). The levels of the maximum process rainfall at a single station brought by the tropical cyclones of the eight track types are analyzed and found that 60% of the maximum process rainfall at a single station in Qingdao reached the level of torrential rainfall or above. In particular, more than half of the maximum process rainfall brought by tropical cyclones of five track types (Type II, Type I, Type V, Type III and Type IV) at a single station in Qingdao exceeded the level of torrential rain (Figure 6B). Tropical cyclones with Type II tracks brought the heaviest rainfall; specifically, rainfall above the level of torrential rain accounted for 92.9% of the maximum process rainfall brought by these tropical cyclones, and rainfall above the level of downpour accounted for 71.4%. Tropical cyclones with Types V and VIII tracks brought relatively little rainfall, and the maximum process rainfall brought by these tropical cyclones at a single station was below the level of heavy rainfall.
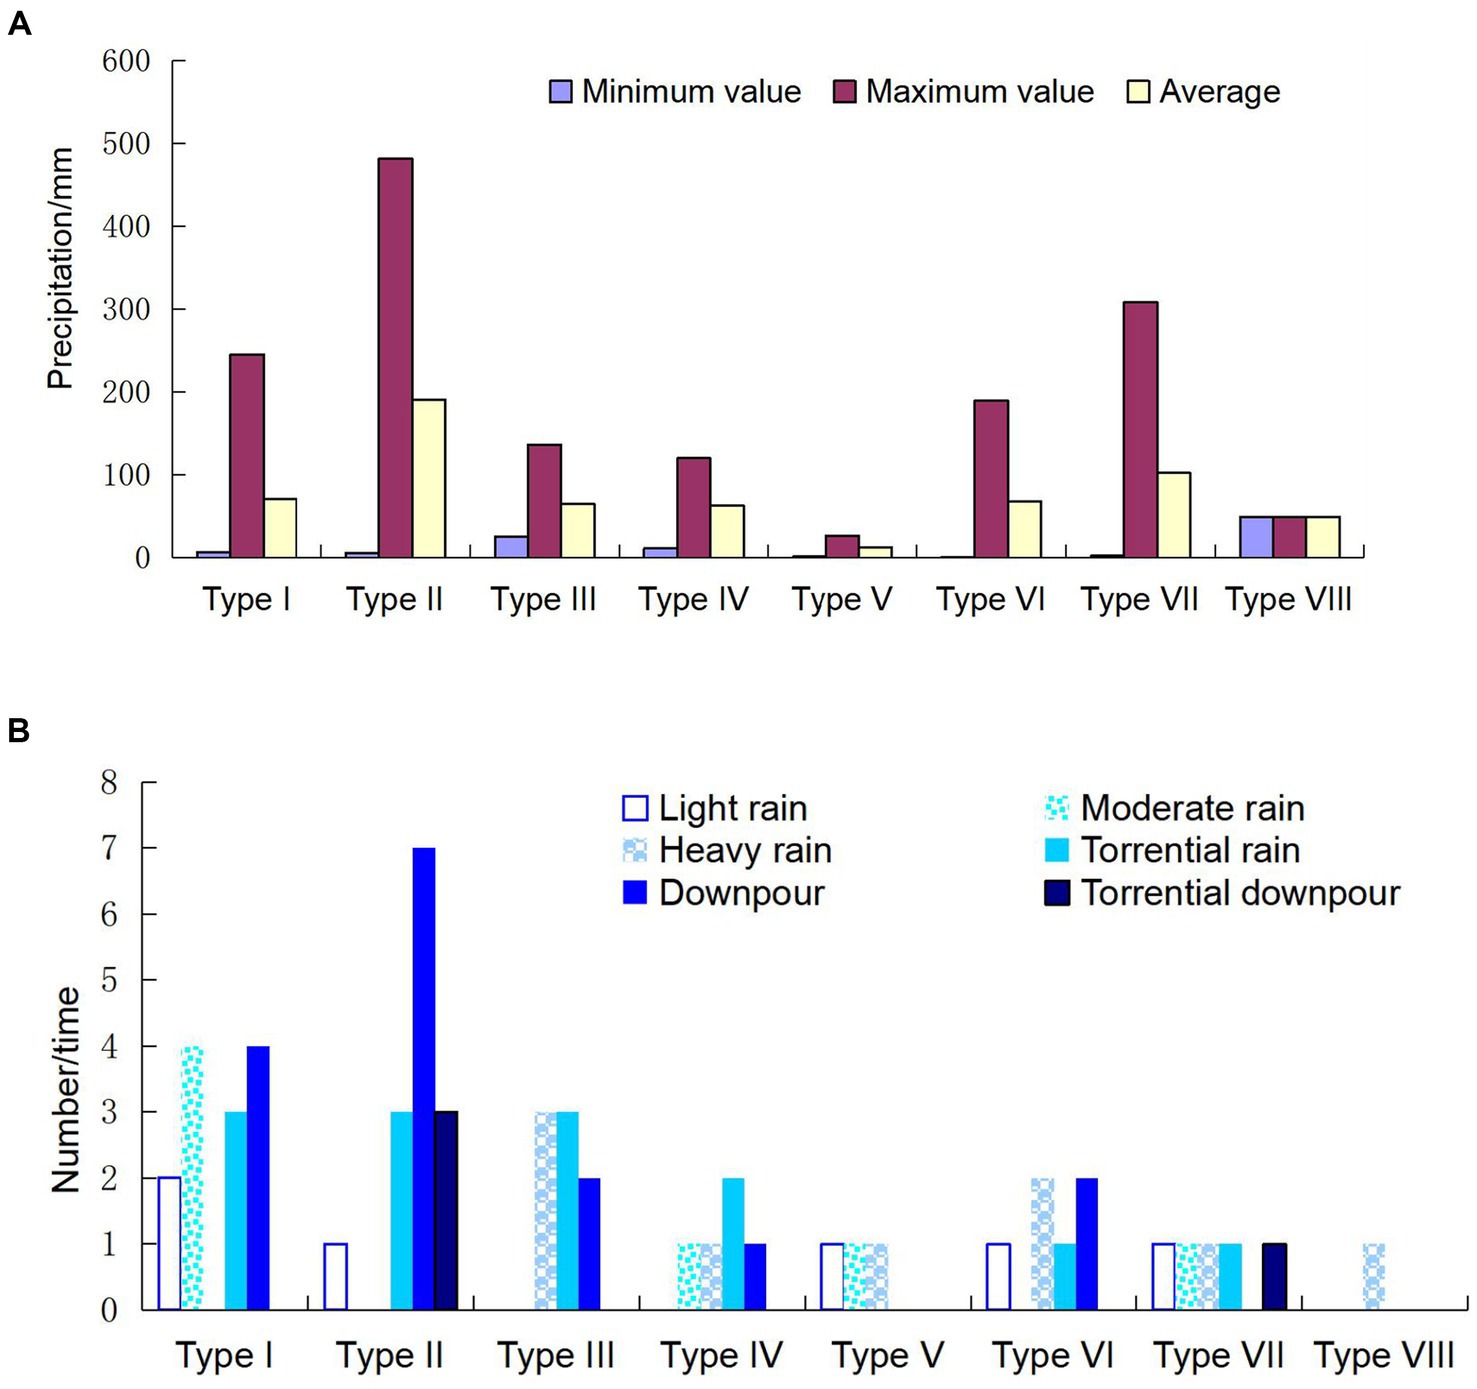
Figure 6. Maximum process rainfall at a single weather station in Qingdao (A) and the corresponding rainfall level (B).
The daily rainfall analysis in Table 3 show that tropical cyclones with Type II tracks had the greatest impact on the entire city and the urban area of Qingdao, followed by tropical cyclones with Type I tracks and Type VII tracks, while those with Types V and VIII tracks had relatively little impact. There were an average of 6.7 days for the daily rainfall exceeding 50 mm brought by the tropical cyclones with Type II tracks in each process in the entire city, including 3.1 days for the daily rainfall exceeding 100 mm. The tropical cyclones with Type I tracks resulted in an average of 1.6 days of daily rainfall exceeding 50 mm in each process in the entire city, including 0.5 day of daily rainfall exceeding 100 mm. Tropical cyclones with Type II tracks had a more significant impact on the daily rainfall than tropical cyclones with other track types. Moreover, tropical cyclones with type II tracks also had the greatest impact on the process rainfall in the entire city and the urban area of Qingdao, followed by tropical cyclones with Type VII tracks and tropical cyclones with Type I tracks.
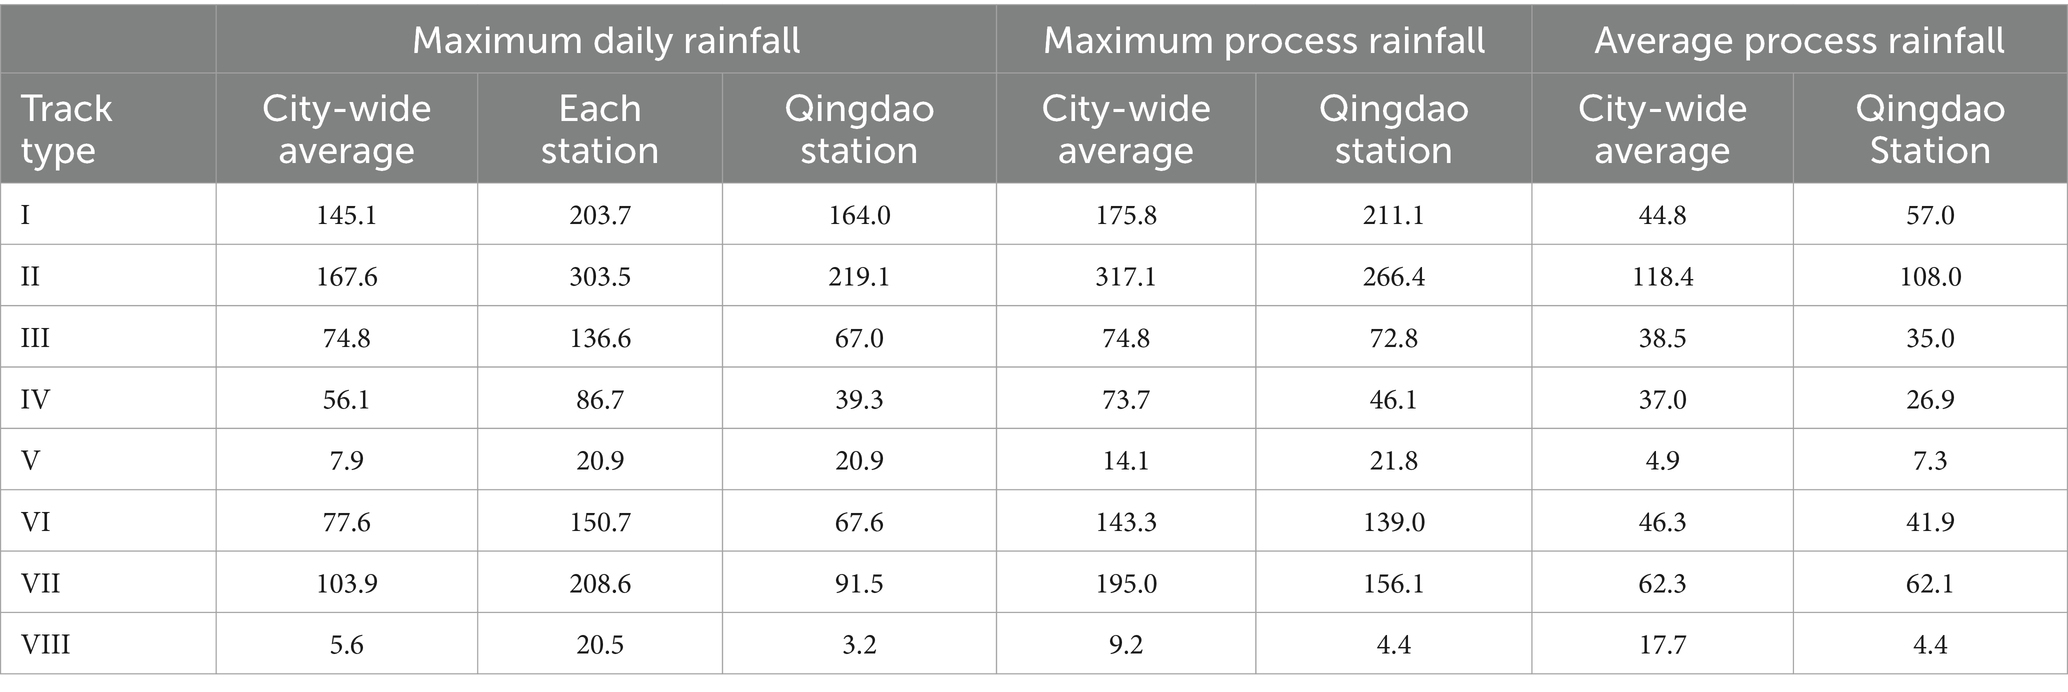
Table 3. The maximum and average rainfall corresponding to the eight types of tropical cyclone tracks (unit:mm).
Qingdao has jurisdiction over seven municipal districts named as Shinan, Shibei, Licang, Laoshan, Huangdao, Chengyang and Jimo, and three county-level cities with Jiaozhou, Pingdu and Laixi. Among them, the main urban area (Shinan, Shibei, Licang), Laoshan District, and Huangdao District are located in the southern coastal area; Chengyang District, Jimo District, and Jiaozhou City are located in the central of Qingdao with plain and hilly underlying surface types; and Pingdu City and Laixi City are located in the northern inland area of Qingdao. Under the influence of tropical cyclones with Type II track, the greatest process rainfall occurred in the site of Jimo, Huangdao, and Jiaozhou, then followed by Laoshan, Laixi, Shinan, and Pingdu. The process rainfall at every station all exceeded 100 mm. Tropical cyclones with Type I track brought plentiful rainfall to the site of Qingdao and Huangdao. Tropical cyclones with Type VII track brought the most rainfall to Laoshan and Jimo. Tropical cyclones with Type VI track brought the most rainfall to Jimo. Tropical cyclones with Type III track had a greater impact on Huangdao, and those with Type IV track had a greater impact on Laixi and Pingdu. In summary, when a tropical cyclone affects Qingdao, coastal areas (such as Jimo, Huangdao, Laoshan, and Shinan) have higher process rainfall and higher daily rainfall than inland areas.
Figure 7 analyzes the distribution of the average rainfall brought by four tropical cyclones that landed in Qingdao based on the 7 national basic meteorological stations (Qingdao, Laoshan, Jiaonan, Jimo, Jiaozhou, Pingdu, and Laixi). The rainfall at Jiaonan station was highest, reaching 181.9 mm, followed by Pingdu, Jimo, Jiaozhou, Laoshan and Qingdao stations, the rainfall at Laixi station was the lowest. Qingdao, Laoshan and Jiaonan are located in the southern coastal area and so are susceptible to the influence of inverted troughs and low-pressure circulations of typhoons. Pingdu and Laixi in the northern inland area and Jimo and Jiaozhou in the central area are susceptible to the joint influence of inverted troughs of typhoons and westerly troughs. Under the influence of low-pressure circulations of typhoons, the dominant near-surface wind usually blows easterly or northeasterly in the main urban area where the Qingdao station is located, and Jiaonan is located on the downwind side and windward side of the main urban area. In contrast, for the westerly troughs affected by cold air intrusion, the dominant near-surface wind is usually southerly or southwesterly, and Jimo is located in the downwind part and windward side of the main urban area. With the acceleration of urbanization, heavy rainfall becomes concentrated in the mountain-front windward area, the main urban area, and the leeward side of the urban area, and the rainfall in the downwind part of the city is much higher than that in the upwind part (Shepherd et al., 2002; Li and Ma, 2011; Wu and Jiangping, 2011). Urban heat islands maybe the one cause of the heterogeneous distribution of rainfall and might contribute, along with the weather system and topography, to the greater rainfall brought by typhoons that landed in Qingdao at Jiaonan and Jimo stations than that at Qingdao station. Of course, the mechanism underlying the impact of urbanization on rainfall on the background of tropical cyclone circulation still need to be further explored.
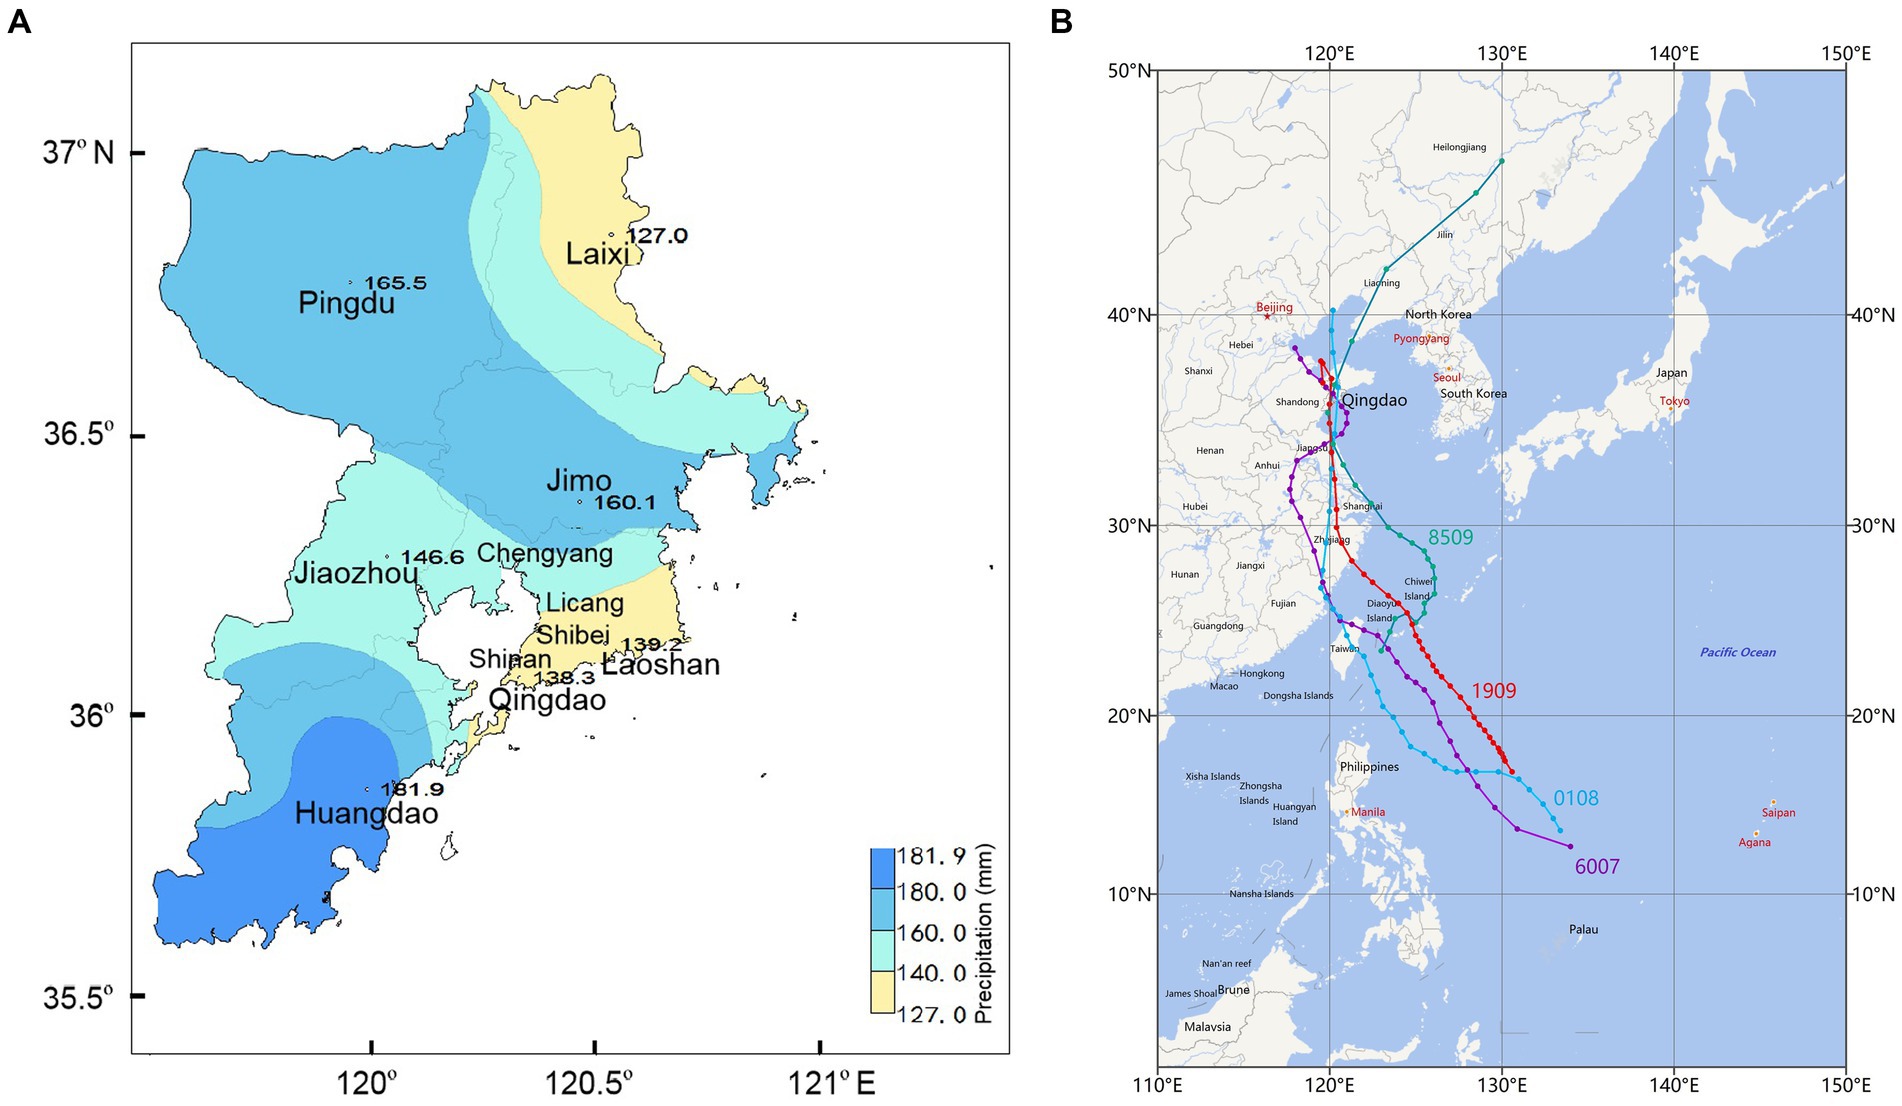
Figure 7. Four landing typhoons average rainfall in Qingdaos (A) and four landing typhoon information (B).
1. During 1949–2020, a total of 76 tropical cyclones affected Qingdao. The frequency and intensity of affecting Qingdao decreased at rate of 1.764 per decade and 0.117 level per decade, respectively. The frequency of tropical cyclones showed significant periodicities of 2–4 year from 1949 to the early 1970s, from the 1980s to the end of the last century, and from the beginning of this century to the present.
2. The tropical cyclones affecting Qingdao mostly occurred in August, accounting for 45.1% of the annual number of tropical cyclones. In August, the tropical cyclones with Types I and II tracks accounted for 47.9% of all tropical cyclones. The tropical cyclones mostly had Type II track in July; Types II, V, and III in August; and Type I track in September.
3. During 1949–2020, 81.6% of the tropical cyclones affecting Qingdao were at the typhoon level or above, and more than 60% of the tropical cyclones of five track types (Type II, Type I, Type VII, Type VIII, and Type IV) were above the strong typhoon level. It was difficult for tropical depressions and tropical storms to affect Qingdao regardless of their track types. The intensity shown a decreasing trend, but the intensity change was not obvious when the northward cyclones were directly affecting Qingdao.
4. During 1949–2020, more than 50% of the maximum process rainfall at a single station in Qingdao because of tropical cyclones with Types II, I, III, VI, and IV tracks exceeded the level of torrential rain. The tropical cyclones with Type II track brought the strongest rainfall in the eight types of tropical cyclone tracks,and the sort of rainfall on the spatial distribution in descend order was Jimo, Huangdao, Jiaozhou, Laoshan, Laixi, Qingdao and Pingdu.
Due to global warming and regional urbanization, the climatic characteristics of the northward tropical cyclones have a certain degree of dependence on spatial variation. In addition, the differences in data source, data acquisition time, monitoring methods, and technical indicators of tropical cyclone intensity cause differences in the statistical results. The climatic characteristics of tropical cyclones affecting Qingdao during 1949–2020, summarized based on the analysis of their frequency, track, period, intensity, and rainfall in this paper, can benefit tropical cyclone forecasting services, though the conclusions obtained still have certain temporal and spatial limitations.
The original contributions presented in the study are included in the article/Supplementary material, further inquiries can be directed to the corresponding author.
YM: Conceptualization, Data curation, Formal analysis, Funding acquisition, Methodology, Project administration, Supervision, Validation, Visualization, Writing – original draft, Writing – review & editing. LG: Formal analysis, Investigation, Resources, Software, Validation, Visualization, Writing – original draft. YH: Investigation, Visualization, Resources, Writing – original draft.
The author(s) declare financial support was received for the research, authorship, and/or publication of this article. This work is supported by Project of Qingdao Meteorological Bureau (No. 2019qdqxz01), Shandong Meteorological Bureau (No.2021sdqxz01).
The authors declare that the research was conducted in the absence of any commercial or financial relationships that could be construed as a potential conflict of interest.
All claims expressed in this article are solely those of the authors and do not necessarily represent those of their affiliated organizations, or those of the publisher, the editors and the reviewers. Any product that may be evaluated in this article, or claim that may be made by its manufacturer, is not guaranteed or endorsed by the publisher.
The Supplementary material for this article can be found online at: https://www.frontiersin.org/articles/10.3389/fclim.2024.1361511/full#supplementary-material
Bi, W., Fujing, W., and Shan, G. (2014). Influence of wind and rain caused by offshore northward tropical cyclone on Shandong peninsula during 2011-2012. J. Shandong Metetorol. 34, 1–5.
Chen, L., Wenqin, Z., Wen, W., Xiuji, Z., Weiliang, L., et al. (1998). Studies on climate change in China in recent 45 years. Acta. Meteor. Sin. 56, 257–271. doi: 10.11676/qxxb1998.023
China Meteorological Administration (1949/2019). Tropical cyclone yearbook. Beijing: China Meteorological Press.
Cong, W., and Wei, S. S. (2016). Characteristics of tropical cyclones influencing Shandong Province from 1949 to 2012. J. Meteorol. Environ. 32, 67–73. doi: 10.3969/j.issn.167.3-503X.2016.05.010
Ding, Y., and Dai, D. (1994). Temperature variation in China during last 100 years. Meteorol. Month. 20, 19–26. doi: 10.7519/j.issn.1000-0526.1994.12.008
Emanuel, K. A. (2005). Increasing destructiveness of tropical cyclones over the past 30 years. Nature 436, 686–688. doi: 10.1038/nature03906
Gao, G., Jing, J., Shouqiang, M., and Wenzheng, X. (2008). The inter annual and inter decadal variation of tropical cyclone affecting Shandong Province. Meteorol. Month. 34, 78–85. doi: 10.3969/2018jms.0049
Gao, X., Jing, J., Chang, L., et al. (2018). Frequency variation characteristics of typhoons affecting Shandong in recent 67 years and their relationship with several climate factors. J. Meteorol. Sci. 38, 749–758.
Gao, S., Tingting, Z., and Lili, S. (2017). Study of northward moving tropical cyclones in 1949-2015. Meteorol. Sci. Technol. 45, 313–323.
Gu, R., Changyi, L., Shaolin, Z., et al. (1999). Average circulation patterns and rainstorm fields of the various tracks tropical cyclones influenced North China. J. Shandong Metetorol. 19, 14–17. doi: 10.7519/j.issn.1000-0526.2006.7.005
Jin, R., Gao, S., Gu, H., et al. (2006). An analysis on characteristics of landing and going northward typhoons and its causes during 1975-2005. Meteorol. Month. 32, 33–39. doi: 10.7519/j.issn.1000-0526.2006.7.005
Knutson, T., Camargo, S. J., Chan, J. C. L., Emanuel, K., Ho, C. H., Kossin, J., et al. (2020). Tropical cyclones and climate change assessment: part ii: projected response to anthropogenic warming. Bull. Am. Meteorol. Soc. 101, E303–E322. doi: 10.1175/Bams-D-18-0194.1
Lee, T. C., Lee, W. J., Nakazawa, T., Weyman, J. C., and Ying, M. (2001). Assessment reports on impacts of climate change on tropical cyclone frequency and intensity in the typhoon committee region. Escap/Wmo typhoon committee, Tc/Td-No.0001.
Lei Xiaotu, X., and Ming, R. F. (2009). A review on the impacts of global warming on tropical cyclones activities. Acta. Meteor. Sin. 67, 679–688.
Li, L., Jing, J., and Yang, Z. (2012). Climatic characteristics of tropical cyclones activities in the Western North Pacific under the global warming. J. Nanjing Univ. 48, 228–235.
Li, Y., Lianshou, C., and Shengjun, Z. (2004). Statistical characteristics of tropical cyclone making landfalls on China. J. Trop. Meteorol. 20, 14–23.
Li, S., and Ma, J. (2011). Impact of urbanization on rainfall in Beijing area. J. Meteorol. Sci. 31, 414–421. doi: 10.3969/2012jms.00**
Qian, C., Gao, S., Xu, Y., et al. (2006). Gb/T 19201—2006 grade of tropical cyclone[S]. Beijing: China Standard Press.
Shepherd, J. M., Pierce, H., and Negri, A. J. (2002). Rainfall modification by major urban areas: observations from Spaceborne rain radar on the TRMM satellite. J. Appl. Meteorol. 41, 689–701. doi: 10.1175/1520-0450(2002)041<0689:RMBMUA>2.0.CO;2
Wang, X., and Jun, L. (2006). Some climatic features of tropical cyclones influencing northern China for recent 52 years. Meteorol. Month. 32, 76–80. doi: 10.7519/j.issn.100.0-0526.2006.10.012
Wang, Y. M., Ren, F. M., Li, W. J., and Wang, W. L. (2008). Some climatic features of tropical cyclones influencing northern China for recent 52 years. Meteorol. Month. 32, 76–80.
Webster, P. J., Holland, G. J., Curry, J. A., and Chang, H. R. (2005). Changes in tropical cyclone number, duration, and intensity in a warming environment. Science 309, 1844–1846. doi: 10.1126/science.1116448
Wu, F., and Jiangping, T. (2011). The impact of urbanization on a heavy rainfall case in Shanghai on 25 august 2008. J. Nabjing Univ. 47, 71–81,
Yan, L., Huang, X., Yu, Y., et al. (2007). Climate change on tropical cyclones frequencies in Northwest Pacific in recent 58 years. J. Meteorol. Res. Appl. 28, 62–64.
Ying, M., Yang, Y. H., De Chen, B., and Zhang, W. (2011). Climatic variation of tropical cyclones affecting China during the past 50 years. Sci China Earth Sci 54, 1226–1237. doi: 10.1007/s11430-011-4213-2
Yongmei, W., Fumin, R., Weijing, L., et al. (2008). Climatic characteristics of typhoon rainfall over China. J. Trop. Meteorol. 24, 233–238.
Zhang, Q., Wu, L., and Liu, Q. (2005). Tropical cyclone damages in China:1983-2006. Bull. Am. Meteor. Soc. 90, 489–495. doi: 10.1175/2008BAMS2631.1
Zhen, Y., Xiaoxia, Y., and Jing, S. (2019). Causal analysis of extremely heavy rainfall in Shandong Province caused by typhoon Rumbia (2018). J. Mar. Meteorol. 39, 106–115. doi: 10.19513/j.cnki.issn2096-3599.2019.01.011
Keywords: tropical cyclone, coastal region, rainfall, track characteristics, Qingdao
Citation: Ma Y, Guo L and Hao Y (2024) Climatic characteristics of various tracks of tropical cyclones and their impact on rainfall in Qingdao during 1949–2020. Front. Clim. 6:1361511. doi: 10.3389/fclim.2024.1361511
Edited by:
Jung-Eun Chu, City University of Hong Kong, Hong Kong SAR, ChinaReviewed by:
Wenchang Yang, Princeton University, United StatesCopyright © 2024 Ma, Guo and Hao. This is an open-access article distributed under the terms of the Creative Commons Attribution License (CC BY). The use, distribution or reproduction in other forums is permitted, provided the original author(s) and the copyright owner(s) are credited and that the original publication in this journal is cited, in accordance with accepted academic practice. No use, distribution or reproduction is permitted which does not comply with these terms.
*Correspondence: Yan Ma, cWR5YW5tYUAxNjMuY29t
Disclaimer: All claims expressed in this article are solely those of the authors and do not necessarily represent those of their affiliated organizations, or those of the publisher, the editors and the reviewers. Any product that may be evaluated in this article or claim that may be made by its manufacturer is not guaranteed or endorsed by the publisher.
Research integrity at Frontiers
Learn more about the work of our research integrity team to safeguard the quality of each article we publish.