 B. J. Fisel
 W. J. Gutowski Jr.
- Department of Geological & Atmospheric Sciences, Iowa State University, Ames, IA, United States
Introduction: Crops are vulnerable to precipitation and heat extremes during late spring through summer.
Methods: We analyzed for a north-central U.S. region short-term drought and agricultural heat stress during April-May-June-July. We used the 4-km Parameter Elevation Regression on Independent Slopes Model (PRISM) for observations, aggregated to a 25-km grid, and two 25-km Regional Climate Model version 4 (RegCM4) simulns used either GFDL- or MPI-GCM boundary conditions. We chose 1981-2000 as our contemporary time period, and 2041-2060 as our scenario time period, which used the Representative Concentration Pathway 8.5 emissions scenario. We used object-oriented analysis to identify events of interest in observations and simulations by identifying objects in a space-time domain that meet specified criteria, such as exceeding a heat-stress temperature threshold. The event diagnosis allowed analysis of compound events, occurring when temperature and drought objects overlap.
Results: Identified objects yielded events that can undermine agricultural productivity and which are thus relevant to decision makers, making them building blocks for possible climate storylines. The observations and simulations showed similar spatial distributions of event frequencies across the analysis region. However, the simulations attained this distribution by having fewer events that tend to cover larger areas compared to observed events, suggesting that the effective resolution of the simulations was coarser than their 25-km grids. Short-term drought frequency increased and heat-stress frequency decreased in transitioning to the scenario climate. When compounding occurred heat-stress events generally preceded the short-term drought events. The overlapping, compound events tended to be more extreme compared to non-overlapping events of either type.
Discussion: The information yielded projected changes in these agriculturally motivated events. One prominent conditional behavior emerging from the work was that a heat-stress event should be a warning to watch for potential drought, as both could compound each other to more intense levels.
1 Introduction
Agricultural drought and heat stress can have major impacts on crop productivity, especially if they occur during critical periods of crop development, such as pollination and grain filling. For example, combined drought and heat stress in 2012 caused losses exceeding US$30 billion in 2018 dollars (Otkin et al., 2018). Maize yields were their lowest since 1995 due to the hot and dry conditions (Otkin et al., 2016). Agricultural drought and heat stress can each individually undermine crop productivity, but their simultaneous occurrence may compound the intensity of each, creating yet more challenging conditions for crop development. Here, we use an objective analysis method to diagnose drought and heat-stress events in the north-central U.S. (Figure 1), a major agricultural region (USDA, 2024). Our focus is on observed and simulated behavior during a growing season period, when crop development may be severely impaired before it can reach full maturity. We assess how these events may change in projected future climate for the region, with an eye toward providing precursor conditions that may serve as a warning sign for the emergence of severe compound events.
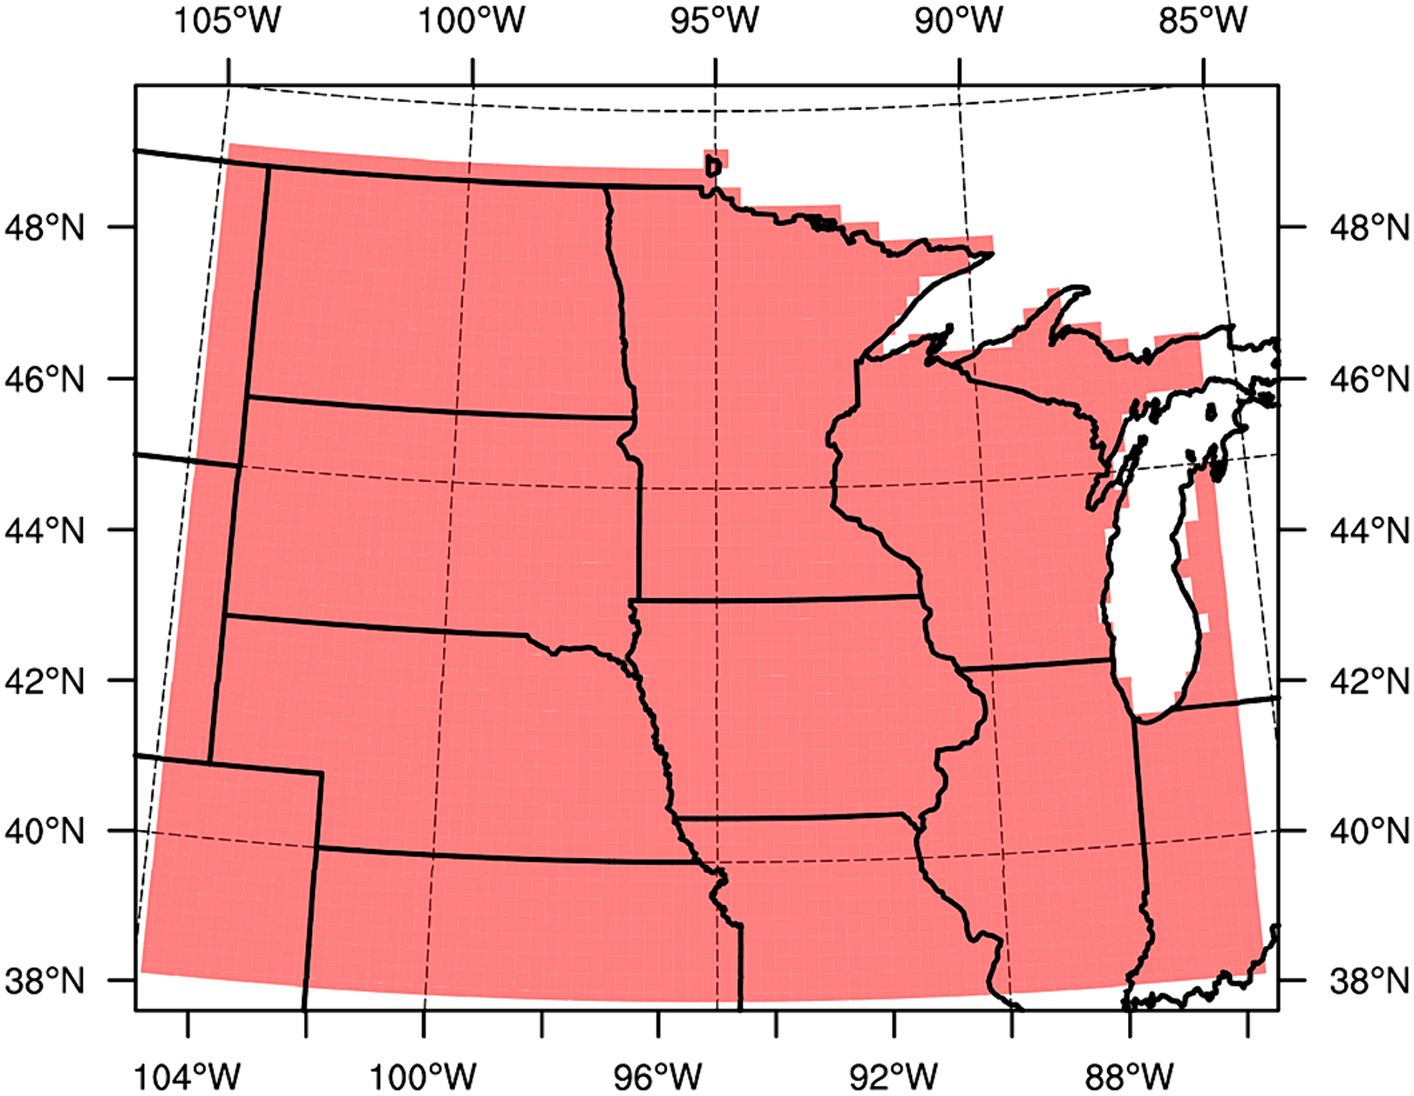
Figure 1. The North-Central U.S. analysis region (shaded). U.S. state outlines marked in solid black. Latitude and longitude lines marked every 5° (dashed).
Our focus is on short-term drought events that occur during crop development and that are sufficiently long to impact agriculture. These are typically periods of one-two months (e.g., Licht and Glisan, 2019). Short-term drought is often called “flash drought,” but there are multiple definitions of “flash drought,” sometimes based on duration and sometimes based on rapidity of development over a several-week period (Lisonbee et al., 2021). Here, we simply refer to a period of very low precipitation lasting several weeks as short-term drought, consistent with varied views of flash drought but with a focus on timing and intensity of events that coincide with periods of agricultural heat stress.
We diagnose short-term drought events and heat-stress events using an object-oriented analysis to identify and characterized the events (Hitchens et al., 2012; Moore et al., 2015; Fisel et al., 2023). The object-oriented analysis allows us to define events as those exceeding an important threshold, thus tailoring the analysis to the issue at hand. For example, our key threshold for heat stress is the temperature where agricultural crops such as maize and soybeans start to experience growth and development problems due to excessive heat impacts on metabolic processes, a temperature of 30°C (dos Santos et al., 2022). Similarly, a dearth of precipitation over periods of several weeks can deplete soil-water availability and inhibit crop development. We can then analyze these objects to obtain a climatological character of the events in observations and climate simulations. Characteristics the diagnosis can provide include event frequencies, areas, durations, and intensities, along with geographical distributions of the events. These events can provide a foundation for building climate storylines (Hazeleger et al., 2015; Shepherd et al., 2018; Shepherd, 2019; Sillmann et al., 2021) when used to assess how they might change in the future. In this case, the events can be seen as building blocks that ultimately could lead to climate storlines that are directly relevant to agricultural interests.
Our approach differs from climate-crop impact studies done by many others that ingest climate-change data into crop models (e.g., Maiorano et al., 2017; Rötter et al., 2018), or use statistical approaches, such as through machine learning, to assess causes of crop stress in present and projected climates m (e.g., Goulart et al., 2021), or evaluate some combination of the two (e.g., Feng et al., 2019). By focusing simply on two types of events that are known crop stressors, our work complements these other studies. See also Bezner Kerr et al. (2023) for an assessment of this extensive literature.
Section 2 describes our data sources and methods. Section 3 gives analyses of short-term drought events, heat-stress events, and their compound behavior. Section 3 also gives climate storylines based on the analyses. Section 4 summarizes results and gives a concluding discussion.
2 Data and methods
2.1 Observations and simulations
For temperature and precipitation, we use the Parameter elevation Regression on Independent Slopes Model (PRISM; PRISM Climate Group, 2023), which uses observed daily temperature and precipitation for a 20-year period, January 1981–December 2000, to diagnose behavior of contemporary climate. We neglected more recent PRISM data as the data set began to include radar-based estimates of precipitation starting in 2002 (PRISM Climate Group, 2023). In diagnostics that included precipitation data from 2002 onward, we observed a shift in results starting at 2002, suggesting an inhomogeneity from adding the radar estimates. We have therefore restricted our PRISM analysis to a prior period that uses only station-based observations. PRISM data are provided on a 4 km × 4 km grid. We aggregate the precipitation data to a 25-km grid to match our simulations’ grid spacing, using a mass-conserving aggregation scheme (Jones, 1999). For temperature, we aggregated the PRISM data to a 25-km grid box using a patch-based aggregation scheme.
Our model output for daily temperature and precipitation comes from two combinations of global climate models (GCMs) driving a regional climate model (RCM) that produced simulations for the North America portion (Bukovsky and Mearns, 2020; McGinnis and Mearns, 2021) of the Coordinated Regional Downscaling Experiment (CORDEX; Giorgi and Gutowski, 2015; Gutowski and Giorgi, 2020). The RCM driving came from GCM simulations by the Geophysical Fluid Dynamics Laboratory (GFDL) and the Max Planck Institute for Meteorology (MPI) under the CMIP5 program (Dunne et al., 2012, 2013; Taylor et al., 2012; Jungclaus et al., 2013; Stevens et al., 2013). The output from both GCMs drove the Regional Climate Model, Version 4 (RegCM4; Giorgi and Anyah, 2012). RegCM4 used 25-km grid spacing to simulate the period 1950–2100. The simulation period 2006–2100 used the RCP8.5 scenario (Moss et al., 2010). We used the bias-corrected model output produced by the North America CORDEX program (Bukovsky and Mearns, 2020; McGinnis and Mearns, 2021) using the multivariate quantile method developed by Cannon (2018).
2.2 Methods
Our research goal was to identify short-term-drought and heat-stress events, as defined below. To this end, we used the object-oriented analysis program Tempest Extremes (TE; Ullrich and Zarzycki, 2017). As implied by its name, TE was developed to track features such as tropical and extratropical cyclones, as well as tropical easterly waves. We adapted TE to identify spatially and temporally continuous features in climate data that exceed a prescribed threshold (e.g., Fisel et al., 2023). We consider these features to be events. Here, the relevant thresholds are precipitation below a threshold, identified as drought, and daily maximum temperature above the threshold for agricultural heat stress; we discuss these thresholds in detail below. TE is sufficiently efficient (Zarzycki and Ullrich, 2017) that we can extract a large collection of events from data sets covering multiple decades in a sizeable region, thereby allowing us to develop a climatology of the targeted events. Details of TE’s formulation and coding appear in Ullrich and Zarzycki (2017). An advantage of the approach is that it allows one to diagnose events based on regional climate characteristics that potentially can be defined by stakeholder-relevant impactful events (Sillmann et al., 2021; Fisel et al., 2023) rather than more standard hydroclimate metrics, such as return periods for extreme events or percentile exceedances.
To ensure that an object has some degree of space–time continuity that the models can resolve, we required an object to have at least four adjacent grid points in the space–time domain of the data. Points exceeding the threshold that are not adjacent in the space–time domain cannot be part of the same event. Each event of a given type (heat stress or short-term drought) thus has its own set of points in the space–time domain so that two distinct events can occur in different parts of the domain at the same time. We assumed that all diagnosed objects were events produced by the same climate dynamics in the region. We identified several event characteristics: location, duration, areal extent, and intensity relative to the prescribed thresholds. We arrived at event climatologies by examining the collection of all events for their frequency of occurrence and distribution of properties, as well as possible overlap of short-term drought and heat-stress events that would be compound events. Overlap occurs if a short-term drought event and a heat-stress event have at least one space–time point in common, although, typically, the object overlap involved many more than just one point. The compound events we diagnose, where two types of hazards interact, would be considered multivariate compound events in the typology presented by Zscheischler et al. (2020).
As noted above, we focused on a north-central region of the United States (Figure 1) because of its agricultural importance. The specific domain was based on the climatological regions established by Seneviratne et al. (2012), except that we used only the northern half of their Central North America region, in recognition of the weather and climate differences going from north to south across the regions, which ultimately contributes to agricultural differences, too. Elevation variations are relatively minor in the region, so that topographic effects are not a primary determinant of the region’s climate (USGS, 2024). We analyzed two twenty-year time periods: contemporary (1981–2000), motivated above by the observational considerations above, and future scenario (2041–2060). We chose our future period from a decision-making perspective. Planning horizons for national security and infrastructure often focus 20–50 years into the future (e.g., Schwartz et al., 2008; Department of Defense, 2021; Zeng et al., 2022). Also, some have raised doubts about the viability of an RCP 8.5 scenario through the final decades of the 21st century (Ritchie and Dowlatabadi, 2017; Ho et al., 2019). Further, mid-century global-temperature changes tend to show less sensitivity to RCP scenario compared to changes toward the end of the century (IPCC, 2013, 2021), so the mid-century should be less dependent on the specific scenario used.
Crops generally can tolerate periods of a few days with little, if any, impairment. However, periods of several weeks during the growing season with little to no rainfall can have substantial impact (e.g., Otkin et al., 2018; Licht and Glisan, 2019; Yuan et al., 2023). We diagnose short-term drought that impacts as a 40-day period with total precipitation less than 25 mm, an amount that is roughly 20–25% of long-term summer averages for our analysis region (NOAA National Centers for Environmental Information, 2023). A drought event may last longer than 40 days, so we use a 40-day moving window when summing precipitation. We identify each 40-day period by the first day in the window. The window shifts forward in 1-day increments, so that the month of June in one year, for example, would have 30 successive windows that would be examined for their cumulative precipitation. We identify drought duration as the number of successive windows for which cumulative precipitation is below the 25-mm threshold.
Our analysis period uses windows that start in April, May, June, and July, the prime growing season. The windows toward the end of July thus include August and parts of September in their precipitation summation. Drought occurring later than early September is occurring after all or most of the crop maturation. Dry conditions after maturation can actually be beneficial, rather than detrimental, because they can help prepare the crop for harvest, as it is desirable to have grain lose much of its moisture in preparation for storage.
For heat stress, as noted above, maize and soybeans experience stress at temperatures 30°C and higher. We use daily maximum temperature, Tmax, to identify episodes of stress. We recognize that exceeding the threshold for an isolated day is not as impactful as exceeding the threshold for multiple days in a row. Thus, we compute a running, 5-day average of Tmax and identify when that 5-day average exceeds the threshold, thereby identifying a pentad of persistent heat stress that some have tied to “flash droughts” (Otkin et al., 2018) and that is sufficiently long to impact negatively plant development, especially if it occurs during key reproductive stages (dos Santos et al., 2022). Similar to our short-term drought diagnosis, we use a moving 5-day window to compute the average Tmax, shifting the window forward in 1-day increments and identifying the 5-day period by the first day in the window. Heat-stress duration is then the number of successive windows with average Tmax above 30°C.
3 Results
3.1 Short-term drought events
Figure 2 shows the spatial distribution of event frequency experienced at each grid point across our domain. The observations and the two contemporary simulations show similar overall features, with low or even zero frequency in eastern locations and higher frequency to the west. Frequencies in all three are higher in the northwest and southwest corners of the analysis domain, although the MPI-driven simulation has frequencies in the west that match the observed frequencies more closely. The overall behavior is consistent with average precipitation in the region, which decreases to the west (NCEI, 2023). In the scenario climates, the models give mixed results. The MPI-driven simulation has frequency increases in the west and a mix of relatively small, perhaps inconsequential, changes in the east. In contrast, the GFDL-driven simulation has decreases over most of the domain, including larger areas with zero events.
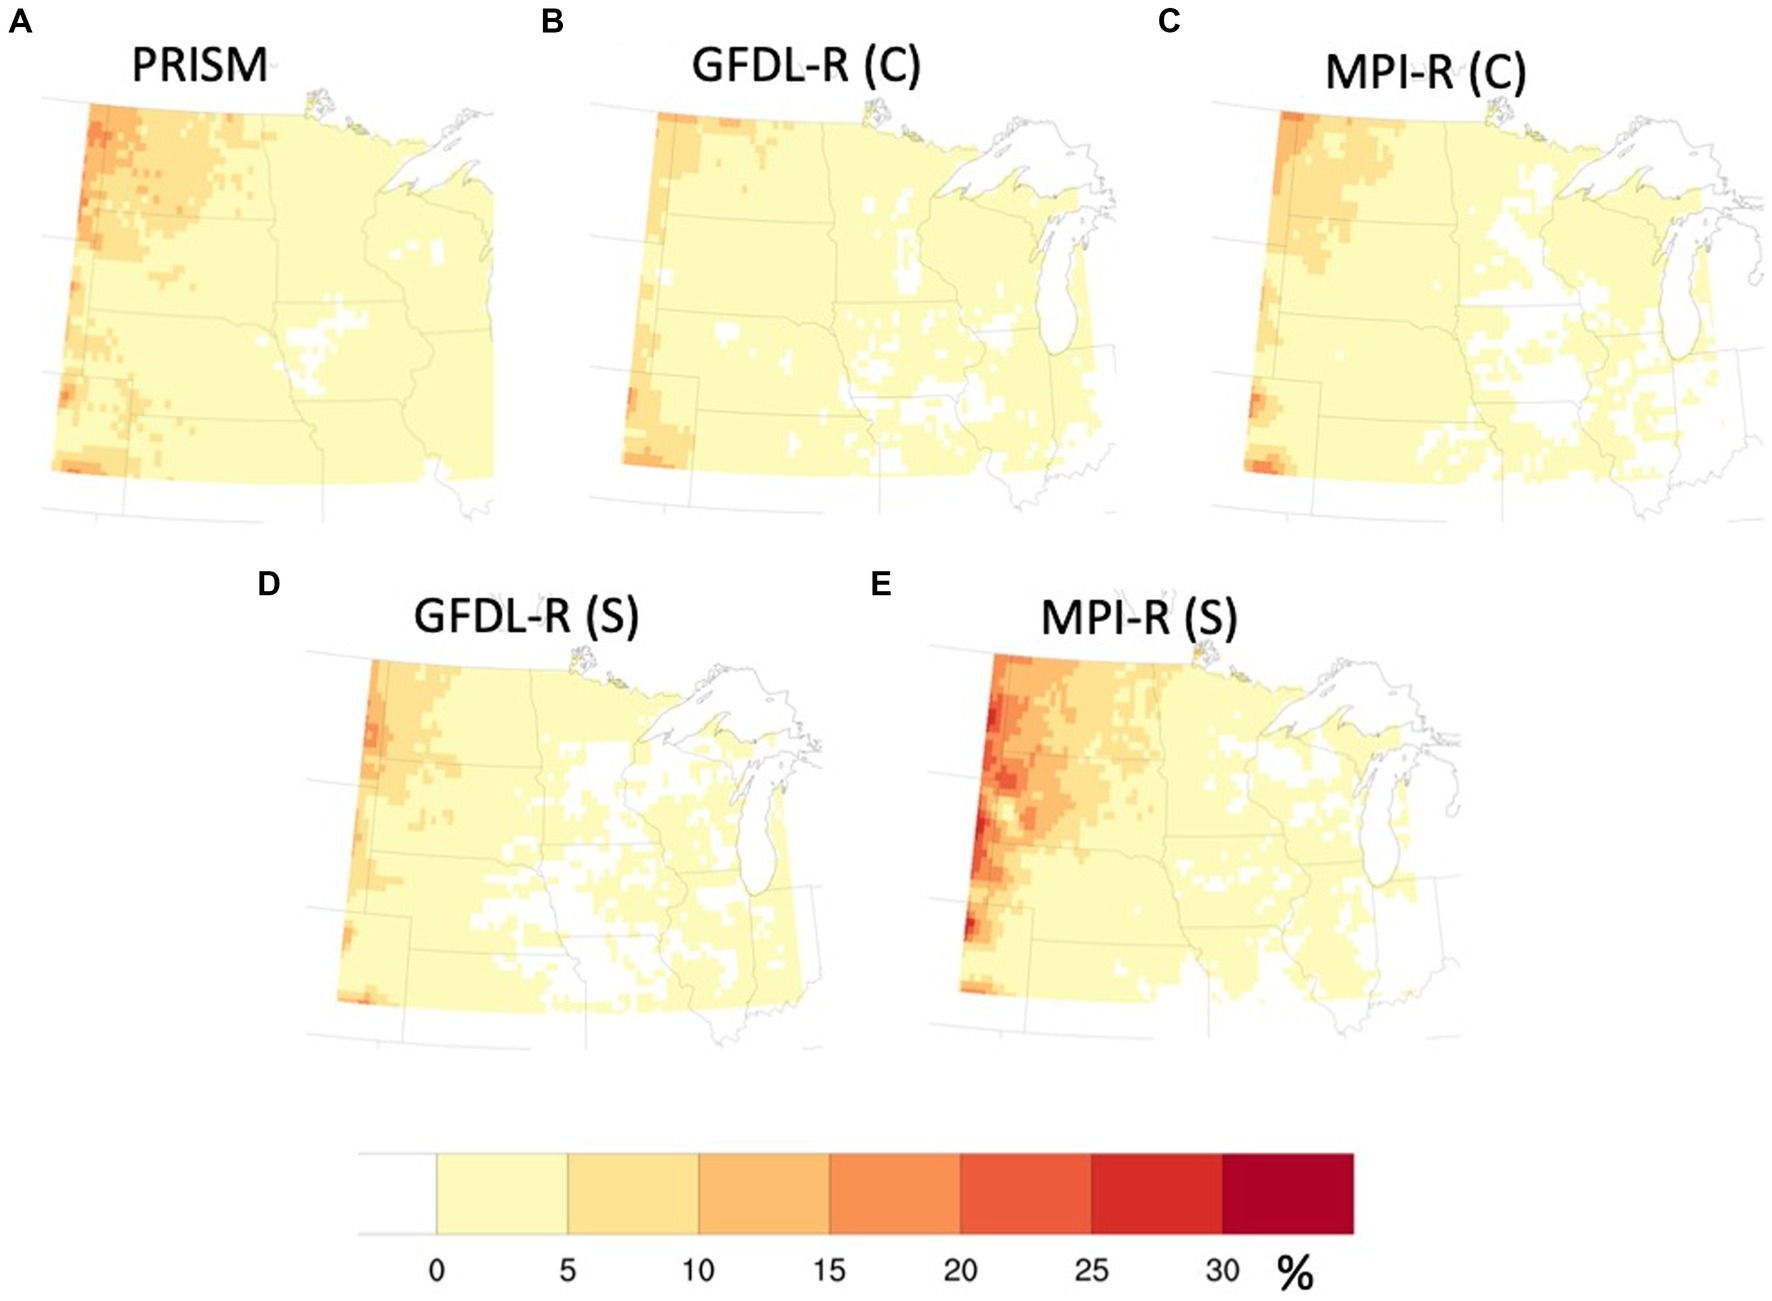
Figure 2. Spatial distribution of short-term-drought frequency (%) for (A) PRISM observations, (B) GFDL-driven RegCM4’s contemporary climate [GFDL-R (C)], (C) MPI-driven RegCM4’s contemporary climate [MPI-R (C)], (D) GFDL-driven RegCM4’s scenario climate [GFDL-R (S)], (E) MPI-driven RegCM4’s scenario climate [MPI-R (S)]. The frequency is the fraction of days during the analysis period that a grid point is part of short-term drought events.
Despite broad similarities between contemporary simulations and observations in Figure 2, the individual events contributing to the frequency maps differ between simulations and observations. Figure 3 shows box-and-whiskers plots of the short-term droughts’ event areas and durations, along with the number of events, for the observations and for the contemporary and scenario simulations. For each event, the area is the average area over the duration time periods since the area of an event may change as the analysis window shifts forward in time. The interquartile ranges for the areas so computed are broader in the simulations compared to the observations, and the simulated medians are 25–50% greater than the observed (Table 1). All contemporary-climate sources show a skewing of areas toward a few events that have much larger areas than most of the short-term drought events, as evidenced by the averages among the sources’ areas exceeding the 90th percentile for each source. However, the simulations show a substantially greater skewing than the observations. Perhaps related to these area differences, the simulated events occur 41–44% less often than observed events (Figure 3), although event durations (Figure 3 and Table 1) in contemporary-climate simulations have approximately the same median and average durations as the observed events. There is a long-standing recognition that the effective resolution of climate models is probably somewhat coarser than their grid spacing (Pielke, 1991; Laprise, 1992; Klaver et al., 2020). The combination here of differences in event areas and frequencies, despite similar event durations and spatial distribution of grid-point frequencies, suggests that the effective resolution of the models is coarser than 25 km, with the behavior producing short-term drought events in observations yielding broader but fewer events in the simulations.
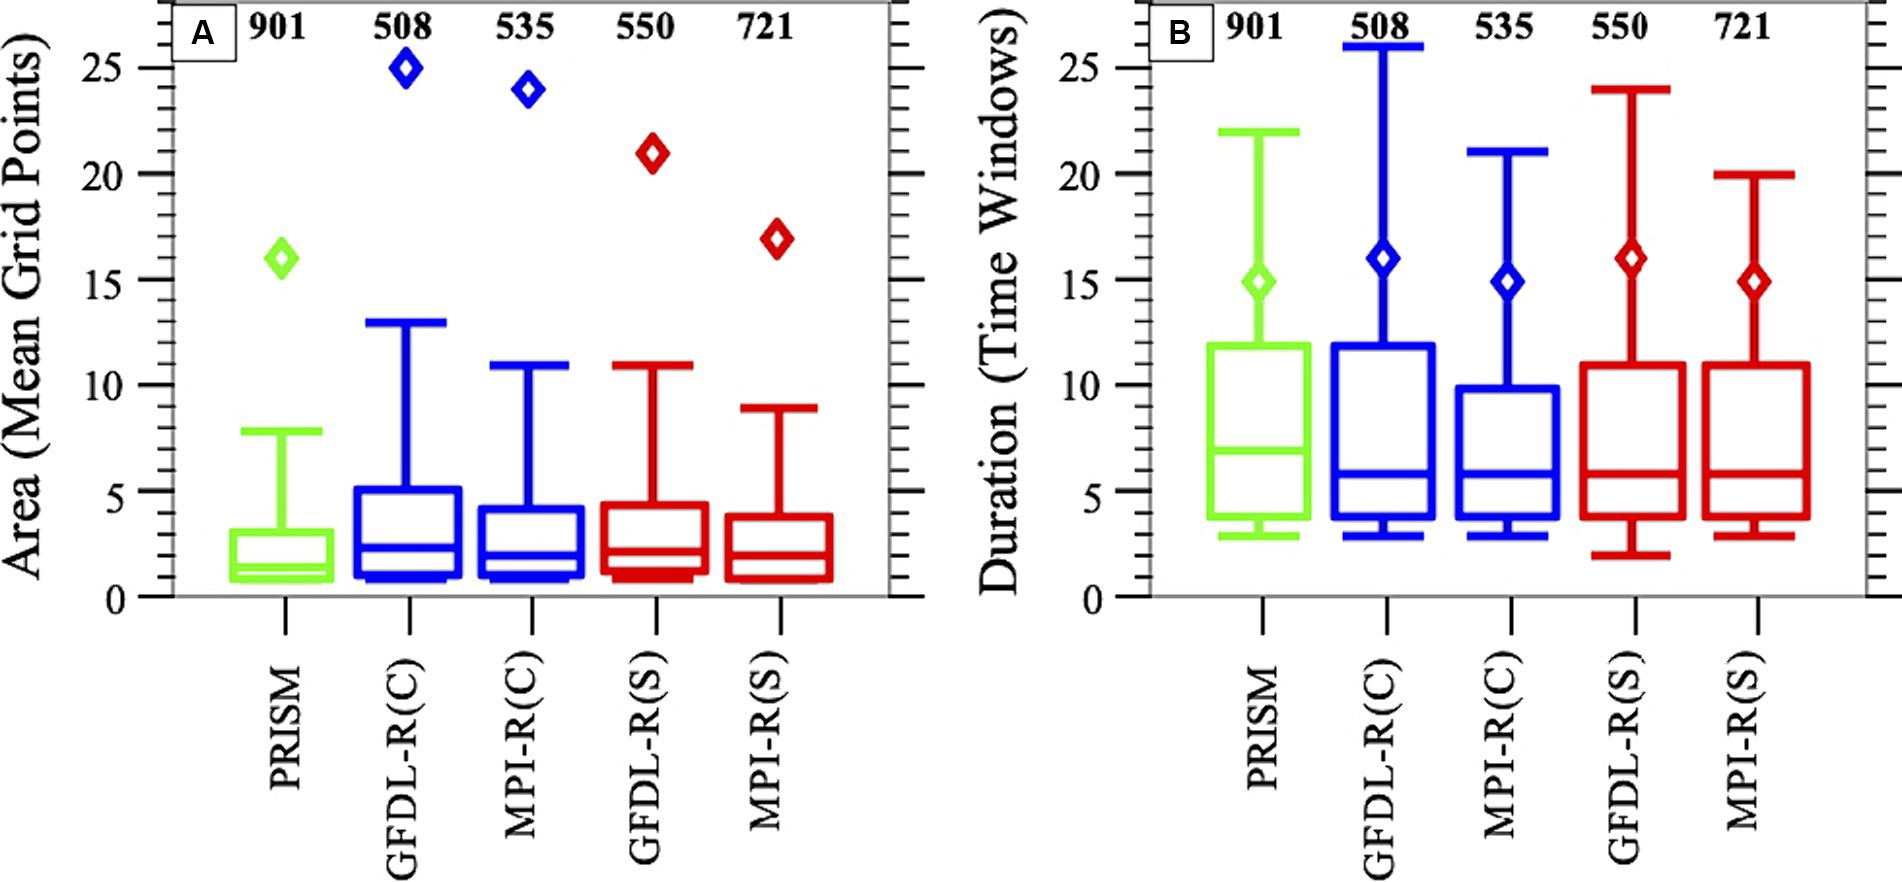
Figure 3. Box-and-whiskers plots of event characteristics of short-term drought for PRISM observations, GFDL-driven RegCM4’s contemporary climate [GFDL-R (C)], MPI-driven RegCM4’s contemporary climate [MPI-R (C)], GFDL-driven RegCM4’s scenario climate [GFDL-R (S)], and MPI-driven RegCM4’s scenario climate [MPI-R (S)]. (A) Mean areas of events in terms of number of 25 km × 25 km grid boxes. (B) Event durations in terms of number of successive time windows. Percentiles depicted: 10% (lower whisker), 25% (box bottom), 50% (box’s interior line), 75% (box top), 90% (upper whisker). Diamonds are the averages over all events. Along the top of each panel are the numbers of events from each data source and period.
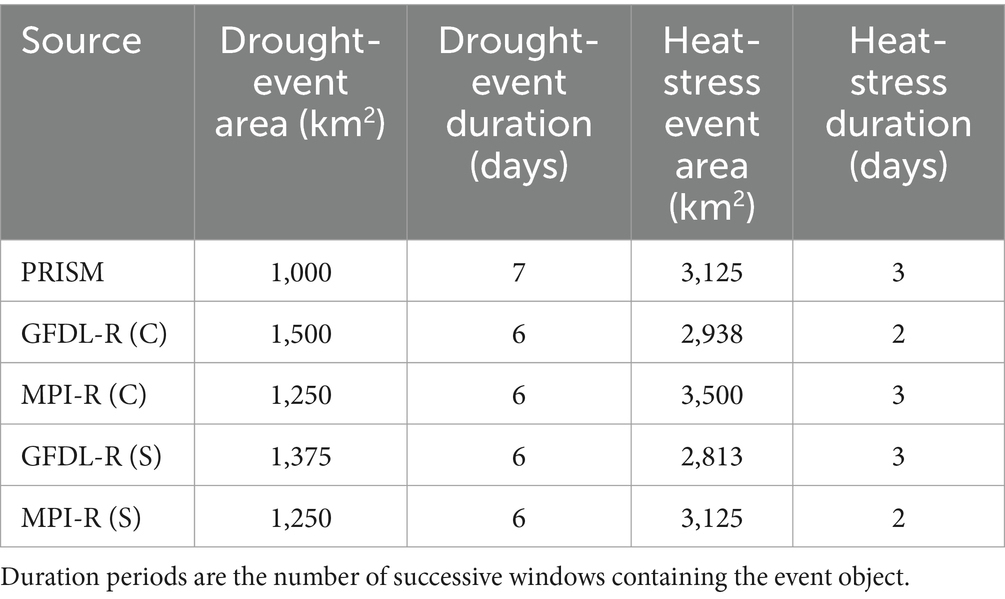
Table 1. Median areas and duration periods for short-term drought events and heat-stress events.
In the scenario climates, the most noticeable change from contemporary climate is the frequency of the drought events, with increases of 8–35%, depending on the driving GCM. In contrast, the event areas and durations change relatively little, except for extreme outliers, which tend to decrease. The similar results for event areas and durations in both climates suggests that the processes causing the events, such as circulation patterns, may be essentially the same in the scenario climates as in the contemporary climates.
3.2 Heat-stress events
Figure 4 shows the spatial distribution of heat-stress event frequency at each grid point across our domain. The observations and the two contemporary simulations show similar overall features, with frequency increasing substantially going from grid points in the northeast toward the southwest, although the simulations tend to show somewhat higher frequencies in the west. The pattern of behavior is consistent with average summer temperatures for this region, which also tend to increase from the northeast toward the southwest (NOAA National Centers for Environmental Information, 2023). In the scenario climates, the overall spatial patterns remain similar, but with higher event frequencies across the domain compared to contemporary climate. The highest frequencies continue to be in the southwestern portion of the domain. The behavior is qualitatively consistent with the pattern of changes in annual temperature for this region produced by the two GCM-RCM combinations used here (Bukovsky and Mearns, 2020).
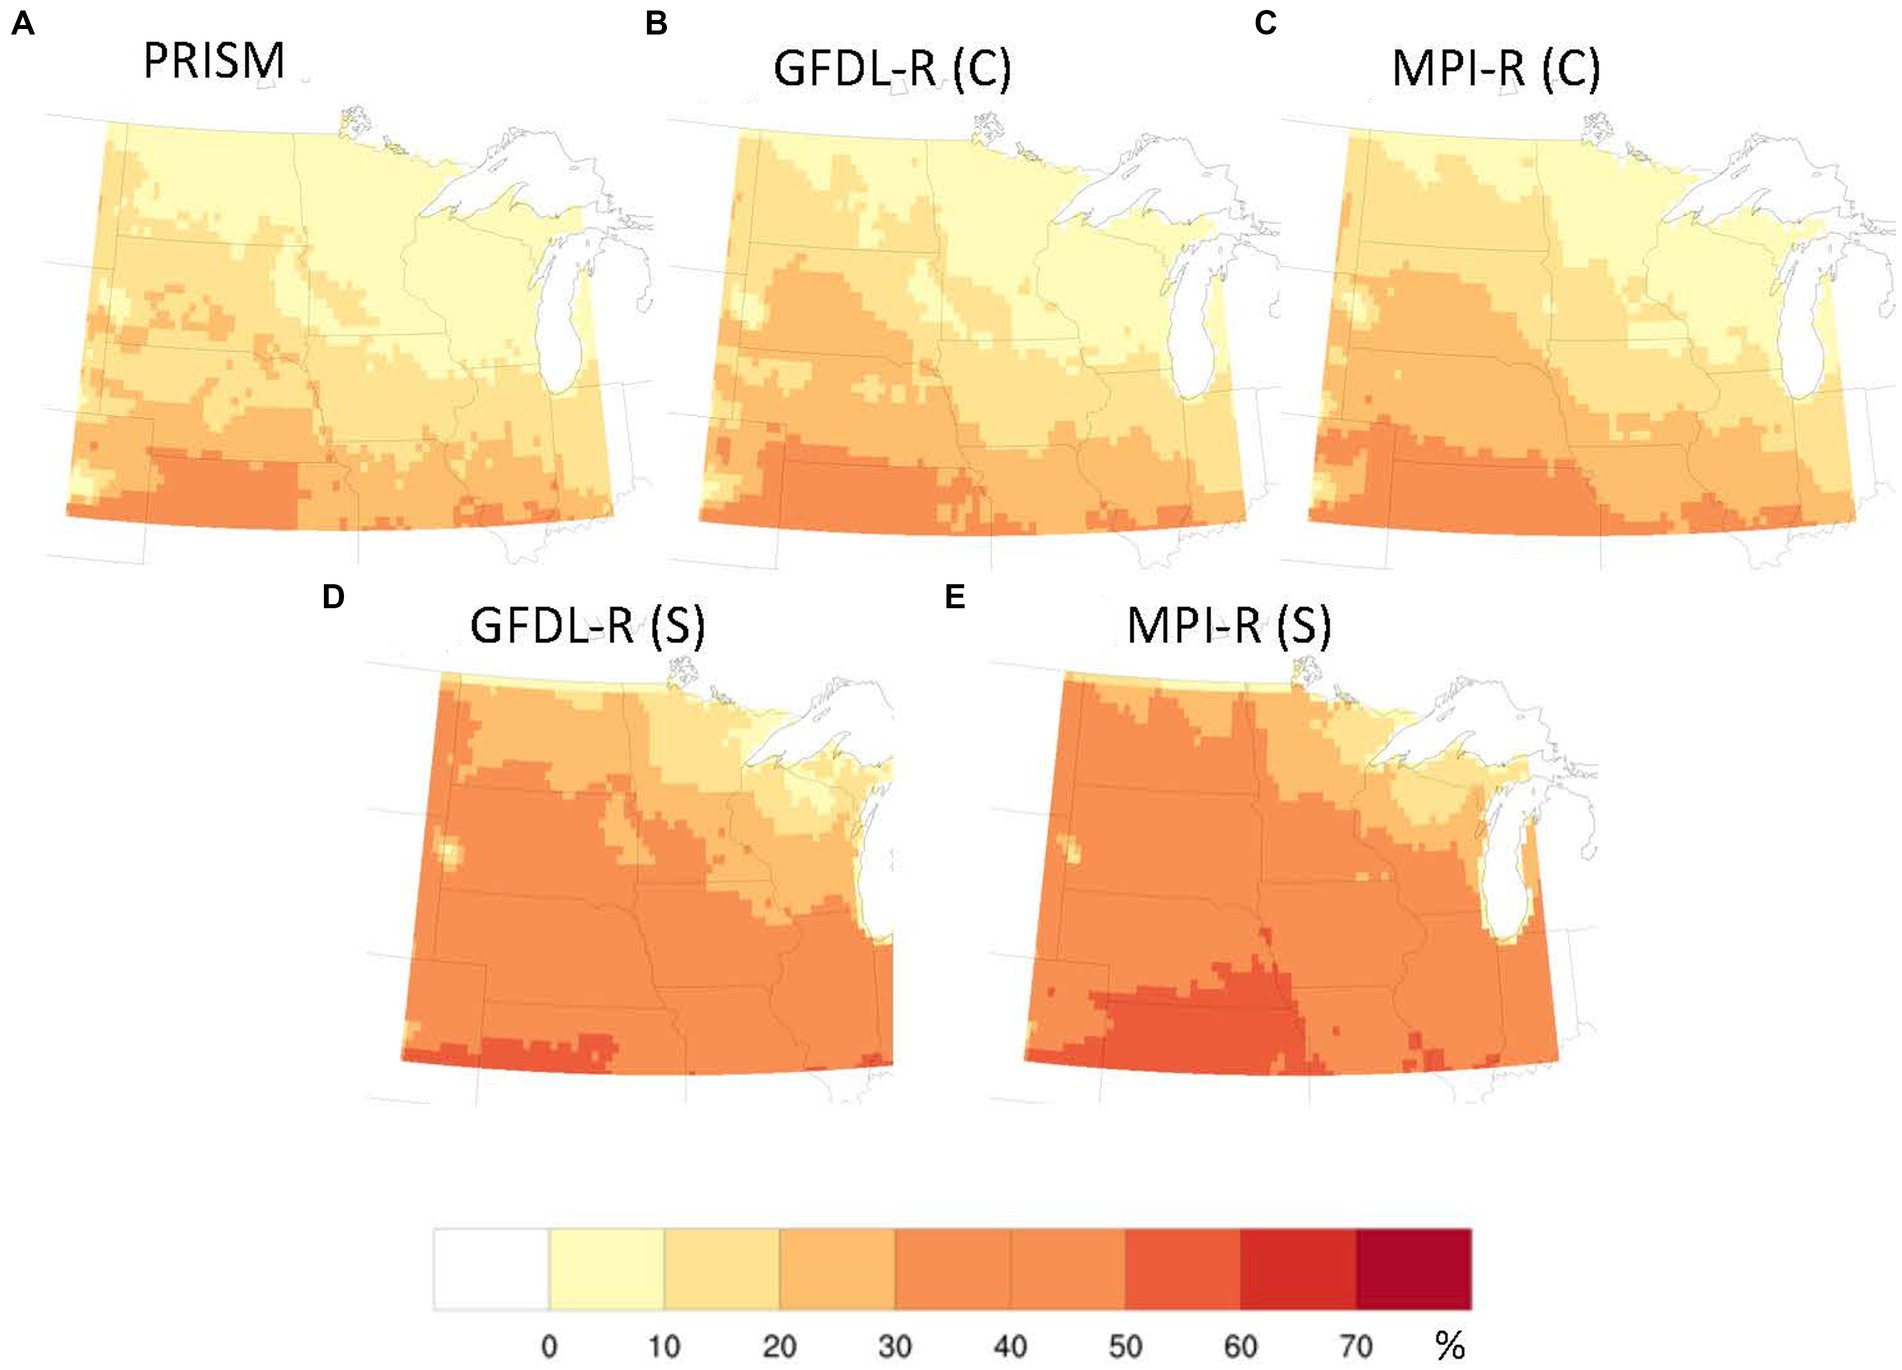
Figure 4. Like Figure 2 but for spatial distribution of heat-stress frequency (%). For (A) PRISM observations, (B) GFDL-driven RegCM4’s contemporary climate [GFDL-R (C)], (C) MPI-driven RegCM4’s contemporary climate [MPI-R (C)], (D) GFDL-driven RegCM4’s scenario climate [GFDL-R (S)], (E) MPI-driven RegCM4’s scenario climate [MPI-R (S)]. The frequency is the fraction of days during the analysis period that a grid point is part of heat-stress events.
Figure 5 shows box-and-whiskers plots for areas and durations of heat-stress events and the number of occurrences in observations and each simulation. Consistent with the short-term droughts, the simulations’ event areas for contemporary climate have approximately the same medians and interquartile range as the observations. However, the simulations produce more skewing in their area distributions toward larger values compared to the observations, as evidenced by the mean and 90th percentile areas for each data source. Event durations in the contemporary simulations, similar to event areas, have the same interquartile range as the observations, but with a skewing toward longer-duration events. The greater skewing of areas and durations in the simulations is consistent with the 22–24% fewer events in the contemporary simulations, compared to the observations (Figure 5). The simulations have fewer events that cover larger areas while exposing individual locations to comparable frequencies of heat stress in both the observations and the simulations. As with short-term drought, the results are consistent with the models having an effective resolution that is coarser than their 25-km grid spacing, in line with arguments and analyses by Pielke (1991), Laprise (1992), and Klaver et al. (2020). The coarser effective resolution would yield a degree of smoothing relative to the observations that can blend features such as our events. Features that would be distinct at finer resolution, would be blended into fewer distinct features (events) in the effectively coarser resolution.
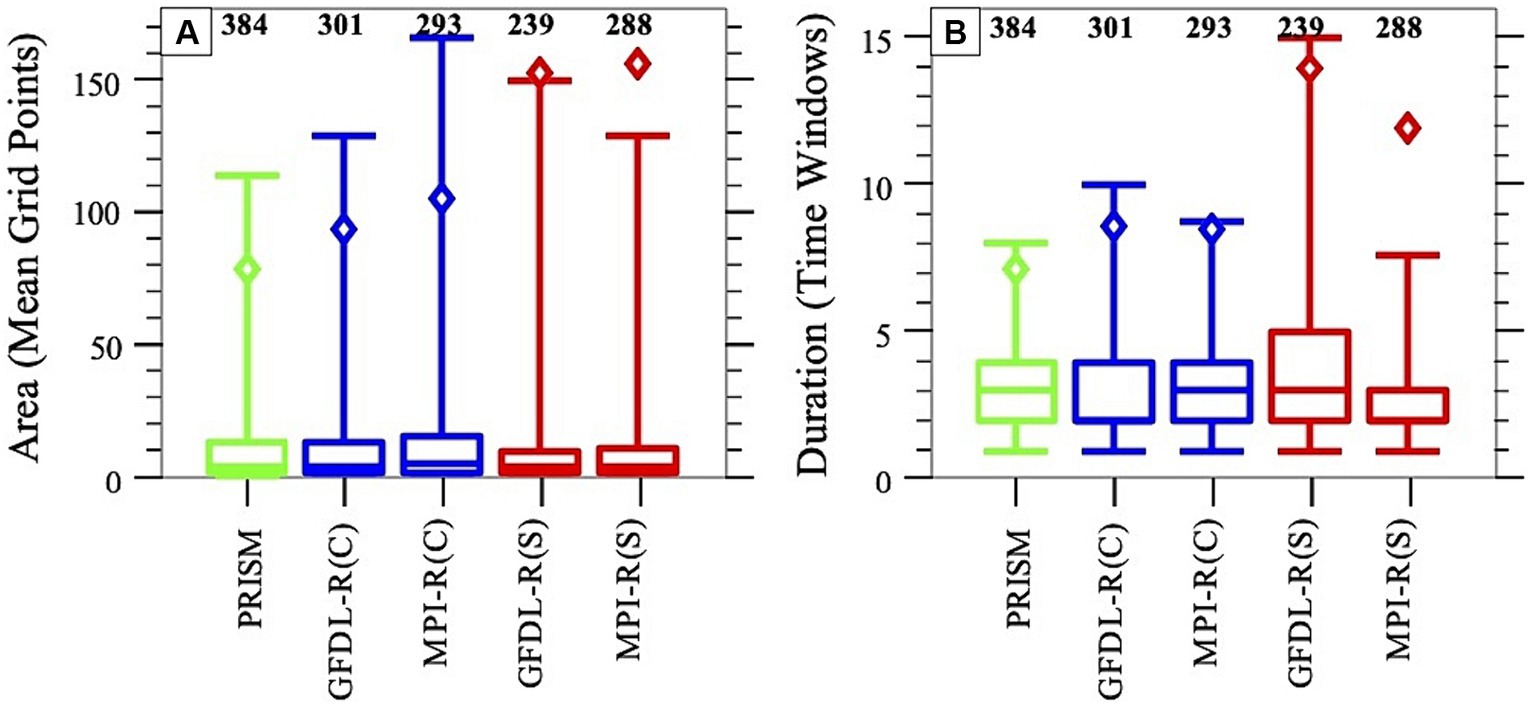
Figure 5. Like Figure 3 but for event characteristics of heat stress. The median duration for both GFDL-R (C) and MPI-R (S) is 2 time windows. (A) Mean areas of events in terms of number of 25 km × 25 km grid boxes. (B) Event durations in terms of number of successive time windows.
In the scenario climates, both GCM-RCM combinations show a decrease in event frequency, but with different degrees of decrease: 21% under GFDL driving and 2% under MPI driving. Both GCM-RCM combinations also show a decrease in median areas (4% under GFDL driving and 11% under MPI driving; Table 1) but roughly 50% increases in mean areas, indicating much greater skewing toward large-area events in the scenario climates. Duration changes, on the other hand are mixed: increased interquartile range with GFDL driving and decreased interquartile range with MPI driving. Despite these differences, again, both simulations show similar changes in the frequency of heat stress events experienced at individual grid points (Figure 4), with heat stress tending to occur more frequently at every grid point in the scenario climate. This would be a consequence of the increase in very large events that can encompass many more grid points, thus allowing individual grid points to experience more frequent heat stress, despite the somewhat fewer numbers of events. This behavior is especially evident in the MPI-R cases, which have very little decrease in the number of events.
3.3 Overlapping (compound) events
A sizeable number of short-term drought events overlap heat-stress events, thus creating compound events (Table 2), although the percent experiencing overlap varies substantially with data source. For short-term drought, the GFDL-driven and MPI-driven simulations in contemporary climate have roughly similar numbers of events, area distributions and duration distributions. The difference in their overlap percentages might be due to heat-stress events with MPI driving having somewhat larger median and average event areas and longer median durations, thus allowing MPI-driven heat-stress events to encompass more short-term drought events. In addition, not only do more short-term drought events occur in the scenario climates, but a larger fraction is part of compound events in the scenario climates. In contrast, the fraction of heat-stress events overlapping short-term drought events is substantially smaller and the fraction involved in compound events changes little with the climate change.
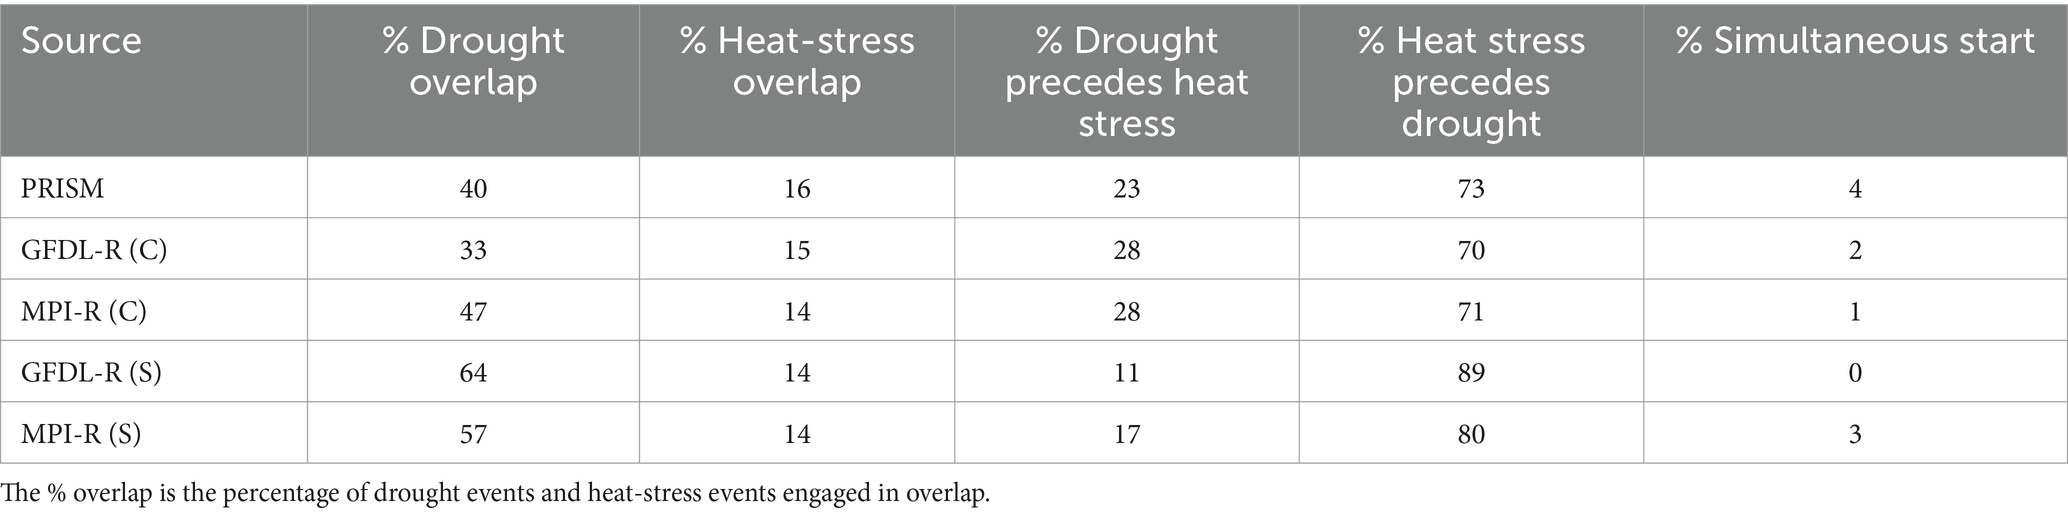
Table 2. Statistics for overlapping short-term drought and heat-stress events.
For the observations and for all simulations, the overwhelming majority of compound events start with a heat-stress event (Table 2). The review of “flash droughts” by Lisonbee et al. (2021) notes several authors referring to the simultaneity of such droughts and heat waves as part of behavior appearing with some of the different characterizations of “flash drought.” However, there do not appear to be any clear statements about heat or rainfall deficit preceding the other.
The character of heat-stress and short-term-drought events differs between compound and non-compound events, especially for heat-stress events (Figures 6, 7). Heat-stress events that overlap with short-term drought events cover much larger areas and persist much longer than heat-stress events that do not overlap with any drought event. The larger areas and longer durations can be viewed as providing more opportunity for any drought event to overlap a heat-stress event. Short-term drought events show some differences between events that overlap heat-stress events and those that do not, but the differences are relatively small compared to those for the compounding versus non-compounding heat-stress events.
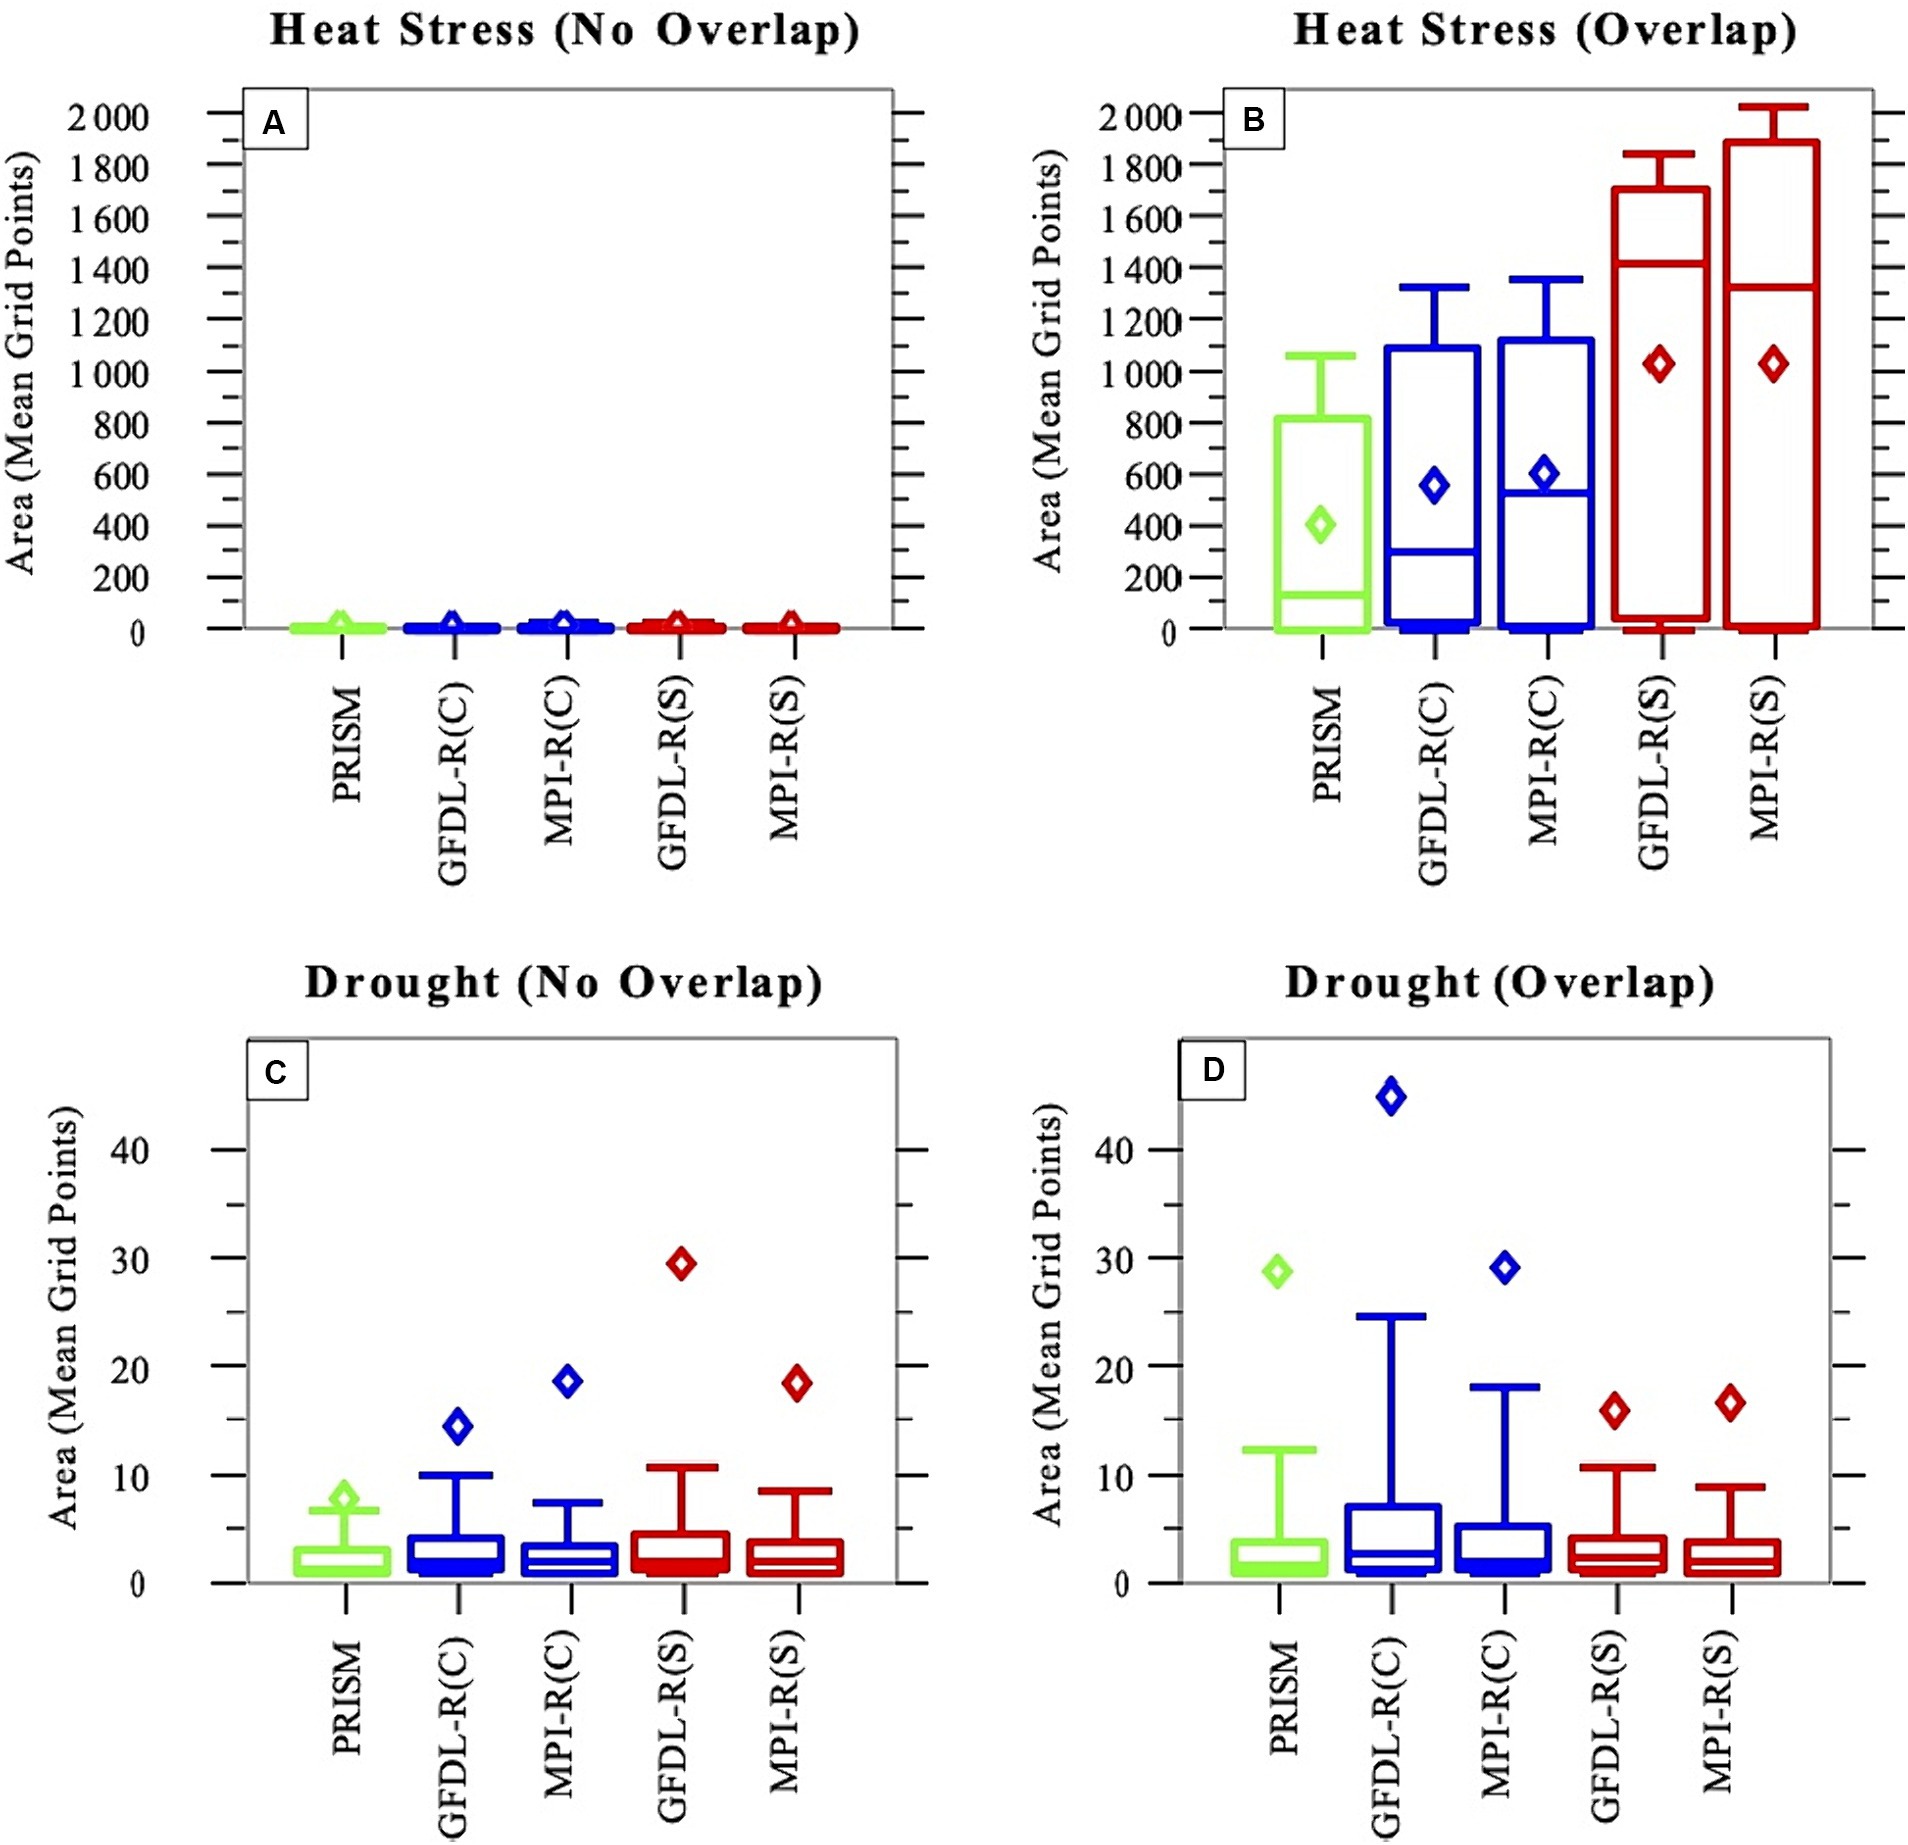
Figure 6. Like Figure 3, but for areas of events segregated by whether or not they are non-compound (no overlap of their object) or compound (object overlap) events, for (A) non-compound heat-stress events, (B) compound heat-stress events, (C) non-compound short-term drought events, and (D) compound drought events.
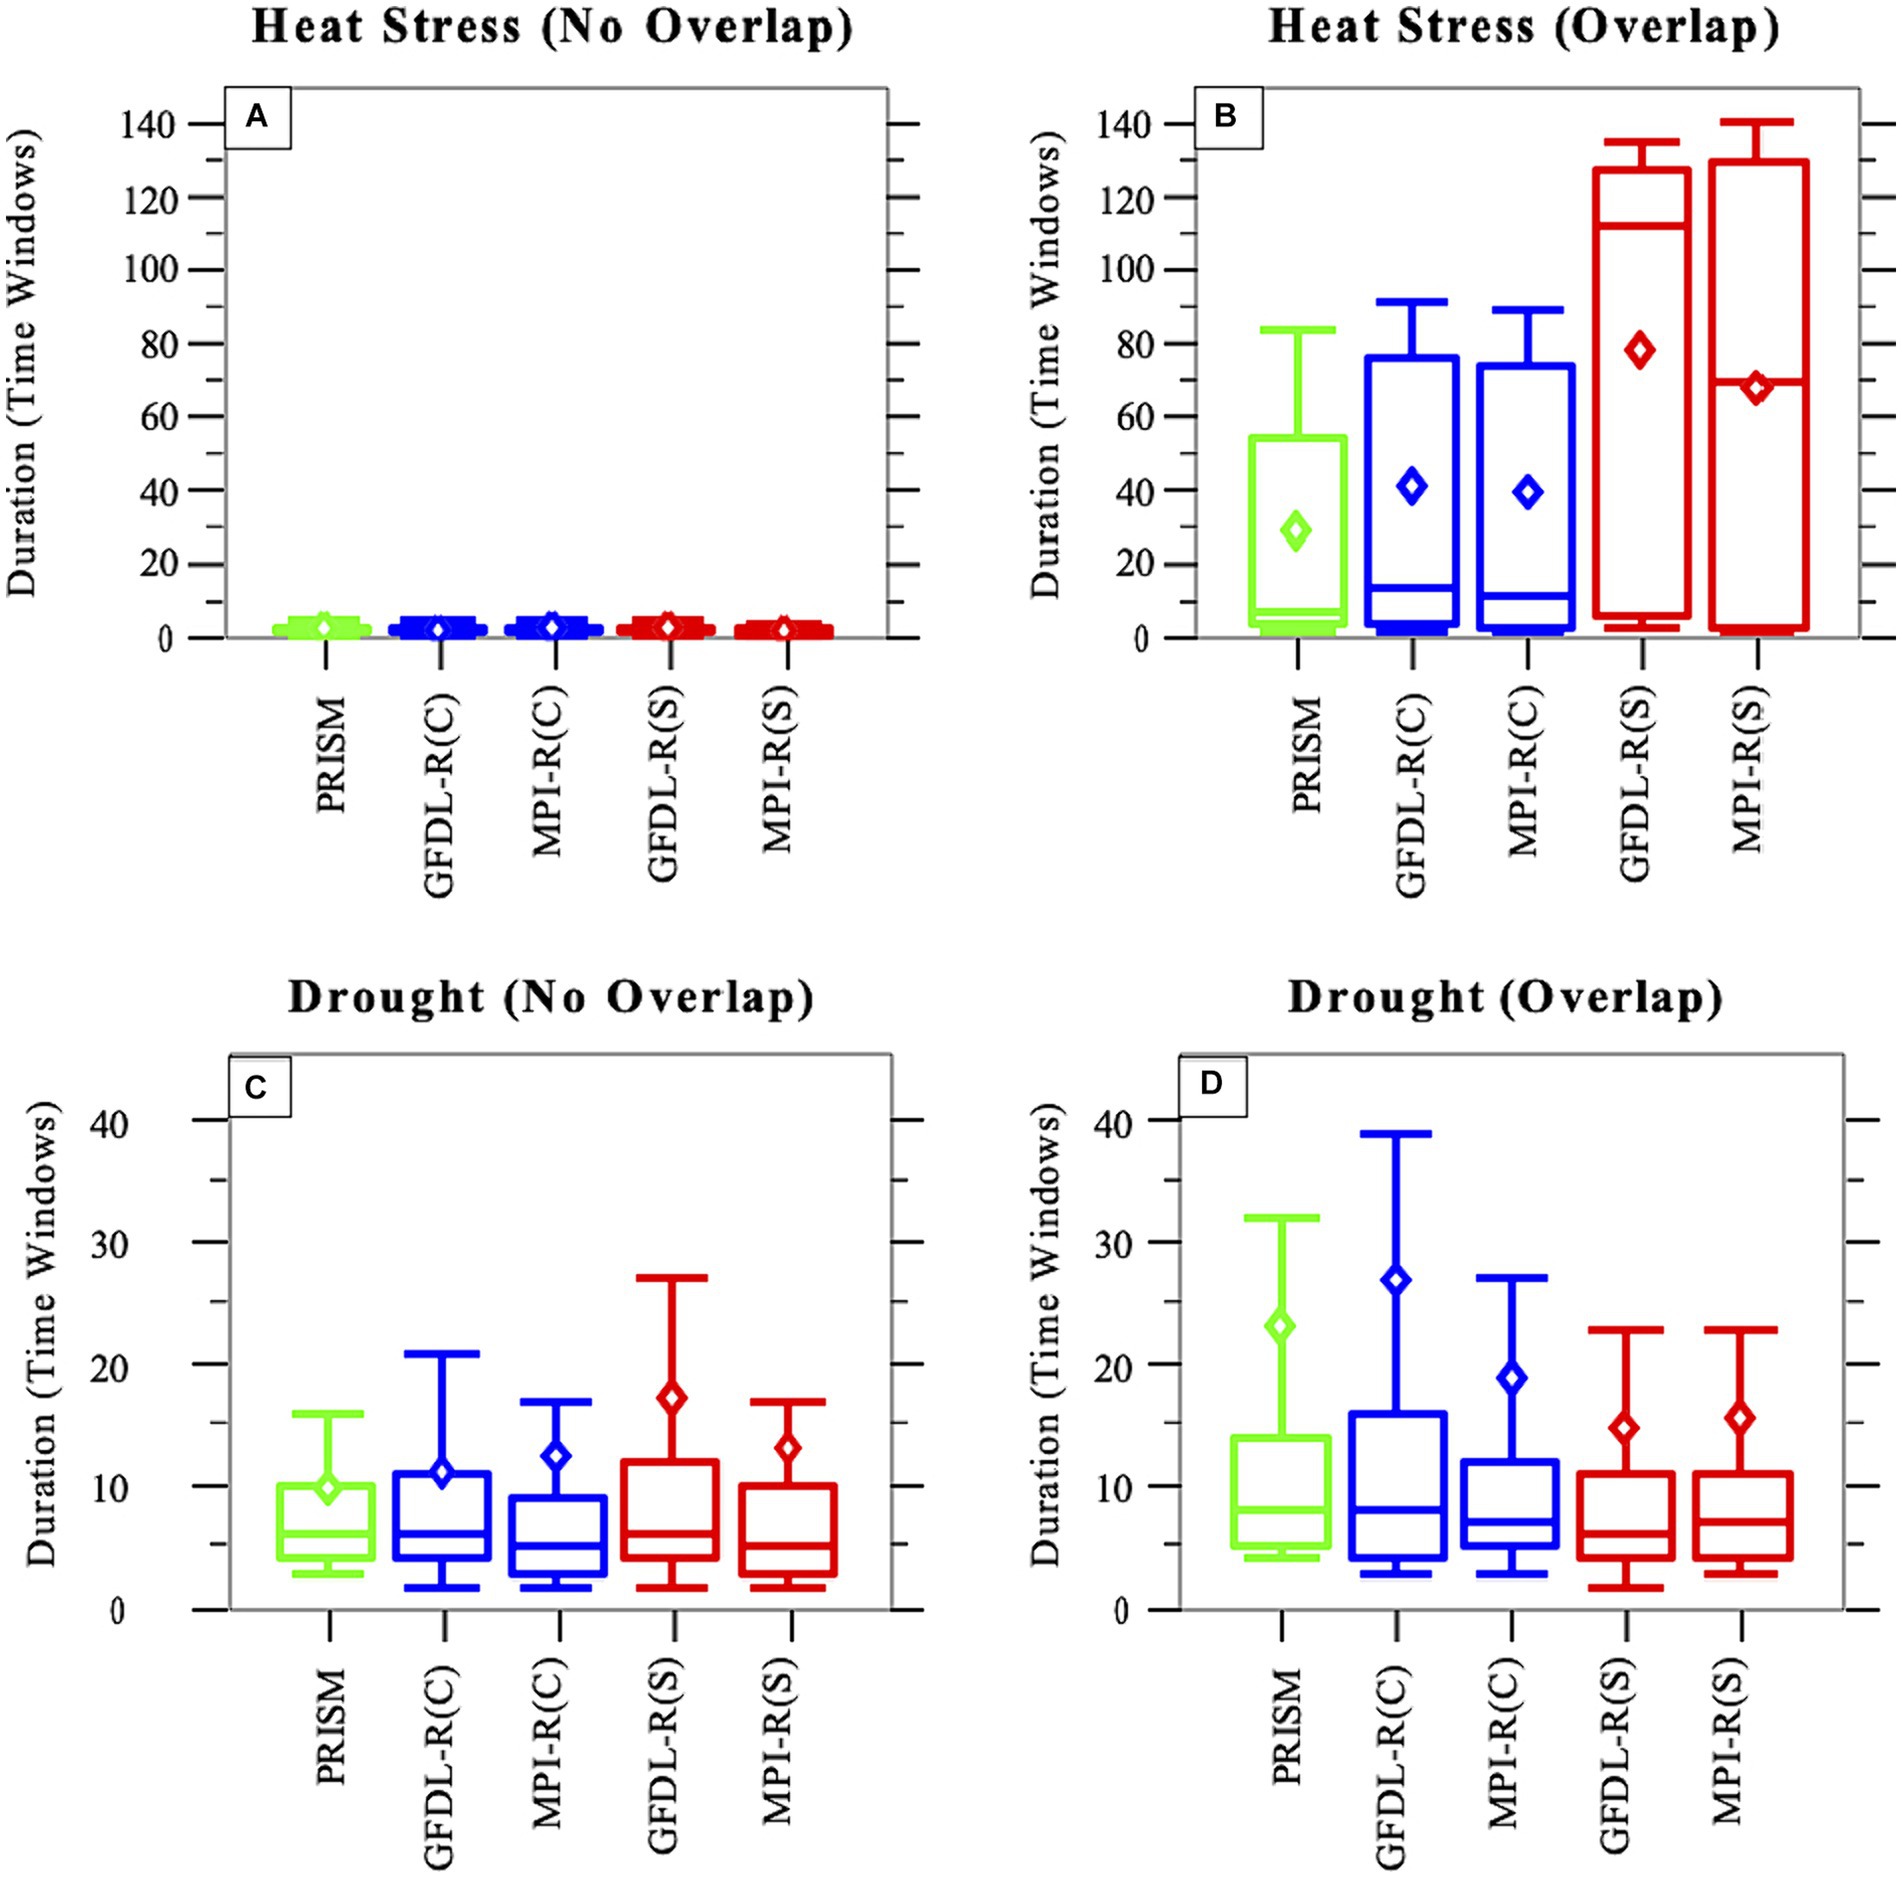
Figure 7. Like Figure 6, but for durations of events segregated by whether or not they are non-compound (no overlap of their object) or compound (object overlap) events.
An important factor is how the intensity of both types of events changes when compound events start. Table 3 shows that both short-term drought and heat-stress events tend to become more intense on the first day of a compound event compared to the day before. For the contemporary climates, the median values for short-term drought events drop down from roughly the 50th-percentile among all short-term-drought intensities just before becoming part of a compound event to roughly the 33rd-percentile on the first day of a compound event. (Note that lower percentiles refer to lower precipitation amounts and thus drier conditions.) For the two scenario climates, many of the drought events engage in overlap on the day they form, so the median intensities the day before compounding, in most cases, are average values over the region where the drought event starts the next day. Thus, for the scenario climates, the median intensities are above the threshold for a drought object. This behavior is consistent with the substantial tendency for heat-stress events to precede drought events when compounding occurs.
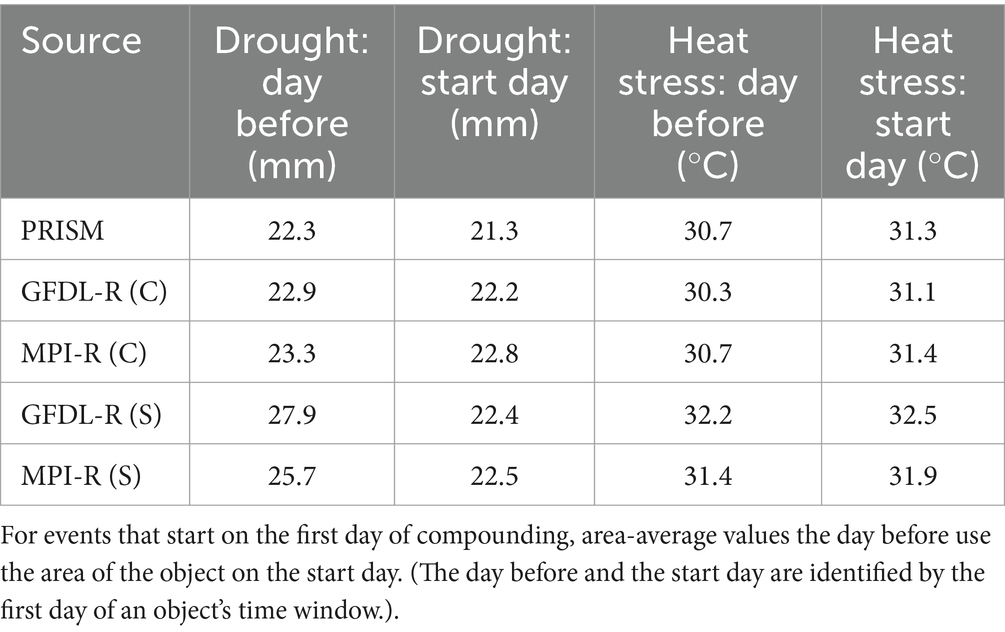
Table 3. Median intensities for short-term drought events and heat-stress events averaged over object area the day before compounding starts and on the start day of the compound event.
Similarly, the median intensities for heat-stress events shift to higher (warmer) values in nearly all cases. Compounding appears to reenforce the intensity of both types of events. Drier conditions during a drought imply less evaporative cooling of the surface, promoting warmer surface temperature and thus temperature of the air just above the surface. However, for the heat-stress events, the percentile shift is generally smaller between the day before and the first day of compounding, typically just a few percentiles. This behavior is also consistent with the substantial tendency for heat-stress events to precede drought events when compounding occurs.
3.4 Foundations for climate storylines
The event analysis presented here provides a foundation for constructing climate storylines of climate change using as building blocks the short-term drought and heat-stress events separately and for their compound events. For the individual types of events, the foundation for storylines appears to be straightforward. One can use the set of event characteristics presented here (area, duration, intensity, frequency, and spatial distribution across the region) to explore which conditional factors may govern the occurrence of the event [e.g., Shepherd (2019) and Box 10.2 in Doblas-Reyes et al. (2023)]. For compound events, heat-stress events can be viewed as a conditional factor for the most intense short-term drought events, with those drought events in turn prompting yet more intense heat stress. In this context, a message for agricultural concerns would be to watch especially for heat-stress events as precursors to short-term drought. The heat-stress events may be a warning for both more intense heat and, especially, drought, because when compounding starts, the heat and drought intensities both become stronger: temperatures increase in a region with compounding events and dry conditions become yet drier.
4 Conclusion
We have used an object-oriented analysis to identify short-term drought events and heat-stress events that start at some point in April–July and that can have negative impacts on agriculture during prime growing season. By identifying areal extent and duration of events, along with their frequency and intensity, the analysis complements extreme-value analysis that looks for event frequency of occurrence on a point-by-point basis. Short-term (several week) drought events that can impact agriculture occur more frequently in our analysis region (Figure 1) than do heat-stress events. The drought events also have smaller areas but longer durations (as defined here) than heat-stress events.
The short-term drought events are much more likely than heat-stress events to be part of a compound event involving both. When compound drought and heat-stress evens do occur, heat-stress events much more frequently are a precursor to the compound events than are short-term drought events. Perhaps especially important, when compounding occurs, the heat stress and the drought both become more intense. This suggests that the appearance of a heat-stress event could raise an alert to watch for emergent drought behavior, as yet more extreme hotter and drier conditions may develop.
The thresholds used here were adopted for the predominant crops of our analysis region, maize and soybeans. For other crop types, different thresholds are likely. One might also note that crop genetics undergo constant improvement efforts, such as work making crops less vulnerable to dry conditions (Mcfadden et al., 2019). In that light, the thresholds used here might be reassessed and modified as crop genetics change. Analyses such as this one might suggest which types of impactful events are most important to strengthen crops against in the future. Multi-year droughts can also have impact, of course, though such droughts would require separate consideration of their occurrence, impacts and possible compounding behavior.
This analysis is based on the behavior of simulations performed for the North American portion of the CORDEX program. While the two GCM-RCM combinations examined here generally agree on the character of the events, their behavior with changing climate, and their compound behavior, further study, of course, with other simulations would help establish more robustly (potentially) the behavior diagnosed here. Further, one might view the distributions of event characteristics seen in several of the figures as a basis for developing a probabilistic understanding of when and where such events are more likely and how event characteristics may change in a future climate. For example, in the results here, the occurrence of a heat-stress event would increase the likelihood of a very intense short-term drought, in contrast to an emerging drought without preconditioning of an ongoing heat-stress event. However, such an effort would also need a larger set of simulations to characterize the probabilistic viewpoint more robustly. This would include, for example, guidance provided by single-model, initial condition large ensembles to help distinguish signals of forced changes from the “noise” of unforced variability (e.g., Doblas-Reyes et al., 2023, and references therein).
Considering the changes in heat-stress and drought intensities when compounding occurs, it is quite understandable that the drier conditions at drought onset can promote higher temperatures (and heat stress), such as through reduced evaporative cooling. However, why higher heat stress at start of compound events promotes more intense drought (as measured by a lack of precipitation) seems less clear. Perhaps the onset of drier conditions coupled with warmer temperatures yields a larger vapor-pressure deficit as the air warms with perhaps little moisture added from a drying surface. In that instance, greater uplift of air parcels would be required for them to reach saturation, thus inhibiting precipitation. Ultimately, the more intense drought behavior may be tied to atmospheric circulation conditions promoting the compound behavior. This would be a topic that requires further exploration.
Data availability statement
Publicly available datasets were analyzed in this study. This data can be found here: the PRISM data analyzed here is available from the PRISM website: https://prism.oregonstate.edu/ (accessed July 8, 2022). North America CORDEX simulation output is available at https://na-cordex.org/data.html (accessed September 19, 2022).
Author contributions
BF: Conceptualization, Data curation, Formal analysis, Investigation, Methodology, Software, Supervision, Validation, Visualization, Writing – original draft, Writing – review & editing. SG: Formal analysis, Investigation, Software, Visualization, Writing – original draft. DH: Formal analysis, Investigation, Software, Visualization, Writing – original draft. MZ: Formal analysis, Investigation, Software, Validation, Visualization, Writing – original draft. WG: Conceptualization, Formal analysis, Funding acquisition, Investigation, Methodology, Project administration, Resources, Supervision, Validation, Visualization, Writing – original draft, Writing – review & editing.
Funding
The author(s) declare financial support was received for the research, authorship, and/or publication of this article. This research was funded by U.S. Department of Energy Office of Science Award DE-SC0016438.
Acknowledgments
The authors thank simulation groups at Iowa State and the U.S. National Center for Atmospheric Research (NCAR) for producing and archiving the North America CORDEX output used here. NCAR is sponsored by the U.S. National Science Foundation. The U.S. Department of Defense Environmental Security Technology Certification Program has provided additional support for the North American CORDEX archive. We thank the reviewers for their comments that helped improve the paper.
Conflict of interest
The authors declare that the research was conducted in the absence of any commercial or financial relationships that could be construed as a potential conflict of interest.
Publisher’s note
All claims expressed in this article are solely those of the authors and do not necessarily represent those of their affiliated organizations, or those of the publisher, the editors and the reviewers. Any product that may be evaluated in this article, or claim that may be made by its manufacturer, is not guaranteed or endorsed by the publisher.
References
Bezner Kerr, R., Hasegawa, T., Lasco, R., Bhatt, I., Deryng, D., Farrel, A., et al. (2023). “Food, fibre and other ecosystem products” in Climate change 2022 – Impacts, adaptation and vulnerability. Contribution of Working Group II to the Sixth Assessment Report of the Intergovernmental Panel on Climate Change. eds. H. O. Pörtner, D. C. Roberts, M. Tignor, E. S. Poloczanska, K. Mintenbeck, and A. Alegría, et al. (Cambridge, UK and New York, NY, USA: Cambridge University Press), 713–906.
Bukovsky, M. S., and Mearns, L. O. (2020). Regional climate change projections from NA-CORDEX and their relation to climate sensitivity. Clim. Chang. 162, 645–665. doi: 10.1007/s10584-020-02835-x
Cannon, A. J. (2018). Multivariate quantile mapping bias correction: an N-dimensional probability density function transform for climate model simulations of multiple variables. Clim. Dyn. 50, 31–49. doi: 10.1007/s00382-017-3580-6
Department of Defense. (2021). Department of Defense Draft Climate Adaptation Plan. Available at: https://www.sustainability.gov/pdfs/dod-2021-cap.pdf
Doblas-Reyes, F. J., Sörensson, A. A., Almazroui, M., ADosio, A., Gutowski, W. J., Haarsma, R., et al. (2023). “Linking global to regional climate change” in Climate change 2021 – The physical science basis. Contribution of working group I to the sixth assessment report of the intergovernmental panel on climate change. eds. V. Masson-Delmotte, P. Zhai, A. Pirani, S. L. Connors, C. Péan, and S. Berger, et al. (Cambridge, United Kingdom and New York, NY, USA: Cambridge University Press), 1363–1512.
dos Santos, C. A. C., Neale, C. M. U., Mekonnen, M. M., Gonçalves, I. Z., de Oliveira, G., Ruiz-Alvarez, O., et al. (2022). Trends of extreme air temperature and precipitation and their impact on corn and soybean yields in Nebraska, USA. Theor. Appl. Climatol. 147, 1379–1399. doi: 10.1007/s00704-021-03903-7
Dunne, J. P., John, J. G., Adcroft, A. J., Griffies, S. M., Hallberg, R. W., Shevliakova, E., et al. (2012). GFDL’s ESM2 global coupled climate–carbon earth system models. Part I: physical formulation and baseline simulation characteristics. J. Clim. 25, 6646–6665. doi: 10.1175/JCLI-D-11-00560.1
Dunne, J. P., John, J. G., Shevliakova, E., Stouffer, R. J., Krasting, J. P., Malyshev, S. L., et al. (2013). GFDL’s ESM2 global coupled climate–carbon earth system models. Part II: carbon system formulation and baseline simulation characteristics*. J. Clim. 26, 2247–2267. doi: 10.1175/JCLI-D-12-00150.1
Feng, P., Wang, B., Liu, D. L., Waters, C., and Yu, Q. (2019). Incorporating machine learning with biophysical model can improve the evaluation of climate extremes impacts on wheat yield in South-Eastern Australia. Agric. For. Meteorol. 275, 100–113. doi: 10.1016/j.agrformet.2019.05.018
Fisel, B. J., Erickson, N. E., Young, C. R., Ellingworth, A. L., and Gutowski, W. J. (2023). Evaluating contemporary and future-scenario substantial-precipitation events in the Missouri River basin using object-oriented analysis. Climate 11:112. doi: 10.3390/cli11050112
Giorgi, F., and Anyah, R. O. (2012). The road towards Reg CM4. Clim. Res. 52, 3–6. doi: 10.3354/cr01089
Giorgi, F., and Gutowski, W. J. (2015). Regional dynamical downscaling and the CORDEX initiative. Annu. Rev. Environ. Resour. 40, 467–490. doi: 10.1146/annurev-environ-102014-021217
Goulart, H. M. D., van der Wiel, K., Folberth, C., Balkovic, J., and van den Hurk, B. (2021). Storylines of weather-induced crop failure events under climate change. Earth Syst. Dynam. 12, 1503–1527. doi: 10.5194/esd-12-1503-2021
Gutowski, W. J., and Giorgi, F. (2020). “Coordination of regional downscaling” in Oxford research encyclopedia of climate science Ed: Richards-Karamarkovich I., (Oxford, UK, and New York, NY, USA: Oxford University Press)
Hazeleger, W., Van Den Hurk, B. J. J. M., Min, E., Van Oldenborgh, G. J., Petersen, A. C., Stainforth, D. A., et al. (2015). Tales of future weather. Nat. Clim. Chang. 5, 107–113. doi: 10.1038/nclimate2450
Hitchens, N. M., Baldwin, M. E., and Trapp, R. J. (2012). An object-oriented characterization of extreme precipitation-producing convective systems in the Midwestern United States. Mon. Weather Rev. 140, 1356–1366. doi: 10.1175/MWR-D-11-00153.1
Ho, E., Budescu, D., Bosetti, V., van Vuuren, D. P., and Keller, K. (2019). Not all carbon dioxide emission scenarios are equally likely: a subjective expert assessment. Clim. Chang. 155, 545–561. doi: 10.1007/s10584-019-02500-y
IPCC (2013). “Summary for policymakers” in Climate change 2013: The physical science basis. Contribution of working group I to the fifth assessment report of the intergovernmental panel on climate change. eds. T. F. Stocker, D. Qin, G.-K. Plattner, M. Tignor, S. K. Allen, and J. Boschung, et al. (Cambridge, United Kingdom and New York, NY, USA: Cambridge University Press), 1–30.
IPCC (2021). “Summary for policymakers” in Climate change 2021: The physical science basis. Contribution of working group I to the sixth assessment report of the intergovernmental panel on climate change. eds. V. Masson-Delmotte, P. Zhai, A. Pirani, S. L. Connors, C. Péan, and S. Berger, et al. (Cambridge, United Kingdom and New York, NY, USA: Cambridge University Press), 3–32.
Jones, P. W. (1999). First- and second-order conservative remapping schemes for grids in spherical coordinates. Mon. Weather Rev. 127, 2204–2210. doi: 10.1175/1520-0493(1999)127<2204:FASOCR>2.0.CO;2
Jungclaus, J. H., Fischer, N., Haak, H., Lohmann, K., Marotzke, J., Matei, D., et al. (2013). Characteristics of the ocean simulations in the max Planck Institute Ocean model (MPIOM) the ocean component of the MPI-earth system model. J. Adv. Model. Earth Syst. 5, 422–446. doi: 10.1002/jame.20023
Klaver, R., Haarsma, R., Vidale, P. L., and Hazeleger, W. (2020). Effective resolution in high resolution global atmospheric models for climate studies. Atmos. Sci. Lett. 21:e952. doi: 10.1002/asl.952
Laprise, R. (1992). The resolution of global spectral models. Bull. Am. Meteorol. Soc. 73, 1453–1455. doi: 10.1175/1520-0477-73.9.1453
Licht, M., and Glisan, J. (2019). Flash drought and crop stress concerns. Available at: https://crops.extension.iastate.edu/blog/justin-glisan-mark-licht/flash-drought-and-crop-stress-concerns.
Lisonbee, J., Woloszyn, M., and Skumanich, M. (2021). Making sense of flash drought: definitions, indicators, and where we go from here. J. Appl. Serv. Climatol. 2021, 1–19. doi: 10.46275/JOASC.2021.02.001
Maiorano, A., Martre, P., Asseng, S., Ewert, F., Müller, C., Rötter, R. P., et al. (2017). Crop model improvement reduces the uncertainty of the response to temperature of multi-model ensembles. Field Crop Res. 202, 5–20. doi: 10.1016/j.fcr.2016.05.001
Mcfadden, J., Smith, D., Wechsler, S., and Wallander, S. (2019). Development, adoption, and Management of Drought-Tolerant Corn in the United States, EIB-204, U.S. Department of Agriculture, Economic Research Service, January 2019.
McGinnis, S., and Mearns, L. (2021). Building a climate service for North America based on the NA-CORDEX data archive. Clim. Serv. 22:100233. doi: 10.1016/j.cliser.2021.100233
Moore, B. J., Mahoney, K. M., Sukovich, E. M., Cifelli, R., and Hamill, T. M. (2015). Climatology and environmental characteristics of extreme precipitation events in the southeastern United States. Mon. Weather Rev. 143, 718–741. doi: 10.1175/MWR-D-14-00065.1
Moss, R. H., Edmonds, J. A., Hibbard, K. A., Manning, M. R., Rose, S. K., van Vuuren, D. P., et al. (2010). The next generation of scenarios for climate change research and assessment. Nature 463, 747–756. doi: 10.1038/nature08823
NCEI. (2023). U.S. Climate Atlas. Available at: https://www.ncei.noaa.gov/access/climateatlas/
NOAA National Centers for Environmental Information. (2023). Climate at a Glance: Regional Time Series. Available at: https://www.ncei.noaa.gov/access/monitoring/climate-at-a-glance/regional/time-series
Otkin, J. A., Anderson, M. C., Hain, C., Svoboda, M., Johnson, D., Mueller, R., et al. (2016). Assessing the evolution of soil moisture and vegetation conditions during the 2012 United States flash drought. Agric. For. Meteorol. 218-219, 230–242. doi: 10.1016/j.agrformet.2015.12.065
Otkin, J. A., Svoboda, M., Hunt, E. D., Ford, T. W., Anderson, M. C., Hain, C., et al. (2018). Flash droughts: a review and assessment of the challenges imposed by rapid-onset droughts in the United States. Bull. Am. Meteorol. Soc. 99, 911–919. doi: 10.1175/BAMS-D-17-0149.1
Pielke, R. A. (1991). A recommended specific definition of “resolution.”. Bull. Am. Meteorol. Soc. 72:1914. doi: 10.1175/1520-0477-72.12.1914
PRISM Climate Group. (2023). PRISM Climate Data. Available at: https://prism.oregonstate.edu/
Ritchie, J., and Dowlatabadi, H. (2017). The 1000 GtC coal question: are cases of vastly expanded future coal combustion still plausible? Energy Econ. 65, 16–31. doi: 10.1016/j.eneco.2017.04.015
Rötter, R. P., Appiah, M., Fichtler, E., Kersebaum, K. C., Trnka, M., and Hoffmann, M. P. (2018). Linking modelling and experimentation to better capture crop impacts of agroclimatic extremes—a review. Field Crop Res. 221, 142–156. doi: 10.1016/j.fcr.2018.02.023
Schwartz, H. G. Jr., Clark, A. C., Dickey, G. E., Eads, G. E., Gallamore, R. E., Giuliano, G., et al. (2008). Potential impacts of climate change on U.S. transportation. Available at: https://onlinepubs.trb.org/onlinepubs/sr/sr290.pdf
Seneviratne, S., Nicholls, N., Easterling, D., Goodess, C., Kanae, S., Kossin, J., et al. (2012). “Changes in climate extremes and their impacts on the natural physical environment” in Managing the risks of extreme events and disasters to advance climate change adaptation. A Special Report of Working Groups I and II of the Intergovernmental Panel on Climate Change (IPCC). eds. C. B. Field, V. Barros, T. F. Stocker, D. Qin, D. J. Dokken, and K. L. Ebi, et al. (Cambridge, UK, and New York, NY, USA: Cambridge University Press), 109–230.
Shepherd, T. G. (2019). Storyline approach to the construction of regional climate change information. Proc. R. Soc. A 475:20190013. doi: 10.1098/rspa.2019.0013
Shepherd, T. G., Boyd, E., Calel, R. A., Chapman, S. C., Dessai, S., Dima-West, I. M., et al. (2018). Storylines: an alternative approach to representing uncertainty in physical aspects of climate change. Clim. Chang. 151, 555–571. doi: 10.1007/s10584-018-2317-9
Sillmann, J., Shepherd, T. G., van den Hurk, B., Hazeleger, W., Martius, O., Slingo, J., et al. (2021). Event-based storylines to address climate risk. Earth’s Future 9, e2020EF001783. doi: 10.1029/2020EF001783
Stevens, B., Giorgetta, M., Esch, M., Mauritsen, T., Crueger, T., Rast, S., et al. (2013). Atmospheric component of the MPI-M earth system model: ECHAM6. J. Adv. Model. Earth Syst. 5, 146–172. doi: 10.1002/jame.20015
Taylor, K. E., Stouffer, R. J., and Meehl, G. A. (2012). An overview of CMIP5 and the experiment design. Bull. Am. Meteorol. Soc. 93, 485–498. doi: 10.1175/BAMS-D-11-00094.1
Ullrich, P. A., and Zarzycki, C. M. (2017). Tempest extremes: a framework for scale-insensitive pointwise feature tracking on unstructured grids. Geosci. Model Dev. 10, 1069–1090. doi: 10.5194/gmd-10-1069-2017
USDA (2024). Cropland CROS. Available at: https://croplandcros.scinet.usda.gov/
USGS (2024). The National map Viewer. Available at: https://www.usgs.gov/tools/national-map-viewer
Yuan, X., Wang, Y., Ji, P., Wu, P., Sheffield, J., and Otkin, J. A. (2023). A global transition to flash droughts under climate change. Science 380, 187–191. doi: 10.1126/science.abn6301
Zarzycki, C. M., and Ullrich, P. A. (2017). Assessing sensitivities in algorithmic detection of tropical cyclones in climate data. Geophys. Res. Lett. 44, 1141–1149. doi: 10.1002/2016GL071606
Zeng, F., Li, K., Li, X., and Tollner, E. W. (2022). Impact of planning horizon on water distribution network design. Water Supply 22, 2863–2873. doi: 10.2166/ws.2021.431
Keywords: crop heat stress, drought, object-oriented analysis, compound events, climate storylines
Citation: Fisel BJ, Garbers SJ, Haar D, Zoerner MM and Gutowski WJ Jr (2024) Object-oriented analysis as a foundation for building climate storylines of compounding short-term drought and crop heat stress. Front. Clim. 6:1357391. doi: 10.3389/fclim.2024.1357391
Edited by:
Xiang Gao, Massachusetts Institute of Technology, United StatesReviewed by:
Bart Van Den Hurk, Deltares, NetherlandsAntonio Sanchez Benitez, Alfred Wegener Institute Helmholtz Centre for Polar and Marine Research (AWI), Germany
Copyright © 2024 Fisel, Garbers, Haar, Zoerner and Gutowski. This is an open-access article distributed under the terms of the Creative Commons Attribution License (CC BY). The use, distribution or reproduction in other forums is permitted, provided the original author(s) and the copyright owner(s) are credited and that the original publication in this journal is cited, in accordance with accepted academic practice. No use, distribution or reproduction is permitted which does not comply with these terms.
*Correspondence: W. J. Gutowski Jr., Z3V0b3dza2lAaWFzdGF0ZS5lZHU=