 Simon Lotz
 Thomas D. Bucheli2
 Hans-Peter Schmidt
 Nikolas Hagemann
95% of researchers rate our articles as excellent or good
Learn more about the work of our research integrity team to safeguard the quality of each article we publish.
Find out more
ORIGINAL RESEARCH article
Front. Clim. , 29 July 2024
Sec. Carbon Dioxide Removal
Volume 6 - 2024 | https://doi.org/10.3389/fclim.2024.1344524
This article is part of the Research Topic Quantifying Carbon Removal by Negative Emissions Technologies View all 11 articles
Introduction: Soil organic carbon (SOC) content can vary significantly across a given plot. Therefore, a representative sampling is a prerequisite to obtain meaningful results from analysis and of utter importance when SOC quantification is used to quantify (temporary) carbon dioxide removal (CDR). However, certain management practices aiming to increase SOC further increase the level of heterogeneity and may challenge representative sampling schemes. This includes concentrated root-zone application of biochar, which immediately increases SOC with the input of biochar-C and may promote the local enrichment of non-biochar SOC over time.
Methods: Here, we used numerical modelling to quantify the number of single sampling points (soil cores) needed to achieve a representative sample of biochar-C and total SOC on a plot after application of biochar in rows, e.g., for growing vegetables, or in the circumference of trees in agroforestry systems.
Results: After row application of 5 t ha−1 biochar in soil with rather low SOC content (26 t ha−1), 140 soil cores (per 0.25 ha plot) where necessary to achieve representative sampling of C-stocks (±5% error) in 90% of the repeated sampling simulation cases. Compared to realistic and cost-effective soil sampling scenarios in agronomic practice, we conclude that concentrated root zone application of biochar makes representative sampling for quantification of SOC in soils with low baseline C-stocks virtually impossible.
Discussion: This finding calls into question the soil-sampling and SOC-analysis-based (“result-based”) monitoring of SOC as a (temporary) CDR when biochar might have been applied. Considering the rapid scaling of biochar production and use in agriculture, this is a considerable challenge for SOC certification. Instead, action-based incentives, rewarding farmers for carrying out specific practices, could be applied to promote carbon farming practices.
The build-up of soil organic carbon (SOC) is a natural way of carbon dioxide removal (CDR) from the atmosphere, which has gained recognition not least due to the “4 per 1,000” initiative that was launched as a contribution to achieve the Paris Agreement (Chambers et al., 2016; Lal, 2016; Minasny et al., 2017). Even though the dramatic reduction of greenhouse gas emissions remains a top priority and is a basic prerequisite for mitigating global warming to 2°C, CDR is additionally needed to achieve the goals defined in Paris (UNFCCC, 2015). Given the large gap between the need for CDR and current efforts to implement such measures and technologies (Smith et al., 2023), all available approaches to CDR must be implemented as widely and rapidly as possible, with priority given to those measures that also generate co-benefits for the environment and synergies to foster agricultural productivity (Smith et al., 2019), such as the build-up of SOC. This can be achieved through the implementation of carbon farming, which describes the management of carbon pools at farm level with the aim to remove carbon (in form of CO2) from the atmosphere and store it in the soil and living biomass (Nath et al., 2015; Radley et al., 2021; Nogués et al., 2023). Carbon farming practices include peatland restoration, integration of trees on farm land and enhancement of organic carbon in soil, via reduced tillage, use of cover crops, and other methods (McDonald et al., 2021; Dupla et al., 2022). The use of biochar, i.e., the solid product of heating biomass in the partial or total absence of molecular oxygen to 400–900°C (pyrolysis, Hagemann et al., 2018), as a soil amendment is another promising approach for carbon farming. Chemically speaking, biochar is a complex mixture of carbonaceous compounds. Its composition and with that, both, its characteristics as well as recalcitrance depend on feedstock selection and pyrolysis conditions (Keiluweit et al., 2010). It contains aliphatic, small aromatic, and heteroaromatic carbon species that degrade in soil over years to decades (Hilscher and Knicker, 2011; Rombolà et al., 2016) as well as stable polycyclic aromatic carbon (Howell et al., 2022). The latter explains the millennial persistence of biochar as it is was shown also for natural pyrogenic carbon (Wang et al., 2016; Bowring et al., 2022), which is acknowledged by Carbon sink certification schemes that quantify the amount of carbons sequestered over time by biochar (EBC, 2023). Thus, biochar production and non-oxidative application is, therefore, also considered a CDR technology on its own and referred to as pyrogenic carbon capture and storage (PyCCS). Examples show that biochar can further foster build-up of SOC. Six years after application, SOC content in biochar amended soil increased by twice the amount of biochar carbon, while there was little to no change in SOC in non-amended control plots under otherwise identical management (Blanco-Canqui et al., 2020). Moreover, biochar use in soil is associated with a broad range of co-benefits like reduced nutrient leaching and reduced uptake of potentially toxic trace elements by plants (Schmidt et al., 2021). However, biochar in general is a rather expensive agricultural input that needs to provide direct agronomic benefit for the farmer to justify its costs. Yield increases have been demonstrated at the level of a global meta-analysis, when biochar is used in combination with fertilizer for highly weathered or weakly developed soils (Melo et al., 2022). An earlier meta-analysis investigating biochar applications, i.e., pure biochar and biochar-fertilizer combinations, found yield increases except for trials under climate with mean annual temperature of less than 10°C (Jeffery et al., 2017). However, agronomic impact of biochar application strongly depends on the selection of biochar, pre-treatment of biochar and the mode of application (Hagemann et al., 2018; Joseph et al., 2021; Schmidt et al., 2021).
Root-zone application of biochar, also referred to as “concentrated root-zone,” “trench,” “hot-spot” or “planting pit” application of biochar (Figure 1), was shown to be a promising approach to optimize agronomic results of biochar application, especially if biochar is applied as biochar-based fertilizer (Martinsen et al., 2014; Schmidt et al., 2015, 2017; Joseph et al., 2020). Root-zone application has shown to increase yields, i.e., of maize in Zambia (Martinsen et al., 2014), pumpkin, cabbage and melon in Nepal (Schmidt et al., 2015, 2017) and Calliandra calothyrsus in Indonesia (Kosasih et al., 2022). Also, it is recommended for improving survival rates of tree seedlings during the establishment phase of agroforestry systems (Nair et al., 2017).
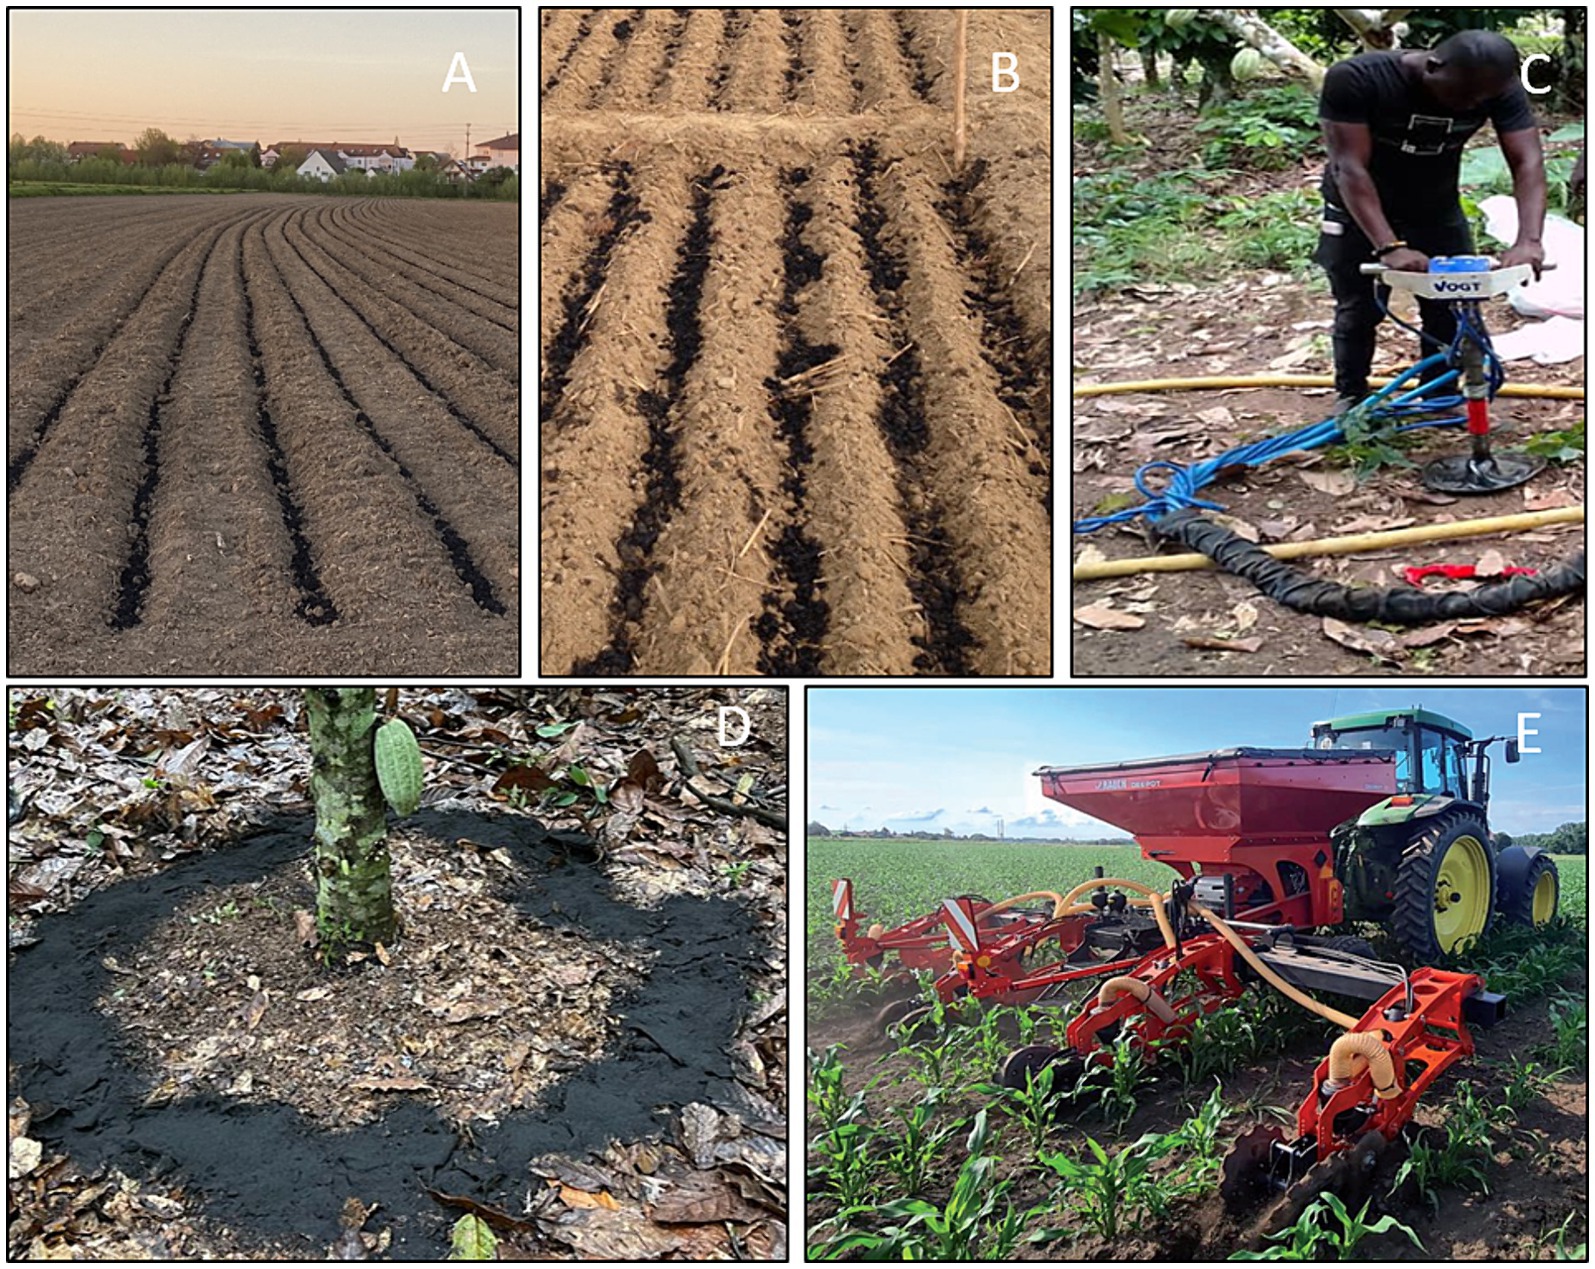
Figure 1. Options for concentrated root-zone application of biochar. (A) Row application prior to sowing maize with inter-row distance of 75 cm (manual application, scientific field trial, Kehl, Germany 2021). (B) Row application in vegetable farming, field trial, Nepal 2016 (source: Schmidt et al., 2017). (C) Biochar injection in cocoa plantation (commercial field trial, Ghana, 2021, source: JMzD). (D) Tree circumference application, farmer practice (source: Draper, 2018). (E) DeePot, commercially available machinery developed for nitrogen fertilizer injection (CULTAN), also suitable for biochar application (Rauch Landmaschinenfabrik GmbH, Rheinmünster, Germany, with permission) that is also suitable for concentrated root-zone application of granulated biochar.
For widespread implementation of carbon farming, financial incentives must be created for farmers. Due to the statistical relation between individual measures and the build-up of SOC (Dupla et al., 2022), this can be done by remunerating the implementation of such measures (action-based schemes also referred to as “pay-for-practice”). More common are so-called result-based schemes, which mostly rely on regular (usually every 1–5 years) sampling and analysis of carbon content of the plots under certification, which allows the calculation and certification of actual carbon storage (Wiesmeier et al., 2020). This practice is also referred to as “ton-for-ton accounting.” Present schemes mostly only remunerate the increase of SOC, i.e., the delta between two measurements (Paul et al., 2023). To this end, it needs to be considered that the CDR delivered by pyrolysis of biomass, i.e., biochar production and its subsequent non-oxidative application, e.g., in soil, is usually remunerated in separate certification schemes that are centered around biochar production, the tracking of this product, and geo-localized registration of the biochar application (Etter et al., 2021; Puro.earth, 2022; EBC, 2023; Hagemann, 2024; Rathnayake et al., 2024). As biochar-C and non-biochar SOC can hardly be distinguished by analysis, the registered biochar-C on a specific plot must be deducted arithmetically from empirically quantified SOC to calculate the amount of certifiable SOC (Rathnayake et al., 2024).
Nonetheless, representative sampling is a prerequisite for a correct SOC quantification, as it is for any meaningful determination of target analyte quantities per area (Gy, 2004; Yu and Flury, 2021). However, the spatial distribution of SOC is very heterogenous. Large deviation in SOC content are found on the field scale, with considerable variations occurring on the centimeter to millimeter scale (Elyeznasni et al., 2012; Peth et al., 2014). Small scale variability is caused by soil characteristics such as soil texture, drainage, rock contents and bulk density, but also by plant soil interactions, other biotic processes, macro- and microaggregation (Six et al., 2002; Conant et al., 2011). Agricultural practices being encouraged to foster C sequestration in agricultural soils, such as reduced tillage, mulching, and biochar application are most likely to additionally/further impact SOC heterogeneously across the field (Conant et al., 2011). In this context, biochar root-zone application may have extreme effects.
For representative sampling, an extensive number of soil samples is required (Conen et al., 2003; Jandl et al., 2014). To develop a common, accurate and yet cost effective method of SOC change determination, the “Area-Frame Randomized Soil Sampling” (AFRS sampling) method has been developed and tested (Stolbovoy et al., 2005, 2007). This lead to a second, updated version of the “Soil sampling protocol to certify the changes of organic carbon stocks in mineral soils of the European Union” (Stolbovoy et al., 2007), which defines a best practice soil sampling approach to determine SOC changes in mineral soils in the EU. Within this framework a modified random soil sampling strategy was developed by defining a 10 × 10 grid and overlaying onto the plot. The grid cell size is defined as a tenth of the longest axis of the plot, thus dividing any plot in (up to) 100 square subplots of equal size, which are referred to as sampling sites. Depending on the plot size three to six grid cells are selected at random as sampling sites, for small plots (< 5 ha) the authors recommend to randomly select three sites. Within each of these sampling sites, 25 sampling points are allocated, by dividing the grid cell into another even grid, to assure a consistent distance between sampling points (Stolbovoy et al., 2007). At each sampling point a soil sample is taken and the 25 samples per grid cell are combined to a composite sample, which is subsequently analyzed; thus, a total of three to six samples are analyzed per plot. This protocol can be applied for croplands, pastures and forests and has been widely used and tested (Stolbovoy et al., 2007). However, to the best of our knowledge, neither this nor other protocols or practices have been tested to achieve a representative sample of a plot after root-zone application of biochar. Yu and Flury (2021) used numerical modelling to compare different sampling strategies for defined occurrences of a target analyze, in their case microplastic, in agroecosystems and identified optimized sampling approaches for specific scenarios. Based on their method, we numerically generated plots with biochar applied in rows or tree circumference, modelled soil sampling and calculated the resulting biochar-C and SOC (= native, non-biochar SOC + biochar-C) contents based on the sampling strategy applied. We evaluated two different soil sampling approaches at different densities (samples per area) regarding their performance to enable correct SOC quantification after biochar root zone application in mineral soils with low and high SOC content. Based on these results, we propose an alternative cost-effective and accurate sampling approach for cases of biochar row application with the prerequisite of identifying the exact management practice of the biochar application.
Numerical modelling was performed in R Core Team (2021) and RStudio Team (2020) by adapting the script developed by Yu and Flury (2021). In there, the three-dimensional soil matrix is imagined as two-dimensional space, biochar particles were aligned in clusters representing row or tree circumference application on a 50 × 50 m field (0.25 ha). Each particle had a specific location and expansion (surface area) on the field. Biochar particles were allocated to the clusters, e.g., a row, and located within these following a random uniform distribution (Figure 2). Soil cores (diameter = 80 mm) were allocated numerically to represent the three sampling approaches as detailed below (chapter 2.3).
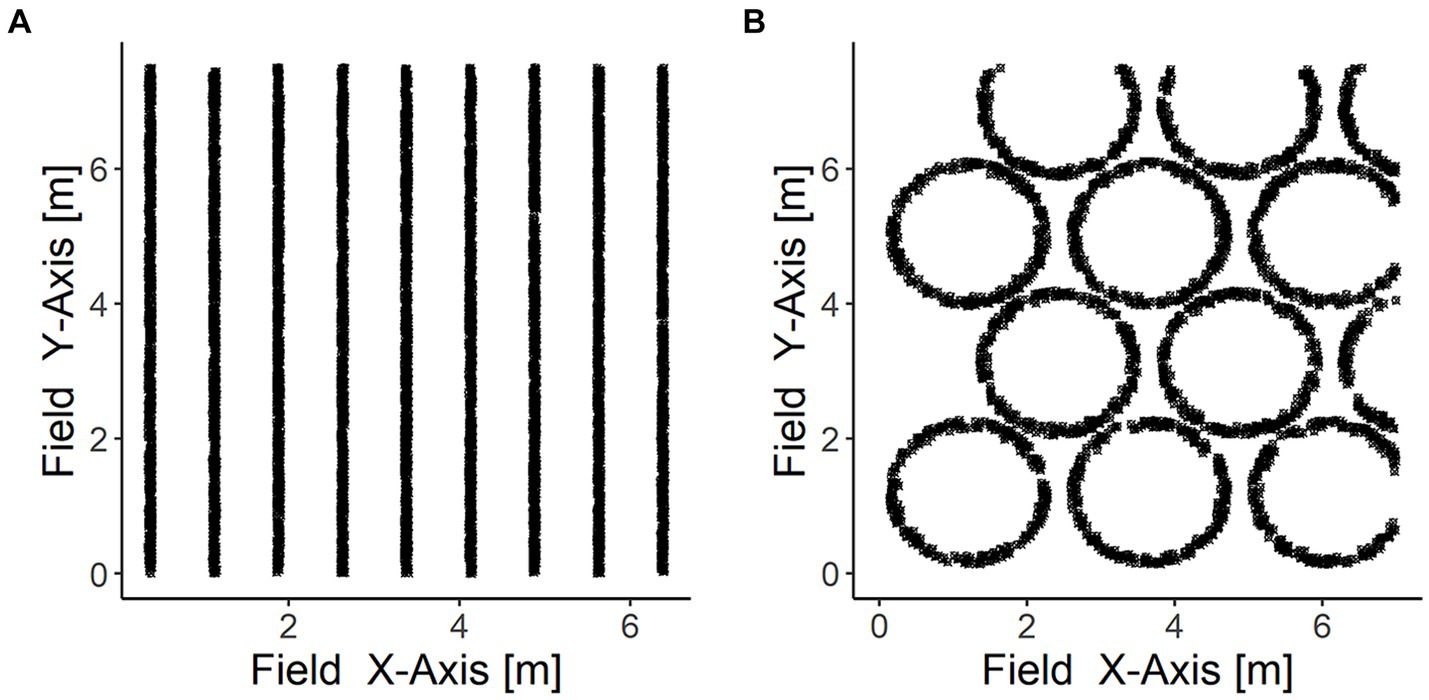
Figure 2. Illustration of a section of the field in the model. Biochar row application (A) and tree circumference application (B). Black dots represent biochar particles. Biochar particles are not drawn up to scale.
To assess whether a biochar particle is numerically sampled, the coordinates of the soil core expansion and the biochar particle were compared, if the center of the biochar particle was within the boundaries of the soil core, the particle was regarded as within the sample. For each soil core, the number (n) of individual biochar particles (i = [1, n]) and the sum of their surface areas ( ) was calculated, considering the radius (ri) of the individual biochar particle. The mean biochar concentration for a random sequence of a defined number of cores was calculated. The order of soil cores in the sequence was randomized. Each simulation was carried out 100 times. It was assessed whether the mean biochar concentration of the sequence of soil cores represented the biochar concentration of the field (± 5% error). Within the 2D field model, biochar concentrations are calculated as surface area (biochar) per surface area of the field. The true biochar concentration of the field is given by the sum of the areas of all biochar particles ( in m2) divided by the field surface area (2,500 m2). Within the scope of this paper, we consider representative sampling was achieved if the mean SOC concentration, defined as the sum of the biochar-C concentration and the native SOC concentration (see 2.4) of the soil samples (sequence of soil cores) was within a margin of ±5% of the true SOC concentration of the field (sum of biochar-C and native SOC concentration).
The biochar application rate was 5 t ha−1 for all simulations. Biochar particles were assumed to be of spherical shape with diameters between 2 mm to 4 mm (following a uniform distribution), with a porosity (ϕ) of 0.4 m3 m−3 (Hagemann et al., 2020) and a true biochar density (ρT) of 2 t m−3 (Brewer et al., 2014). Total volume of biochar per granule without porosity ( )) and its respective mass ( ) was calculated. Further the number of biochar particles and the surface area of the biochar circles representing the biochar application rate in a two-dimensional space was calculated. In total the application rate was represented by 73.7 million biochar particles with a mean surface area of 7.33 mm2 per particle on the 50 × 50 m field. In total, in this 2D projection, biochar covered 166.67 m2 of the 2,500 m2 (0.25 ha) plot (6.67%).
Biochar application was either modelled as row application or tree circumference application (Figure 2). For row application, the row width was 5 cm with a row distance of 75 cm between the centers of the rows, unless specified otherwise. For tree circumference application, a planting density of 1,667 trees ha−1 following a diamond (quincunx) planting pattern was assumed. For circumference application, biochar was applied in a 15 cm wide circle around the tree (radius = 1 m, i.e., biochar was applied within 0.925–1.075 m distance to the center of the tree). As controls, models were run both without biochar as well as assuming a random uniform (even) biochar application over the whole plot.
Three sampling strategies were modelled:
A. Random Sampling: Soil cores were distributed randomly over the field, a minimum distance of 3 m between soil cores was implemented by generating a multitude of randomly distributed soil cores over the field and excluding all cores within a 3-meter distance of another soil core in the following step. This procedure led to a sampling density of 100 soil cores per 2,500 m2 plot in all simulations; a random selection of those cores was used to calculate lower sampling densities.
B. AFRS sampling: Soil cores were allocated following the AFRS sampling strategy proposed by Stolbovoy et al. (2007), which they characterize as a modified random soil sampling strategy. Here we implemented this guideline and numerically took one to 10 composite samples (comprising of 25 soil subsamples each) per 2,500 m2 plot.
C. Adapted sampling (for row application only): Considering the spatial pattern of biochar row application, 10 soil cores were distributed along a 75 cm wide transect along the length of 50 m of the plot, encompassing exactly one biochar row (5 cm), soil cores were distributed from the left boundary of the transect to the right boundary of the transect, covering the whole width of the transect. Along the length of the transect (50 m), a distance of 3 meters between soil cores was maintained (cf. SI, Supplementary Figure S1).
Biochar carbon content (CBC) was assumed to be 0.7 kg kg−1 and biochar carbon per soil core (CBC,core) was calculated based on the number and surface area of the particles. Soil characteristics were assumed as detailed in Table 1. For non-biochar SOC, each core contained a SOC of SOCsoil1 = 6.1 g kg−1 and SOCsoil2 = 22.2 g kg−1 representing a low and high C-stocks, respectively, assuming a perfectly homogenous distribution of SOC. To account for natural heterogeneity, non-biochar SOC (SOCstock) content was calculated as follows:
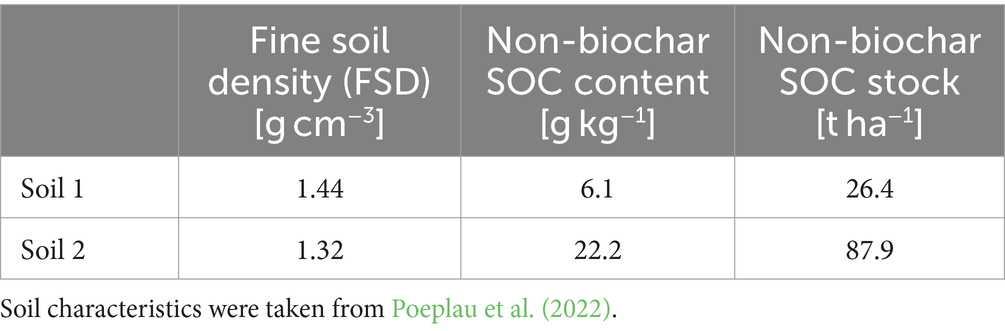
Table 1. Soil characteristics in 0–30 cm of contrasting soil types selected for this study.
Here SOChom, is the respective (homogenous) non-biochar SOC content of each soil (Table 1), CVSOC, the normally distributed coefficient of variation (mean = 0.088, sd = 0.048) of the SOC-content, FSDsoil, the respective fine soil density (Table 1) and CVFSD the normally distributed coefficient of variation (mean = 0.065, sd = 0.015) of the FSD. Soil characteristics and variation coefficients were taken from an assessment of potential resampling errors of SOC in German croplands by Poeplau et al. (2022).
Correct sampling, division and preparation is the basic prerequisite for a meaningful analysis, since analytes in the sample are always subject to a certain degree of heterogeneity (Gy, 2004). Here, we first test our model (1) without biochar amendment and (2) with spatially uniform biochar application. Then we look at the sampling of fields after biochar application in rows and in tree circumference, assessing overall SOC, i.e., native SOC plus biochar-C.
According to our model, the number of soil cores required for a representative sampling of native SOC-stocks, without biochar amendment (“zero control”), depends on the sampling strategy. Following the random soil sampling strategy, at least 15 soil cores per plot (0.25 ha) were required for a representative sampling in at least 90% of repeated sampling simulation cases, for both soil types. To achieve a representative sampling of at least 95 and 100% of simulations, sampling density of 17 and 61 randomly distributed soil cores per plot, respectively, were required (Figures 3A,B).
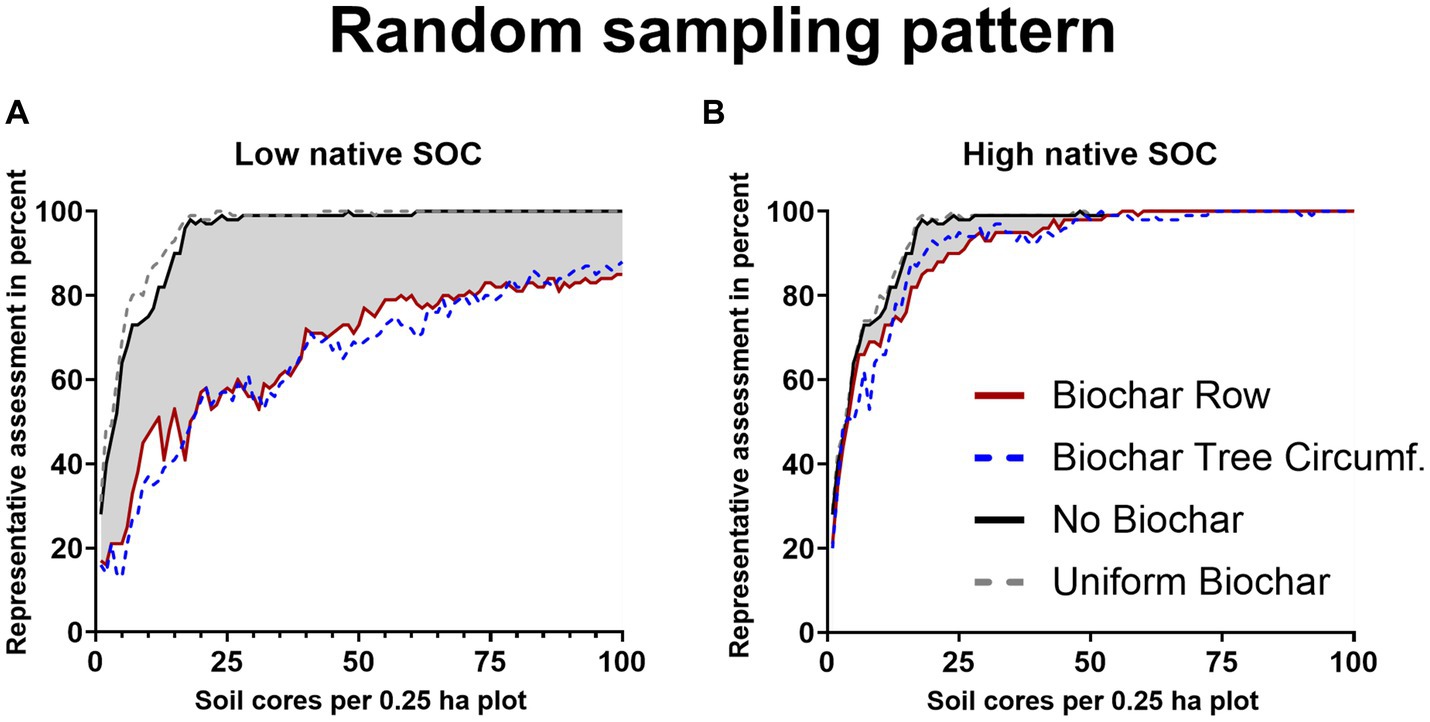
Figure 3. Percentage of representative SOC concentration assessment (true SOC-content ±5% error margin) as a function of sampling density for randomly distributed soil in soil with low native background SOC 26 t ha−1 in 0–30 cm, soil 1, (A) or with high native background SOC 88 t ha−1 in 0–30 cm, soil 2, (B). Assessed are native, background SOC (black), based on data from Poeplau et al. (2022), native SOC + biochar-C after homogenous biochar application (grey-dotted), biochar row application (red) and biochar tree circumference application (blue-dotted), each with 5 t biochar ha−1. The decrease in representative assessments induced by biochar is highlighted in grey. The number of randomly distributed soil cores per plot (0 to 100) represented the sampling density.
Following the AFRS sampling, one single composite sample (comprising 25 soil cores) per 0.25 ha led to a representative SOC-stock assessment in 99% of repeated sampling simulation cases for both soil types (Figures 4A,B). Noteworthy, we calculated the native SOC-stock based on Eq. (1) for each soil cores independently, spatial factors were not considered, thus, factors such as expected lower heterogeneity between cores spatially close to each other were neglected. These results were basically defined by the statistical data, particularly the coefficients of variation, we adopted from Poeplau et al. (2022). Similar coefficients of variation were also described by other authors (Saby et al., 2008; Conant et al., 2011) for agricultural soils elsewhere, underlining that the data utilized in the model represents the SOC heterogeneity of many agricultural sites adequately.
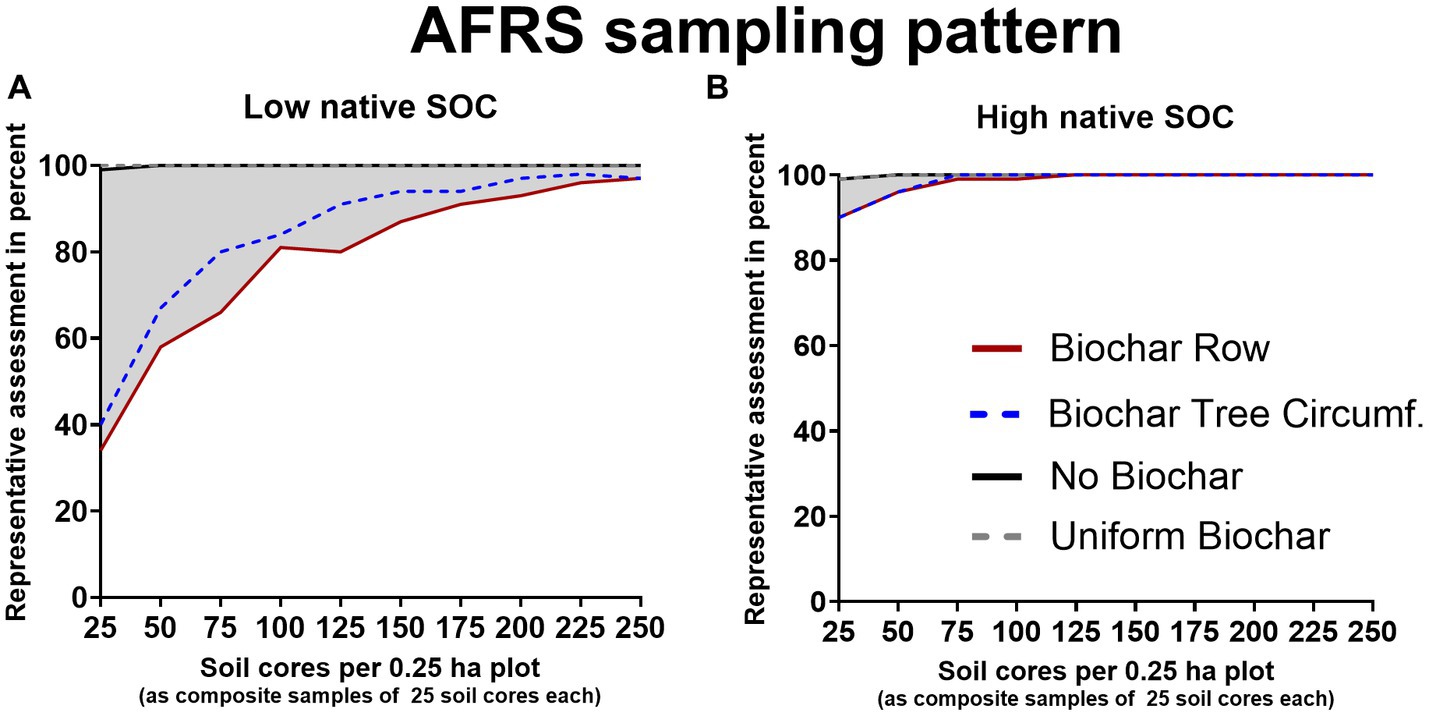
Figure 4. Percentage of representative SOC concentration assessment (true SOC-content ±5% error margin) as a function of sampling density for the “Area-Frame Randomized Soil Sampling” AFRS sampling in soil with low native background SOC 26 t ha−1 in 0–30 cm, soil 1, (A) or with high native background SOC 88 t ha−1 in 0–30 cm, soil 2, (B). Assessed are native, background SOC (black), based on data from Poeplau et al. (2022), native SOC + biochar-C after homogenous biochar application (grey-dotted), biochar row application (red) and biochar tree circumference application (blue-dotted), each with 5 t biochar ha−1. The decrease in representative assessments induced by biochar is highlighted in grey. The soil cores were taken as composite samples (each comprises 25 soil cores), thus a total of 10 composite samples (250 individual soil cores) were taken per 0.25 ha plot.
Uniformly applied biochar (following a uniform distribution) of 5 t ha−1 (“positive control”) reduced the amount of soil cores required for a representative sampling in at least 90% of the repeated sampling simulations to 13 for soil 1 (low native SOC), while it remained at 15 soil cores for soil 2 (the high native SOC soil type) for the random sampling. The reduction of the threshold sample size for a representative SOC assessment by uniformly applied biochar in the soil with low non-biochar SOC-stocks (soil 1) was the result of the added biochar-C (3.5 t ha−1) accounting for 11.7% of the total SOC (native SOC+ biochar-C). As this (substantial) share was distributed uniformly, it de facto facilitated representative sampling in the model. Regarding soil 2, the evenly applied biochar did not affect the number of randomly distributed soil cores, as the biochar-C added (3.5 t ha−1) only represented 3.8% of total SOC.
Taking the soil samples numerically based on the AFRS sampling method, one single composite sample was sufficient to represent the SOC-stock after uniform application of biochar in 99 and 100% of repeated sampling simulation cases for low and high baseline SOC-stocks, respectively.
Soil sampling guidelines commonly propose to first calculate a mean and standard deviation based on few samples randomly drawn across the plot. Based on these and the difference in means that the sampling aims to detect, the minimum number of required samples could be calculated (Aynekulu et al., 2011; FAO, 2020). Following this approach, and taking ten random samples before the biochar application, we found a standard deviation of 4.7 t ha−1 for soil 1 with a native SOC-stock 26 t ha−1 and a standard deviation of 15.8 t ha−1 for soil 2, with a native SOC-stock of 88 t ha−1 (Table 1), corresponding to a relative standard deviation of 18% in both cases. Aiming to detect the 3.5 t ha−1 of biochar-C applied this would lead to recommendations of 30 and 320 samples, respectively (considering a power of 0.8, cf. SI, section 2). However, native SOC-content heterogeneity can be considerably higher than assumed here, for example Heim et al. (2009) showed that sampling densities of 27 composite samples (of 25 cores each) were required to detect a variation in SOC of 2.6 t per hectare (equaling to about 3.9% of SOC-stocks).
Considering a baseline SOC-stock of 26 t ha−1 (soil 1) and 88 t ha−1 (soil 2), random sampling with a sampling density of 100 cores per plot after biochar row application led to a representative sampling of SOC-stocks (± 5% error) in 85 and 100%, respectively (Figures 3A,B). For the soil 2, the assumed biochar-C application (3.5 t ha−1) accounted for 3.8% of SOC and it was smaller than the tolerated error margin of 5% (4.4 t ha−1), thus, the biochar induced heterogeneity was consistently low in this soil (Table 2). In contrary, for the scenario with baseline soil 1 the biochar-C amendment (3.5 t ha−1) accounted for 11.7% of SOC, hence the spatially discrete distribution of this share hampered representative sampling severely. Baseline native SOC-stock and relative biochar-C application rate are hence pivotal factors regarding the heterogenous biochar application’s impact on representative sampling. Here, we only quantify the implications for two contrasting SOC-stocks of agricultural sites in Germany. However, the SOC-contents given for soil 1 (6.1 g kg−1) and soil 2 (22.2 g kg−1) may represent other soils suitable for biochar application elsewhere. Martinsen et al. (2014) report successful biochar root-zone application for soils with SOC-contents (5.4 to 6.2 g kg−1) similar to “soil 1” in Zambia. Yield increases for concentrated biochar root-zone application on Nepalese soils reported by Schmidt et al. (2015) and Schmidt et al. (2017) took place on soils with a wide range of SOC- from 15 to 54 g kg−1), with many sites showing SOC-contents similar to “soil 2.”
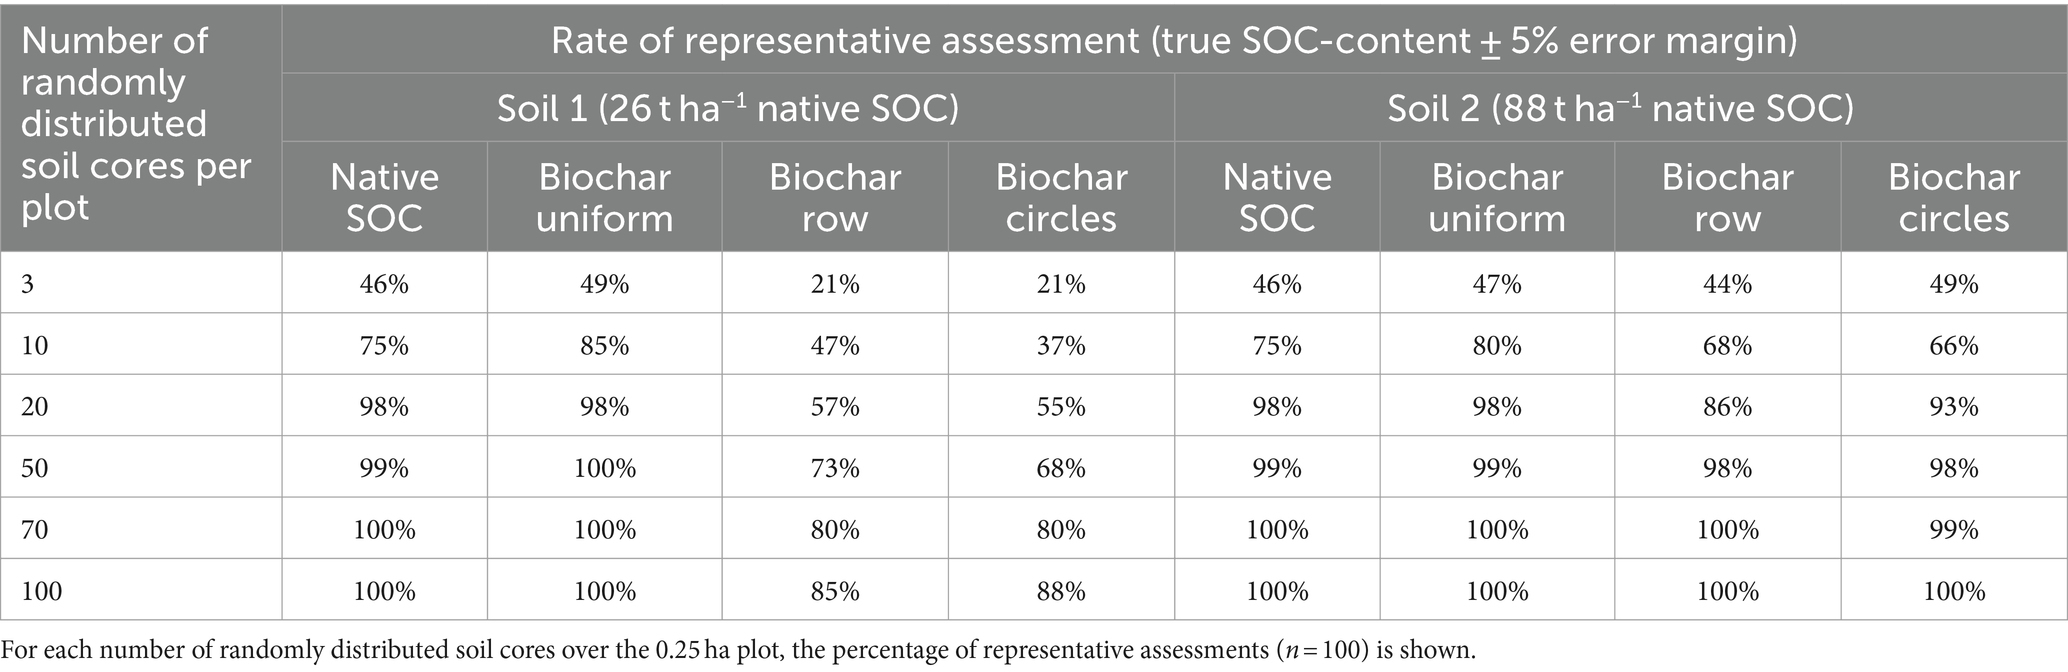
Table 2. Comparison of two distinct patterns of spatially heterogenous biochar application, biochar row application (Biochar Row) and tree circumference application (Biochar Circles) at application rates of 5 t ha−1 and their effect on biochar induced variability in SOC assessments compared to native SOC-stock without biochar application (Native SOC) and uniform biochar application of 5 t ha−1 (Biochar Uniform) for two soils with contrasting native SOC content.
In general, biochar induced heterogeneity (due to heterogenous biochar application) is larger if biochar accounts for a high share of total SOC, leading to high sampling densities required for representative assessments.
High sampling densities of 100 soil cores per 2,500 m2 may be used in research, e.g., in long-term field experiments (Schrumpf et al., 2011). For lower, more economical sampling densities, e.g., 40 randomly distributed soil cores per hectare (10 soil cores per plot), 47 and 68% of repeated sampling simulation cases were representative for the low and the high baseline SOC, respectively (Table 2). For native SOC alone the same sampling density led to representative assessments of SOC in 75% of simulations (Table 2).
To achieve representative SOC sampling in at least 90% of repeated sampling simulation cases, a density of 100 randomly distributed soil cores was not sufficient for soil 1 (Table 2); at least 140 soil cores per plot were required. Thus, the number of required randomly taken samples increased by a factor of 9.3, compared to the model for the native SOC (from 15 to 140; Figure 3A). For soil 2 (Figure 3B), a sampling density of more than 23 randomly distributed soil cores per plot was sufficient for this purpose. The variability induced by biochar row application was bigger for low native SOC, as the biochar-C amendment represented a higher share of total SOC. For soil 2, where the biochar-C amendment represents a small fraction of total SOC (3.8%), soil sampling density had to be increased by 53% (from 15 to 23 soil cores per plot) to achieve representative results in 90% of repeated sampling simulations (Figures 3A,B).
To achieve representative sampling in 100% of repeated sampling simulation cases, the minimum distance of 3 m between soil sampling points had to be abandoned, as this would have limited the number of soil cores to a theoretical maximum of 256 soil cores per plot. For soil 1 and soil 2, at least 405 and 152 cores per plot (1,620 and 608 ha−1), respectively, had to be numerically assessed to quantify the SOC-stock in 100% of simulations.
Ten composite samples distributed according to the AFRS sampling method, i.e., 250 soil cores, reflected the SOC stock after biochar row application correctly (5% error margin) in 97% of all cases for soil 1. The same SOC-stock, achieved by uniform biochar application could be representatively quantified with a single composite sample in 99% of simulations (positive control). Hence, for a soil with a low baseline SOC-content, the measuring effort might need to be increased tenfold, to gain equally representative results after concentrated, i.e., spatially discrete biochar applications (Figure 4A). For soils with high baseline SOC-contents, the number of composites samples required to be taken, following the AFRS sampling scheme with post biochar row application was tripled to achieve representative SOC quantification in 99% of simulations (Figure 4B). To assess the SOC content representatively in 90% of repeated sampling simulations, 7 composite samples (175 soil cores) and one composite sample (25 soil cores) were sufficient for soil 1 and soil 2, respectively.
Especially for SOC depleted soils, or soils with naturally low SOC contents, biochar C amendments can contribute significantly to the overall carbon stock and the biochar’s heterogenous distribution hampers representative sampling of overall SOC-stocks. It must be noted that such soils are very relevant in this context, as the use of biochar in marginal soils is particularly interesting from an agronomic point of view (Melo et al., 2022).
Comparing biochar row application and biochar tree circumference application, we found that the type of spatially heterogenous biochar application does not impact the biochar induced variability significantly (Table 2, Figures 3, 4). Similar to row application, the induced variability was higher for low native SOC-stock and minimal to absent in the soil with high native SOC-stock (Table 2).
We tested the effect of different distances between rows of biochar application (0.5 m, 0.75, 1 m, 1.5 m), which did not have a significant effect (based on Kruskal-Wallis test) on the assessed SOC concentrations (cf. SI, Supplementary Figure S4). A tendency towards more accurate SOC estimations with smaller row distances could be observed. The main factor for this effect is most probably that larger row distances lead to higher concentration of biochar particles in each row (more heterogenous distribution) as long as the per hectare application rate is kept constant. Thus, when biochar particles are present at a higher concentration on a smaller area within the plot, the increased heterogeneity further impedes representative sampling.
Furthermore, we tested the effect of biochar application being numerically carried out as multiple smaller biochar applications with conventional agricultural equipment (non-precision farming). This led effectively to a larger area covered with lower concentrations of biochar as we assumed biochar in the model to be applied with a random scatter (0 to 10 cm). Therefore, the overall area covered with biochar is larger and hence multiple application facilitated representative sampling (cf. SI, Supplementary Table S1; Supplementary Figure S3). Still, after 5 years of applying 1 t biochar ha−1 yr.−1 in rows, the number of cores in random sampling had to be increased by 260% (from 15 to 54 cores per plot) and by 27% (from 15 to 19 cores per plot) for soil 1 and 2, respectively, to achieve representative SOC quantification in at least 90% of simulations in our model. We understand precision farming, taking advantage of real-time kinematic positioning, could achieve repeated biochar root-zone application with accuracy at the cm-scale, but this technology is still not widespread. Also, non-accuracy in repeated root-zone application will create more soil volume that is in touch with biochar and thus might be beneficial for overall soil improvement in the long-term, however, we are not aware of any field study looking into this question.
Within the models we considered biochar particles to remain at the location of original application. Potential vertical mobility of biochar particles (Schiedung et al., 2020) through leaching or biological activity is captured indirectly as vertical mobility does not alter the results of the 2D model. Potential lateral mobility of biochar particles through biological activity, erosion and soil tilling were neglected here, as the extent of such dispersion could not be quantified reliably. Also, we assume the tillage is commonly reduced to, e.g., the upper 10 cm, while biochar for root-zone application might be placed below this zone.
To improve the sampling approach, i.e., to reduce the number of individual samples needed to achieve representative sampling, we tested if knowledge on the mode of biochar application could help to optimize the sampling strategy.
When the orientation and spacing of biochar row application is known, we suggest the following approach: In the scenario with 75 cm interrow space, aligning 10 soil cores (diameter = 80 mm) as described in 2.3. With 10 soil cores per plot distributed in such manner, the SOC-stock can be assessed representatively in 82 and 78% of repeated sampling simulation cases after biochar row application for soils with low and high native SOC-stocks, respectively (Figure 5). In our model the biochar distribution within the rows is uniform along the row (Y-Axis). In the real-world biochar distribution within the row might be less uniform. Furthermore, the native SOC’s heterogeneity was accounted for numerically without accounting for spatial effects (SOC was calculated for each core, irrespective of its location), such as potentially lower heterogeneity with closely aligned cores and higher potentially heterogeneity with larger distances. Selecting multiple rows, instead of a single row might help to account for these effects, that were neglected in the model. While a higher number of soil cores should be considered for unknown biochar patterns, if the biochar application pattern is well-known, a cost-effective highly representative SOC assessment with much lower biochar induced variability, especially in soils with low native SOC-stocks, can be achieved with the adapted soil sampling pattern.
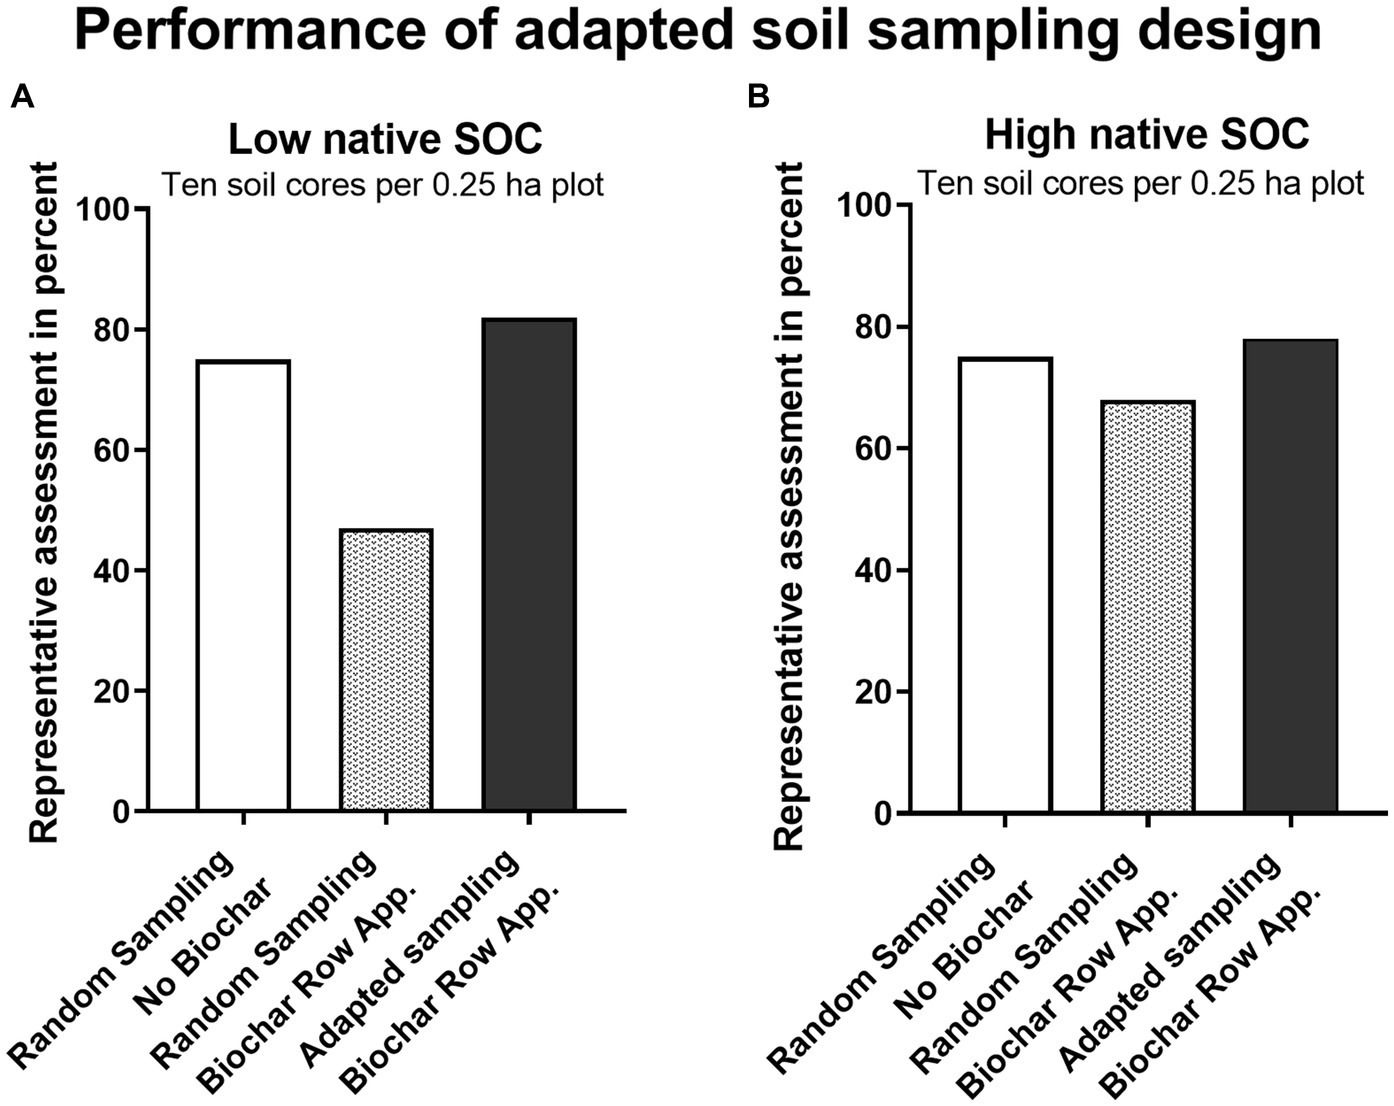
Figure 5. Percentage of representative SOC assessment (true SOC-content ±5% error margin) as a function of sampling density for two sampling strategies, random sampling and adapted sampling and two soil types: low native background SOC, 26 t ha−1 in 0–30 cm (A) and high native background SOC, 88 t ha−1 in 0–30 cm (B). Assessing only native, background SOC (white), based on data from Poeplau et al. (2022) with random sampling and assessing native SOC + biochar-C after biochar row application of 5 t ha−1 with randomly distributed soil cores (grey) and assessing native SOC + biochar-C after biochar row application of 5 t ha−1 with an adapted soil sampling strategy (black), given that the location of the biochar rows is known, with 10 soil cores per plot.
To limit costs and effort of soil sampling without sacrificing accuracy in SOC-stock assessments after heterogenous biochar applications, such as biochar row applications, it is mandatory to precisely record where biochar (row) application was carried out, and which pattern was followed.
Biochar application may lead to positive priming (increased decomposition of non-pyrogenic SOC), though over time it overall may result in negative priming, meaning reduced decomposition and net increase of non-pyrogenic SOC (Ding et al., 2018; Schmidt et al., 2021). Positive priming is the result of increased mineralization due to enhanced microbial activity, e.g., due to biochar supporting microbial metabolisms as electron shuttle and geo-conductor (Kappler et al., 2014; Sun et al., 2017; Pokharel et al., 2020). In turn, this increased activity and accelerated nutrient cycling may increase plant productivity and input of plant derived organic carbon to the soil, e.g., by increased root growth and root exudates (Weng et al., 2017; Xiang et al., 2017). This leads to a higher SOC equilibrium over time, though the scale of biochar induced negative priming is not yet consistently determined (Schmidt et al., 2021), and the overall extent of the microbial response to biochar application and thus the relevance of biochar induced positive and negative priming strongly depend on the environmental factors and biochar properties (Pokharel et al., 2020). For instance Blanco-Canqui et al. (2020) found that 6 years after the application of 7 t biochar per hectare, the total SOC increased (i.e., negative priming) by 14 t ha−1. The biochar carbon led thus to an additional accumulation of 7 t SOC ha−1 from plant derived organic carbon. The effect found by Weng et al. (2017) in an Australian field trial was smaller but still significant. Priming might occur in close proximity to biochar amendments, as, e.g., the microbes need direct interaction with biochar surfaces to achieve electron exchange (Kappler et al., 2014). In contrast, biochar stimulates root growth (Xiang et al., 2017) which is not expected to occur solely within the biochar amended area, but throughout the soil in unknown, but most likely heterogenous patterns. Although any priming effect induced by biochar are beyond the scope of this work, we expect these effects to further complicate an effective representative SOC sampling of biochar amended agricultural soils.
Based on our model, spatially discrete biochar application (e.g., “root-zone application”) increased total SOC heterogeneity and thus made representative sampling more challenging, which is the prerequisite for a meaningful SOC quantification. For soil 1 (SOC-stock: 26 t ha−1) the number of randomly distributed soil cores had to be increased by 833% (from 15 to 140 samples) to achieve representative sampling of SOC after biochar row application in 90% of simulations. For soil 2 (SOC-stock: 88 t ha−1) the number of randomly distributed soil cores was increased by 53% (from 15 to 32 samples) to assess SOC representatively after biochar row application (in 90% of simulations). Following the AFRS sampling, the number of composite samples had to be increased from just one for the baseline SOC scenarios to seven (175 soil cores) for soil 1 to quantify SOC-content representatively in 90% repeated sampling simulation cases, while one composite sample (25 soil cores) was still sufficient for soil 2. This indicates that the proportion of the SOC stock that is heterogeneously distributed in the form of biochar-C has a decisive influence on the probability that a certain number of individual soil cores is sufficient to obtain a representative sample. The lower the non-biochar SOC content and the higher the amount of biochar-C applied, the more individual soil cores are required. The pattern of the biochar application had a comparatively small impact, results for tree circumference application hardly differed from the impact of row application.
The “Soil sampling protocol to certify the changes of organic carbon stocks in mineral soils of the European Union” (Stolbovoy et al., 2007) recommends three composite samples for all plots smaller than 5 hectares, the plots of 0.25 ha numerically modelled here are thus at the lower end of this range. Nevertheless, the sampling density had to be more than doubled (7 composite samples) for soil 1 after biochar application. For soil 2 after biochar application and both soils pre biochar application, one composite sample was sufficient underlining that the native SOC heterogeneity considered here was comparatively low.
The adapted sampling strategy presented could be one feasible option for representative sampling of SOC after discrete biochar application, especially but not exclusively in soils with low native SOC contents. In regard of the arising need to quantify SOC stock changes reliably after heterogenous biochar application for trustworthy CDR certification of SOC built-up, specific soil sampling protocols capable of representative assessments are required. In this case, it would be mandatory to reliably recognize the exact pattern of heterogenous biochar applications.
Carbon farming and PyCCS are complementary and synergistic CDR technologies. However, the combined deployment results in considerable challenges to the monitoring, reporting and verification of negative emission projects, often referred to as “MRV.” The MRV of PyCCS is based on tracking of biochar application and its known carbon content. Thus, the mode of biochar application (spreading vs. concentrated root-zone application) does not impact or endanger the integrity of PyCCS MRV and result-based certification (Hagemann, 2024). Result-based schemes for carbon farming require the quantification of actual SOC stocks and thus mostly rely on sampling and measurement of organic carbon in soil samples. Firstly, this results in the analytical challenge of discriminating (already certified) biochar-carbon and non-biochar SOC, which is discussed in great detail in Rathnayake et al. (2024). Secondly, however, spatially discrete application of biochar results in a dramatic increase in the number of individual samples required for representative sampling. Commonly used soil sampling designs for SOC monitoring, namely random sampling and AFRS sampling, are not suited to provide representative SOC assessments after discrete biochar application with feasible sampling densities. However, representative SOC assessment is mandatory, to enable certification of any CDR occurring through SOC built-up, aside the biochar-C amendments. Otherwise reliable, trustworthy certification of non-biochar-C built-up in the soil after heterogenous biochar application is hardly possible.
This finding call into question the applicability of SOC quantification by sampling and measurements, e.g., in result-based schemes for SOC certification after biochar application. Either spatial sampling schemes need to be developed and tested or alternatively, action-based schemes could be implemented that reward farmers for implementing specific measures or adaptation practices that are known to enhance soil organic carbon storage and sequestration or reducing greenhouse gas emissions from the farmland (Radley et al., 2021). Compared to result-based schemes, the costs for MRV are reduced, as the farm needs to be audited, but additional sampling and analysis are not necessary. Based on long-term SOC monitoring on 120 sites in the south-west of Switzerland, Dupla et al. (2022) identified factors that regionally determined SOC change, including the cover crop and soil tillage intensity. Thus, a farmer could be remunerated / compensated for the effort associated to CDR measures.
Further research in the form of field trials is needed to test the results of our model in the real world. It is crucial to further assess whether existing soil sampling schemes for SOC monitoring are able to deliver representative results of SOC variations after biochar application for the MRV of carbon dioxide removal.
The datasets presented in this study can be found in online repositories. The names of the repository/repositories and accession number(s) can be found in the article/Supplementary material.
Written informed consent was obtained from the individual(s) for the publication of any potentially identifiable images or data included in this article.
SL: Investigation, Methodology, Writing – original draft. TB: Conceptualization, Writing – review & editing. H-PS: Writing – review & editing. NH: Conceptualization, Funding acquisition, Writing – review & editing.
The author(s) declare that financial support was received for the research, authorship, and/or publication of this article. The research was conducted within the Project “Road4Schemes” of the “H2020 European Joint Programme SOIL (EJP-SOIL, 862695)”. “Open access funding by Agroscope”.
The authors declare that the research was conducted in the absence of any commercial or financial relationships that could be construed as a potential conflict of interest.
All claims expressed in this article are solely those of the authors and do not necessarily represent those of their affiliated organizations, or those of the publisher, the editors and the reviewers. Any product that may be evaluated in this article, or claim that may be made by its manufacturer, is not guaranteed or endorsed by the publisher.
The Supplementary material for this article can be found online at: https://www.frontiersin.org/articles/10.3389/fclim.2024.1344524/full#supplementary-material
Aynekulu, E., Vagen, T.-G., Shephard, K., and Winowiecki, L. (2011) A protocol for modeling, measurement and monitoring soil carbon stocks in agricultural landscapes.: version 1.1. Available at: https://apps.worldagroforestry.org/downloads/Publications/PDFS/TM11192.pdf
Blanco-Canqui, H., Laird, D. A., Heaton, E. A., Rathke, S., and Acharya, B. S. (2020). Soil carbon increased by twice the amount of biochar carbon applied after 6 years: Field evidence of negative priming. GCB Bioenergy 12, 240–251. doi: 10.1111/gcbb.12665
Bowring, S. P. K., Jones, M. W., Ciais, P., Guenet, B., and Abiven, S. (2022). Pyrogenic carbon decomposition critical to resolving fire’s role in the earth system. Nat. Geosci. 15, 135–142. doi: 10.1038/S41561-021-00892-0
Brewer, C. E., Chuang, V. J., Masiello, C. A., Gonnermann, H., Gao, X., Dugan, B., et al. (2014). New approaches to measuring biochar density and porosity. Biomass Bioenergy 66, 176–185. doi: 10.1016/j.biombioe.2014.03.059
Chambers, A., Lal, R., and Paustian, K. (2016). Soil carbon sequestration potential of US croplands and grasslands: implementing the 4 per thousand initiative. J. Soil Water Conserv. 71, 68A–74A. doi: 10.2489/jswc.71.3.68A
Conant, R. T., Ogle, S. M., Paul, E. A., and Paustian, K. (2011). Measuring and monitoring soil organic carbon stocks in agricultural lands for climate mitigation. Front. Ecol. Environ. 9, 169–173. doi: 10.1890/090153
Conen, F., Yakutin, M. V., and Sambuu, A. D. (2003). Potential for detecting changes in soil organic carbon concentrations resulting from climate change. Glob. Chang. Biol. 9, 1515–1520. doi: 10.1046/j.1365-2486.2003.00689.x
Ding, F., van Zwieten, L., Zhang, W., Weng, Z., Shi, S., Wang, J., et al. (2018). A meta-analysis and critical evaluation of influencing factors on soil carbon priming following biochar amendment. J. Soils Sediments 18, 1507–1517. doi: 10.1007/s11368-017-1899-6
Dupla, X., Lemaître, T., Grand, S., Gondret, K., Charles, R., Verrecchia, E., et al. (2022). On-farm relationships between agricultural practices and annual changes in organic carbon content at a regional scale. Front. Environ. Sci. 10:834055. doi: 10.3389/fenvs.2022.834055
EBC (2023) European Biochar Certificate – Richtlinien für die Zertifizierung von Pflanzenkohle. (Version 10.3G vom 5. April 2023). Available at: http://www.european-biochar.org/
Elyeznasni, N., Sellami, F., Pot, V., Benoit, P., Vieublé-Gonod, L., Young, I., et al. (2012). Exploration of soil micromorphology to identify coarse-sized OM assemblages in X-ray CT images of undisturbed cultivated soil cores. Geoderma 179-180, 38–45. doi: 10.1016/j.geoderma.2012.02.023
Etter, H., Vera, A., Aggarwal, C., Delaney, M., and Manley, S. (2021) Methodology for biochar utilization in soil and non-soil applications. Available at: https://verra.org/wp-content/uploads/imported/methodologies/210803_VCS-Biochar-Methodology-v1.0-.pdf (Accessed October 24, 2023).
FAO (2020). A protocol for measurement, monitoring, reporting and verification of soil organic carbon in agricultural landscapes – GSOC-MRV Protocol. Rome. Available at: https://openknowledge.fao.org/items/690c5092-b85c-44b5-a1de-e442c9eb9b20
Gy, P. (2004). Sampling of discrete materials—a new introduction to the theory of sampling: I. Qualitative approach. Chemom. Intell. Lab. Syst. 74, 7–24. doi: 10.1016/j.chemolab.2004.05.012
Hagemann, N. (2024) Description of the certification process for biochar-based carbon sinks. Arbaz, Switzerland: Ithaka Institute.
Hagemann, N., Schmidt, H.-P., Kägi, R., Böhler, M., Sigmund, G., Maccagnan, A., et al. (2020). Wood-based activated biochar to eliminate organic micropollutants from biologically treated wastewater. Sci. Total Environ. 730:138417. doi: 10.1016/j.scitotenv.2020.138417
Hagemann, N., Spokas, K., Schmidt, H.-P., Kägi, R., Böhler, M., and Bucheli, T. (2018). Activated carbon, biochar and charcoal: linkages and synergies across pyrogenic Carbon’s ABCs. Water. Arbaz, Switzerland: Ithaka Institute. 10:182. doi: 10.3390/w10020182
Heim, A., Wehrli, L., Eugster, W., and Schmidt, M. (2009). Effects of sampling design on the probability to detect soil carbon stock changes at the Swiss CarboEurope site Lägeren. Geoderma 149, 347–354. doi: 10.1016/j.geoderma.2008.12.018
Hilscher, A., and Knicker, H. (2011). Degradation of grass-derived pyrogenic organic material, transport of the residues within a soil column and distribution in soil organic matter fractions during a 28month microcosm experiment. Org. Geochem. 42, 42–54. doi: 10.1016/j.orggeochem.2010.10.005
Howell, A., Helmkamp, S., and Belmont, E. (2022). Stable polycyclic aromatic carbon (SPAC) formation in wildfire chars and engineered biochars. Sci. Total Environ. 849:157610. doi: 10.1016/J.SCITOTENV.2022.157610
Jandl, R., Rodeghiero, M., Martinez, C., Cotrufo, M. F., Bampa, F., van Wesemael, B., et al. (2014). Current status, uncertainty and future needs in soil organic carbon monitoring. Sci. Total Environ. 468-469, 376–383. doi: 10.1016/j.scitotenv.2013.08.026
Jeffery, S., Abalos, D., Prodana, M., Bastos, A. C., van Groenigen, J. W., Hungate, B. A., et al. (2017). Biochar boosts tropical but not temperate crop yields. Environ. Res. Lett. 12:53001. doi: 10.1088/1748-9326/aa67bd
Joseph, S., Cowie, A. L., van Zwieten, L., Bolan, N., Budai, A., Buss, W., et al. (2021). How biochar works, and when it doesn't: a review of mechanisms controlling soil and plant responses to biochar. GCB Bioenergy 13, 1731–1764. doi: 10.1111/gcbb.12885
Joseph, S., Pow, D., Dawson, K., Rust, J., Munroe, P., Taherymoosavi, S., et al. (2020). Biochar increases soil organic carbon, avocado yields and economic return over 4 years of cultivation. Sci. Total Environ. 724:138153. doi: 10.1016/j.scitotenv.2020.138153
Kappler, A., Wuestner, M. L., Ruecker, A., Harter, J., Halama, M., and Behrens, S. (2014). Biochar as an Electron shuttle between Bacteria and Fe(III) minerals. Environ. Sci. Technol. Lett. 1, 339–344. doi: 10.1021/ez5002209
Keiluweit, M., Nico, P. S., Johnson, M. G., and Kleber, M. (2010). Dynamic molecular structure of plant biomass-derived black carbon (biochar). Environ. Sci. Technol. 44, 1247–1253. doi: 10.1021/es9031419
Kosasih, I., Wu, K.-T., Sipayung, H. N., and Chen, C.-T. (2022). Biochar application in Calliandra calothyrsus plantation management. Agrofor. Syst. 96, 115–127. doi: 10.1007/s10457-021-00703-w
Lal, R. (2016). Beyond COP 21: potential and challenges of the "4 per thousand" initiative. J. Soil Water Conserv. 71, 20A–25A. doi: 10.2489/jswc.71.1.20A
Martinsen, V., Mulder, J., Shitumbanuma, V., Sparrevik, M., Børresen, T., and Cornelissen, G. (2014). Farmer-led maize biochar trials: effect on crop yield and soil nutrients under conservation farming. J. Plant Nutr. Soil Sci. 177, 681–695. doi: 10.1002/jpln.201300590
McDonald, H., Frelih-Larsen, A., Keenleyside, C., Lóránt, A., Duin, L., Pyndt Andersen, S., et al. (2021). Carbon farming, making agriculture fit for 2030. Brussels: European Parliamentary Research Service.
Melo, L. C. A., Lehmann, J., Da Carneiro, J. S. S., and Camps-Arbestain, M. (2022). Biochar-based fertilizer effects on crop productivity: a meta-analysis. Plant Soil 472, 45–58. doi: 10.1007/s11104-021-05276-2
Minasny, B., Malone, B. P., McBratney, A. B., Angers, D. A., Arrouays, D., Chambers, A., et al. (2017). Soil carbon 4 per mille. Geoderma 292, 59–86. doi: 10.1016/j.geoderma.2017.01.002
Nair, V. D., Nair, P. K. R., Dari, B., Freitas, A. M., Chatterjee, N., and Pinheiro, F. M. (2017). Biochar in the agroecosystem-climate-change-sustainability Nexus. Front. Plant Sci. 8:2051. doi: 10.3389/fpls.2017.02051
Nath, A. J., Lal, R., and Das, A. K. (2015). Managing woody bamboos for carbon farming and carbon trading. Glob. Ecol. Conserv. 3, 654–663. doi: 10.1016/j.gecco.2015.03.002
Nogués, I., Mazzurco Miritana, V., Passatore, L., Zacchini, M., Peruzzi, E., Carloni, S., et al. (2023). Biochar soil amendment as carbon farming practice in a Mediterranean environment. Geoderma Reg. 33:e00634. doi: 10.1016/j.geodrs.2023.e00634
Paul, C., Bartkowski, B., Dönmez, C., Don, A., Mayer, S., Steffens, M., et al. (2023). Carbon farming: are soil carbon certificates a suitable tool for climate change mitigation? J. Environ. Manag. 330:117142. doi: 10.1016/j.jenvman.2022.117142
Peth, S., Chenu, C., Leblond, N., Mordhorst, A., Garnier, P., Nunan, N., et al. (2014). Localization of soil organic matter in soil aggregates using synchrotron-based X-ray microtomography. Soil Biol. Biochem. 78, 189–194. doi: 10.1016/j.soilbio.2014.07.024
Poeplau, C., Prietz, R., and Don, A. (2022). Plot-scale variability of organic carbon in temperate agricultural soils—implications for soil monitoring. J. Plant Nutr. Soil Sci. 185, 403–416. doi: 10.1002/jpln.202100393
Pokharel, P., Ma, Z., and Chang, S. X. (2020). Biochar increases soil microbial biomass with changes in extra- and intracellular enzyme activities: a global meta-analysis. Biochar 2, 65–79. doi: 10.1007/s42773-020-00039-1
Puro.earth (2022) Puro standard- biochar methodology, (edition 2022 version 2). Available at: https://fs.hubspotusercontent00.net/hubfs/7518557/Supplier%20Documents/Puro.earth%20Biochar%20Methodology.pdf
R Core Team (2021). R: A language and environment for statistical computing. Vienna: R Foundation for Statistical Computing.
Radley, G., Keenleyside, C, and Frelih-Larsen, A. (2021). Technical guidance handbook - setting up and implementing result-based carbon farming mechanisms in the EU report to the European Commission: DG climate action, under contract no. CLIMA/C.3/ETU/2018/007. Available at: https://data.europa.eu/doi/10.2834/056153 (Accessed September 18, 2023).
Rathnayake, D., Schmidt, H.-P., Leifeld, J., Bürge, D., Bucheli, T. D., and Hagemann, N. (2024). Quantifying soil organic carbon after biochar application: how to avoid (the risk of) counting CDR twice? Front. Climate 6:1343516. doi: 10.3389/fclim.2024.1343516
Rombolà, A. G., Fabbri, D., Meredith, W., Snape, C. E., and Dieguez-Alonso, A. (2016). Molecular characterization of the thermally labile fraction of biochar by hydropyrolysis and pyrolysis-GC/MS. J. Anal. Appl. Pyrolysis 121, 230–239. doi: 10.1016/J.JAAP.2016.08.003
RStudio Team (2020) RStudio: Integrated Development for R. Available at: www.rstudio.com
Saby, N. P. A., Bellamy, P. H., Morvan, X., Arrouays, D., Jones, R. J. A., Verheijen, F. G. A., et al. (2008). Will European soil-monitoring networks be able to detect changes in topsoil organic carbon content? Glob. Chang. Biol. 14, 2432–2442. doi: 10.1111/j.1365-2486.2008.01658.x
Schiedung, M., Bellè, S.-L., Sigmund, G., Kalbitz, K., and Abiven, S. (2020). Vertical mobility of pyrogenic organic matter in soils: a column experiment. Biogeosciences 17, 6457–6474. doi: 10.5194/bg-17-6457-2020
Schmidt, H.-P., Kammann, C., Hagemann, N., Leifeld, J., Bucheli, T. D., Sánchez Monedero, M. A., et al. (2021). Biochar in agriculture – a systematic review of 26 global meta-analyses. GCB Bioenergy 13, 1708–1730. doi: 10.1111/gcbb.12889
Schmidt, H.-P., Pandit, B. H., Cornelissen, G., and Kammann, C. I. (2017). Biochar-based fertilization with liquid nutrient enrichment: 21 Field trials covering 13 crop species in Nepal. Land Degrad. Dev. 28, 2324–2342. doi: 10.1002/ldr.2761
Schmidt, H., Pandit, B., Martinsen, V., Cornelissen, G., Conte, P., and Kammann, C. (2015). Fourfold increase in pumpkin yield in response to low-dosage root zone application of urine-enhanced biochar to a fertile tropical soil. Agriculture 5, 723–741. doi: 10.3390/agriculture5030723
Schrumpf, M., Schulze, E. D., Kaiser, K., and Schumacher, J. (2011). How accurately can soil organic carbon stocks and stock changes be quantified by soil inventories? Biogeosciences 8, 1193–1212. doi: 10.5194/bg-8-1193-2011
Six, J., Callewaert, P., and Lenders, S., Gryze, S. de, Morris, S.J., Gregorich, E.G., et al. (2002) Measuring and understanding carbon storage in afforested soils by physical fractionation. Soil Sci. Soc. Am. J., 66, 1981–1987. doi: 10.2136/sssaj2002.1981
Smith, P., Adams, J., Beerling, D. J., Beringer, T., Calvin, K. V., Fuss, S., et al. (2019). Land-management options for greenhouse gas removal and their impacts on ecosystem services and the sustainable development goals. Annu. Rev. Environ. Resour. 44, 255–286. doi: 10.1146/annurev-environ-101718-033129
Smith, S., Geden, O., Minx, J., Nemet, G., Gidden, M., Lamb, W., et al. (2023). The state of carbon dioxide removal report 2023. United Kingdom: The State of Carbon Dioxide Removal.
Stolbovoy, V., Filippi, N., and Montanarella, L. (2007). Soil sampling protocol to certify the changes of organic carbon stock in mineral soil of the European Union: Version 2. Luxembourg: Publications Office.
Stolbovoy, V., Montanarella, L., Filippi, N., Selvaradjou, S., Panagos, P., and Gallego, J. (2005). Soil sampling protocol to certify the changes of organic carbon stock in mineral soils of European Union. Luxembourg: Office for Official Publications of the European Communities.
Sun, T., Levin, B. D. A., Guzman, J. J. L., Enders, A., Muller, D. A., Angenent, L. T., et al. (2017). Rapid electron transfer by the carbon matrix in natural pyrogenic carbon. Nat. Commun. 8:14873. doi: 10.1038/ncomms14873
UNFCCC (2015) Paris agreement to the United Nations framework convention on climate change, (T.I.A.S. No. 16-1104.). Available at: https://unfccc.int/files/essential_background/convention/application/pdf/english_paris_agreement
Wang, J., Xiong, Z., and Kuzyakov, Y. (2016). Biochar stability in soil: meta-analysis of decomposition and priming effects. GCB Bioenergy 8, 512–523. doi: 10.1111/gcbb.12266
Weng, Z., van Zwieten, L., Singh, B. P., Tavakkoli, E., Joseph, S., Macdonald, L. M., et al. (2017). Biochar built soil carbon over a decade by stabilizing rhizodeposits. Nat. Clim. Chang. 7, 371–376. doi: 10.1038/nclimate3276
Wiesmeier, M., Mayer, S., Paul, C., Helming, K., Don, A., Franko, U., et al. (2020) CO2 certificates for carbon sequestration in soils: methods, management practices and limitations. BonaRes Series 2020/04. doi: 10.20387/bonares-ne0g-ce98
Xiang, Y., Deng, Q., Duan, H., and Guo, Y. (2017). Effects of biochar application on root traits: a meta-analysis. GCB Bioenergy 9, 1563–1572. doi: 10.1111/gcbb.12449
Keywords: pyrogenic carbon capture and storage, biochar carbon removal, representative sampling, modelling, root-zone application, agroforestry
Citation: Lotz S, Bucheli TD, Schmidt H-P and Hagemann N (2024) Quantification of soil organic carbon: the challenge of biochar-induced spatial heterogeneity. Front. Clim. 6:1344524. doi: 10.3389/fclim.2024.1344524
Edited by:
Carlos Paulo, SRK Consulting, CanadaReviewed by:
Christopher Reinhard, Georgia Institute of Technology, United StatesCopyright © 2024 Lotz, Bucheli, Schmidt and Hagemann. This is an open-access article distributed under the terms of the Creative Commons Attribution License (CC BY). The use, distribution or reproduction in other forums is permitted, provided the original author(s) and the copyright owner(s) are credited and that the original publication in this journal is cited, in accordance with accepted academic practice. No use, distribution or reproduction is permitted which does not comply with these terms.
*Correspondence: Simon Lotz, bG90ekBpdGhha2EtaW5zdGl0dXQub3Jn; Nikolas Hagemann, bmlrb2xhcy5oYWdlbWFubkBhZ3Jvc2NvcGUuYWRtaW4uY2g=
Disclaimer: All claims expressed in this article are solely those of the authors and do not necessarily represent those of their affiliated organizations, or those of the publisher, the editors and the reviewers. Any product that may be evaluated in this article or claim that may be made by its manufacturer is not guaranteed or endorsed by the publisher.
Research integrity at Frontiers
Learn more about the work of our research integrity team to safeguard the quality of each article we publish.