
95% of researchers rate our articles as excellent or good
Learn more about the work of our research integrity team to safeguard the quality of each article we publish.
Find out more
ORIGINAL RESEARCH article
Front. Clim. , 15 February 2024
Sec. Climate Monitoring
Volume 6 - 2024 | https://doi.org/10.3389/fclim.2024.1342896
 Diego Della Lunga1*
 Kristofor R. Brye1Trenton L. Roberts1Jonathan Brye1
 Michelle Evans-White2Christopher G. Henry3
 Daniel J. Lessner2Chandler Arel1
Phosphorus (P) fertilizers with low water solubility, like struvite (MgNH4PO4·6H2O), have been identified to possibly reduce nutrient losses in furrow-irrigated cropping systems. However, there is a lack of research on the impacts of P and nitrogen (N) fertilization on greenhouse gas [GHG; i.e., methane (CH4), nitrous oxide (N2O), and carbon dioxide (CO2)] production in furrow-irrigated rice (Oryza sativa). The objective of this study was to evaluate the effects of electrochemically precipitated struvite (ECST), chemically precipitated struvite (CPST), triple superphosphate (TSP), diammonium phosphate (DAP), environmentally smart nitrogen (ESN), and an unamended control (CT) on GHG emissions, global warming potential (GWP), and plant and soil responses at the up-slope position of a furrow-irrigated rice field in east-central Arkansas. Seasonal CH4 and CO2 emissions did not differ (P > 0.05) among fertilizer treatments, while N2O emissions were greater (P = 0.02) from CT (i.e., 5.97 kg ha−1 season−1), which did not differ from ECST, and were lowest from ESN (1.50 kg ha−1 season−1), which did not differ from TSP, CPST, ECST, and DAP. Global warming potential was greatest (P < 0.05) from CT (1612 kg CO2 eq. ha−1 season−1), which did not differ from ECST, and was lowest from ESN (436 kg CO2 eq. ha−1 season−1), which did not differ from TSP, ECST, CPST, and DAP. The combination of numerically greater yield and lower N2O emissions from CPST and ESN suggested that slow-release fertilizers could constitute an effective mitigation tool to reduce GHG emissions, maintain production, and improve sustainability in furrow-irrigated rice systems.
Environmental pollution due to land degradation, eutrophication of bodies of water, irrigation issues due to the over-consumption of water, and the necessity to increase crop yields have raised concerns regarding the long-term sustainability of rice (Oryza sativa) production systems worldwide and specifically in the United States (Tran, 1997; Abbade, 2020; US). Water logging, salinity, groundwater depletion, and methane (CH4) emissions constitute environmental issues often associated with flood-irrigated rice, while deforestation, soil erosion, and nitrogen (N) losses represent environmental issues often related to upland rice (i.e., row rice or furrow-irrigated rice) cultivation (Tran, 1997).
The supply of available water for crop irrigation indicates, globally and regionally, which water regime can be better managed in the long term and represents the determining factor for mitigation practices to improve the sustainability of rice production worldwide, including in the US, and particularly in Arkansas, which is the leading rice-producing state in the US (USEPA, 2012; Hardke, 2020a,b; USDA-NASS, 2023). The Mississippi River Valley Alluvial Aquifer that lies within the Lower Mississippi River Basin (LMRB) provides more than 90% of the water used for irrigation activities in Arkansas, where 70% of the water usage comes directly from the alluvial aquifer (Reba and Massey, 2020). Innovations in crop and water management, like precision grading, furrow irrigation, on-farm reservoirs, and incentivized programs in water resource consumption, have been proposed as potentially effective tools to reduce the over-exploitation of aquifer capabilities in the LMRB (Reba and Massey, 2020).
Furrow irrigation possesses appealing elements among rice producers (Reba and Massey, 2020). Furrow-irrigated rice in the LMRB expanded from 3,200 to almost 60,000 ha between 2014 and 2019 (Reba and Massey, 2020). Furrow-irrigation adoption has been driven to reduce costs of creating levees, installing gates, and reducing tillage frequency (Reba and Massey, 2020). Furrow irrigation is often associated with the common rice-soybean (Glycine max) rotation, where rice (i.e., row rice) is directly seeded on pre-existing raised beds used for the soybean crop, limiting the degree of soil disturbance. He (2010) observed that furrow- compared to flood-irrigated conditions not only reduced water use by 48%, but also increased white roots by more than 30%, and reduced yellow and black roots by 20 and 13%, respectively, suggesting that permeable soils that can transmit gases can enhance the development of a healthy rice root system. Despite limited information available for furrow-irrigated rice in relation to optimal soil fertility, nutrient management, and environmental sustainability (Yang et al., 2011), there is still a need to improve site-specific recommendations for furrow-irrigated rice production (Hardke, 2020a,b).
Among the management of nutrients in furrow-irrigated systems, phosphorus (P) represents the biggest challenge (Yang et al., 2011). The challenge arises from the P distribution within the soil profile being affected by irrigation application and water regime in general (Yang et al., 2011). In upland cultivation, the use efficiency of applied fertilizer-P by plants is relatively low (20%−30%), leaving a substantial amount of P within the topsoil to be subjected to runoff and/or soil erosion (Park et al., 2004; Yang et al., 2011). Irrigation regimes that involve frequent water applications and soil moisture contents close to saturation exhibited greater P mobility and availability due to diffusion and leaching processes (Bacon and Davey, 1982; Bar-Yosef et al., 1989; Yang et al., 2011). In furrow-irrigated systems, large P concentrations were measured as aluminum (Al)- and iron (Fe)-bound compounds and in occluded forms (i.e., chelated) due to the alternations of oxidation-reduction (redox) chemistry that is typically observed in furrow-irrigated fields (Ippolito et al., 2019; Della Lunga et al., 2020a,b). In furrow-irrigated production systems, when reducing conditions occur, the low rate of organic matter mineralization can lead to the accumulation of organic P fractions (Ippolito et al., 2019). However, little is known about the mechanisms of P transformation, sorption and desorption, dissolution, and precipitation in furrow-irrigated fields (Westermann et al., 2001).
Phosphate fertilizer production was 2.3 Mt in the US in 2015, at a cost of over $1.1 billion, but fertilizer-P demand is projected to almost double worldwide by 2030 due to the growing human population and food production needs (Wang et al., 2015; Mori et al., 2016; Deng et al., 2020). Several new technologies have been suggested and/or implemented to recover P from wastewater to reduce the over-exploitation of the finite, mined, rock phosphate resource and reduce the costs of fertilizer application (Cabeza et al., 2011). Among the recovered-P products, the mineral struvite (MgNH4PO4·6H2O), created through chemical and/or electrochemical precipitation techniques to make chemically precipitated struvite (CPST) or electrochemically precipitated struvite (ECST) has shown promising results in agronomic studies of multiple crops in the greenhouse and in field settings (Hertzberger et al., 2020; Ylagan et al., 2020; Omidire et al., 2021). Although the economic aspect and feasibility of struvite production at a market scale have not been completely evaluated yet, ECST has been shown to provide similar yields and plant response as other commercially available fertilizer-P sources with different crops and under different water regimes and management practices (Hertzberger et al., 2020; Ylagan et al., 2020; Anderson et al., 2021; Brye et al., 2023; Della Lunga et al., 2023a,b)1. Struvite's fertilizer potential is characterized by citrate solubility that ranges from 18 to 29% (Hertzberger et al., 2020; Di Tommasi et al., 2021) to 96% depending on the source material (Moussa et al., 2006), but water solubility that only ranges from ~2% to 4% (Moussa et al., 2006; Latifian et al., 2012; Rech et al., 2019; Di Tommasi et al., 2021). Thus, struvite's solubility properties represent a substantial deviation from the most commonly applied fertilizer-P sources, such as triple superphosphate (TSP), monoammonium phosphate (MAP), and diammonium phosphate (DAP), all of which are much more water soluble than struvite, suggesting that, upon application, different chemical reactions and timings involving plants and microbial communities in the upper soil profile should be expected. Phosphorus fertilizers with low water solubility have been recommended to reduce possible nutrient losses from frequent irrigation applications, suggesting that struvite could represent an ideal P source for furrow-irrigated rice production (Hertzberger et al., 2020).
Along with challenging P management, furrow-irrigated systems can also experience substantial nitrogen (N) losses due to fluctuating soil moisture (Hefner and Tracy, 2013; Della Lunga et al., 2020b, 2023a). To date, there is a lack of research on the overall impact of P and N fertilization on direct and indirect production and release of greenhouse gases (GHGs, Zhang et al., 2019). In a laboratory incubation study conducted with alluvial soil from vegetable fields in China, results suggested that P addition can delay nitrification processes in P-rich soils (Ning et al., 2021). Additionally, P additions can positively and significantly impact autotrophic and mixotrophic denitrification processes, especially when is relatively abundant (Fan et al., 2018). Compared to P impacts on N2O emissions in agricultural fields, slightly more research has been conducted on P-fertilization effects on CH4 production, specifically in rice fields under flooded conditions. Incubation studies determined that the addition of phosphate fertilizers can increase N fixation in the soil, stimulate CH4 oxidation by methanotrophs, and inhibit acetoclastic methanogenic activity, which reduces CH4 emissions from the pedosphere (Rao et al., 1986; Adhya et al., 1998; Conrad et al., 2000). Rice production systems can behave as a C sink if there is a positive net balance among CO2 and CH4 emissions and soil C storage from reduced decomposition rates (Gangopadhyay et al., 2022), which are often pronounced under flooded-soil conditions. Consequently, studies on CO2 emissions in general have been limited, while studies on the effect of different fertilizer-P sources on CO2, and GHGs in general has been practically absent.
Considering the knowledge gap related to the role of fertilizer-P and -N in production and release of GHG emissions in furrow-irrigated rice, the objective of this study was to evaluate the effect fertilizer source [i.e., electrochemically precipitated struvite (ECST), chemically precipitated struvite (CPST), triple superphosphate (TSP), diammonium phosphate (DAP), environmentally smart nitrogen (ESN), and an unamended control (CT)] on GHG fluxes, growing-season emissions (hereafter referred as seasonal emissions), emissions intensity, global warming potential (GWP), GWP emissions intensity, end-of-season plant properties, and soil properties difference (i.e., end of the season-beginning of the season) in a furrow-irrigated rice field on a silt-loam in east-central Arkansas. The inclusion of struvite materials as fertilizer-P source also permits further investigation into the use of recovered-P materials as a potential mitigation tool for GHG emissions in agricultural settings.
All fertilizer-P sources were characterized by different degrees of water solubility1, most likely resulting in differential timing of nutrient availability for plants and microbial communities, thus affecting temporal trends of GHGs. It was hypothesized that DAP would have the earliest peak CH4, N2O, and CO2 fluxes, ECST would have the latest peak flux of all three GHGs due to solubility differences and the different application timings of the fertilizer-N sources, while CPST and TSP would have later GHG peaks than DAP, but earlier than ECST. It was hypothesized that there would be no difference in seasonal CH4 and CO2 emissions and emissions intensities, yield, and end-of-season plant properties among the fertilizer sources due to the long history of fertilization and the predominantly aerobic conditions throughout the study area. It was also hypothesized that, seasonal N2O emissions, GWP, and GWP emission intensity would be greatest from DAP and lowest from ECST due to the different fertilizer solubilities. Furthermore, it was hypothesized that the change in soil P, total carbon (TC), total nitrogen (TN), and soil organic matter (SOM) content would be the least negative from ECST and CPST due to the reportedly slow-release nature of struvite that would limit microbial activity and metabolic nutrient cycling.
This field study was conducted from April to September at the Rice Research and Extension Center (RREC, 34.46°N,−91.46°W) near Stuttgart, Arkansas throughout the 2022 growing season. The soil series mapped throughout the study area was classified as DeWitt silt loam (fine, smectitic, thermic Typic Albaqualf), which is a poorly drained and slowly permeable soil formed from alluvial terrace deposits of the Lower Mississippi River during the Quaternary period (USDA-NRCS, 2014). The field has been under cultivation for the past 15 years, but, since 2014, has been managed exclusively in a furrow-irrigated rice-rice rotation. The study area encompassed a portion of the southwest corner of a larger 16-ha rice field. The study area consisted of 12 raised beds, 30 cm wide and 15 cm tall, with a furrow-to-furrow distance of 76 cm. The whole study area was 54-m long and 20-m wide. The study area was entirely prepared with a reduced tillage practice (i.e., stale-seedbed), hereafter referred to as no-tillage (NT), during the spring prior to planting each year's rice crop. The south-north-oriented slope within the study area was ~0.2%.
With a 30-year (1991 to 2020) mean annual precipitation and air temperature of 128.8 cm and 17.3°C, respectively, the climate in the region is classified as Humid Subtropical or Cfa by the Koppen Classification System (Arnfield, 2016). Archived meteorological data, specifically air temperature (°C) and precipitation (cm), for April to September from the past 10 years (i.e., 2012 to 2021) and for the study year (i.e., 2022) were also retrieved from a weather station located at the RREC just a couple of kilometers away from the study area (SRCC, 2023). Additionally, monthly 30-years normal (1991 to 2020) data were retrieved from April to September (NCEI, 2023). Monthly archived meteorological data, 30-years normal data, and 2022 data were summarized and the 6-month average for air temperature and 6-month total for precipitation were calculated. A relative percentage difference (RPD) was also calculated by subtracting the 10-years monthly, 30-years monthly normal, and 6-month values from the 2022 monthly and 6-month values and dividing the difference by their average.
A split-plot design was established with fertilizer source as the whole-plot factor in a randomized complete block design (RCBD) with time (i.e., sample date) as the split-plot factor. The six fertilizer treatments (i.e., TSP, ECST, CPST, DAP, ESN, and CT) were randomized within each of three blocks, for a total of 18 plots (Figure 1). Each plot had an area of ~ 2.3 m2 and had an empty raised bed between adjacent treatments to avoid cross-contamination, except the two west-most, external plots that were positioned on adjacent raised beds out of necessity from limited available space in the field (Figure 1). The first block was located 15 m downslope from the upper crown of the field, while the second and the third blocks were 15 m downslope from the first and second blocks, respectively, for a total study area length of 54 m (Figure 1).
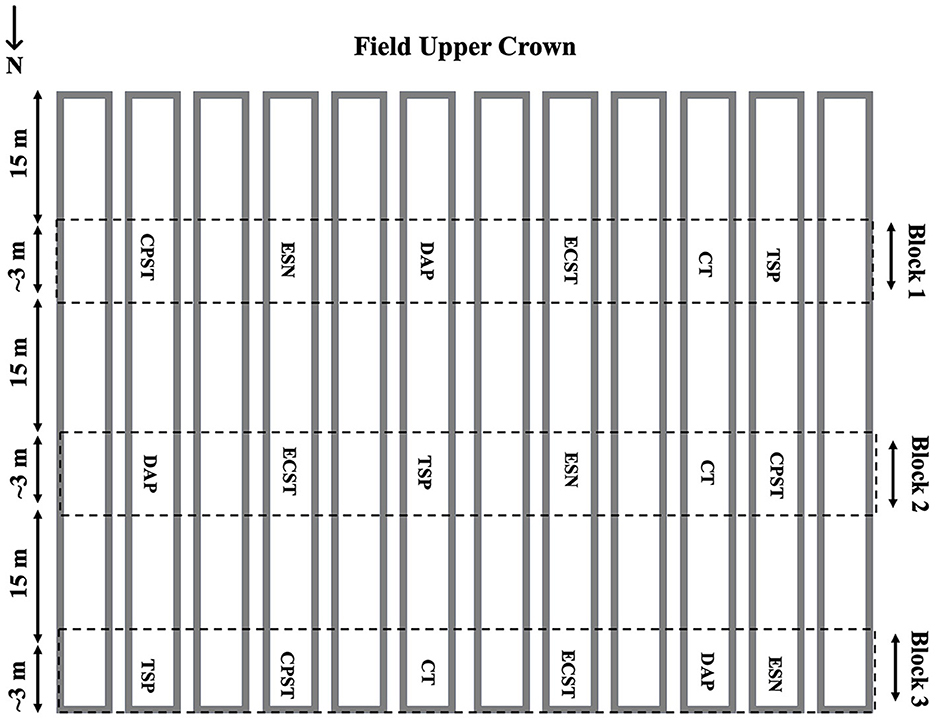
Figure 1. Experimental design diagram of the study area for the 2022 rice growing season study at the Rice Research and Extension Center near Stuttgart, AR. Rectangular shapes represent the raised bed within the study area where collars were installed for greenhouse gas analyses. Text within the diagram indicates the fertilizer treatments [i.e., triple superphosphate (TSP), chemically precipitated struvite (CPST), electrochemically precipitated struvite (ECST), diammonium phosphate (DAP), environmentally safe nitrogen (ESN), and unamended control (CT)] randomized within each of the three blocks. Diagram depicts the dimensions of the study area.
Fertilizer sources were characterized by different nutrient grades [i.e., TSP fertilizer grade: 0–46–0; ECST fertilizer grade: 5–37–0 (Anderson et al., 2021); CPST fertilizer grade: 6–27–0.1; DAP fertilizer grade: 18–46–0; and ESN fertilizer grade: 44–0-0]. Electrochemically precipitated struvite was created from synthetic wastewater of known P and N concentrations by the Chemical Engineering Department at the University of Arkansas as detailed in Della Lunga et al. (2023b), while CPST, under the tradename of Crystal Green, created via chemical precipitation from a municipal wastewater source near Atlanta, GA, was purchased from Ostara Nutrient Recovery Technologies (Vancouver, Canada). Environmentally Smart N represented a slow-release, polymer-coated urea product (Agrium Wholesales, Denver, CO), where the release of N is regulated by soil temperature (Nutrient, 2023).
On 14 September, 2021, 2 weeks after the 2021 harvest, rice crop residues throughout the entire 16-ha field were burned. On 15 September, 2021, a furrow-runner implement (Perkins Sales Inc., Bernie, MO) was used in the field to clean and open the furrows. On 29 September, 2021, a cover crop mix, consisting of 50% annual rye (Lolium multiflorum), 25% Australian winter peas (Pisum sativum subsp. arvense), 12.5% crimson clover (Trifolium incarnatum), and 12.5% radish (Raphanus sativus), was seeded at a rate of 28.0 kg seed ha−1. On 29 April, 2022, the entire field was seeded with the hybrid rice cultivar “FP7521” (RiceTec, Alvin, TX) at a rate of 23.5 kg seed ha−1. A larger portion of the field that included the study area was left untreated until 13 May, 2022 when P from the fertilizer treatments and zinc (Zn) as zinc sulfate were manually broadcast in each plot at equivalent rates of 14.7 and 11.2 kg ha−1, respectively, except in the CT replicates that received Zn, but no P addition at any time. The plots that were going to be fertilized with ESN, received DAP as their P source to have balanced P additions among all fertilized plots. Due to the greater N concentration of DAP that provided 14.5 kg ha−1 of N, plots that were going to be fertilized with TSP, ECST, and CPST and the control plots received a N application as N-(n-butyl) thiophosphoric triamide (NBPT)-coated urea (fertilizer grade: 46–0–0), hereafter referred to as coated urea, to balance the N content among all the fertilizer source treatments. Except in plots treated with ESN, all other plots were fertilized with coated urea as the N source. Plots did not receive any potassium (K) additions based on soil-test results and the University of Arkansas recommendations for rice production systems (UA-DA-CES, 2019).
On 2 June, 2022, the ESN plots were manually broadcast with the equivalent of 140 kg N ha−1 as ESN as all upfront application, while the TSP, DAP, ECST, CPST, and CT plots received the equivalent of 37.0 kg N ha−1 as coated urea as the first N application of a three-way split application recommended by the University of Arkansas for furrow-irrigated rice on a silt loam (Hardke, 2020b). On 9 and 16 June, 2022, all plots, except for the ESN plots, received the second and third split-N applications, respectively, as coated urea at the equivalent rate of 51.6 kg N ha−1. Therefore, all the treatments received a total of 154.5 kg N ha−1 according to University of Arkansas recommendations (UA-DA-CES, 2019).
The study area was furrow-irrigated approximately once a week with a 30-cm-diameter, polyvinyl chloride (PVC) poly pipe laid perpendicular to the slope at the upper end of the field. Once activated, irrigation was left on for more than 10 h in order to have the wetting front reach the end of the field, usually occurring within 4 h, and to allow enough time for the water to infiltrate laterally and vertically in the raised beds. A tail-water pump at the lower end of the field returned tailwater to the crown of the field when ~ 30 cm of ponded water was reached in the lower third of the entire field (Kandpal, 2018). Irrigation applications stopped on 16 June, 2022 for about a week to avoid straight head, as recommended by the University of Arkansas guidelines for rice production (UA-DA-CES, 2019). The irrigation system was supplied by a rain-fed reservoir located adjacent to the northwest corner of the field. At the end of the season, a total of 44 cm of water had been applied as irrigation.
Pesticides and herbicides were applied as-needed throughout the growing season according to University of Arkansas recommendations (UA-DA-CES, 2019). On April 30, a solution composed of residual herbicide Command (2-[2-chlorophenyl)methyl]-4,4-dimethyl-3-isoxazolidinone, 0.9 L ha−1), Facet (3,7-dichloro-8-quinolinecarboxylic acid, 1.6 L ha−1) and League (2-chloro-N-[[(4,6-dimethoxy-2-pyrimidinyl)-amino]carbonyl]imidazo[1,2-a]pyridine-3-sulfonamide, S-[(4-chlorophenyl)methyl] diethylcarbamothioate, 0.23 L ha−1) was applied in the entire study area. On May 19, a solution composed of Clincher (cyhalofop: 2-[4-(4-cyano-2-fluorophenoxy) phenoxy] propanoic acid, butyl ester (R), 2.2 L ha−1) and Zurax (3,7-dichloro-8-quinolinecarboxylic acid, 1.5 L ha−1) and on June 5 a solution composed by Preface (0.3 L ha−1), Gambit [Halosulfuron-methyl, methyl 3-chloro-5-(4,6-dimethoxypyrimidin-2-ylcarbamoylsulfamoyl)-1-methylpyrazole-4, 0.1 L ha−1], and Rice One [N-(1-ethylpropyl)-3,4-dimethyl-2,6-dinitrobenzenamine, 2.2 L ha−1] was applied to the entire study area.
Prior to individual plot and treatment establishment, five random sub-samples were collected from the top 10 cm of the raised beds in each of three predetermined blocks on 22 March, 2022 using a 2-cm diameter push probe and combined for one sample per block for initial particle-size and chemical analyses. An additional set of three soil samples, one in each block, were collected from the top 10 cm of the raised beds using a slide hammer and 4.8-cm-diameter core chamber for bulk density determination. Soil samples were oven-dried at 70°C for at least 48 h, ground, and sieved through a 2-mm mesh screen. Sand, silt, and clay percentages were determined using a modified 12-h hydrometer method (Gee and Or, 2002). Extractable soil nutrient (i.e., P, K, Ca, Mg, S, Na, Fe, Mn, and Zn) concentrations were determined with a Mehlich-3 extraction (i.e., 1:10 soil mass:extraction solution volume ratio) followed by analysis with inductively coupled, argon-plasma spectrophotometry (ICAPS; Tucker, 1992). Soil electrical conductivity (EC) and pH were measured in a 1:2 soil mass:water volume suspension with a potentiometer. Soil organic matter (SOM) and TC and TN concentrations were determined by weight-loss-on-ignition following combustion at 360oC for 2 h and high-temperature combustion in a VarioMax CN analyzer (Elementar Americas Inc., Mt. Laurel, NJ), respectively. No effervesce upon soil treatment with dilute hydrochloric acid was observed, therefore all measured TC was considered organic C. Measured soil nutrient, TC, TN, and SOM concentrations were converted to contents (kg ha−1) using the measured mean bulk density and the 10-cm soil depth. Soil C:N, N:P, and C:P ratios were calculated from soil contents.
Soil samples were collected from the top 10 cm of the raised bed within each plot at the end of the growing season on August 27, 2022 right before the drying period that precedes harvest. Following the same procedure described above, soil samples were prepared and analyzed for chemical properties to evaluate the soil chemical property change from beginning to end of the season (i.e., end minus beginning of the season).
Following procedures detailed in previous studies (Rogers et al., 2014; Smartt et al., 2016; Rector et al., 2018; Della Lunga et al., 2023a), on May 6, 2022, 18, 30-cm diameter PVC base collars were installed on top of the raised bed in each plot to a depth of 12 cm to allow free water movement through four, 12.5-mm-diameter holes drilled in each collar. Each base collar contained four plants as a portion of two adjacent rice rows. Gas sampling occurred approximately weekly between rice planting and harvest (i.e., 14, 21, 28, 35, 43, 49, 56, 63, 70, 77, 84, 91, 98, 105, 112, and 128 days after planting), for a total of 16 sampling dates.
Gas sample collection occurred on each sampling date between the same temporal window (i.e., 0800 h to 0900 h) following procedures used in numerous previous studies (Rogers et al., 2014; Smartt et al., 2016; Rector et al., 2018; Della Lunga et al., 2021a,c, 2023a). Gas sampling performed during the temporal window between 0800 and 1000 h represents the best time window to estimate daily GHG fluxes in rice production systems under flood- (Rogers et al., 2014; Smartt et al., 2016; Rector et al., 2018) and furrow-irrigated conditions (Della Lunga et al., 2021c). During the 1-h sampling period, gas samples were collected at 20-min intervals (i.e., 0 min, 20 min, 40 min, and 60 min) using the vented, non-flow-through, chamber method (Parkin and Venterea, 2010; Della Lunga et al., 2021a, 2023a). Additional details of the gas sampling procedures have been described previously in Della Lunga et al. (2021a, 2023a).
Gas samples were analyzed within 24 h of sample collection using a Shimadzu GC-2014 ATFSPL 115V gas chromatograph (GC; Shimadzu North America/Shimadzu Scientific Instruments Inc., Columbia, MD) equipped with a flame ionization detector (FID) for CH4 and CO2 and an electron capture detector (ECD) for N2O. The slope of the best-fit linear regression line between the concentrations over the 20-min sampling intervals was used to calculate gas fluxes (μL m−2 min−1) on a plot-by-plot basis (Parkin and Venterea, 2010; Rogers et al., 2014; Smartt et al., 2016; Della Lunga et al., 2021a). Negative slopes were not retained nor considered in this study following protocols and methodologies developed and published in previous studies (Parkin and Venterea, 2010; Rogers et al., 2014; Smartt et al., 2016; Della Lunga et al., 2021a).
Seasonal emissions (kg ha−1 season−1) were calculated through linear interpolation between measured fluxes on sequential sampling dates on a plot-by-plot basis. Global warming potential (GWP) values were also calculated on a plot-by-plot basis using conversion factors to obtain CO2 equivalents of 265 and 28 for N2O and CH4, respectively, according to the Intergovernmental Panel on Climate Change (IPCC) 6th assessment (IPCC, 2021). The 6th IPCC assessment adopted conversion factors for CH4 and N2O based on most recent studies and publications on GHGs (IPCC, 2021). Global warming potential was calculated including only CH4 and N2O due to the large, expected CO2 response. Seasonal emissions (kg ha−1 season−1) for each GHG were divided by the measured chamber yield (Mg ha−1 season−1; described below) to calculate emissions intensity [EI; kg GHG (Mg yield)−1]. The same procedure was used to calculate GWP emissions intensity [kg CO2eq. (Mg yield)−1]. The difference between raised beds and furrows with regard to GHG fluxes and emissions was not considered in this study, but future research should evaluate GHG emissions directly from both furrows and atop the raised beds to better estimate seasonal emissions at the field scale.
At the end of the growing season, on 11 September, 2022, plants were cut from inside the base collars at 2 cm from the soil surface, dried for 7 days at 55oC, then weighed to obtain vegetative dry matter on a plot-by-plot basis. Rice grains were manually separated from the panicles and weighed to determine grain yield, which was corrected to 12% moisture content for reporting purposes. A subsample of vegetative tissue and grain from each plot was ground and sieved through a 1-mm mesh screen and analyzed for total N concentration by high-temperature combustion (VarioMax CN analyzer, Elementar Americas Inc., Mt. Laurel, NJ) and for total P, K, Mg, and Zn concentrations by ICAPS after strong acid digestion as described in previous studies (Tucker, 1992; Nelson and Sommers, 1996; Rector et al., 2018; Della Lunga et al., 2021a). Measured dry matter and nutrient concentrations were used to calculate nutrient uptakes on a plot-by-plot basis. Dry matter and nutrient uptakes were converted to Mg ha−1 and kg ha−1 respectively, for reporting purposes.
Based on a split-plot design with fertilizer treatment as the whole-plot factor in a RCBD arrangement and time as the split-plot factor, a two-factor ANOVA was conducted using the PROC GLIMMIX procedure in SAS (version 9.4, SAS Institute, Inc., Cary, NC) and using a gamma data distribution to evaluate the effects of time as days after planting, fertilizer source, and their interaction on N2O, CH4, and CO2 fluxes. Based on the RCBD design of the whole-plot factor, a one-factor ANOVA was conducted using the PROC GLIMMIX procedure in SAS, using a gamma data distribution, to evaluate the effect of fertilizer source on seasonal GHG emissions and emissions intensities, GWP and GWP intensities, vegetative dry matter, grain yield, total aboveground dry matter (vegetative + grain dry matter), vegetative nutrient concentrations and uptakes, grain nutrient concentrations and uptakes, and total aboveground nutrient uptakes. A one-factor ANOVA was conducted using the PROC GLIMMIX procedure in SAS, using a normal data distribution, to evaluate the effect of fertilizer source on the soil property change, calculated as the end minus the beginning of the season. Externally studentized residuals were evaluated for each ANOVA performed and, as a result, no outliers were identified, thus no data points were removed for any tested variable. Homoskedasticity, normality, and independence of the residuals were visually checked. Significant treatment effects were judged at P < 0.05. When appropriate, means were separated with the least-significant-difference procedure at the alpha value of 0.05 (P < 0.05).
Meteorological parameters in 2022 depicted a growing season where air temperature was similar to, while precipitation was substantially divergent from the calculated 10-year average (2012–2021) and the 30-years normals for the study (Figure 2). From April to September 2022, monthly average air temperature had a RPD from the 10-years monthly average and the 30-years monthly normals < 7% (absolute value), except for May where the RPD was > 24% (absolute value). In April, May, and August, the air temperature in 2022 was, on average, lower than the respective 10-years monthly average and the 30-years monthly normals, while the opposite trend occurred in July (Figure 2). Averaged across the 6 months encompassing the 2022 growing season, the RPD for air temperature was < 6% (absolute value), highlighting how the 2022 year could be considered representative of the meteorological conditions reported within the region in the last 10 to 30 years (Figure 2).
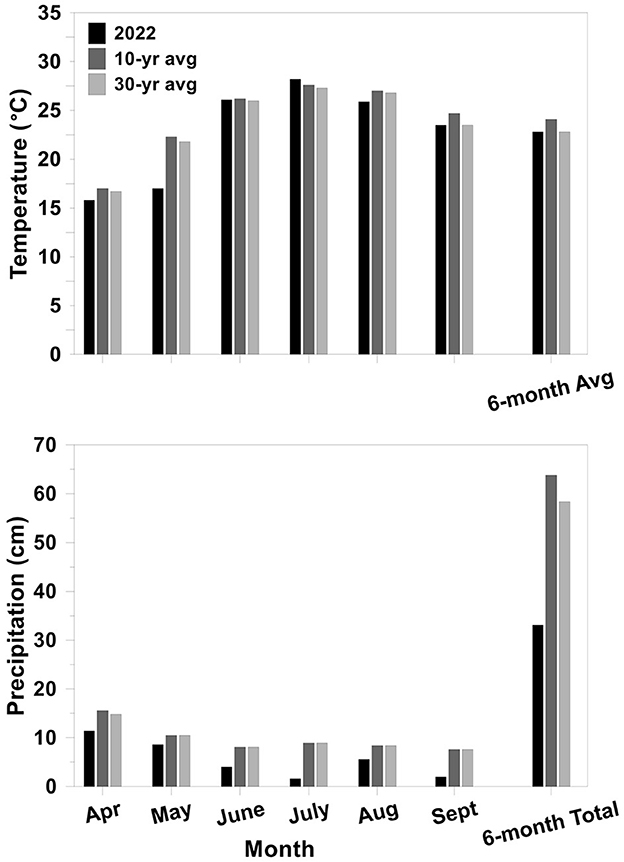
Figure 2. Summary of mean monthly air temperature and precipitation from April to September (Sept) and the 6-month average air temperature and 6-month total precipitation) for (i) the last 10 years (2012 to 2021; 10-years mean; SRCC, 2023) measured at the Rice Research and Extension Center near Stuttgart, AR, (ii) the 30-years means (1991 to 2020; 30-years mean; NCEI, 2023) from the near 30-years normals station.
In contrast to air temperature, precipitation during the 2022 growing season was lower than the 10-years monthly averages or 30-years monthly normals (Figure 2). Averaged across the 6 months encompassing the 2022 growing season, rainfall in 2022 was less than half of the 10-years average and the 30-years normals (Figure 2). However, when the amount of applied irrigation in 2022 (i.e., 44 cm) is added to the 6-month precipitation, the total amount of water that the field received was much closer to the 10-years average and 30-years normals (Figure 2). Irrigation is commonly used in agricultural settings to limit and reduce plant moisture stress and is applied in consideration of rainfall additions. Therefore, considering the combination of air temperature, precipitation, and applied irrigation, the 2022 growing season was reasonably representative of the typical regional meteorological conditions (NCEI, 2023) without having to repeat the field study during the subsequent growing season.
Soil physical and chemical properties were assessed at the beginning of the growing season, before any fertilizer treatment was applied. Throughout the entire study area, a textural class of silt loam was confirmed for the top 10 cm, with average sand, silt, and clay of 16%, 72%, and 12%, respectively (Brye et al., 2023). As described in Brye et al. (2023), all near-surface soil properties, except for pH, were within optimal ranges for furrow-irrigated rice production in Arkansas (Table 1). Soil K (131 to 175 mg kg−1), Ca (< 400 mg kg−1), Mg (< 30 mg kg−1), S (> 10 mg kg−1), Mn (> 40 mg kg−1) and Zn (> 4.1 mg kg−1) concentrations were within optimal soil-test ranges for rice cultivation according to University of Arkansas recommendations (Norman et al., 2013; UA-DA-CES, 2019; Table 1).
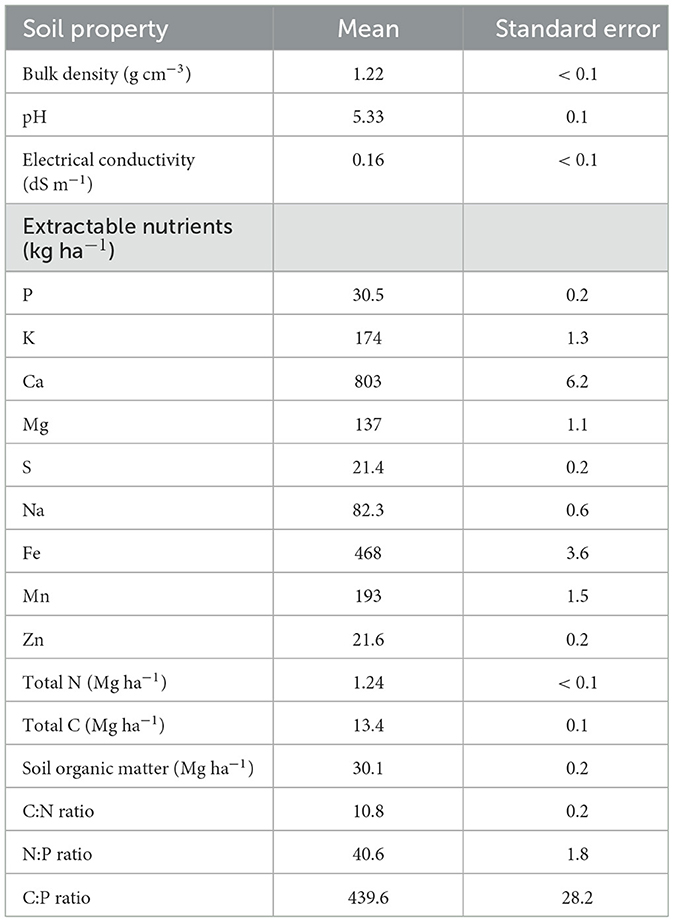
Table 1. Summary of soil physical and chemical properties (n = 3) in the top 10 cm of a silt-loam soil at the Rice Research and Extension Center near Stuttgart, AR from the beginning of the 2022 growing season at the up-slope position of a furrow-irrigated rice field (modified from Brye et al., 2023).
In contrast to many extractable soil nutrients, the mean measured soil pH (i.e., 5.3) was close to the lower limit (i.e., 5 to 6.5) for optimal rice cultivation (Havlin et al., 2014). Although the soil pH under flooded conditions tends to migrate close to neutrality due to the presence of the flood and resulting chemical interactions, in a furrow-irrigated setting, acidic soil conditions can persist and limit nutrient availability, specifically P, where P remains bound to Al and/or Fe oxides (Stevenson and Cole, 1999; Havlin et al., 2014). The extractable Fe content in the study area was lower than what was measured at the down-slope end of the same field in 2018 and 2019, where the presence of ponded water and reducing conditions likely resulted in the dissolution of some of the non-readily-available P (Della Lunga et al., 2021a). However, soil pH measured in the current study was within the range of values measured at the beginning of the 2018 and 2019 growing seasons in the same furrow-irrigated field (Della Lunga et al., 2021a,b), suggesting that soil-fertility-related parameters associated with furrow-irrigated rice represent a substantial deviation from under flood-irrigated rice conditions.
Despite the low soil pH status, extractable soil P was within the upper limit of the medium soil-test level (17 mg kg−1 to 25 mg kg−1) according to the University of Arkansas soil-test evaluations, which, in conjunction with the low soil pH, indicated a plant response from fertilizer-P applications was expected, but not definite (Table 1; UA-DA-CES, 2019). The near optimum soil-P level in the top 10 cm throughout the study area at the beginning of the growing season could have represented a limiting factor in the evaluation of fertilizer treatments. Furthermore, as rice roots developed, soil P from below the top 10 cm was easily accessible to provide an additional source of plant-available P that was not assessed at the beginning of the study. However, assessing the near-surface, soil-test P levels is common practice when deciding on a fertilizer-P recommendation.
Soil TN and TC were within the range reported by Roberts et al. (2012) from silt-loam soil series across the state of Arkansas in the top 15 cm (Table 1). Soil organic matter exceeded what is considered a minimum desirable level (2.5%) for crop production in Arkansas (Espinoza et al., 2018). The calculated C:N and both N:P and C:P ratios indicated that, upon fertilizer-N and -P application, rapid mineralization of inorganic N and microbial P immobilization were expected, respectively, to facilitate the evaluation of fertilizer sources in this study (Li et al., 2016; Sheng et al., 2022; Table 1).
Throughout the 2022 growing season, the numeric temporal trend of CH4 fluxes among fertilizers depicted fluctuations typically observed in the up-slope position of furrow-irrigated rice production systems, where the predominantly aerobic conditions limit the production of CH4 that, in such conditions, is highly regulated by rainfall events and irrigation application that increases soil's volumetric water content (VWC; Figure 3A; Della Lunga et al., 2023a). Multiple 2-weeks cycles, where numerically increasing fluxes are followed by numerically decreasing fluxes over a 14-day period, occurred from all fertilizer treatments during the first half of the growing season (i.e., within 60 days after planting), although the temporal fluctuations appear to be more pronounced from the ECST, ESN, and CT treatments (Figure 3A).
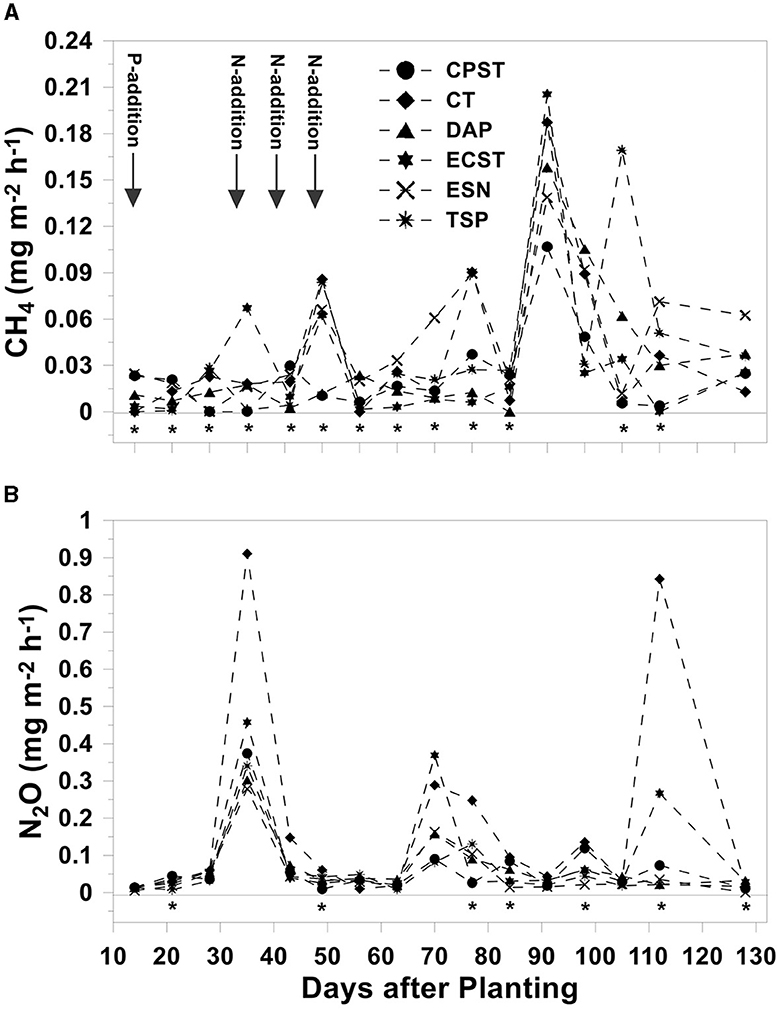
Figure 3. Methane (CH4; A) and nitrous oxide (N2O; B) fluxes, reported as least square means, among fertilizer treatments [i.e., triple superphosphate (TSP), chemically precipitated struvite (CPST), electrochemically precipitated struvite (ECST), diammonium phosphate (DAP), environmentally safe nitrogen (ESN) and unamended control (CT)] over time during the 2022 rice growing season at the Rice Research and Extension Center near Stuttgart, AR. Arrows indicate fertilizer addition for phosphorus (P-addition) at 14 days after planting (all treatments) and for nitrogen (N-addition) at 34 days after planting (all treatments) and at 41 and 48 days after planting (all treatments but ESN). Asterisks below the zero-flux line denote measurement dates when a significant (P < 0.05) treatment (i.e., fertilizer source) difference occurred. Note the different y-axis scales between the two response variables. Standard errors from the analysis of variance were 0.752 and 0.587 for CH4 and N2O, respectively.
Methane fluxes differed among fertilizer treatments over time (P < 0.001; Table 2). Methane fluxes differed from a flux of zero (P < 0.05) in all instances across the 16 sampling dates (Figure 3A). A significant difference among fertilizer treatments occurred on 13 of the 16 sampling dates (i.e., 14, 21, 28, 35, 43, 49, 56, 63, 70, 77, 84, 105, and 112 days after planting), except for 91, 98, and 128 days after planting (Figure 3A). Contrary to that hypothesized, ECST experienced an earlier peak CH4 flux (0.067 mg m−2 h−1) at 35 days after planting, while DAP showed almost no considerable fluctuation up to 90 days after planting (Figure 3A). The numerically largest CH4 flux peak occurred at 91 days after planting from ECST (0.21 mg m−2 h−1), which did not differ (P > 0.05) from fluxes measured from all fertilizer treatments at 91 days after planting and from all fertilizer treatments, except for ECST, at 98 days after planting (Figure 3A). The peak CH4 flux also did not differ from CPST at 43 and 77 days after planting, from ECST at 28, 49, 55, 105, and 128, from DAP at 105, 112, and 128, from TSP at 28, 49, 77, 84, 105, 112, and 128, from ESN at 49, 63, 70, 77, 112, and 128, and from CT at 49, 63, 77, and 112 days after planting (Figure 3A).
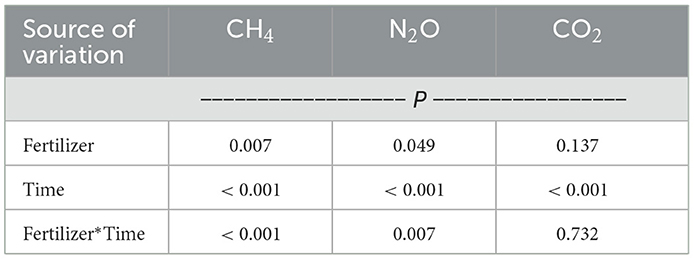
Table 2. Analysis of variance summary of the effects of fertilizer source (fertilizer), time (as days after planting; time), and their interaction on methane (CH4), nitrous oxide (N2O), and carbon dioxide (CO2) fluxes measured approximately weekly during the 2022 growing season at the up-slope position of a furrow-irrigated rice field at the Rice Research Extension Center (RREC) near Stuttgart, AR.
Measured CH4 flux differences and similarities could have been related to the low VWC during the first half of the growing season that may have affected fertilizer solubilization (Chien et al., 2011). Low soil VWC conditions could have enhanced the activity of organic acids produced by the roots, acting as solubilizing agents for struvite that is acid soluble, suggesting the struvite could constitute a more efficient fertilizer-P source in more aerobic conditions (Moussa et al., 2006; Valle et al., 2022). A significant, positive correlation (r = 0.41) between extractable soil P and CH4 fluxes was reported by Della Lunga et al. (2021a) in a study conducted in the same furrow-irrigated rice field in 2018 and 2019. The magnitude of CH4 fluxes reported in the current study was within the range of fluxes measured at the up-slope position under NT in the same field in 2018 and 2019 (Della Lunga et al., 2023a), indicating that upland (i.e., furrow-irrigated or row rice) rice cultivation is a minor source of CH4 (Figure 3A).
In contrast to CH4, the numeric temporal N2O flux trend depicted wider fluctuations in magnitude, but were distributed more uniformly among fertilizer treatments (Figure 3B). Three discernible N2O flux peaks occurred throughout the 2022 growing season at 35, 70, and 112 days after planting in almost all treatments (Figure 3B). During the first half of the growing season, similar to what was reported in previous studies in furrow-irrigated rice fields, N2O fluxes showed a rapid, increasing trend followed by a similarly steep decrease toward minimum fluxes (Della Lunga et al., 2021a; Karki et al., 2021; Slayden et al., 2021; Figure 3B). However, contrary to what has been previously reported in furrow-irrigated production systems (Della Lunga et al., 2021a; Karki et al., 2021; Slayden et al., 2021), during the second half of the growing season, more variations in N2O production and release were measured (Figure 3B).
Similar to CH4, N2O fluxes differed among fertilizer treatments over time (P = 0.014; Table 2). Nitrous oxide fluxes differed from a flux of zero (P < 0.05) under all instances, except at 35 days after planting from TSP, CPST, ECST, and CT and from ECST and CT at 70 and 112 days after planting, respectively (Figure 3B). The larger degree of N2O flux variability among fertilizer-treatment replicates at 35, 70, and 112 days after planting resulted in wide confidence intervals that included zero, meaning that there was larger variability among treatment replicates on these days compared to lower variability on other dates (i.e., day 20) where there was a significant difference among treatments, but the magnitude of the fluxes was numerically lower (Figure 3B). A significant difference in N2O fluxes among fertilizer treatments occurred only at 21, 49, 77, 84, 98, 112, and 128 days after planting (Figure 3B). Contrary to that hypothesized, no earlier nor later peak was reported from DAP or ECST, respectively, suggesting that mechanisms other than P availability played a role in N2O release (Figure 3B). The largest least square mean N2O flux was observed at 35 days after planting from the CT treatment (0.911 mg m−2 h−1), which did not differ from fluxes measured from all fertilizer treatments at 35, from CT and ECST at 70 and 112, and from CT at 77 days after planting (Figure 3B). The magnitude of N2O fluxes reported in the current study were similar to the range reported by Slayden et al. (2021) from the up-slope position of the NT portion of the same furrow-irrigated rice field in 2018 and 2019. To the authors' knowledge, no study has reported on N2O flux/emissions results from furrow-irrigated rice treated with any struvite-related material to date, making comparisons between results of the current study and other studies difficult.
Carbon dioxide fluxes and emissions in the current study are to be considered representative of soil respiration processes in general and do not depict the net production of CO2, where photosynthetic and metabolic processes represent the negative and positive pools, respectively, in a hypothetically C budget (Della Lunga et al., 2020a, 2021a, 2023a; Slayden et al., 2021). However, CO2 has a substantial effect on GWP estimates, thus measuring CO2 fluxes along with CH4 and N2O and the subsequent inclusion of CO2 in GWP estimates is more than warranted, where the exclusion of CO2 in GWP estimates would greatly under-estimate an ecosystem's contribution to global warming and potential climate change (Yang et al., 2017; Della Lunga et al., 2021a, 2023a).
The temporal CO2 flux trends in agricultural settings have been associated with plant growth stages over time (Yang et al., 2017; Della Lunga et al., 2021a, 2023a). While major temporal trends are mainly driven by plant, specifically root, respiration, temporal fluctuations between growth stages are mostly determined by soil temperature and solar radiation (Tong et al., 2011; Della Lunga et al., 2021b). In the current study, CO2 fluxes generally increased trend up to 70 days after planting, around the rice growth stage defined as panicle differentiation (Norman et al., 2013), followed by a decrease leading up to harvest (Figure 4). Contrary to what has been reported for rice cultivation under flooded conditions, no CO2 flux peak was reported at the end of the 2022 growing season during the soil drying processes (Figure 4; Yang et al., 2017). The removal of the flood a week or two before harvest is a required management step to enhance moisture transfer to the grain and often results in an increased release of GHG gases from the pedosphere to the atmosphere (Norman et al., 2013; Yang et al., 2017).
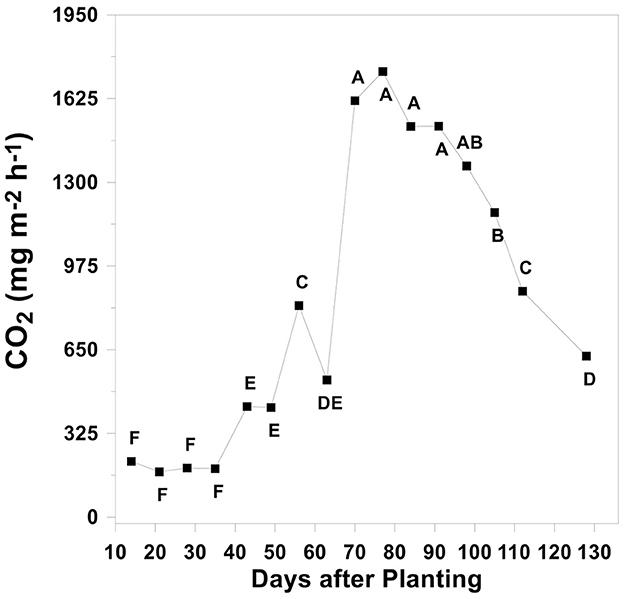
Figure 4. Carbon dioxide (CO2) fluxes, reported as least square means, over time during the 2022 rice growing season at the Rice Research and Extension Center near Stuttgart, AR. Data points with different letters denote a significant difference at the 0.05 level. The overall standard error from the analysis of variance was 0.096 for fluxes over time. Error bars on each data point represent the standard error of the mean for the specific measurement date.
Contrary to that hypothesized and in contrast to CH4 and N2O, CO2 fluxes differed only over time (P < 0.001) (Table 2). Carbon dioxide fluxes differed from a flux of zero (P < 0.05) on all 16 sampling dates (Figure 4). Averaged across fertilizer treatments, the greatest CO2 flux (1730 mg m−2 h−1) was measured at 77 days after planting, which did not differ from fluxes at 70, 84, 91, and 98 days after planting (Figure 4). The magnitude of CO2 fluxes reported in the current study over time were slightly greater than those measured at the up-slope/NT site position-tillage treatment combination in the same furrow-irrigated rice field in 2018 and 2019 (Della Lunga et al., 2023a). Inter-annual weather variability, specifically growing-season rainfall (Figure 2), likely was responsible for CO2 flux variations between the 2018/2019 and 2022 growing seasons.
Seasonal emissions in the current study need to be considered an overestimation of the actual net production of GHGs from the field to the atmosphere, due to the interpolation method and to the limits and methodological biases of the vented, non-flow-through, chamber approach as detailed by Parkin and Venterea (2010) and Wood et al. (2013). Interpolation techniques assume a constant relationship, often linear, between the interpolated values, which may not accurately represent the flux pattern between measurement dates due to heterogeneity in temporal fluxes (Wood et al., 2013). Regardless of the type of model chosen for flux interpolation, an interpolation bias is always assumed (Seok-In et al., 2013; Wood et al., 2013). The lack of fixed temporal and spatial patterns in GHG fluxes renders the choice of location in a field, time of day of the measurements, and duration of sampling as relevant parameters to capture average or representative fluxes rather than flux maxima or minima (Wood et al., 2013). As hypothesized, seasonal CH4 and CO2 emissions did not differ (P > 0.05), while N2O differed (P = 0.02) among fertilizer treatments (Table 3). Due to the different techniques used to measure and/or calculate fluxes and seasonal emissions and due to the lack of the temporal component associated with emissions, fluxes and emissions depict results that need to be evaluated separately.
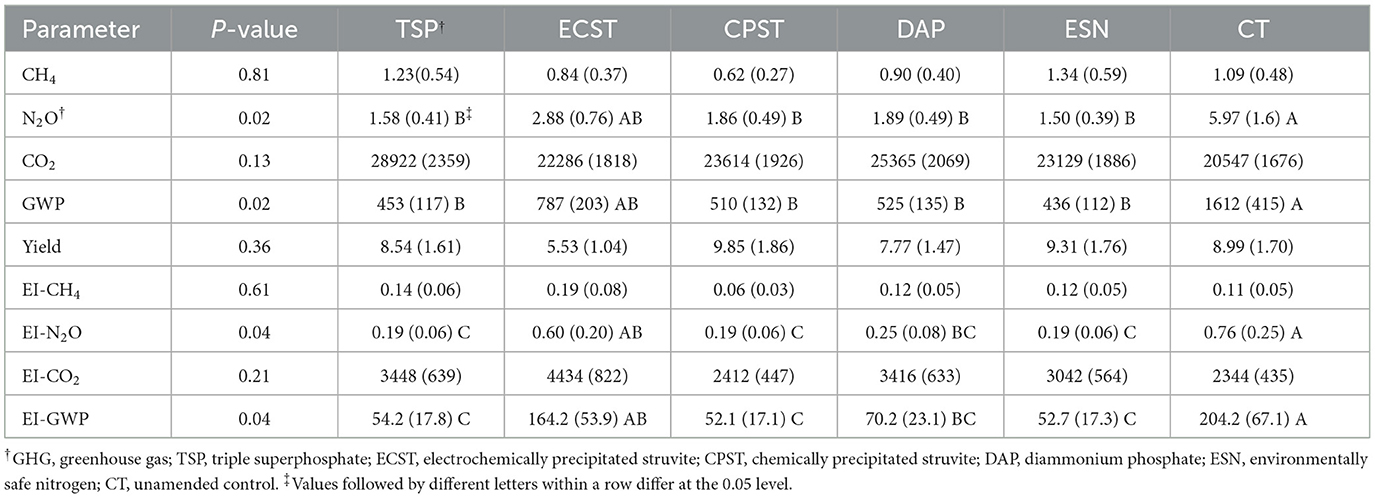
Table 3. Analysis of variance results for the effect of fertilizer treatment and summary of least square means with standard errors in parentheses for seasonal methane (CH4), nitrous oxide (N2O), carbon dioxide (CO2) emissions (kg ha−1 season−1) and emissions intensity [kg GHG (Mg yield)−1], global warming potential (GWP), yield (Mg ha−1), and emissions intensity for global warming potential (EI-GWP) calculated with conversion factors from 6th (GWP 6th; IPCC, 2021) IPCC assessment from the 2022 rice growing at the Rice Research and Extension Center near Stuttgart, AR.
Seasonal CH4 emissions ranged from 0.62 kg ha−1 season−1 from CPST to 1.34 kg ha−1 season−1 from ESN, with an overall mean of 1.0 kg ha−1 season−1, while seasonal CO2 emissions ranged from 20,547 kg ha−1 season−1 from CT to 28,922 kg ha−1 season−1 from TSP, with an overall mean of 23,977 kg ha−1 season−1 (Table 3). Soil macronutrients close to the optimal levels for rice production and the equal amount of fertilizer-P and -N applications across treatments throughout the growing season created a similar amount of substrate for microbial and phytological processes, resulting in no seasonal CH4 or CO2 emissions differences among fertilizer treatments (Table 3). While the generally visibly dry-soil conditions in the study area likely limited methanogenic activity, the amount of nutrients provided by the topsoil and fertilizers likely enhanced overall soil respiration, potentially resulting in relatively large CO2 emissions (Paustian et al., 1998; Della Lunga et al., 2023a; Table 3). Additionally, the relationship between CH4 emissions in rice fields and soil-P levels is strictly related to the rhizosphere activity (Lu et al., 1999), where methanogens are often concentrated. The methanogenic microorganisms associated with plant roots in rice production systems may have adapted to low-P conditions, partially explaining the inhibitory effect on CH4 production at larger soil-P levels (Conrad et al., 2000), as describes the field conditions of the current study. Soil-P conditions close to optimal levels may have caused decreased root exudation of organic C, specifically organic acids, providing less C substrate for methanogenic activity (Adhya et al., 1998). The availability of P in different ecosystems has often been correlated to the rate of microbial metabolic activity, without affecting abundance and composition of the microorganisms (Hui et al., 2019). Although characterized by different solubilities, all of the fertilizer-P treatments provided equal total nutrient amounts, partially explaining the relatively large CO2 emissions in the current study and the lack of differences among fertilizer-P treatments.
Seasonal CH4 and CO2 emissions reported in the current study were numerically lower and greater, respectively, than results reported by Della Lunga et al. (2023a) from the up-slope portion of a furrow-irrigated field on a silt-loam soil under NT management in east-central Arkansas. However, CH4 emissions were similar to those reported by Karki et al. (2021) from the upper portion of a furrow-irrigated rice field on a silty-clay soil in northeast Arkansas. Contrary to that hypothesized, N2O emissions were greater from CT (i.e., 5.97 kg ha−1 season−1), which did not differ from ECST, and were lowest from ESN (1.50 kg ha−1 season−1), which did not differ from TSP, CPST, ECST and DAP (Table 3). The slower release of N from ESN compared to coated urea likely limited the amount of substrate available for nitrification-denitrification processes, while, in the CT treatment, the lack of fertilizer-P application likely limited plant growth and plant nutrient uptake, leaving a greater amount of N in the soil available for microbial processes and N2O production (Table 3). Nitrous oxide emissions in the current study were at least two times lower than previously reported from furrow-irrigated rice fields on a silt-loam soil in east-central (Slayden et al., 2021) and on a silty-clay soil in northeast Arkansas (Karki et al., 2021).
As hypothesized, rice yield and CO2 and CH4 EI did not differ (P > 0.05) among fertilizer treatments (Table 3). Rice yields ranged from 5.53 Mg ha−1 from ECST to 9.85 Mg ha−1 from CPST, with an overall mean of 8.33 Mg ha−1, which was nearly identical to the 8.31 Mg ha−1 state average rice yield in 2022 across all rice production systems in Arkansas (USDA-NASS, 2023). The lack of a significant difference between ECST and CPST was related to a large degree of variability among replicates that resulted in an overall large confidence interval (Table 3).
Field studies are often exposed to environmental conditions that depict spatial variability, even within short distances, resulting in differential plant responses among replicates of the same treatments, as in the current study. The lack of significant differences in yield among fertilizer-P treatments indicated a similar plant response between all the plots, which was likely related to the near-optimum initial soil nutrient status throughout the study area and the equal total amounts of nutrients provided by the different fertilizers. However, the similar yields among treatments reinforced the validity of the slow-release fertilizers and emphasized the role of fertilizer solubility when significant differences among fertilizer-P treatments occurred, such as for N2O emissions (Table 3).
Similar to rice yield, CH4 and CO2 emissions intensities (EI-CH4 and EI-CO2, respectively) were unaffected by fertilizer treatment. Methane EI ranged from 0.06 kg CH4 (Mg yield)−1 from CPST to 0.19 kg CH4 (Mg yield)−1 from ECST, with an overall mean of 0.13 kg CH4 (Mg yield)−1, while EI-CO2 ranged from 2,344 kg CO2 (Mg yield)−1 from CT to 4,434 kg CO2 (Mg yield)−1 from ECST, with an overall mean of 3182 kg CO2 (Mg yield)−1 (Table 3). Estimated EIs in the current study were 900% and 30% lower for CH4 and CO2, respectively, than those reported by Della Lunga et al. (2023a) from the NT/up-slope tillage treatment-site position combination in a furrow-irrigated rice field on a silt-loam soil in east-central Arkansas.
In contrast to CH4 and CO2, but similar to seasonal N2O emissions, EI-N2O differed (P = 0.04) among fertilizer treatments (Table 3). As for seasonal emissions, and contrary to that hypothesized, EI-N2O was greater from CT [0.76 kg N2O (Mg yield)−1], which did not differ from ECST, and was lowest from ESN [0.19 kg N2O (Mg yield)−1], which equaled values from TSP, CPST, and DAP (Table 3). The significantly greater N2O emissions from CT and lower emissions from ESN, coupled with the numerically similar yields among treatments, were responsible for the EI-N2O results (Table 3), where the statistical differences were likely due to similar reason as for seasonal N2O emissions (Table 3).
Global warming potential was calculated using only seasonal CH4 and N2O emissions, excluding CO2 from the GWP calculation. As reported in previous studies, the magnitude and variance of CO2 emissions can mathematically absorb and mask trends and differences in CH4 and N2O contributions to GWP [Intergovernmental Panel on Climate Change (IPCC), 2014; Rector et al., 2018; Della Lunga et al., 2023a]. Additionally, due to the difficulty in controlling soil respiration, mitigation approaches primarily focus on CH4 and N2O regulation [Paustian et al., 1998; Intergovernmental Panel on Climate Change (IPCC), 2014].
Global warming potential and GWP intensity differed (P < 0.05) among fertilizer treatments (Table 3). Contrary to that hypothesized, GWP was greatest from CT (1612 kg CO2 eq. ha−1 season−1, standard error = 415), which did not differ from ECST, and was lowest from ESN (436 kg CO2 eq. ha−1 season−1, standard error = 112), which did not differ from TSP, ECST, CPST, and DAP (Table 3).
The difference in GWP estimates highlighted in the current study were mainly related to N2O's contribution to GWP (GWP-N2O; Table 4). With factors from the 6th IPCC assessment, GWP-N2O across fertilizer treatments was not lower than 90%, highlighting how upland rice cultivation should be mainly managed for N-loss reductions (Table 4). The GWP from CT was between 3.6 times numerically or significantly greater than from the other fertilized treatments (Tables 3, 4). Global warming potential estimates from the current study were substantially lower than those reported from flooded rice paddies in South Korea (9725 kg CO2 eq. ha−1 season−1), water-saving conditions (2114 kg CO2 eq. ha−1 season−1; Ahn et al., 2014), continuous irrigation (4380 kg CO2 eq. ha−1 season−1), and intermittent irrigation (3352 kg CO2 eq. ha−1 season−1; Ali et al., 2013), and from NT paddies in Spain under flooded conditions (8477 kg CO2 eq. ha−1 season−1) and sprinkler irrigation (1784 kg CO2 eq. ha−1 season−1; Fangueiro et al., 2017). However, GWP estimates from the current study were similar to those from rice paddies in US under alternate-wet-and-dry irrigation (1671 kg CO2 eq. ha−1 season−1; Linquist et al., 2015) and from cotton (Gossypium) fields in China under furrow irrigation (410 kg CO2 eq. ha−1 season−1; Wu et al., 2014). These results highlight how water and irrigation management represent an effective tool to mitigate GHGs and GWP across upland and lowland crops and climatic regions.
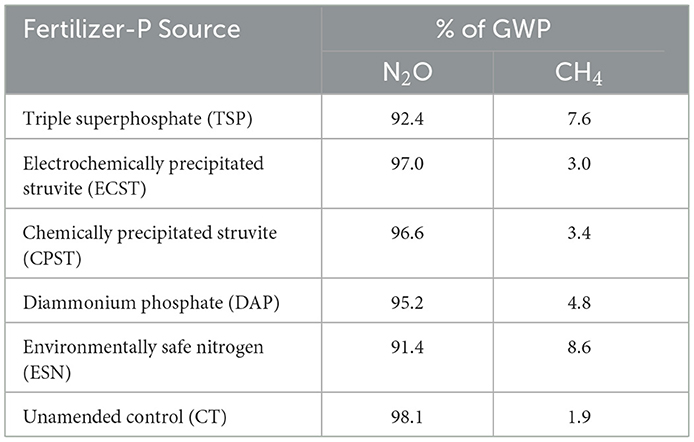
Table 4. Distribution of percentage of methane (CH4) and nitrous oxide (N2O) as carbon dioxide equivalents (CO2 eq.) for global warming potential (GWP), calculated according to the conversion factors reported in the 6th (CH4 = 28, and N2O = 265; IPCC, 2021) assessment among fertilizer-phosphorus (P) sources during the 2022 rice growing season at the Rice Research and Extension Center near Stuttgart, AR.
Similar to GWP, but contrary to that hypothesized, GWP intensity was greatest from CT for the 6th [204.2 kg CO2 eq. (Mg yield)−1] IPCC assessment and did not differ from ECST (Table 3). However, in contrast to GWP, GWP intensity was lowest from CPST from the 6th [52.1 kg CO2 eq. (Mg yield)−1] IPCC assessment and did not differ from TSP, DAP, and ESN (Table 3). The combination of numerically greater yield and lower seasonal N2O emissions from CPST and ESN resulted in a relatively low GWP intensity, suggesting that slow-release fertilizers could be an effective mitigation tool to reduce GHG emissions (Table 3). Although ECST is generally considered a slow-release fertilizer in the absence of substantial evidence to the contrary, the crystalline-flaky constitution of ECST could have affected ECST's solubility and soil behavior, due to the greater surface area of the ECST crystalline flakes compared to the pelletized fertilizers that can enhance dissolution processes, suggesting that further studies should evaluate the behavior of ECST mass-produced in pelletized form. Global warming potential intensities from the current study were similar to those reported in previous research from furrow-irrigated rice fields in Arkansas (Karki et al., 2021; Slayden et al., 2021; Della Lunga et al., 2023a).
Plant nutrient concentrations and uptakes reflect the nutrient status at the end of the growing season at harvest time and are intended to represent the culmination of uptake and translocation processes (Masclaux-Daubresse et al., 2010). However, the portion of macro- and micronutrients coming from the fertilizer applications and the portion coming from the pedosphere was not independently determined, meaning that plant nutrient concentrations and uptakes reported in the current study have been supplied collectively by the native soil's nutrient pool and by the inorganic fertilizer additions and cannot be used to determine fertilizer-nutrient-use efficiency (Singh et al., 2021).
As hypothesized, all aboveground plant properties measured in the study were unaffected (P > 0.05) by fertilizer treatment. The near-optimum initial soil nutrient levels, specifically soil P, in the top 10 cm, coupled with the plant roots' ability to secure nutrients from below the top 10 cm, which was not assessed early in the growing season, likely provided sufficient nutrient supplies and buffered the rice plants from any nutrient shortfall to minimize significant differences in plant response among the various fertilizer treatments. Although the initial, near-optimum soil-test P status of the study area could have masked the effects of the fertilizer treatments, the current project still provided useful information and guidance for agronomic and environmental management practices.
Averaged across fertilizers, aboveground tissue N, P, K, Mg, and Zn concentrations were 0.92, 0.07, 1.97, 0.18%, and 188 mg kg−1, respectively. Plant tissue concentrations in the current study were within or above the optimal levels of N (0.65% to 0.8%), K (1.55% to 2.0%), Mg (0.25% to 0.3%), and Zn (25 mg kg−1 to 50 mg kg−1) in rice vegetative tissue at maturity (Linquist, 2020). However, plant tissue P concentration was below the optimal P level for rice tissue at maturity (0.1 to 0.15%) but was above the critical level for deficiency (< 0.06%; Linquist, 2020). Vegetative dry matter (VDM) across fertilizer treatments averaged 11.2 Mg ha−1 and, together with measured tissue concentrations, N, P, K, Mg and Zn uptakes averaged 99.8 kg ha−1, 8.1 kg ha−1, 216 kg ha−1, 19.4 kg ha−1, and 2.11 kg ha−1, respectively. Rice grain nutrient concentrations averaged 1.54% N, 0.24% P, 0.28% K, 0.10% Mg, and 37.5 mg Zn kg−1 across fertilizer treatments. Measured rice yields, coupled with measured grain concentrations, resulted in mean nutrient uptakes of 125 kg ha−1, 20.2 kg ha−1, 23.4 kg ha−1, 8.1 kg ha−1, and 0.31 kg ha−1 for N, P, K, Mg, and Zn, respectively. Combining VDM and grain uptakes, total aboveground nutrient uptakes across all treatments averaged 224 kg ha−1, 28.3 kg ha−1, 240 kg ha−1, 27.5 kg ha−1, and 2.42 kg ha−1 for N, P, K, Mg, and Zn, respectively. Although to date, to the authors' knowledge, no studies on furrow-irrigated rice have reported optimal nutrient concentration in vegetative and grain tissues, the macro- and micro nutrient uptakes reported in the current study were, in all instances, near the upper limit of agronomic evaluations for upland rice on silt-loam soils in Arkansas (Chlapecka, 2021).
The change in soil properties throughout the 2022 rice growing season was calculated as end-of-season minus beginning-of-season properties on a plot-by-plot basis. A positive difference in soil properties indicated an accumulation process, while a negative difference indicated a removal (i.e., plant uptake/consumption) process and/or chemical alteration. The accumulation and removal processes occurred as a combination of biotic and abiotic mechanisms. However, the specific processes that resulted in accumulation or removal were not determined.
Except for soil pH, and contrary to that hypothesized, changes in all other measured soil properties in the top 10 cm throughout the 2022 growing season did not differ (P > 0.05) among fertilizer treatments (Table 5). However, soil pH had a positive difference, thus soil pH increased (P < 0.01), over time in all treatments, indicating an accumulation of hydroxyl radicals (OH−) or a consumption of hydrogen ions (H+) across all fertilizer treatments (Table 5). Soil acidification is mainly due to the export of hydrogen ions by rice roots in order to balance the intake of cations from the soil solution, a balance that is related to the form of N taken up (Nye, 1986). The largest soil pH increase occurred from ESN (0.64 units), which did not differ from CPST and CT, while the lowest soil pH increase occurred from ECST (0.09 units), which did not differ from TSP and DAP (Table 5). In all fertilizer treatments, soil conditions remained acidic throughout the growing season, a condition substantially divergent from what has been reported under flooded-soil conditions, where soil pH tends to increase and achieve near-neutral conditions [Intergovernmental Panel on Climate Change (IPCC), 2014]. Increasing soil pH can result in a greater availability of acetate and rhizodeposition that provide substrate for methanogenic activity (Ye et al., 2013). The large soil pH increase from ESN achieved values closer to the optimum pH range for methanogen activity (i.e., 6.5 to 7.5), likely explaining the numerically greater CH4 emissions from ESN compared to the other fertilizer treatments (Tables 3, 5).
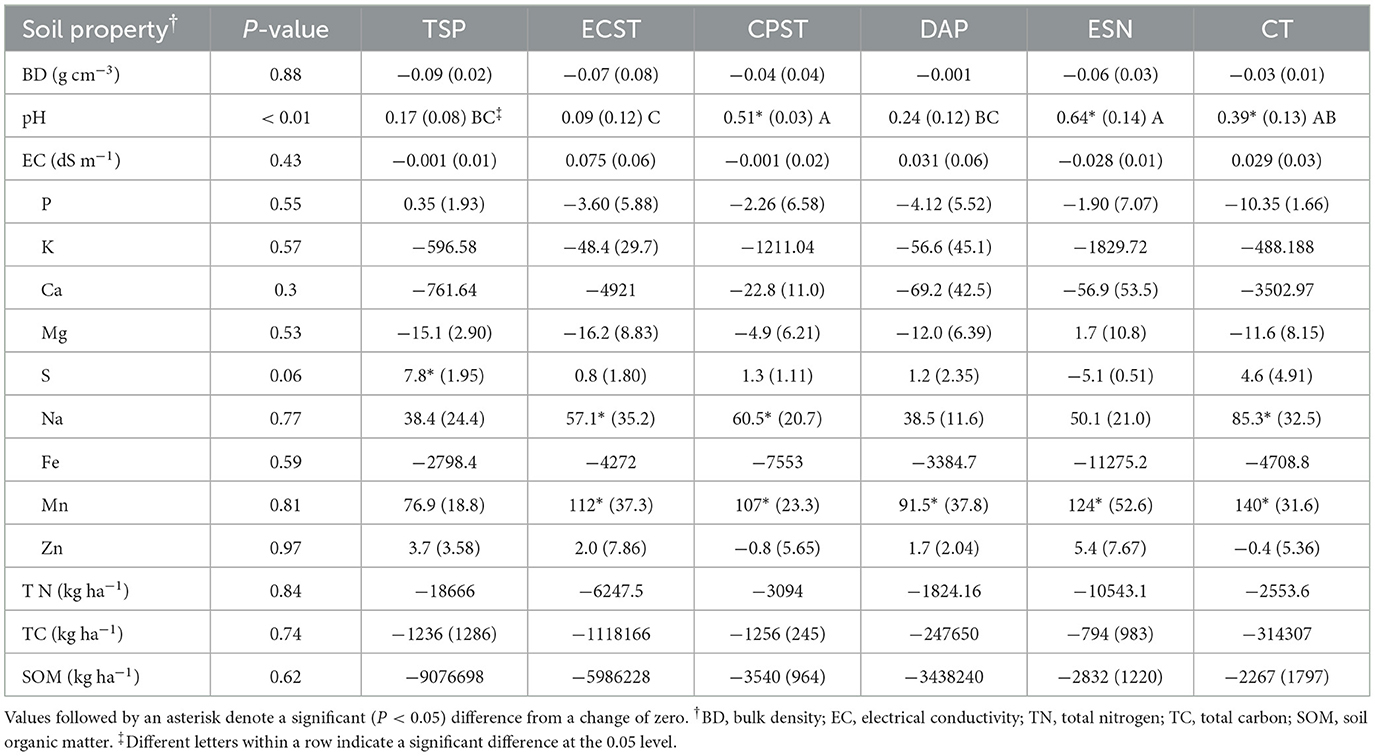
Table 5. Analysis of variance results for the effect of fertilizer treatment [i.e., triple superphosphate (TSP), chemically precipitated struvite (CPST), electrochemically precipitated struvite (ECST), diammonium phosphate (DAP), environmentally safe nitrogen (ESN) and unamended control (CT)] and least square means summary with standard errors in parentheses for the soil property difference (i.e., end minus beginning) for the 2022 rice growing season at the Rice Research and Extension Center near Stuttgart, AR.
Among the soil properties considered in this study, BD and extractable soil K, Ca, and Fe, and TN, TC, and SOM contents decreased over the growing season in all treatments, by means of −0.06 g cm−3 and −63.1 kg ha−1, −38.2 kg ha−1, −156 kg ha−1, −204 kg ha−1, −1437 kg ha−1, and −1690 kg ha−1, respectively (Table 5). In contrast, extractable soil Na and Mn increased over the growing season in all treatments (i.e., 59.5 kg ha−1 and 119 kg ha−1, respectively; Table 5). Soil EC and extractable soil P, Mg, S, and Zn experienced increases and decreases over time across treatments, with overall means of 0.018 ds m−1 and −1.97 kg ha−1, −2.2 kg ha−1, 2.9 kg ha−1, and 3.1 kg ha−1, respectively (Table 5). Soil properties changes over time were significantly different than a change of zero (P < 0.05) in all treatments for extractable soil Fe and Mn and TN, but did not differ from a change of zero (P > 0.05) in all treatments for soil EC and extractable soil P, Mg, and Zn. Additionally, soil BD differences did not differ from zero (P > 0.05) in all treatments, except for DAP where soil BD decreased over time, while extractable soil S differences also did not differ from zero (P > 0.05) in all treatments, except for TSP where extractable soil S increased over time (Table 5). Extractable soil Ca differences did not differ from zero (P > 0.05) in DAP, CPST, and ESN and soil pH differences did not differ from zero (P > 0.05) in DAP, ECST, and TSP (Table 5). Soil OM differences did not differ from zero (P > 0.05) in CPST, ESN, and CT and soil Na differences did not differ from zero (P > 0.05) in DAP, ESN, and TSP (Table 5). Soil TC differences did not differ from zero (P > 0.05) in CPST, ESN, and TS and soil K differences did not differ from zero (P > 0.05) in DAP and ECST (Table 5).
While the decreasing temporal trends measured for extractable soil P, K, Ca, and Mg can be attributed to plant uptake processes (Stevenson and Cole, 1999; Julia et al., 2016; Dhillon et al., 2019), similar temporal trends for extractable soil Fe and TN, TC, and SOM were indicative of predominantly aerobic soil conditions, where redox-active minerals are oxidized, inorganic minerals are mineralized, and organic material is rapidly decomposed (Table 5; Ponnapempura, 1972). The accumulation of soil Mn likely was related to the acidic conditions that can solubilize Mn into soil solution even in aerobic conditions (Goth and Patrick, 1972). The lack of differences in soil properties changes among fertilizer treatments was likely due to the large initial soil nutrient levels at the beginning of the growing season and to the analysis being limited to only one growing season. The wet and dry cycles that commonly occur in the up-slope portion of furrow-irrigated rice fields (Della Lunga et al., 2020b) likely contributed to the accumulation of extractable Na in the topsoil as evaporation water losses left salts, particularly Na, behind to be concentrated in the near-surface soil (Table 5). Changes in soil properties over the course of the growing season can provide useful information to develop management practices tailored to furrow irrigation settings. However, further studies should evaluate the long-term effects of fertilizer-P and -N sources on agronomic and environmental soil parameters.
The frequency of furrow-irrigated rice production systems is increasing in the US and specifically in Arkansas. The divergent conditions of furrow irrigation compared to the more traditional flood-irrigation management practices in rice require detailed analyses and evaluations of agronomic and environmental implications to define proper management for furrow-irrigated rice. Among the agronomic challenges in furrow irrigation, P represents the most difficult to manage due to the effects of irrigation on soil-P distribution in the upper soil profile. Along with challenging P management, furrow-irrigated systems can also experience substantial N losses due to fluctuating soil moisture. From the environmental standpoint, there is a lack of research on the overall impact of P and N fertilization on direct and/or indirect GHG production and release. Slow-release fertilizers, like struvite materials, were tested as a potential mitigation tool to reduce GHG emissions, maintain agronomic production, and improve sustainability in furrow-irrigated rice systems.
Temporal trends in GHG fluxes were mainly related to irrigation applications during the first half of the season that slowly increased VWC, reaching levels within a conductive range for methanogenic and nitrification-denitrification processes. Results did not support the hypothesis that DAP and ECST would have an earlier and later peak, respectively, for the three GHGs. Results supported the hypothesis that seasonal CH4 and CO2 emissions, emissions intensities, yield, and end-of-season plant properties would not differ among fertilizer treatments. Results did not support the hypothesis that DAP would have the greatest and ECST the lowest seasonal N2O emissions, GWP, and GWP intensity. Results of this study also did not support the hypothesis that ECST and CPST would have the least negative change in soil P, TC, TN, SOM contents.
Results of the current study suggest that, when soil fertility is at or close to optimum, alternative fertilizer-P sources, such as ECST and CPST, and alternative fertilizer-N sources, such as ESN, can perform as well as more commonly applied fertilizer-nutrient sources, such as DAP and TSP. Results demonstrated that the contribution of N2O to GWP across fertilizer treatments exceeded 80%, highlighting how upland rice cultivations should be mainly managed to mitigate gaseous-N losses. The combination of numerically greater yield and lower seasonal N2O emissions from CPST and ESN resulted in low GWP intensities, suggesting that slow-release fertilizers could constitute an effective mitigation tool to reduce GHG emissions from furrow-irrigated rice. Future studies should evaluate the long-term environmental sustainability of slow-release fertilizer-P and -N sources in order to develop mitigation approaches tailored to the dynamic environmental conditions and the challenging agronomic management of furrow-irrigated rice production systems.
The raw data supporting the conclusions of this article will be made available by the authors, without undue reservation.
DD: Conceptualization, Data curation, Formal analysis, Investigation, Methodology, Validation, Writing – original draft. KB: Conceptualization, Data curation, Funding acquisition, Investigation, Methodology, Project administration, Supervision, Writing – review & editing. TR: Writing – review & editing. JB: Investigation, Methodology, Writing – review & editing. ME-W: Writing – review & editing. CH: Investigation, Methodology, Writing – review & editing. DL: Writing – review & editing. CA: Investigation, Methodology, Writing – review & editing.
The author(s) declare financial support was received for the research, authorship, and/or publication of this article. Funding for this work was provided by a grant from the USDA-NIFA-AFRI Water Food Production Systems program (Grant Number: 2018-68011-28691).
The authors declare that the research was conducted in the absence of any commercial or financial relationships that could be construed as a potential conflict of interest.
All claims expressed in this article are solely those of the authors and do not necessarily represent those of their affiliated organizations, or those of the publisher, the editors and the reviewers. Any product that may be evaluated in this article, or claim that may be made by its manufacturer, is not guaranteed or endorsed by the publisher.
1. ^Brye, J., Della LUnga, D., and Brye, K. (2023b). Rice response to struvite and other phosphorus fertilizers in a phosphorus-deficient soil under simulated furrow -irrigation. J. Soil Sci. Plant. Nutr. (Submitted).
Abbade, E. B. (2020). Land and water footprints associated with rice and maize losses in Brazil. Land Use Policy 99, 105106. doi: 10.1016/j.landusepol.2020.105106
Adhya, T. K., Pattnaik, P., Satpathy, S. N., Kumaraswamy, S., and Sethunathan, N. (1998). Influence of phosphorus application on methane emission and production in flooded paddy soils. Soil Biol. Biochem. 30, 177–181. doi: 10.1016/S0038-0717(97)00104-1
Ahn, J. H., Choi, M. Y., Kim, B. Y., Lee, J. S., Song, J., Kim, G. Y., et al. (2014). Effects of water-saving irrigation on emissions of greenhouse gases and prokaryotic communities in rice paddy soil. Microb. Ecol. 68, 271–283. doi: 10.1007/s00248-014-0371-z
Ali, M. A., Hoque, M. A., and Kim, P. J. (2013). Mitigating global warming potentials of methane and nitrous oxide gases from rice paddies under different irrigation regimes. Ambio 42, 357–368. doi: 10.1007/s13280-012-0349-3
Anderson, R., Brye, K. R., Greenlee, L., Roberts, T. L., and Gbur, E. (2021). Wastewater-recovered struvite effects on total extractable phosphorus compared with other phosphorous sources. Agrosyst. Geosci. Environ. 4, e20154. doi: 10.1002/agg2.20154
Arnfield, J. A. (2016). Koppen Climate Classification. Encyclopædia Britannica. Encyclopædia Britannica Inc. Available online at: https://www.britannica.com/science/Koppen-climate-classification (accessed July 22, 2023).
Bacon, P. E., and Davey, B. G. (1982). Nutrient availability under trickle irrigation: distribution of water and Bray no.1 phosphate. Soil Sci. Soc. Am. J. 46, 981–987. doi: 10.2136/sssaj1982.03615995004600050019x
Bar-Yosef, B., Sagiv, B., and Markovitz, T. (1989). Sweet corn response to surface and subsurface trickle phosphorus fertigation. Agron. J. 81, 443–447. doi: 10.2134/agronj1989.00021962008100030009x
Brye, J. B., Della Lunga, D., Brye, K. R., Arel, C., and Ylagan, S. (2023). Phosphorus fertilizer effects on near-surface soil aggregation in furrow-irrigated rice on a silt-loam soil. Agric. Sci. 14, 819–842. doi: 10.4236/as.2023.146055
Cabeza, R., Steingrobe, B., Römer, W., and Claassen, N. (2011). Effectiveness of recycled P products as P fertilizers as evaluated in pot experiments. Nutri. Cycl. Agroecosyst. 91, 173–184. doi: 10.1007/s10705-011-9454-0
Chien, S. H., Prochnow, L. I., Tu, S., and Snyder, C. S. (2011). Agronomic and environmental aspects of phosphate fertilizers varying in source and solubility: an update review. Nutri. Cycl. Agroecosyst. 89, 229–255. doi: 10.1007/s10705-010-9390-4
Chlapecka, J. L. (2021). Evaluation of Irrigation and Nutrient Management Strategies in Rice Using Alternative Irrigation Methods. Arkansas: Graduate Theses and Dissertations, University of Arkansas.
Conrad, R., Klose, M., and Claus, P. (2000). Phosphate inhibits acetotrophic methanogenesis on rice roots. Appl. Environ. Microbiol. 66, 828–831. doi: 10.1128/AEM.66.2.828-831.2000
Della Lunga, D., Brye, K. R., Roberts, T., Henry, C. G., Evans-White, M., Lessner, D., et al. (2023b). Struvite effects on rice growth and productivity under flood-irrigation in the greenhouse. Agric Sci. 14, 864–877. doi: 10.4236/as.2023.147058
Della Lunga, D., Brye, K. R., Roberts, T. L., and Lebeau, S. G. (2020a). Water management effects on trace gas emissions under greenhouse conditions from direct-seeded hybrid rice in a silt-loam soil. J. Rice Res. Dev. 3, 95–102. doi: 10.36959/973/426
Della Lunga, D., Brye, K. R., Slayden, J. M., and Henry, C. G. (2021b). Plant productivity and nutrient uptake as affected by tillage and site-position in furrow-irrigated rice. Agron. J. 113, 2374–2386. doi: 10.1002/agj2.20640
Della Lunga, D., Brye, K. R., Slayden, J. M., and Henry, C. G. (2023a). Evaluation of site position and tillage effects on global warming potential from furrow-irrigated rice in the mid-southern USA. Geoderma Reg. 32, e00625. doi: 10.1016/j.geodrs.2023.e00625
Della Lunga, D., Brye, K. R., Slayden, J. M., Henry, C. G., and Park, S. (2021c). Diurnal variation of trace gas fluxes during the vegetative lag phase in furrow-irrigated rice production. J. Rice Res. Dev. 4, 338–350. doi: 10.36959/973/432
Della Lunga, D., Brye, K. R., Slayden, J. M., Henry, C. G., and Wood, L. S. (2020b). Soil moisture, temperature, and oxidation-reduction potential fluctuations across a furrow-irrigated rice field on a silt-loam soil. J. Rice Res. Dev. 3, 103–114. doi: 10.36959/973/427
Della Lunga, D., Brye, K. R., Slayden, J. M., Henry, C. G., and Wood, L. S. (2021a). Relationships among soil factors and greenhouse gas emissions from furrow-irrigated Rice in the mid-southern, USA. Geoderma Reg. 24, e00365. doi: 10.1016/j.geodrs.2021.e00365
Deng, Y., Men, C., Qiao, S., Wang, W., Gu, J., Liu, L., et al. (2020). Tolerance to low phosphorus in rice varieties is conferred by regulation of root growth. Crop J. 8, 534–547. doi: 10.1016/j.cj.2020.01.002
Dhillon, J. S., Eickhoff, E. M., Mullen, R. W., and Raun, W. R. (2019). World potassium efficiency in cereal crops. Agron. J. 111, 889–896. doi: 10.2134/agronj2018.07.0462
Di Tommasi, D., Chatterjee, I., Barrios-Masias, N., Zhou, F. H. Q., Gu, C., and Margenot, A. J. (2021). Arbuscular mycorrhizae increase biomass and nutrient uptake of tomato fertilized with struvite compared to monoammonium phosphate. Plant Soil 464, 321–333.
Espinoza, L., Slaton, N., and Mozaffari, M. (2018). Understanding the Numbers on Your Soil Test Report. Agriculture and Natural Resources, FSA2118. Available online at: https://www.uaex.uada.edu/publications/PDF/FSA-2118.pdf (accessed July 22, 2023).
Fan, C., Wang, P., Zhou, W., He, S., Huang, J., Cao, L., et al. (2018). The influence of phosphorous on the autotrophic and mixotrophic denitrification. Sci. Tot. Environ. 643, 127–133. doi: 10.1016/j.scitotenv.2018.06.185
Fangueiro, D., Becerra, D., Albarrán, A., Peña, D., Sanchez-Llerena, J., Rato-Nunes, J. M., et al. (2017). Effect of tillage and water management on GHG emissions from Mediterranean rice growing ecosystems. Atmos. Environ. 150, 303–312. doi: 10.1016/j.atmosenv.2016.11.020
Gangopadhyay, S., Banerjee, R., Batabyal, S., Das, N., Mondal, A., Pal, S. C., et al. (2022). Carbon sequestration and greenhouse gas emissions for different rice cultivation practices. Suistain. Prod. Consum. 34, 90–104. doi: 10.1016/j.spc.2022.09.001
Gee, G. W., and Or, D. (2002). “Particle-size analysis,” in Method of Soil Analysis, Part 4: Physical Methods, 1st Edn, eds, J. H. Dane, G. C. Topp, G. C. (Madison, WI: Soil Science Society of America), 255–293.
Goth, S., and Patrick, W. H. (1972). Transformation of manganese in a waterlogged soil as affected by redox potential and pH. Soil Sci. Soc. Am. J. 36, 738–742. doi: 10.2136/sssaj1972.03615995003600050018x
Hardke, J. T. (2020a). “Trends in Arkansas rice production 2019,” in B.R. Wells Arkansas Rice Research Studies, 2020. eds, R. J. Norman, and K. A. K. Moldenhauer (Fayetteville: AR, AES), 11–17.
Hardke, J. T. (2020b). Furrow-Irrigated Rice Handbook. Little Rock: University of Arkansas Co-operative Extension Service.
Havlin, J. L., Tisdale, S. L., Nelson, W. L., and Beaton, J. D. (2014). Soil Fertility and Fertilizers: An Introduction to Nutrient Management, 8th Edn. London: Pearson Education Inc.
He, C. (2010). Effects of furrow irrigation on the growth, production, and water use efficiency of direct sowing rice. Sci. World J. 10, 1483–1497. doi: 10.1100/tsw.2010.146
Hefner, S. G., and Tracy, P. W. (2013). The effect of nitrogen quantity and application timing on furrow-irrigated rice. J. Prod. Agric. 4, 541–546. doi: 10.2134/jpa1991.0541
Hertzberger, A. J., Cusick, R. D., and Margenot, A. J. (2020). A review and meta-analysis of the agricultural potential of struvite as a phosphorus fertilizer. Soil Sci. Soc. Am. J. 84, 653–671. doi: 10.1002/saj2.20065
Hui, D., Porter, W., Phillips, J. R., Aidar, M. P. M., Lebreux, S. J., Schadt, C. W., et al. (2019). Phosphorous rather than nitrogen enhances CO2 emissions in tropical forest soils: evidence from a laboratory incubation study. Eur. J. Soil Sci. 1, 1–16.
Intergovernmental Panel on Climate Change (IPCC). (2014). Climate Change 2014: Impacts, Adaptation, and Vulnerability Working Group II Contribution to the Fifth Assessment Report. New York, NY: Cambridge University Press.
IPCC. (2021). “Global Carbon and other Biogeochemical Cycles and Feedbacks,” in Climate Change 2021: The Physical Science Basis. Contribution of Working Group I to the Sixth Assessment Report of the Intergovernmental Panel on Climate Change, eds J. G. Canadell, P. M. S. Monteiro, M. H. Costa, and L. Cotrim da Cunha (New York, NY: Cambridge University Press), 673–816.
Ippolito, J. A., Bjorneberg, D. L., Blecker, S. W., and Massey, M. S. (2019). Mechanisms responsible for soil phosphorus availability differences between sprinkler and furrow irrigation. J. Environ. Qual. 48, 1370–1379. doi: 10.2134/jeq2019.01.0016
Julia, C., Wissuwa, M., Kretzschmar, T., Jeong, K., and Rose, T. (2016). Phosphorous uptake, partitioning and redistribution during grain filling in rice. Ann. Bot. 118, 1151–1162. doi: 10.1093/aob/mcw164
Kandpal, V. (2018). Evaluation of a Solar Powered Flow Tail Water Recovery System for Furrow Irrigation [MS Thesis] Fayetteville: University of Arkansas.
Karki, S., Adviento-Borbe, M. A. A., Massey, J. H., and Reba, M. L. (2021). Assessing seasonal methane and nitrous oxide emissions from furrow-irrigated rice with cover crops. Agriculture 11, 261. doi: 10.3390/agriculture11030261
Latifian, M., Liu, J., and Mattiasson, B. (2012). Struvite-based fertilizer and its physical and chemical properties. Environ. Techol. 33, 2691–2697. doi: 10.1080/09593330.2012.676073
Li, H., Yang, X., Weng, B., Su, J., Nie, S., Gilbert, J. A., et al. (2016). The phenological stage of rice growth determines anaerobic ammonium oxidation activity in rhizosphere soil. Soil Biol. Biochem. 100, 59–65. doi: 10.1016/j.soilbio.2016.05.015
Linquist, B. (2020). Optimal and Critical Nutrient Concentrations in Rice Tissue. Agronomy Research and Information Center. Available online at : https://agric.ucdavis.edu/sites/g/files/dgvnsk12316/files/inline-files/330509.pdf (accessed July 22, 2023).
Linquist, B. A., Anders, M. M., Adviento-Borbe, M. A. A., Chaney, R. L., Nalley, L. L., Rosa, D., et al. (2015). Reducing greenhouse gas emissions, water use, and grain arsenic levels in rice systems. Glob. Chang. Biol. 21, 407–417. doi: 10.1111/gcb.12701
Lu, Y., Wassmann, R., Neue, H. U., and Huang, C. (1999). Impact of phosphorous supply on root exudation, aerenchyma formation and methane emission of rice plants. Biogeochem. 47, 203–218. doi: 10.1007/BF00994923
Masclaux-Daubresse, C., Daniel-Vedele, F., Dechorgnat, J., Chardon, F., Gaufichon, L., Suzuki, A., et al. (2010). Nitrogen uptake, assimilation and remobilization in plants: challenges for sustainable and productive agriculture. Ann. Bot. 105, 1141–1157. doi: 10.1093/aob/mcq028
Mori, A., Fukuda, T., Vejchasarn, P., Nestler, J., Pariasca-Tanaka, J., Wissuwa, M., et al. (2016). The role of root size versus root efficiency in phosphorus acquisition in rice. J. Exp. Bot. 67, 1179–1189. doi: 10.1093/jxb/erv557
Moussa, S. B., Maurin, C., Gabrielli, C., and Amor, M. B. (2006). Electrochemical precipitation of struvite. Electrochem. Solid-State Lett. 9, 97–101. doi: 10.1149/1.2189222
NCEI (2023). Data Tools: 1981-2010 Climate Normals. Available online at : https://data.noaa.gov/onestop/collections?q=%22NOAA%20Climate%20Data%20Record%22andg=-92.7686,34.3776,-91.4667,35.3646andgr=i (accessed July 22, 2023).
Nelson, D. W., and Sommers, L. E. (1996). “Total carbon, organic carbon, and organic matter,” in Methods of Soil Analysis. Part 3: Chemical Analysis, 3rd Edn, eds, D. L. Sparks, A. L. Page, P. A. Helmke, R. H. Loeppert (Madison, WI: Soil Science Society of America), 961–1010.
Ning, J., Arai, Y., Shen, J., Wang, R., and Ai, S. (2021). Effects of phosphorous on nitrification process in a fertile soil amended with urea. Agriculture 11, 523–535. doi: 10.3390/agriculture11060523
Norman, R. J., Slaton, N. A., and Roberts, T. (2013). “Soil fertility,” in Rice Production Handbook, ed J. T. Hardke (Fayetteville, AR: University of Arkansas, Division of Agriculture, Cooperative Extension Service), 69–101.
Nutrient (2023). How ESN Works. Available online at: https://Smartnitrogen.Com/How-Esn-Works/ (accessed July 22, 2023).
Omidire, N., Brye, K. R., Roberts, T. L., Kekedy-Nagy, L., Greenlee, L. F., Gbur, E. E., et al. (2021). Evaluation of electrochemically precipitated struvite as a fertilizer-phosphorous source in flood-irrigated rice. Agron. J. 114, 739–755. doi: 10.1002/agj2.20917
Park, M., Singvilay, O., Shin, W., Kim, E., Chung, J., Sa, T., et al. (2004). Effect of long-term compost and fertilizer application on soil phosphorus status under paddy cropping system. Commun. Soil Sci. Plan. 35, 1635–1644. doi: 10.1081/CSS-120038559
Parkin, T. B., and Venterea, R. T. (2010). Chamber-based Trace Gas Flux Measurements. Available online at: https://www.ars.usda.gov/ARSUserFiles/31831/2011ParkinandVentereaTraceGasProtocolRevisionFinal.pdf (accessed July 22, 2023).
Paustian, K., Cole, C. V., Sauerbeck, D., and Sampson, N. (1998). CO2 mitigation by agriculture: an overview. Climate Change 40, 135–162. doi: 10.1023/A:1005347017157
Ponnapempura, F. N. (1972). The chemistry of submerged soils. Adv. Agron. 24, 29–96. doi: 10.1016/S0065-2113(08)60633-1
Rao, V. R., Rao, J. L. N., and Adhya, T. K. (1986). Heterotrophic nitrogen fixation (C2H2 reduction) as influenced by phosphorous application in paddy soils. Plant Soil 92, 125–132. doi: 10.1007/BF02372273
Reba, M. L., and Massey, J. H. (2020). Surface irrigation in the Lower Mississippi River Basin: trends and innovations. ASABE J. 63, 1305–1314. doi: 10.13031/trans.13970
Rech, I., Withers, P., Jones, D., and Pavinato, P. (2019). Solubility, diffusion and crop uptake of phosphorus in three different struvites. Suistainability 11, 134. doi: 10.3390/su11010134
Rector, C., Brye, K. R., Humphreys, J., Norman, R. J., Slaton, N. A., Gbur, E. E., et al. (2018). Tillage and coated-urea effects on nitrous oxide emissions from direct-seeded, delayed-flood rice production in Arkansas. J. Rice Res. Dev. 1, 25–37. doi: 10.36959/973/417
Roberts, T. L., Norman, R. J., Ross, W. J., Slaton, N. A., and Wilson, C. E. J. (2012). Soil depth coupled with soil nitrogen and carbon can improve fertilization of rice in Arkansas. Soil Sci. Soc. Am. J. 76, 268–277. doi: 10.2136/sssaj2011.0116
Rogers, C. W., Brye, K. R., Smartt, A. D., Norman, R. J., Gbur, E. E., Evans-White, M. A., et al. (2014). Cultivar and previous crop effects on methane emissions from drill-seeded, delayed-flood rice production on a silt-loam soil. Soil Sci. 179, 28–36. doi: 10.1097/SS.0000000000000039
Seok-In, Y., Woo-Jung, C., Jae-Eul, C., and Han-Yong, K. (2013). High-time resolution analysis of diel variation in methane emission from flooded rice fields. Commun. Soil Sci. Plant Anal. 44, 1620–1628. doi: 10.1080/00103624.2012.756510
Sheng, H., Yin, Z., Zhou, P., and Thompson, M. L. (2022). Soil C:N:P ratio in subtropical paddy fields: variation and correlation with enviromnetal controls. J. Soil Sediments 22, 21–31. doi: 10.1007/s11368-021-03046-2
Singh, V. K., Gautam, P., Nanda, G., Dhaliwal, S. S., Pramanick, B., Meena, S. S., et al. (2021). Soil test based fertilizer application improves productivity, profitability and nutrient use efficinecy of rice (Oryza sativa L.) under direct seeded condition. Agronomy 11, 1756. doi: 10.3390/agronomy11091756
Slayden, J. M., Brye, K. R., Della Lunga, D., Henry, C. G., Wood, L. S., Lessner, D. J., et al. (2021).Site position and tillage treatment effects on nitrous oxide emissions from furrow-irrigated rice on a silt-loam Alfisol in the Mid-south USA. Geoderma Reg. 28, e00491. doi: 10.1016/j.geodrs.2022.e00491
Smartt, A. D., Brye, K. R., Rogers, C. W., Norman, R. J., Gbur, E. E., Hardke, J. T., et al. (2016). Previous crop and cultivar effects on methane emissions from drill-seeded, delayed-flood rice grown on a clay soil. Appl. Environ. Soil Sci. 2016, 1–13. doi: 10.1155/2016/9542361
SRCC (2023). Climate Normals. Available online at: https://www.srcc.tamu.edu/climate_normals/ (accessed July 22, 2023).
Stevenson, F. J., and Cole, M. A. (1999). Cycles of Soil: Carbon, Nitrogen, Phosphorus, Sulfur, Micronutrients. New York, NY: John Wiley and Sons.
Tong, L., Wang, X., Geng, C., Wang, W., Lu, F., Song, W., et al. (2011). Diurnal and phenological variations of O3 and CO2 fluxes of rice canopy expose to different O3 concentrations. Atmos. Environ. 45, 5621–5631. doi: 10.1016/j.atmosenv.2011.03.070
Tran, D. V. (1997). “World rice production: main issues and technical possibilities,” in Activités de Recherche sur le riz en Climat Méditerranéen, ed J. Chatainger (Montpellier: CIHEAM), 57–69.
Tucker, M. R. (1992). “Determination of phosphorus by Mehlich 3 extraction,” in Soil and Media Diagnostic Procedures for the Southern Region of the United States, ed S. J. Donohue (Blacksburg: Virginia Agricultural Experiment Station).
USDA-NASS (2023). State Agriculture Overview. Available online at: https://www.nass.usda.gov/Quick_Stats/Ag_Overview/stateOverview.php?state=ARKANSAS (accessed July 22, 2023).
USDA-NRCS. (2014). Soil Series. Available online at: https://soilseries.sc.egov.usda.gov/OSD_Docs/D/DEWITT.html (accessed July 22, 2023).
USEPA. (2012). Global Anthropogenic Non-CO2 Greenhouse Gas Emissions: 1990-2030. EPA 430-R-12-006. Available online at: https://www.epa.gov/global-mitigation-non-co2-greenhouse-gases (accessed July 22, 2023).
Valle, S. F., Giroto, A. S., Dombinov, V., Robles-Aguilar, A. A., Jablonowski, N. D., Ribeiro, C., et al. (2022). Struvite-based composites for slow-release fertilization: a case study in sand. Sci. Rep. 12, 14176. doi: 10.1038/s41598-022-18214-8
Wang, F., Rose, T. J., Jeong, K., Kretzschmar, T., and Wissuwa, M. (2015). The knowns and unknowns of P loading into grains, and implications for P efficiency in cropping systems. J. Exp. Bot. 67, 1221–1229. doi: 10.1093/jxb/erv517
Westermann, D. T., Bjorneberg, D. L., Aase, J. K., and Robbins, C. W. (2001). Phosphorus losses in furrow irrigation runoff. J. Environ. Qual. 30, 1009–1015. doi: 10.2134/jeq2001.3031009x
Wood, J. D., Gordon, R. J., and Wagner-Riddle, C. (2013). Biases in discrete CH4 and N2O sampling protocols associated with temporal variation of gas fluxes from manure storage systems. Agric. For Meteorol. 172, 295–305. doi: 10.1016/j.agrformet.2012.12.014
Wu, J., Guo, W., Feng, J., Li, L., Yang, H., Wang, X., et al. (2014). Greenhouse gas emissions from cotton field under different irrigation methods and fertilization regimes in arid northwestern China. Sci. World J. 2014, 832. doi: 10.1155/2014/407832
Yang, L., Zhang, Y., Li, F., and Lemcoff, J. H. (2011). Soil phosphorus distribution as affected by irrigation methods in plastic film house. Pedosphere 21, 712–718. doi: 10.1016/S1002-0160(11)60174-4
Yang, S., Liu, X., Liu, X., and Xu, J. (2017). Effect of water management on soil respiration and NEE of paddy fields in Southeast China. Paddy Water Environ. 15, 787–796. doi: 10.1007/s10333-017-0591-1
Ye, Y. S., Linag, X. Q., Chen, Y. X., Liu, J., Gu, J. T., Guo, R., et al. (2013). Alternate wetting and drying irrigation and controlled-release nitrogen fertilizer in late-season rice. Effects on dry matter accumulation yield, water and nitrogen use. Field Crop Res. 144, 212–224. doi: 10.1016/j.fcr.2012.12.003
Ylagan, S., Brye, K. R., and Greenlee, L. (2020). Corn and soybean response to wastewater-recovered and other common phosphorous fertilizers. Agrosyst. Geosci. Environ. 3, e20086. doi: 10.1002/agg2.20086
Zhang, G., Sun, B., Zhao, H., Wang, X., Zheng, C., Xiong, K., et al. (2019). Estimation of greenhouse gas mitigation potential through optimized application of synthetic N. P and K fertilizer to major cereal crops: a case study from China. J. Clean. Prod. 237, 11765. doi: 10.1016/j.jclepro.2019.117650
Keywords: global warming potential, electrochemically precipitated struvite, chemically precipitated struvite, environmentally safe nitrogen, phosphorus
Citation: Della Lunga D, Brye KR, Roberts TL, Brye J, Evans-White M, Henry CG, Lessner DJ and Arel C (2024) Struvite-phosphorus effects on greenhouse gas emissions and plant and soil response in a furrow-irrigated rice production system in eastern Arkansas. Front. Clim. 6:1342896. doi: 10.3389/fclim.2024.1342896
Received: 22 November 2023; Accepted: 01 February 2024;
Published: 15 February 2024.
Edited by:
Jung-Eun Chu, City University of Hong Kong, Hong Kong SAR, ChinaReviewed by:
Magda Aparecida De Lima, Brazilian Agricultural Research Corporation (EMBRAPA), BrazilCopyright © 2024 Della Lunga, Brye, Roberts, Brye, Evans-White, Henry, Lessner and Arel. This is an open-access article distributed under the terms of the Creative Commons Attribution License (CC BY). The use, distribution or reproduction in other forums is permitted, provided the original author(s) and the copyright owner(s) are credited and that the original publication in this journal is cited, in accordance with accepted academic practice. No use, distribution or reproduction is permitted which does not comply with these terms.
*Correspondence: Diego Della Lunga, ZGRlbGxhbHVAdWFyay5lZHU=
Disclaimer: All claims expressed in this article are solely those of the authors and do not necessarily represent those of their affiliated organizations, or those of the publisher, the editors and the reviewers. Any product that may be evaluated in this article or claim that may be made by its manufacturer is not guaranteed or endorsed by the publisher.
Research integrity at Frontiers
Learn more about the work of our research integrity team to safeguard the quality of each article we publish.