
95% of researchers rate our articles as excellent or good
Learn more about the work of our research integrity team to safeguard the quality of each article we publish.
Find out more
ORIGINAL RESEARCH article
Front. Clim. , 12 March 2024
Sec. Climate Risk Management
Volume 6 - 2024 | https://doi.org/10.3389/fclim.2024.1334159
This article is part of the Research Topic Restoration and Management of Peatlands for Climate Mitigation: Unravelling Biophysical and Socioecological Drivers of Change View all 3 articles
 Michael J. Battaglia1*
 Angela Lafuente2
 Juan C. Benavides3
 Erik A. Lilleskov4
 Rodney A. Chimner2
 Laura L. Bourgeau-Chavez1
 Patrick Nicolás Skillings-Neira2,3
Peatlands are the most carbon-dense ecosystems on earth. In tropical mountains, peatlands are numerous and susceptible to rapid degradation and carbon loss after human disturbances. Quantifying where peatlands are located and how they are affected by land use is key in creating a baseline of carbon stocks and greenhouse gas fluxes from tropical mountain peatlands. However, mapping peatlands in the páramo of the Northern Andes is difficult because they are in a topographically complex environment with nearly continuous cloud cover and frequent conversion to pastures or cropland. The goal of this effort was to identify the different types of páramo peatlands and their degradation patterns in the Colombian Central Cordillera. Moderate resolution cloud-free composites of optical imagery, temporal variance in ALOS- PALSAR L-band SAR, Sentinel-1 C-band SAR, and topography data were used as inputs in a machine learning classifier to identify was used to map 12 land cover classes including peatlands with natural vegetation and peatlands converted to pasture. Field data from 507 control points collected across the study area, including information on the vegetation and carbon content on the top 20 cm of the soil, were used to train and validate the classifier. Results show that the use of multiple platforms and image dates, including variance of the radar returns, is necessary for a clear separation of disturbed and undisturbed peatland classes. Peatland area varied across the study region, covering 7% and 20% of the landscape in the northern and southern portions of the study area, respectively. Disturbed peatlands with exotic grasses cover nearly 2% of the area. The overall accuracy of the peatland classes was 82.6%. Disturbed peatlands with exotic grasses had less carbon in the top 20 cm than undisturbed peatlands with natural vegetation. These results highlight the prevalence of peatlands in the tropical Andes and a promising approach to detecting peatlands converted to agriculture. Understanding the distribution and extent of these carbon dense ecosystems can facilitate the restoration and protection of peatlands in the northern Andes, with implications for the future trajectories of the national greenhouse gas inventory.
Natural peatlands are wetlands dominated by peat forming plants, with deep organic soils and stable elevated water tables (Clymo, 1984). Organic matter is stored in the soil for thousands of years because of the reduced decomposition rates in the anoxic zone below the water surface (Chimner and Karberg, 2008; Hribljan et al., 2016). Carbon rich ecosystems such as peatlands play an important part in global strategies for climate change mitigation (Griscom et al., 2017; Bossio et al., 2020; UNEP, 2022). Peatlands are the most carbon dense ecosystem in the world, with huge belowground carbon stores outweighing their relatively small spatial extent (Yu et al., 2011; Loisel et al., 2021). While they only cover 3% of the global land surface area, they store nearly one third of total soil carbon globally (Yu et al., 2011; Gumbricht et al., 2017). This makes these ecosystems highly important for C cycling at a global scale, but a more complete understanding of their location and distribution is needed to fully understand peatlands' role in the global C cycle and to implement strategies for peatland conservation and restoration.
Despite the relevance of peatlands to global climate change, accurate maps of peatland extent are lacking, and their vulnerability to human disturbances is still poorly understood (Minasny et al., 2019; Goldstein et al., 2020; Hugelius et al., 2020; UNEP, 2022). In mountain settings, peat can form on the sides of mountains or can fill poorly drained valleys, which allows for a correlation between geomorphological depressions and peatland development (Chimner et al., 2010; Gumbricht et al., 2017). Identifying the extent and location of wetlands and peatlands in mountain environments is challenging given the complex topography and the availability of remote sensing data, which is limited due to near-permanent cloud cover (Bourgeau-Chavez et al., 2018; Chimner et al., 2019).
Anthropogenic activities have altered the global carbon (C) cycle over the past decades. This has raised concerns over the quantification of C stocks. Mountain peatlands are often excluded from C stock inventories because of their relatively small individual size compared to boreal or lowland tropical peatlands (Gorham, 1991; Yu et al., 2011; Gumbricht et al., 2017). However, tropical mountain peatlands are key elements of high elevation ecosystems, and their area has been grossly underestimated (Hribljan et al., 2017; Chimner et al., 2019). In Colombia, these peatlands are found in the zone above the treeline and below the lower limit of glaciers, known as páramo.
An additional challenge is to estimate the extent of land use change and degradation of peatlands that have been transformed to cropland or pastures. Peatlands have stored carbon over millennia but human disturbances can release large amounts of that carbon back to the atmosphere in short periods of time (Hugelius et al., 2020), so it is critical to identify not just the extent, but also the condition of these peatlands.
The Colombian Andes are a highly dynamic system affected by local socio-economic trends, global trade of commodities such as potatoes and milk, the 2016 peace agreement, and new legislation (Clerici et al., 2019). Recently, land use in the peat-rich Colombian páramo has been restricted to uses that do not have negative impact on ecosystem services (Congress of Colombia, 2018). This law prohibits a variety of high impact land uses in regions classified as páramo, such as mining, construction of roads, urban expansion, and forestry, but allows agriculture as long as heavy machinery is not employed. Regional agricultural practices can instigate change from pastures to crops and to pastures again within a single year (Rodríguez Eraso et al., 2013; Clerici et al., 2019). These rapid changes put delicate peatland ecosystems at high risk for degradation. Despite the risks these land uses pose, to our knowledge there are no accurate maps describing mountain peatlands and associated land use for Colombia.
In addition to storing large amounts of carbon in their organic soils, they also provide critical habitats for wildlife, are home to a variety of rare plants, and act as important water storage systems (Hribljan et al., 2017; Chimner et al., 2019), providing essential ecosystem services to local communities and populations at lower elevations (Chimner et al., 2020). They are a critical component of regional food and water systems, serving as a source of water for agricultural activities and human consumption to nearly 100 million people (Buytaert et al., 2006). The valleys where peatlands commonly occur offer a steady water supply and relatively flat landscapes that are attractive for agricultural and pastoral activities (Joosten et al., 2016). Although they are important economic activities, grazing and agriculture are especially impactful on peatlands. In the northern portion of the Andes, peatlands are often converted into pastures or agricultural fields by creating drainage ditches and planting crops or exotic grasses for grazing (Joosten et al., 2016; Machaca et al., 2018). Changes in the land use of peatlands have a direct effect on ecosystem services, with significant reduction on the carbon stocks (Chimner and Karberg, 2008; Hergoualc'h and Verchot, 2011; Moore et al., 2013; Urbina and Benavides, 2015; Hribljan et al., 2016), increases in greenhouse gas emissions (Allen et al., 2014; Wilson et al., 2016; Sánchez et al., 2017; Planas-Clarke et al., 2020), and decreased ability of watersheds to regulate water discharge (Buytaert et al., 2006).
However, there is little information on the spatial extent of these land use conversions. Without this information, it is impossible for land management agencies and decision makers to develop estimates of the contribution of these lands to greenhouse gas storage and emissions, and their potential contributions to national efforts to reduce greenhouse gas emissions to meet targets for international agreements, e.g., nationally determined contributions (NDCs) to the Paris Accord (UNEP, 2022).
Given this data gap, creating maps of land use in peat-rich regions such as the Colombian Andes is an essential next step. Utilization of satellite-borne remote sensing data has been shown to be a cost-effective and accurate means of quantifying peatland extent (Minasny et al., 2019). However, identifying discrete peatland ecosystems in montane settings using remote sensing presents unique challenges. Optically, a peatland can have a similar spectral signature to the adjacent upland areas because of canopy similarities or gradual changes in the dominant plant species (Gumbricht et al., 2017; Bourgeau-Chavez et al., 2018). Additionally, mountain peatlands develop in small topographic depressions and the rough landscape creates shadows leading to weak sensor returns (Hribljan et al., 2017; Bourgeau-Chavez et al., 2018; Chimner et al., 2019). Calibration with field data is difficult given that tropical mountain peatlands have been traditionally assigned to either upland ecosystems or temporary flooded areas, excluding them from wetland delineation efforts (Cleef, 1981; Eva et al., 2004; Jaramillo Villa et al., 2016; Ricaurte et al., 2019). In spite of these challenges, efforts that leverage a combination of active [e.g., Synthetic Aperture Radar (SAR)] and passive optical sensors have been used to successfully map peatland ecosystems in tropical mountain regions (Hribljan et al., 2017; Chimner et al., 2019). However, the conversion of peatlands to agriculture presents an additional challenge to peatland mapping techniques because the plant communities found in croplands or pastures in disturbed peatlands are spectrally similar to agricultural areas found on mineral soils.
The goal of this study was to build on established mountain peatland mapping techniques to accurately assess the extent of mountain peatlands, including peatlands disturbed by agricultural activities, in the Central Cordillera of Colombia. Previous studies which have used remote sensing to identify disturbed peatlands have relied heavily on optical imagery (Torabi Haghighi et al., 2018; Šimanauskiene et al., 2019; Brown et al., 2023). Persistent cloud cover in the Colombian Andes makes such an approach impossible. Rough topography, similar vegetation structure across different ecosystem types and the frequent land use changes present additional difficulties in this region (Rodríguez Eraso et al., 2013). To overcome these challenges, we used a multi-sensor approach utilizing C- and L- band SAR from Sentinel-1 and ALOS and ALOS-2 PALSAR, multispectral Sentinel-2 data, and digital elevation model derivatives in combination with field surveys to determine mountain peatland spatial extent and associated land cover types. We combined the mapping with soil coring to estimate belowground soil C storage in the peatlands across the studied area, confirming a depth of at least 20 cm of peat.
This effort focused on three páramo complexes with elevation above 2,800 meters above sea level at the southern end of Colombia's Central Cordillera. For the purposes of mapping, the study area was divided into northern and southern zones following the main geological and climatic gradients of the region (Figure 1). The northern zone covers the Las Hermosas and Chili-Barragán páramo complexes. In the National Park Las Hermosas and nearby areas including the Chili-Barragan páramo, the geology is of intrusive igneous origin and landscape is steep with deep glacial valleys. In the southern zone, covering part of the Purace National Park and delimited by the Guanacas-Purace-Coconucos paramo complex, the area is dominated by active and extinct volcanoes with large relatively flat lava flows. The climatic conditions of this section of Colombia's Central Cordillera are characterized by mean annual temperature below 10°C, strong day/night variations, cloudy skies, foggy days, high UV radiation and strong winds. Precipitation is bimodal with two wet seasons (March to May and September to November), and two dry seasons (December to February and June to August) (Ruiz et al., 2008; Espinoza et al., 2020).
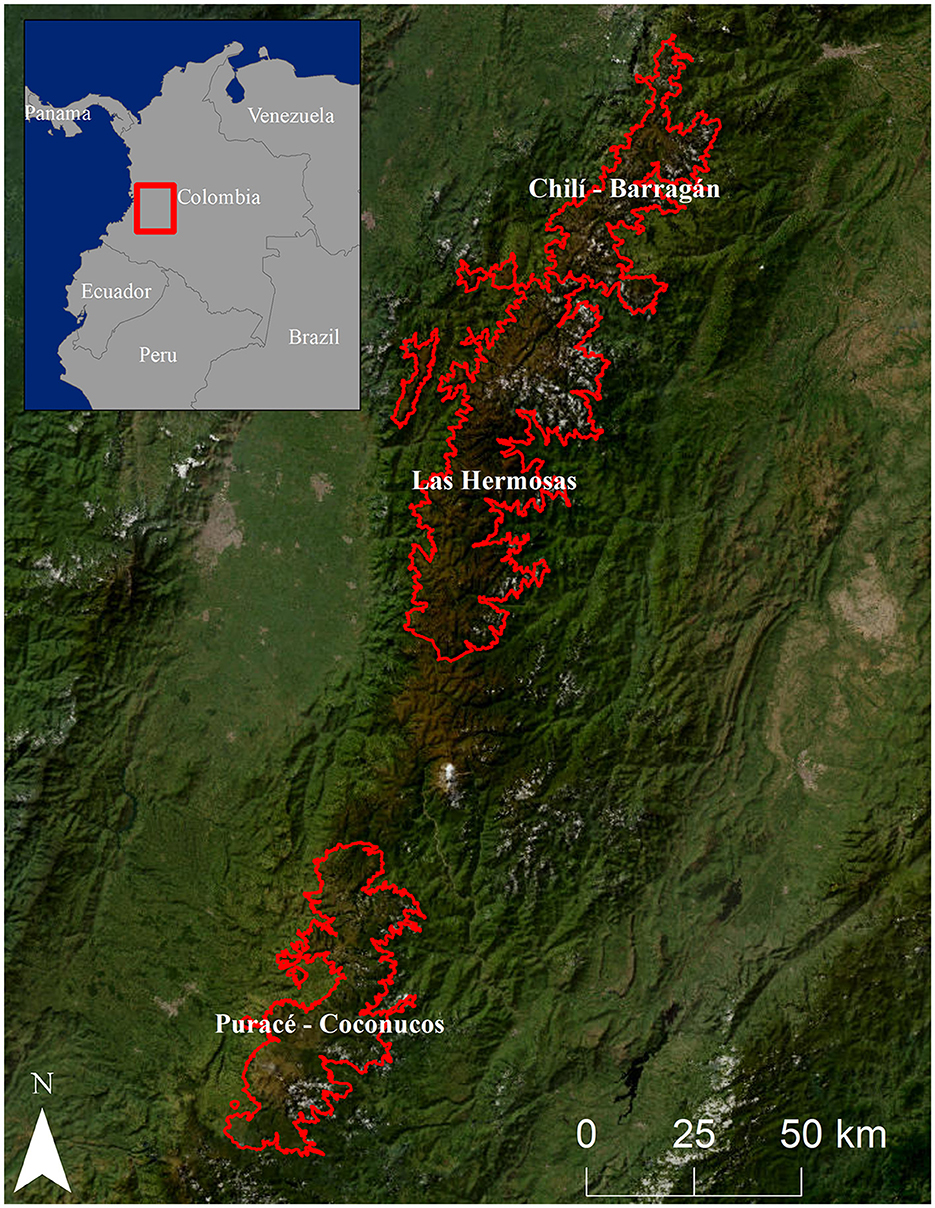
Figure 1. The three páramo complexes mapped in this study within Colombia's Central Cordillera, outlined in red. The inset shows the situation of the study area in north-western South America.
A preliminary classification that divided the study area into potential wetland and upland categories was conducted to help guide field surveys. Aerial and satellite imagery available in Google Earth was visually assessed by interpreters familiar with the study region to identify likely peatland and upland points. Points identified as wetlands and uplands were buffered by 20 m to create a set of training polygons that were used as input into the Random Forests machine learning classifier along with remote sensing data (Breiman, 2001) Google Earth Engine was used to acquire image data used as input for this preliminary classification. Imagery included median composites of near-infrared and green bands of all available Landsat 8 images and mean composites of VV and VH polarizations for all available Sentinel-1 C-band SAR imagery collected in Interferometric Wide mode.
Once the preliminary map was created, potential field sites were identified using a random sampling approach constrained by proximity to roads. Road locations were acquired from Open Street Maps. Open Street Maps was used because it is freely available and it was determined to be more accurate than other sources. Excess random points were generated to account for accessibility issues. In addition to difficult terrain, the political circumstances make otherwise accessible regions unsafe to visit, constraining the distribution of sampling points. A disproportional stratified random approach was used to ensure a sufficient number of sampled points within potential wetland areas that should include large amounts of peat. Out of the 4,500 total points generated, 1,500 (33.3%) were within areas identified as potential wetlands, even though the potential wetlands represented only 5% of the area in the preliminary classified map.
A total of 628 sites were visited in the field. GPS coordinates, photographs, soil samples, pH and water electrical conductivity (when possible), and dominant vegetation type, were recorded at 507 of the 628 field sites. The remaining 121 sites were visited to aid in map validation. For these sites, only GPS coordinates, dominant vegetation type and photographs were collected. We identified peatlands in the field by a combination of a visual assessment of peat forming species on the surface, evidence of flooding or soil saturation and by examining the soil structure of soil cores. Initially, soil samples were collected at 20 cm depth in order to assess surface disturbances expected from the presence of livestock and altered hydrology. However, 40 cm depth samples were collected for 100 field sites after determining the deeper depth was more appropriate for estimating carbon content. We examined the soil core in the field and determined the presence of mineral or organic layers. The soil samples were subdivided into 10 cm samples and sealed into plastic bags, then transported to Pontificia Universidad Javeriana Ecosystems and Climate Change Laboratory in Bogotá, Colombia. All samples were oven dried and organic matter content (OM) was determined by loss on ignition (LOI) at 550°C for 12 h (Soil Survey Staff, 2009). Percent carbon content (%C) was determined from LOI derived OM with the following equation: %C = %OM * 0.48 (Benavides, 2014). Other C% estimates have been derived from LOI for different regions of the Andes (Hribljan et al., 2015, 2024), but the equation used in Benavides (2014) was chosen to remain consistent with previous work conducted in Colombia. Bulk density was determined by dividing the weight of each sample by its volume, which in turn was multiplied by %C to determine carbon content.
Once carbon content was determined for each sample, a cover type reclassification was conducted, with peatlands defined as saturated organic soils that contain more than 12% carbon within the first 40 cm of depth, and the 30–40 cm section strictly cannot go under 12% carbon, except for Andisols which have 25% of carbon (Soil Survey Staff, 2009). The dominance of organic matter at 40 cm deep in a saturated soil matrix indicates the development of an active anoxic catotelm and a functionally active peatland (Clymo, 1978). The 12% threshold was used for the 20 cm samples, even though the 30–40 cm depth could not be assessed. Of the 507 field sites visited, 166 were identified in the field as peatlands, 123 were non-peat forming wetlands, and the remainder were various upland categories, which included shrubby areas, forested areas, graminoid dominated uplands, and agricultural areas.
Field sites identified as peatlands were also classified according to the intensity of disturbance. Disturbance intensity was categorized by looking for evidence of livestock grazing, exotic vegetation, and artificial drainage via ditching. Sites with little or no visible evidence of disturbance were categorized as “Low Intensity Disturbance,” sites with evidence of grazing, such as hoofprints and cow pies, but no artificial drainage or exotic vegetation were categorized as “Medium Intensity Disturbance.” Sites with exotic vegetation or ditching were classified as “High Intensity Disturbance.” Carbon content was analyzed using two way ANOVA with land cover and disturbance levels as the main effects, the interaction between the two factors was not analyzed since not all the land cover types had all the disturbance levels. Statistically different groups from the ANOVA were identified using Tukey's honest significant difference test (Crawley, 2012). All the statistical analysis were run in R v2.3 statistical software (R Core Team, 2023).
Previous studies have shown a combination of optical, SAR, and elevation data to be effective for mapping tropical Andean wetlands and peatlands (Hribljan et al., 2017; Bourgeau-Chavez et al., 2018; Chimner et al., 2019). Optical data is useful for discriminating differences in vegetation, as various species compositions representative of specific cover types typically have unique spectral characteristics. In some cases, optical data can be helpful for identifying wetlands, but similarities between upland and wetland vegetation signatures in optical data can make classification difficult when using optical imagery alone. Topographic data is also useful, as water flows into depressions and valleys, making relative landscape position an important variable in determining cover types such as peatlands. The addition of SAR data is especially advantageous for assessing peatlands, as it can provide additional information that can help to infer soil moisture content, inundation status, and vegetation structure. As an active sensor emitting radiation in the microwave portion of the electromagnetic spectrum, SAR is capable of penetrating vegetation canopies, and in some cases, upper soil layers. This characteristic creates similar backscatter signatures in low-biomass peatlands, where the relative brightness of each pixel is related to its moisture status. Peatlands are expected to remain more consistently wet in different seasons than upland areas or mineral wetlands. When used in combination with optical data, this allows for the separation of undisturbed peatlands, upland pastures, and peatlands used for grazing.
Optical imagery is commonly used in land cover mapping efforts (Guo et al., 2017). Studies leveraging multi-date imagery often cite the importance of capturing changes in plant phenology throughout the year, which can be exploited to differentiate otherwise similar species or ecotypes (Hribljan et al., 2017; Chimner et al., 2019). In the case of Colombia's Central Cordillera, publicly available optical imagery of adequate resolution for mapping peatlands (30 m or better) was extremely limited due to cloud cover. Landsat 8, which has a 16-day revisit cycle, collected zero images with under 20 percent cloud cover between its launch in 2013 and the end of 2022. Likewise, the Sentinel-2 mission, which is comprised of twin satellites (Sentinel-2A and Sentinel-2B) with an effective revisit time of 5 days, has collected no images with under 20 percent cloud cover of the study area. While some studies have shown limited success using only data from non-optical sensors (Adeli et al., 2020), the management implications of discriminating degraded and undisturbed peatlands, whose SAR signatures and relative topographic positions were expected to be similar, necessitated the use of optical data.
To mitigate the limitations imposed by persistent cloud cover, cloud-free composites of Sentinel-2 imagery were created using Google Earth Engine. Sentinel-2 was chosen over Landsat 8 for several reasons. First, Sentinel-2 has higher spatial resolution (10 m – 20 m) than Landsat 8 (30 m). Secondly, Sentinel-2 includes 3 red-edge bands which are useful in vegetation characterization (Merchant et al., 2019). Additionally, Sentinel-2's higher temporal resolution results in higher likelihood of having a cloud-free image for each pixel. Composites were created by first filtering out all available images with >50% cloud cover using the QA60 band for each image. Next, images from January were selected. January images have several advantages for the Central Cordillera. January tends to have the clearest days, being in the middle of the dry season, and it is also near the time when crops (mostly potato and onion) are harvested. This allows for easy differentiation of crops as they will either be near peak greenness or will be bare soil. Then, NDVI was computed for each remaining image. For each pixel, the image with the maximum NDVI value was selected and inserted into the final image composite.
Unlike optical imagery, SAR data can be acquired day or night regardless of cloud conditions. Both C-band imagery from Sentinel-1 and L-band data from ALOS PALSAR and ALOS-2 PALSAR were used. Like Sentinel-2, the Sentinel-1 mission is a combination of two identical C-band sensors designed to collect imagery over every location on the planet at least once every 12 days. As such, there are over 1000 Sentinel-1 images collected in Interferometric Wide mode available over the study region. Like optical imagery, multi-date SAR images are often used for wetland classification, however using each image on its own would have been computationally difficult and inefficient. Therefore, Google Earth Engine was again used to create wet season and dry season composites. The Sentinel-1 pre-processing routine in Google Earth Engine includes thermal noise removal, calibration to sigma nought, and terrain correction. Images are provided on decibel scale. Images are not speckle filtered, but because image compositing acts, effectively, as temporal multi-looking, no additional spatial filtering was needed. Because the study region is in such mountainous terrain, both ascending and descending orbit paths were used to ensure that high slope regions were not in areas not imaged due to the effects of radar shadow. Each image was converted from decibel to linear scaling to allow for standard statistical averaging to be used. Mean and standard deviation were calculated for each pixel for both available polarizations (VV and VH) and for each wet and dry season resulting in 8 total Sentinel-1 bands.
L-band data was also used in this study. The longer wavelength of L-band SAR is better suited for penetrating higher biomass vegetation, allowing for improved discrimination of woody cover types such as shrubs and forests, and is also sensitive to surface soil moisture. ALOS-2 PALSAR data is not freely available but 8 images were acquired via a data grant (JAXA RA6_3120), allowing for dual-date coverage for the entire study area. ALOS-2 data was radiometrically terrain corrected and speckle filtered using the SNAP Toolbox (ESA, 2021). Archival ALOS PALSAR data was available for the study region for 2007–2010 image dates. Radiometrically Terrain Corrected products were acquired from the NASA Alaska Satellite Facility. Similar to the Sentinel-1 images, mean and standard deviation was calculated for each pixel over all available images, however, because fewer images were available, a 5 x 5 median filter was applied to each before temporal averaging to mitigate speckle effects. Only images from the dry season were available.
Global 1 arc second Shuttle Radar Topography Mission (SRTMGL1) digital elevation model data were downloaded for the study region from the NASA LPDAAC (Farr et al., 2007). The terrain of the study region is varied, with elevation changing rapidly from one region to another. Because of these rapid changes, valleys, ridges, and areas in between may have similar elevations. Likewise, one valley's elevation may be significantly different from another valley in a different part of the study region. Therefore, using relative elevation metrics was deemed to be preferable to using absolute elevation. In this case, topographic position index (Weiss, 2001) was used. Topographic position index is a simple metric which measures each pixel's relative height compared to the mean of a user-defined neighborhood surrounding each pixel. Negative values tend to correspond to low lying areas such as valleys or depressions, while positive values tend to correspond to ridges or hilltops. For this effort, a 30-cell radius, ~900 m, neighborhood was used to calculate TPI. In addition to TPI, slope, in degrees, was also derived from the SRTMGL1 data. Pixels with higher values tend to be found on hillslopes, while areas with lower slope values tend to be flatter.
Twelve different land cover classes were mapped for the two studied regions of the Central Cordillera (Table 1). Although field data were collected to differentiate between graminoid and cushion plant dominated peatlands, these vegetation types were combined in the final maps because the sampled peatlands were often represented by a mixture of graminoids and cushions making the distinction of separate classes difficult. Shrub-dominated peatlands and disturbed peatlands used for grazing were also mapped. Peatland classes were distinguished from mineral wetlands which, although wet, are primarily formed on mineral soils and do not accumulate peat. Polygons representing all types of land cover classes present in the study region were aggregated from a combination of field visited sites and polygons generated by analysts using image interpretation techniques with best available satellite imagery or aerial photography. In addition to undisturbed and disturbed peatlands and wetlands, mapped classes include graminoid dominated uplands, forests, shrubland, cropland, pastures, bare soil/rock, water, and developed land. Polygons representing ~80% of the total area for each class were used for training the classifier, and the remaining polygons were reserved for validation. Field visited polygons were prioritized for validation.

Table 1. Cover types mapped for this study.
The Random Forests algorithm, implemented in R software, was used to create the classified maps (Breiman, 2001). The Sentinel-1, Sentinel-2, PALSAR, PALSAR-2, and SRTMGL1 derivatives were combined into a single data stack and used as input variables in the model. All input variables were used since previous work in peatland mapping has shown that variable importance rankings for the whole model are not always representative of all classes, so excluding some variables with low overall importance may eliminate an important predictor variable for individual classes of interest (Bourgeau-Chavez et al., 2021) Training samples were randomly extracted from the variables within the training polygons. The model was initiated with 500 trees and the number of variables used to determine each node split was set to the default value, the square root of the total number of input variables. These parameters are commonly used in land cover classification routines which utilize the Random Forests algorithm (Belgiu and Drǎguţ, 2016) and have produced good results in many previous land cover classification efforts utilizing multi-source remote sensing data (Forkuor et al., 2014; Mahdianpari et al., 2020; Spagnuolo et al., 2020). Producer and user's accuracies were calculated for each class using the reserved validation polygons (Congalton and Green, 2019).
Classified maps for the northern and southern regions of the Central Cordillera are shown in Figure 2. The dominant cover types in the mapped area are shrubland and forest which cover approximately two-thirds of the study region. Graminoid-dominated uplands covered ~16% of the region. Agricultural land uses (i.e., cropland and pasture) accounted for just over 3% of total area. Notably, the Central Cordillera includes 40,337 hectares of peatlands, including 1,179 hectares of peatland converted to intensive pasture, representing 9.4% of the total mapped area. The amount of area mapped for each class in the northern and southern sections of the Central Cordillera is presented in Table 2.
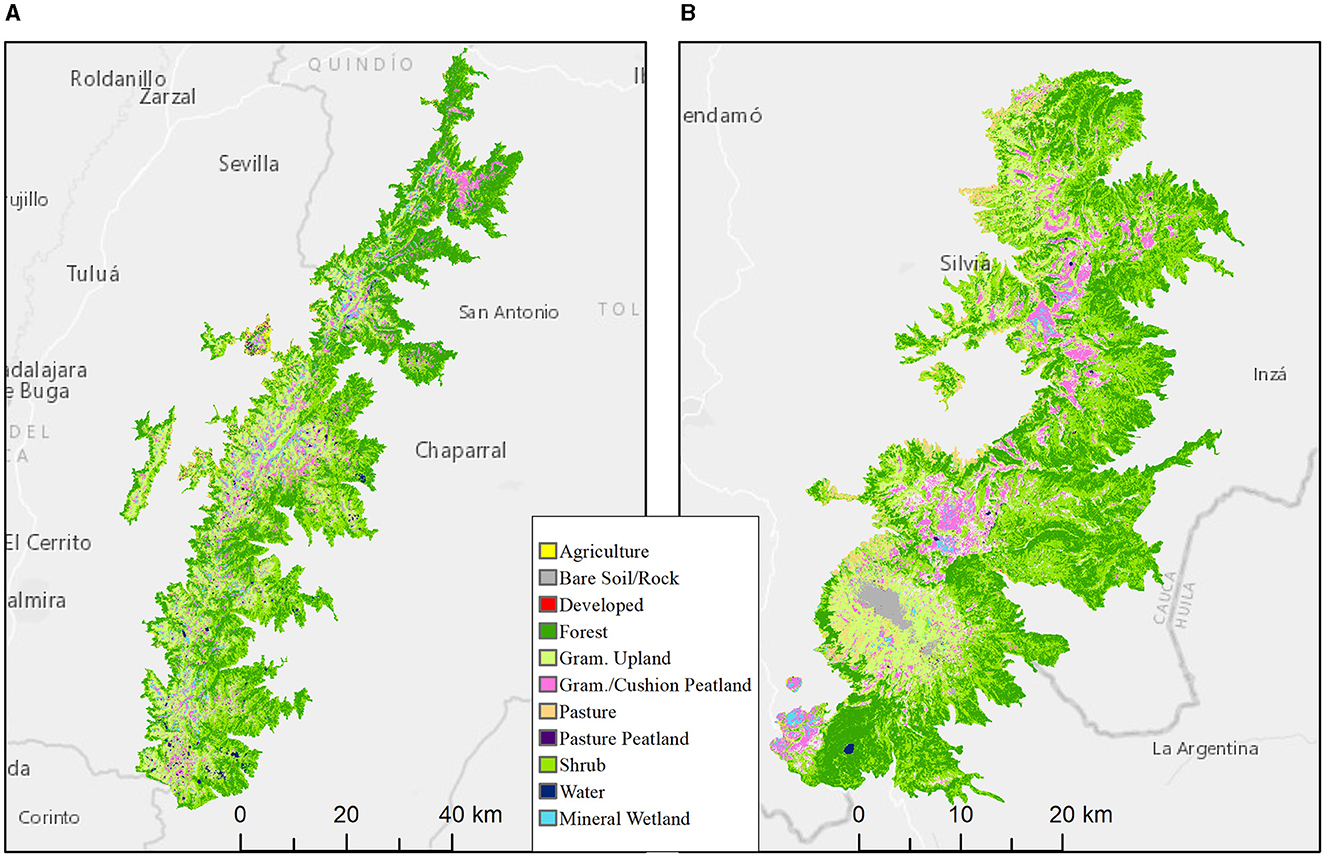
Figure 2. Study area and land cover-wetland classification map showing the distribution of wetlands, peatlands, crop and grazing areas, grassland páramo in the north (A) and south (B) regions of páramo areas in Colombia's Central Cordillera.
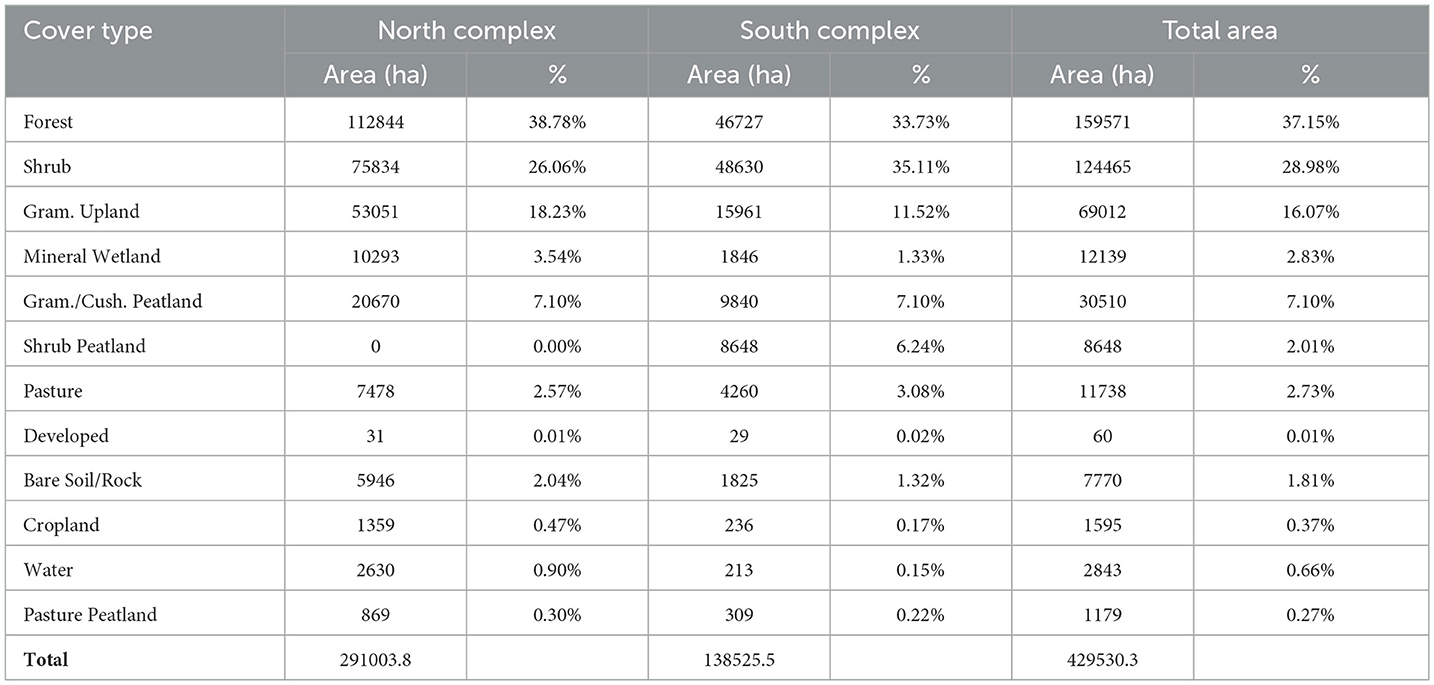
Table 2. Area occupied by the different land cover types including 5 different types of wetlands and 3 different types of peatlands from the central part of the Colombian Andes.
The overall accuracy of the classified maps, calculated by dividing the total number of correctly classified pixels within validation polygons by the total number of pixels within those polygons, was 86.6%. For the combined cushion and graminoid peatland class, user's accuracy was 75.33% while producer's accuracy was 81.14%. For the shrub peatland class, user's accuracy was 70.59% and producer's accuracy was 84.51%. Of particular interest for the present study, pasture peatlands had a 77.69% user's accuracy vs. 86.24% producer's accuracy, roughly equivalent to the peatlands with native vegetation. There was some confusion amongst the peatland classes (i.e., shrub peatland being mapped as graminoid- and cushion peatland and vice versa). As a result, when all peatlands were combined into a single class, accuracy was slightly higher than for the separate classes, with user's accuracy of 77.25% and producer's accuracy of 85.21% User's accuracies for the remaining classes ranged from 72.5% for the shrub class to 100% for water. Producer's accuracies ranged from a low of 75.3% for the mineral wetland class to 100% for water (Table 3).
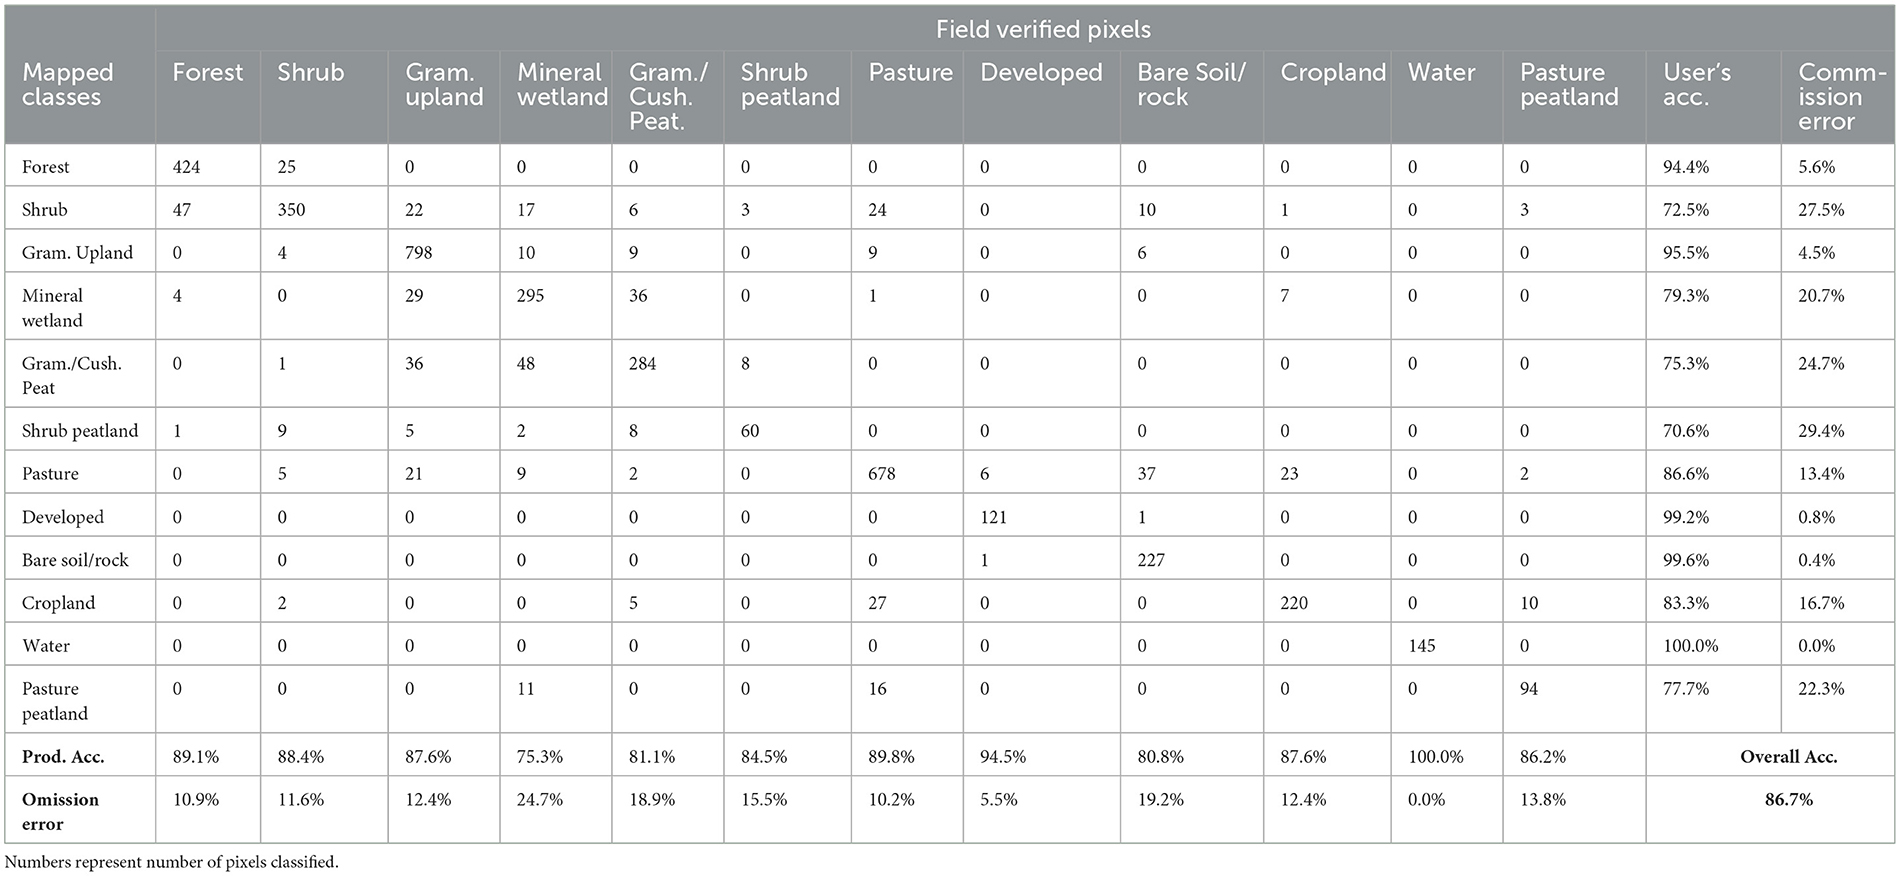
Table 3. Confusion matrix showing user and producer's accuracies and rates of omission and commission error for the different land cover classes mapped for Colombia's Central Cordillera.
Soil carbon content to 20 cm depth from 456 soil cores was analyzed over seven relevant land cover categories. Peatlands had the largest carbon content in the collected soil samples with a concentration of carbon up to 40% for both regions (Figure 3). Bulk density and carbon concentration (%) had a negative correlation with larger carbon concentration values associated with sites of low bulk density (t = −32, r = −0.58). Carbon concentration and content in peatlands were related to land use, with a larger carbon content on undisturbed peatlands even though they usually have a lower bulk density (Figure 4). Graminoid and cushion peatlands had larger carbon content on the first 20 cm than other land cover types, whereas forests and pastures had the lowest carbon content [F(6,1804) = 18.6, p < 0.001]. Intensity of human disturbances had an overall negative impact on all land cover types [F(2,1804) = 18.6, p < 0.001]. Importantly, this analysis does not represent total carbon stocks, which can extend meters deep on average (Chimner et al., 2023); it is simply designed to reveal any apparent sensitivity of the surface pool of carbon to intensity of disturbance.
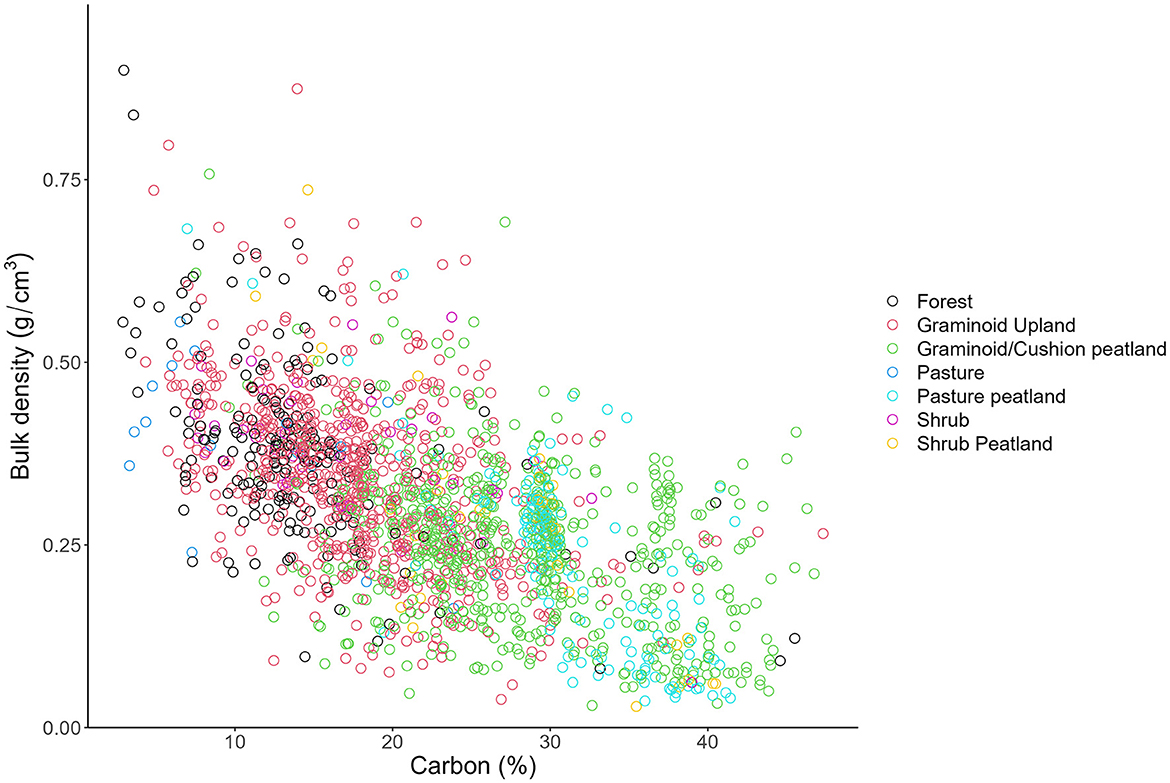
Figure 3. Relationship between soil bulk density (g cm−3) and soil percent carbon content (%) in the top 20 cm of soil for 7 different land cover classes.
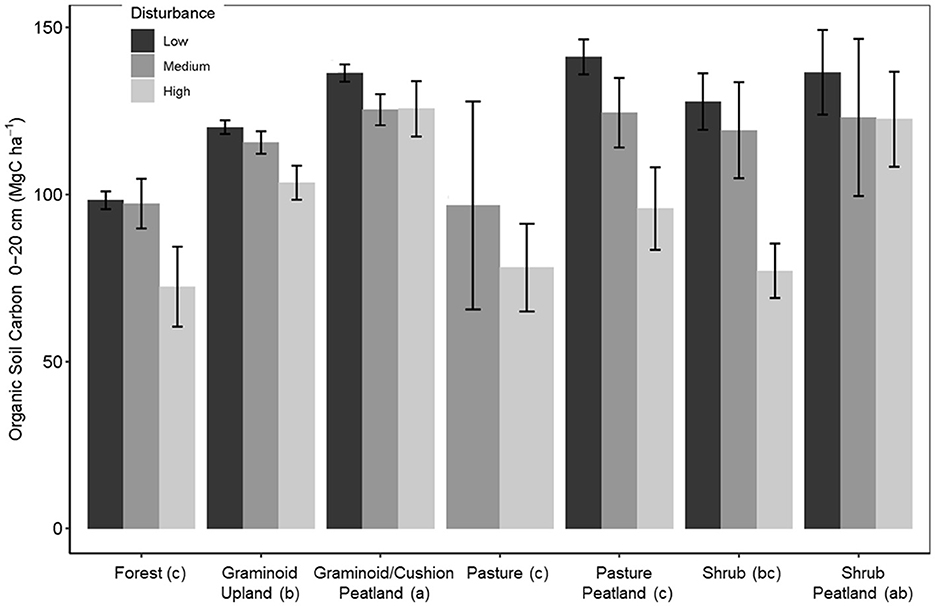
Figure 4. Soil carbon content in the top 20 cm of soil for relevant wetland, peatland and forest classes in the study area under different human disturbance levels. This is only a fraction of total soil carbon, especially in peatlands, and should be thought of as an indicator of disturbance impact rather than a total stock change. Error bars represent 95% confidence intervals. Letters in parentheses beside each cover type represent Tukey HSD homogenous groups.
Identifying peatlands using a remote sensing approach is challenging, because peatlands are defined by the characteristics of the soil that respond to stability of the water table and specific vegetation types. Figure 5 shows box plots for Sentinel-2 derived NDVI and the variance of co-polarized L-band and C-band backscatter for disturbed pasture peatlands, undisturbed graminoid and cushion plant dominated peatlands, and non-peat pastures. The plot shows that these remote sensing variables have different responses for the different cover types. Pasture, whether it is on peat or mineral soils, has high NDVI (typically between 0.6 and 0.75) compared to graminoid or cushion plant dominated peatlands. Although we did not separate graminoid and cushion peatlands in the classified maps, visual inspection of the data suggests that the high-NDVI outliers in the peatland category are primarily cushion plants. Conversely, the variances of the co-polarized backscatter from both L- and C-band are slightly lower for the disturbed and undisturbed peatlands than for non-peatland pastures, although pastures display wide variability at L-band. This variability could be due to the fact that field data, collected in 2019, may have been incongruous with the ALOS PALSAR data, which was operational from 2007 to 2011. This could indicate that some of the areas identified as pastures for this study may have been previously disturbed, drained peatlands, that no longer exhibit the hydrologic characteristics associated with peatland areas. At C-band, the lower variance of the co-polarized backscatter is consistent with our expectation of hydroperiod for the peat and non-peat cover types. Where variance is low, the SAR signal is consistent, indicating stable soil moisture conditions. Where it is higher, the lack of consistency indicates variability in the moisture conditions.
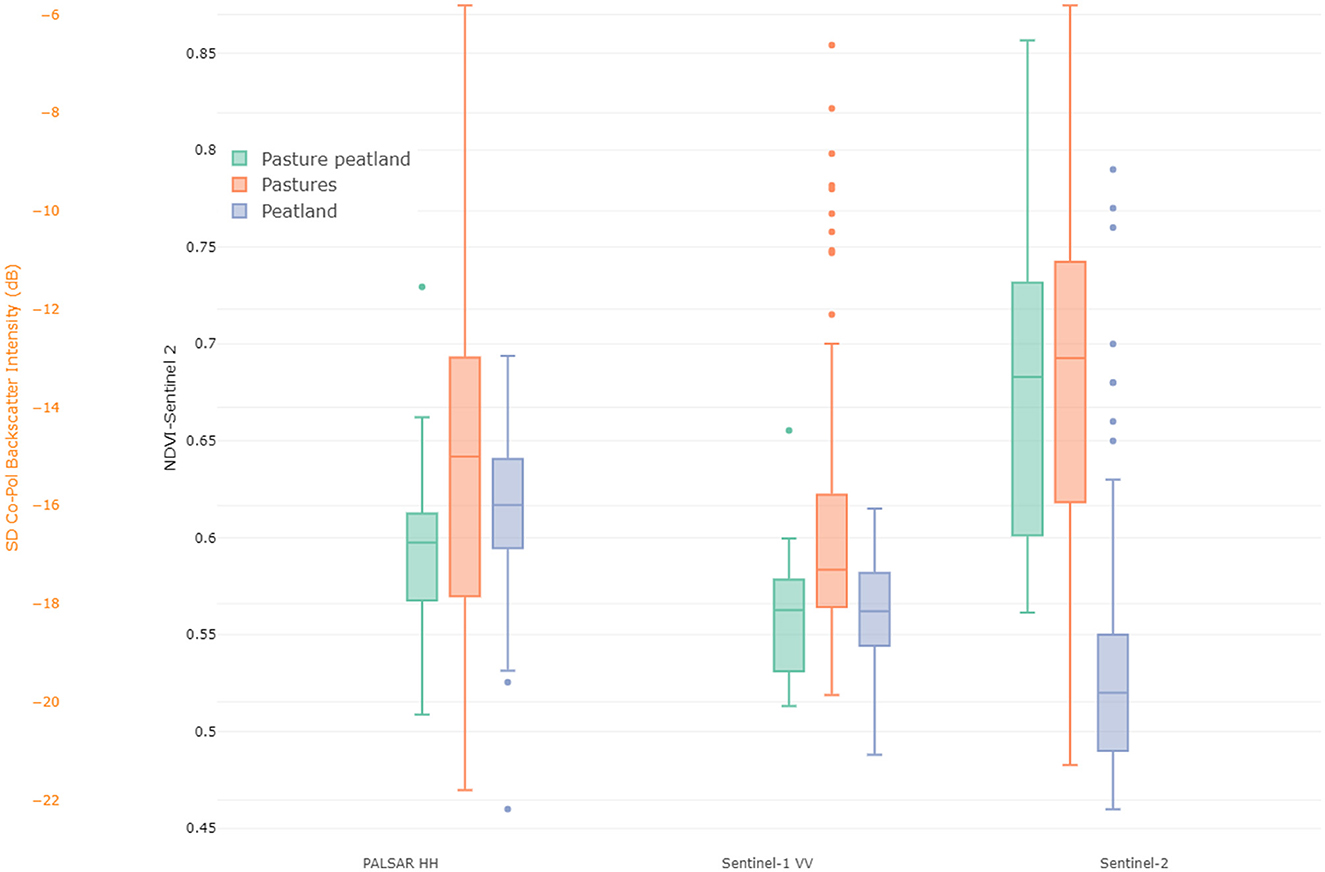
Figure 5. Differences in reflectance and polarization signature values for undisturbed peatlands with natural vegetation, disturbed peatlands with pasture vegetation and pastures on mineral soils in the Colombian central Andes cordillera. NDVI derived from Sentinel 2, and variation (SD) of VV from Sentinel-1 and variation of HH polarization from ALOS/PALSAR data.
Peatlands in the Colombian Central Cordillera are most common between 3100 and 3500 meters above sea level. Peatlands are relatively small, averaging an area of 1.1 ha, and are found mostly at the bottom of glacial valleys. Occasionally, local depressions or hillside seeps can lead to peatland development on ridges and slopes. Peatland distribution differs between the north and south complex, reflecting differences in geomorphology. The northern complex is part of an older volcanic and intrusive system, while the southern complex was formed within a relatively younger chain of volcanoes near the Purace crater (Arcila, 1996). The distribution of pasture peatlands is also different and is related to larger patterns of land use and population. Overall, high intensity disturbance is rare. Specifically, peatlands where the dominant vegetation has been changed from native graminoids or mosses to exotic grasses is uncommon, representing just over 2% of the wetland area. Certain regions, especially those near the lower end of the elevation range studied here, exhibit more signs of disturbance. For example, in the north, extensive pasture peatlands were identified near La Judea (Figure 6). This area has significant grazing and crop activity just downslope from peatlands exhibiting low or no signs of disturbance. In the south, the valley around the town of Totoro, near the volcano Puracé, has significant area of pasture peatlands. East of Totoro, there are also areas that show signs of disturbance, but these areas have not been transformed to the type of exotic grass dominated pasture peatlands identifiable using our methods. An example can be seen in the Supplementary material associated with this article.
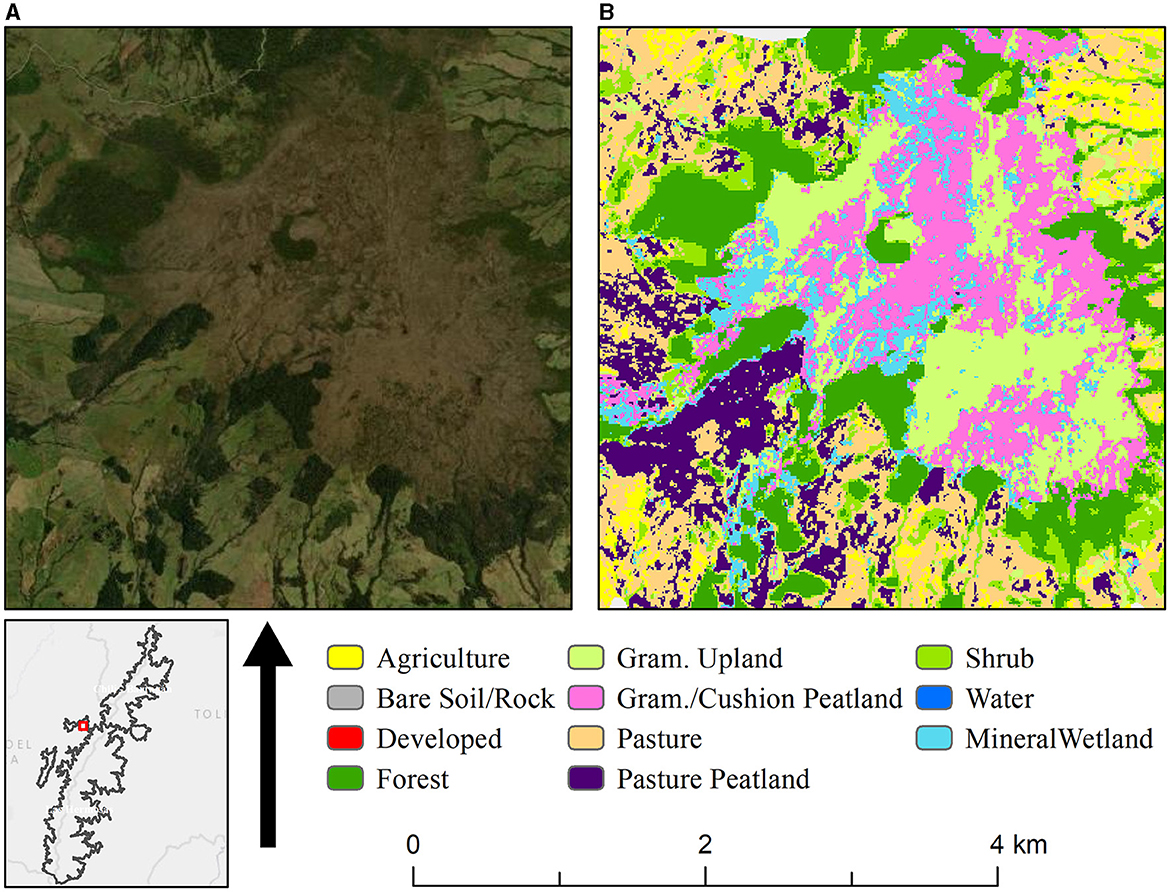
Figure 6. Aerial image (A) and corresponding classified map (B) showing the La Judea region, which has significant area identified as highly disturbed pasture peatlands.
Recently the Colombia Institute for Hydrologic, Meteorological and Environmental Studies (IDEAM) published the national land use and land cover map on a scale 1:100,000, using mostly Landsat 8 2018 and later images [Instituto de Hidrología Meteorología y Estudios Ambientales (IDEAM), 2021]. Although the classification includes wetland types such as peatlands, swamps, and mangroves, none of the areas that we identified as peatlands were included, suggesting that high mountain wetlands have been greatly underestimated and misclassified with upland land cover types such as grasslands or pastures. In addition, the Biological Resources Research Institute Alexander Von Humboldt published in 2016 the national wetland map of Colombia. Even though it is the first effort to map wetlands at a national scale, it categorizes all wetlands into three classes (none of which are peatlands), and it overestimates wetland areas (Jaramillo Villa et al., 2016; Quiñones et al., 2016).
Similar methodologies for mapping high mountain wetlands have been used in Peru and Ecuador. Multi-date, multi-sensor radar and optical imagery (Landsat TM /PALSAR / RADARSAT - 1/STRM DEM - TPI image stack) combined with robust field data in a Random Forest classification has proven its effectiveness in differentiating types of wetlands from other land covers (Hribljan et al., 2017; Chimner et al., 2019). Confusion matrices for the studies in Perú and Ecuador using ground truthing points predicted that the model was accurate for 92% and 90%, respectively. However, these studies did not attempt to map pasture peatlands as a separate class. The ability to map peatlands degraded due to grazing is likely possible in other regions assuming adequate SAR data is available. The upcoming launch of the NASA/ISRO NISAR sensor, which will provide freely available global L-band SAR coverage with a twelve day repeat cycle, will improve this capability.
This study highlighted the importance of developing methodologies to accurately identify and map mountain peatlands, even when land use had been changed to pasture. Using a multi-sensor approach utilizing C- and L- band SAR from Sentinel-1 and ALOS and ALOS-2 PALSAR, multispectral Sentinel-2 data, and digital elevation model derivatives in combination with field surveys provided information needed to accurately identify mountain peatlands including those impacted by human activities in the Central Cordillera of Colombia. The ability to accurately identify mountain peatlands is of paramount importance due to the role that these ecosystems have in C cycling and in climate change mitigation. In particular, this will allow the scientific community to predict C storage and likely greenhouse gas emissions from this sector when combined with emission factor estimates, and the net climate benefit of altered land use practices. It will also enable managers and policy-makers to identify opportunities for more sustainable management of peatlands presently under intensive pasture. When disturbed peatland hydrology is restored or preserved, the ecosystems will return to acting as C sinks, a nature based solution to climate change (Griscom et al., 2017; UNEP, 2022).
The raw data supporting the conclusions of this article will be made available by the authors, without undue reservation.
MB: Data curation, Formal analysis, Investigation, Methodology, Software, Validation, Visualization, Writing – original draft, Writing – review & editing. AL: Data curation, Formal analysis, Investigation, Visualization, Writing – original draft, Writing – review & editing. JB: Conceptualization, Formal analysis, Funding acquisition, Investigation, Methodology, Project administration, Supervision, Visualization, Writing – original draft, Writing – review & editing. EL: Conceptualization, Funding acquisition, Writing – review & editing. RC: Conceptualization, Funding acquisition, Writing – review & editing. LB-C: Methodology, Writing – review & editing. PS-N: Investigation, Writing – review & editing.
The author(s) declare that financial support was received for the research, authorship, and/or publication of this article. Funding and in-kind support was provided by USAID-Colombia mission, the USAID Sustainable Landscapes program, and the USDA Forest Service, Research and Development.
The authors acknowledge the support of the Páramos and Bosques program in Colombia, Pontificia Universidad Javeriana and Michigan Tech Research Institute. The support of G. Santofimio, A. Rozo and C. Valbuena in the field is greatly appreciated.
The authors declare that the research was conducted in the absence of any commercial or financial relationships that could be construed as a potential conflict of interest.
All claims expressed in this article are solely those of the authors and do not necessarily represent those of their affiliated organizations, or those of the publisher, the editors and the reviewers. Any product that may be evaluated in this article, or claim that may be made by its manufacturer, is not guaranteed or endorsed by the publisher.
The Supplementary Material for this article can be found online at: https://www.frontiersin.org/articles/10.3389/fclim.2024.1334159/full#supplementary-material
Adeli, S., Salehi, B., Mahdianpari, M., Quackenbush, L. J., Brisco, B., Tamiminia, H., et al. (2020). Wetland monitoring using SAR data: a meta-analysis and comprehensive review. Remote Sens. 12, 2190. doi: 10.3390/rs12142190
Allen, M. R., Barros, V. R., Broome, J., Cramer, W., Christ, R., Church, J. A., et al. (2014). IPCC Fifth Assessment Synthesis Report-Climate Change 2014 Synthesis Report. Geneva: IPCC.
Arcila, M. (1996). Geophysical monitoring of the purace Volcano, Colombia. Ann. Geophys. 39, 265–272. doi: 10.4401/ag-3970
Belgiu, M., and Drǎguţ, L. (2016). Random forest in remote sensing: a review of applications and future directions. ISPRS J. Photogram. Remote Sens. 114, 24–31. doi: 10.1016/j.isprsjprs.2016.01.011
Benavides, J. (2014). The effect of drainage on organic matter accumulation and plant communities of high-altitude peatlands in the Colombian tropical Andes. Mires Peat 15, 1–15.
Bossio, D., Cook-Patton, S., Ellis, P., Fargione, J., Sanderman, J., Smith, P., et al. (2020). The role of soil carbon in natural climate solutions. Nat. Sust. 3, 391–398. doi: 10.1038/s41893-020-0491-z
Bourgeau-Chavez, L. L., Endres, S. L., Graham, J. A., Hribljan, J. A., Chimner, R. A., Lillieskov, E., et al. (2018). “Mapping peatlands in boreal and tropical ecoregions,” in Comprenhensive Remote Sensing, ed. S. Liang (Oxford: Elsevier), 24–44.
Bourgeau-Chavez, L. L., Grelik, S. L., Battaglia, M. J., Leisman, D. J., Chimner, R. A., Hribljan, J. A., et al. (2021). Advances in Amazonian peatland discrimination with multi-temporal PALSAR refines estimates of peatland distribution, c stocks and deforestation. Front. Earth Sci. 9, 676748. doi: 10.3389/feart.2021.676748
Brown, C., Boyd, D. S., Sjögersten, S., and Vane, C. H. (2023). Detecting tropical peatland degradation: combining remote sensing and organic geochemistry. PLoS ONE 18, e0280187. doi: 10.1371/journal.pone.0280187
Buytaert, W., Célleri, R., Bièvre, D. e., Cisneros, B., Wyseure, F., Deckers, G., et al. (2006). Human impact on the hydrology of the Andean páramos. Earth-Sci. Rev. 79, 53–72. doi: 10.1016/j.earscirev.2006.06.002
Chimner, R., and Karberg, J. (2008). Long-term carbon accumulation in two tropical mountain peatlands, Andes Mountains, Ecuador. Mires Peat 3, 1–10.
Chimner, R. A., Boone, R., Bowser, G., Bourgeau-Chavez, L., Fuentealba, B., Gilbert, J., et al. (2020). Andes, bofedales, and the communities of huascarán national park, Peru. Wetland Sci. Prac. 37, 246–254. doi: 10.1672/UCRT083-205
Chimner, R. A., Bourgeau-Chavez, L., Grelik, S., Hribljan, J. A., Clarke, A. M. P., Polk, M. H., et al. (2019). Mapping mountain peatlands and wet meadows using multi-date, multi-sensor remote sensing in the cordillera Blanca, Peru. Wetlands 39, 1057–1067. doi: 10.1007/s13157-019-01134-1
Chimner R. A. Cooper D. J. and J. M. Lemly (2010). Mountain fen distribution, types and restoration priorities, San Juan Mountains, Colorado, USA. Wetlands 30, 763–771. doi: 10.1007/s13157-010-0039-5
Chimner, R. A., Resh, S. C., Hribljan, J. A., Battaglia, M., Bourgeau-Chavez, L., Bowser, G., et al. (2023). Mountain wetland soil carbon stocks of Huascaran National Park, Peru. Front. Plant Sci. 14, 1048609. doi: 10.3389/fpls.2023.1048609
Cleef, A. M. (1981). The vegetation of the páramos of the Colombian Cordillera Oriental. Mededelingen Bot. Museum Herb. Rijksuniversiteit Utrecht 481, 1–320.
Clerici, N., Cote-Navarro, F., Escobedo, F. J., Rubiano, K., and Villegas, J. C. (2019). Spatio-temporal and cumulative effects of land use-land cover and climate change on two ecosystem services in the Colombian Andes. Sci. Total Environ. 685, 1181–1192. doi: 10.1016/j.scitotenv.2019.06.275
Clymo, R. (1978). A Model of Peat Bog Growth in Production Ecology of British Moors and Montane Grasslands. Cham: Springer, 187–223.
Clymo, R. (1984). The limits to peat bog growth. Philosophical Transactions of the Royal Society of London. Series B, Biol. 303, 605–654. doi: 10.1098/rstb.1984.0002
Congalton, R. G., and Green, K. (2019). Assessing the Accuracy of Remotely Sensed Data: Principles and Practices. London: CRC Press.
Congress of Colombia (2018). Ley 1930 de 2018. “Por Medio de la cual se Dictan Disposiciones para la Gestión Integral de los Páramos en Colombia.” Available online at: https://www.funcionpublica.gov.co/eva/gestornormativo/norma.php?i=87764 (accessed November 8, 2023).
ESA (2021). S1TBX - Sentinel-1 Toolbox version 8.0. Available online at: http://step.esa.int/main/toolboxes/snap/ (accessed July 28, 2022).
Espinoza, J. C., Garreaud, R., Poveda, G., Arias, P. A., Molina-Carpio, J., Masiokas, M., et al. (2020). Hydroclimate of the Andes part I: main climatic features. Front. Earth Sci. 8, 64. doi: 10.3389/feart.2020.00064
Eva, H. D., Belward, A. S., De Miranda, D., Di Bella, E. E., Gond, C. M., Huber, V., et al. (2004). A land cover map of South America. Glob. Change Biol. 10, 731–744. doi: 10.1111/j.1529-8817.2003.00774.x
Farr, T. G., Rosen, P. A., Caro, E., Crippen, R., Duren, R., Hensley, S., et al. (2007). The shuttle radar topography mission. Rev. Geophys. 45:RG2004. doi: 10.1029/2005RG000183
Forkuor, G., Conrad, C., Thiel, M., Ullmann, T., and Zoungrana, E. (2014). Integration of optical and synthetic aperture radar imagery for improving crop mapping in northwestern Benin, West Africa. Remote Sens. 6, 6472–6499. doi: 10.3390/rs6076472
Goldstein, A., Turner, W. R., Spawn, S. A., Anderson-Teixeira, K. J., Cook-Patton, S., Fargione, J., et al. (2020). Protecting irrecoverable carbon in Earth's ecosystems. Nat. Clim. Change 10, 287–295. doi: 10.1038/s41558-020-0738-8
Gorham, E. (1991). Northern peatlands: role in the carbon cycle and probable responses to climatic warming. Ecol. Appl. 1, 182–195. doi: 10.2307/1941811
Griscom, B. W., Adams, J., Ellis, P. W., Houghton, R. A., Lomax, G., Miteva, D. A., et al. (2017). Natural climate solutions. Proc. Nat. Acad. Sci. 114, 11645–11650. doi: 10.1073/pnas.1710465114
Gumbricht, T., Roman-Cuesta, R. M., Verchot, L., Herold, M., Wittmann, F., Householder, E., et al. (2017). An expert system model for mapping tropical wetlands and peatlands reveals South America as the largest contributor. Glob. Chang. Biol. 23, 3581–3599. doi: 10.1111/gcb.13689
Guo, M., Li, J., Sheng, C., Xu, J., and Wu, L. (2017). A review of wetland remote sensing. Sensors 17, 777. doi: 10.3390/s17040777
Hergoualc'h, K., and Verchot, L. V. (2011). Stocks and fluxes of carbon associated with land use change in Southeast Asian tropical peatlands: a review. Glob. Biogeochem. Cycles 25. doi: 10.1029/2009GB003718
Hribljan, J. A., Cooper, D. J., Sueltenfuss, J., Wolf, E. C., Heckman, K. A., Lilleskov, E. A., et al. (2015). Carbon storage and long-term rate of accumulation in high-altitude Andean peatlands of Bolivia. Mires Peat 15, 1–14.
Hribljan, J. A., Hough, M., Lilleskov, E. A., Suarez, E., Heckman, K., Clarke, A. M. P., et al. (2024). Elevation and temperature are strong predictors of long - term carbon accumulation across tropical Andean mountain peatlands. Mitig. Adapt. Strateg. Glob. Chang. 29, 10089. doi: 10.1007/s11027-023-10089-y
Hribljan, J. A., Suarez, E., Bourgeau-Chavez, L., Endres, S., Lilleskov, E. A., Chimbolema, S., et al. (2017). Multidate, multisensor remote sensing reveals high density of carbon-rich mountain peatlands in the paramo of Ecuador. Glob. Chang. Biol. 23, 5412–5425. doi: 10.1111/gcb.13807
Hribljan, J. A., Suárez, E., Heckman, K. A., Lilleskov, E. A., and Chimner, R. A. (2016). Peatland carbon stocks and accumulation rates in the Ecuadorian páramo. Wetlands Ecol. Manage. 24, 113–127. doi: 10.1007/s11273-016-9482-2
Hugelius, G., Loisel, J., Chadburn, S., Jackson, R. B., Jones, M., MacDonald, G., et al. (2020). Large stocks of peatland carbon and nitrogen are vulnerable to permafrost thaw. Proc. Nat. Acad. Sci. 117, 20438–20446. doi: 10.1073/pnas.1916387117
Instituto de Hidrología Meteorología y Estudios Ambientales (IDEAM) (2021). Mapa de Coberturas de la Tierra Metodología Corine Land Cover Escala 1:100.000 Periodo 2018. Available online at: http://www.ideam.gov.co/documents/10182/512130/Cobertura+de+la+tierra+100K+Periodo+2018.pdf/de4cdf86-49be-4825-83c0-5569355f9e2b?version=1.0
Jaramillo Villa, Ú., Flórez-Ayala, C., Cortés-Duque, J., Cadena-Marín, E. A., Estupiñán-Suárez, L. M., Rojas, S., et al. (2016). Colombia Anfibia. Un país de humedales. Volumen 1. Bogotá, DC: Instituto de Investigación de Recursos Biológicos Alexander von Humboldt.
Joosten, H., Sirin, A., Couwenberg, J., Laine, J., and Smith, P. (2016). The role of peatlands in climate regulation. Peatland Restor. Ecosyst. Serv. Sci. Policy Prac. 66, 5. doi: 10.1017/CBO9781139177788.005
Loisel, J., Gallego-Sala, A. V., Amesbury, M., Magnan, G., Anshari, G., Beilman, D., et al. (2021). Expert assessment of future vulnerability of the global peatland carbon sink. Nat. Clim. Change 11, 70–77. doi: 10.1038/s41558-020-00944-0
Machaca, N. C., Condori, B., Pardo, A. R., Anthelme, F., Meneses, R. I., Weeda, C. E., et al. (2018). Effects of grazing pressure on plant species composition and water presence on bofedales in the Andes mountain range of Bolivia. Mires Peat 21, 1–15. doi: 10.19189/MaP.2017.OMB.303
Mahdianpari, M., Salehi, B., Mohammadimanesh, F., Brisco, B., Homayouni, S., Gill, E., et al. (2020). Big data for a big country: the first generation of canadian wetland inventory map at a spatial resolution of 10-m using sentinel-1 and sentinel-2 data on the google earth engine cloud computing platform. Can. J. Remote Sens. 46, 15–33. doi: 10.1080/07038992.2019.1711366
Merchant, M. A., Warren, R. K., Edwards, R., and Kenyon, J. K. (2019). An object-based assessment of multi-wavelength SAR, optical imagery and topographical datasets for operational wetland mapping in boreal Yukon, Canada. Can. J. Remote Sens. 45, 308–332. doi: 10.1080/07038992.2019.1605500
Minasny, B., Berglund, Ö., Connolly, J., Hedley, C., de Vries, A., Gimona, F., et al. (2019). Digital mapping of peatlands–A critical review. Earth-Sci. Rev. 196, 102870. doi: 10.1016/j.earscirev.2019.05.014
Moore, S., Evans, C., Page, S., Garnett, M. H., Jones, T. G., Freeman, C., et al. (2013). Deep instability of deforested tropical peatlands revealed by fluvial organic carbon fluxes. Nature 493, 660–663. doi: 10.1038/nature11818
Planas-Clarke, A. M., Chimner, R. A., Hribljan, J. A., Lilleskov, E. A., and Fuentealba, B. (2020). The effect of water table levels and short-term ditch restoration on mountain peatland carbon cycling in the Cordillera Blanca. Peru. Wetl. Ecol. Manag. 28, 51–69. doi: 10.1007/s11273-019-09694-z
Quiñones, M., Vissers, M., Pacheco-Pascaza, A. M., Flórez, C., Estupiñán-Suárez, L. M., Aponte, C., et al. (2016). Un enfoque ecosistémico para el análisis de una serie densa de tiempo de imágenes de radar Alos PALSAR, para el mapeo de zonas inundadas en el territorio continental colombiano. Biota. Colomb. 16, 63–84. doi: 10.21068/c2016s01a04
R Core Team. (2023). R: A Language and Environment for Statistical Computing. Vienna: R Foundation for Statistical Computing.
Ricaurte, L. F., Patiño, J. E., Zambrano, D. F. R., Arias, G. J. C., Acevedo, O., Aponte, C., et al. (2019). A classification system for Colombian wetlands: an essential step forward in open environmental policy-making. Wetlands 39, 971–990. doi: 10.1007/s13157-019-01149-8
Rodríguez Eraso, N., Armenteras-Pascual, D., and Alumbreros, J. R. (2013). Land use and land cover change in the Colombian Andes: dynamics and future scenarios. J. Land Use Sci. 8, 154–174. doi: 10.1080/1747423X.2011.650228
Ruiz, D., Moreno, H. A., Gutierrez, M. E., and Zapata, P. A. (2008). Changing climate and endangered high mountain ecosystems in Colombia. Sci. Total Environ. 398, 122–132. doi: 10.1016/j.scitotenv.2008.02.038
Sánchez, M. E., Chimner, R. A., Hribljan, J. A., Lilleskov, E. A., and Suárez, E. (2017). Carbon dioxide and methane fluxes in grazed and undisturbed mountain peatlands in the Ecuadorian Andes. Mires Peat 19, 1–8. doi: 10.19189/MaP.2017.OMB.277
Šimanauskiene, R., Linkevičiene, R., Bartold, M., Dabrowska-Zielińska, K., Slavinskiene, G., Veteikis, D., et al. (2019). Peatland degradation: the relationship between raised bog hydrology and normalized difference vegetation index. Ecohydrology 12, e2159. doi: 10.1002/eco.2159
Soil Survey Staff (2009). Soil Survey Field and Laboratory Methods Manual. Omaha, NE: Natural Resources Conservation Service, U.S. Department of Agriculture
Spagnuolo, O. S. B., Jarvey, J. C., Battaglia, M. J., Laubach, Z. M., Miller, M. E., Holekamp, K. E., et al. (2020). Mapping Kenyan grassland heights across Large spatial scales with combined optical and radar satellite imagery. Remote Sens. 12, 1086–1103. doi: 10.3390/rs12071086
Torabi Haghighi, A., Menberu, M. W., Darabi, H., Akanegbu, J., and Kløve, B. (2018). Use of remote sensing to analyse peatland changes after drainage for peat extraction. Land. Degrad. Dev. 29, 3479–3488. doi: 10.1002/ldr.3122
UNEP (2022). Global Peatlands Assessment – The State of the World's Peatlands: Evidence for Action Toward the Conservation, Restoration, and Sustainable Management of Peatlands. Main Report. Global Peatlands Initiative. Nairobi: United Nations Environment Programme.
Urbina, J. C., and Benavides, J. C. (2015). Simulated small scale disturbances increase decomposition rates and facilitates invasive species encroachment in a high elevation tropical Andean peatland. Biotropica 47, 143–151. doi: 10.1111/btp.12191
Weiss, A. (2001). “Topographic position and landforms analysis,” in Poster Presentation, ESRI User conference, San Diego, CA.
Wilson, R., Hopple, A., Tfaily, M., Sebestyen, S. D., Schadt, C. W., Pfeifer-Meister, L., et al. (2016). Stability of peatland carbon to rising temperatures. Nat. Commun. 7:13723. doi: 10.1038/ncomms13723
Keywords: Andes, disturbance, peatland soils, topography, tropical peatlands, land cover, SAR
Citation: Battaglia MJ, Lafuente A, Benavides JC, Lilleskov EA, Chimner RA, Bourgeau-Chavez LL and Skillings-Neira PN (2024) Using remote sensing to map degraded mountain peatlands with high climate mitigation potential in Colombia's Central Cordillera. Front. Clim. 6:1334159. doi: 10.3389/fclim.2024.1334159
Received: 06 November 2023; Accepted: 19 February 2024;
Published: 12 March 2024.
Edited by:
Haojie Liu, University of Rostock, GermanyReviewed by:
Abel Ramoelo, University of Pretoria, South AfricaCopyright © 2024 Battaglia, Lafuente, Benavides, Lilleskov, Chimner, Bourgeau-Chavez and Skillings-Neira. This is an open-access article distributed under the terms of the Creative Commons Attribution License (CC BY). The use, distribution or reproduction in other forums is permitted, provided the original author(s) and the copyright owner(s) are credited and that the original publication in this journal is cited, in accordance with accepted academic practice. No use, distribution or reproduction is permitted which does not comply with these terms.
*Correspondence: Michael J. Battaglia, bWpiYXR0YWdAbXR1LmVkdQ==
Disclaimer: All claims expressed in this article are solely those of the authors and do not necessarily represent those of their affiliated organizations, or those of the publisher, the editors and the reviewers. Any product that may be evaluated in this article or claim that may be made by its manufacturer is not guaranteed or endorsed by the publisher.
Research integrity at Frontiers
Learn more about the work of our research integrity team to safeguard the quality of each article we publish.