 Emily Black
 Ross I. Maidment
 Elizabeth Rees
 Eleanor Nderitu4
- 1Department of Meteorology, University of Reading, Reading, United Kingdom
- 2National Centre for Atmospheric Science, Leeds, United Kingdom
- 3Climate and Resilience Service, UN World Food Programme, Rome, Italy
- 4Start Network, London, United Kingdom
Drought poses a continual threat to both lives and livelihoods in the Global South. Although the impact on food security from drought could be reduced through early release of funds, the humanitarian sector typically reacts to crises rather than anticipates them. A significant challenge lies in devising a drought monitoring and forecasting system that can function across environmentally and economically diverse regions. This is particularly evident in Pakistan, which encompasses environments ranging from fertile riverbeds to arid deserts. This paper details the development, implementation, and operation of an anticipatory drought Disaster Risk Financing (DRF) programme for the provinces of Punjab, Sindh, and Baluchistan in Pakistan. Key to the DRF development are a new yield model for the primary crop in the target season (winter wheat), and a novel forecasting system for four seasonal drought indicators - namely winter wheat yield, precipitation, normalised difference vegetation index (NDVI) and vegetation health index (VHI). Formal evaluations demonstrate that the forecasts are skillful up to 2 months in advance of the end of the season – enabling anticipatory release of funds. The work presented here is applicable beyond Pakistan. Indeed, the model and the methodologies are sufficiently broad and adaptable to be utilised in arid and semi-arid regions across the Global South.
1 Introduction
It is increasingly recognised that anticipatory action can mitigate the effects of climate-related shocks, building resilience to climate variability and change (for example, Levine et al., 2020; Boult et al., 2022). In this context, ‘anticipatory action’ encompasses a range of proactive measures taken before a disaster occurs (for example, Wilkinson et al., 2020; Chaves-Gonzalez et al., 2022). Anticipatory action may involve taking action based on forecasts (forecast-based action), potentially including releasing funds (forecast-based finance) (Coughlan de Perez et al., 2015, 2016). For fast-developing events, such as tropical cyclones, actions may include evacuation, issuing of bulletins/warnings and intensive monitoring to identify communities at immediate risk (Emerton et al., 2020; Speight et al., 2023). For slower developing phenomena, such as seasonal drought, anticipatory action may include issuing advisories and pre-positioning humanitarian aid. Despite improved access to early warning systems, drought anticipatory action programmes have proved difficult to scale up, and delayed response continues to exacerbate food insecurity (Grunewald et al., 2019; Levine et al., 2020). The chronic food insecurity experienced by Pakistan’s rural population has motivated the Start Network to pilot a Disaster Risk Financing scheme (DRF) in order to allow civil society actors to proactively manage weather-related risk. The drought element of the DRF aims to facilitate anticipatory action by quantifying risks in advance of food insecurity, pre-positioning funds and then releasing them according to pre-agreed plans. Since it includes the use of forecasts, the DRF is arguably form of forecast-based action/finance even though the emphasis is on pre-positioning of funds.
A range of factors need to be considered when implementing a DRF. Initial decisions include geographical domain, the growing season or seasons, and the severity of events targeted. In the case of the Pakistan DRF, the decision was taken to start in 2020–2021 with Punjab and Sindh and to expand to Baluchistan in 2021–2022. In line with the Start Network’s aim to trigger for events that occur every few years, the decision was taken to focus on moderate drought (1 in 5 year events).
Pakistan has two growing seasons: Kharif (May–September) and Rabi (October–April). Although most operational drought monitoring for Pakistan focuses on the primary summer growing season (Kharif), crops grown during the secondary winter rainy season (Rabi) play a vital role in maintaining household food security, and Rabi droughts are thus also highly impactful (for example, Ahmed et al., 2018). The new DRF scheme was therefore implemented for the November–April Rabi growing season. The system was designed to target general drought-related risk to food security, which is primarily related to large-scale winter wheat production, especially in the high production regions of Punjab. With this in mind, for the DRF, in addition to considering drought metrics, such as precipitation and vegetation health, we also considered modelled winter wheat yield – as a proxy for drought-related food insecurity.
Pakistan has a diverse climate, mainly reflecting considerable variation in topography. The mountainous northernmost regions are cold, with heavy snowfall in the winter. Further south, high temperatures (>40°C) are common in the summer. Annual precipitation also varies, ranging from ~750 mm in the north to <200 mm in Sindh. Pakistan’s geographical complexity presents a challenge for large-scale drought monitoring. For example, in Baluchistan, although Rabi is the main rainy season, there is comparatively little cultivation of winter wheat because of the aridity of the environment. In Sindh and Punjab, in contrast, winter crops and pasture are supported by artificial and natural irrigation, as well as by rainfall (Badruddin 1993; Portmann et al., 2010; Biemans et al., 2016). Thus although meteorologically-based metrics, such as the Standardised Precipitation Index (SPI) and Palmer Drought Index (PDI) may be useful in Baluchistan, they have limited utility for monitoring agricultural drought in Punjab and Sindh. In these provinces, traditional crop models, such as the FAO’s Aquacrop would moreover overestimate the severity of drought because they do not account for irrigation (Steduto et al., 2009). Other crop models that do account for irrigation - for example, DSSAT (Jones et al., 2003), APSIM (Keating et al., 2003) and EPIC (Williams et al., 1989) - cannot be applied in this region because precise information on irrigation scheduling is lacking, and much of the irrigation is natural, rather than artificially applied. Furthermore, although empirical vulnerability functions, based on meteorological metrics of drought have been successfully applied in other regions (for example, Yue et al., 2015; Wu et al., 2021), the difficulty of relating agricultural drought stress to meteorological variability precludes this approach in Pakistan.
Direct observation of vegetation or soil moisture may provide a more robust basis for monitoring crop yield, and hence agricultural drought (Bastiaanssen et al., 2000). For example, a model based on directly measured soil moisture was successfully applied to a number of experimental locations in northern Punjab (Rafi and Ahmad, 2005). More widely, a model based on AVHRR (Advanced Very High Resolution Radiometer) passive microwave observations of NDVI (Normalised Difference Vegetation Index), surface temperature and surface albedo was applied across the Indus basin, with satisfactory results for simulating spatial variability in the production of several crops, including wheat (Bastiaanssen and Ali, 2003). Vegetation health metrics have been used to skillfully model wheat yield in other arid and semi-arid regions, such as Australia (Kogan et al., 2018), Kazakhstan (Bokusheva et al., 2016) and China (Kogan et al., 2005). The excellent skill of models of this type has motivated the application of vegetation health based indices in weather index insurance schemes, building on earlier research on the exploitation of satellite-based rainfall estimates for this purpose (Black et al., 2016a,b). For example, a satellite-based index, based on a composite of several metrics of vegetation health, was implemented in India when a lack of direct yield observations threatened a well-established area-yield crop insurance scheme (Murthy et al., 2022). Other studies have taken a machine learning approach to combining multiple streams of satellite observations into indices of drought-related risk. For example, Li et al. (2021) describes a new index for wheat drought risk in China.
Given that it is established in the literature that variability in wheat yield in semi-arid regions can be captured by regressing yield against vegetation health indices, the primary focus of this paper is on the anticipatory DRF, rather than on the crop model. Implementation of an anticipatory DRF requires quantitative probabilistic assessments of the risk of drought. A scientific novelty of our approach is thus the use of a computationally light-weight forecasting technique to provide probabilistic predictions of key indices. Although similar approaches to forecasting precipitation, soil moisture, crop yield and NDVI have been applied in several regions (Brown et al., 2017; Asfaw et al., 2018; Boult et al., 2020; Salakpi et al., 2022), to our knowledge the complex process of implementing such a system within a DRF has not been described in the literature.
In summary, the implementation of a DRF involves a series of scientific and policy decisions. Although successful DRFs build on the routine drought monitoring carried out by meteorological, hydrological and agricultural agencies, any scheme designed to trigger automatic release of funds requires robust formalisation of drought hazard. This paper describes the development, design and implementation of a DRF for the Punjab, Sindh and Baluchistan provinces of Pakistan, with the aim of illustrating the considerable challenges of developing climate services for this environmentally complex region. The conceptional approach and implementation of the DRF are described in Sections 2 and 3. The operational system is described in section 4. The final section of the paper includes some reflections on the experience of the first years of running the DRF, along with suggestions for future directions for development.
2 Materials and methods
2.1 Data
2.1.1 Biophysical variables
The biophysical variables (NDVI, VHI and precipitation) were extracted from publicly available datasets and aggregated in time to twice monthly. All three datasets were re-gridded to a common 5 km grid.
2.1.1.1 NDVI and VHI
For this study, the NOAA Blended Vegetation Health Products (VHP) Version 7.0 was selected (Yang et al., 2021) (see https://www.star.nesdis.noaa.gov/smcd/emb/vci/VH/vh_ftp.php). VHP provides a collection of global satellite-derived variables related to plant health, including NDVI and VHI from August 1981 to the present day, at 4 km x 4 km spatial resolution at a latency of 2 days. All VHP variables are provided as 7-day averages. Despite the data originating from multiple satellites, the dataset developers have implemented careful correction procedures to ensure the data are not prone to temporal discontinuities that result from a change in satellite during the data record (Yang et al., 2021).
2.1.1.2 Precipitation
Precipitation was extracted from the CHIRPS dataset (Funk et al., 2015). CHIRPS was chosen for its long record (back to 1982), and for its high spatial and temporal resolution (daily ~5 km). CHIRPS is based on satellite imagery, calibrated historically and in real time both with a limited rain gauge dataset and TRMM imagery. Unlike purely gauge based gridded datasets, which are updated only occasionally, CHIRPS has low operational latency, with CHIRPS-Prelim available within ~2 days of the end of each pentad. In the operational implementation of the scheme, historical CHIRPS data are spliced together with CHIRPS-prelim. Some spatial artefacts are evident, particularly when the precipitation aggregated to long-term means (Figure 1). Nevertheless, evaluations have shown that CHIRPS represents temporal variability in Pakistan rainfall reasonably well (Nawaz et al., 2021).
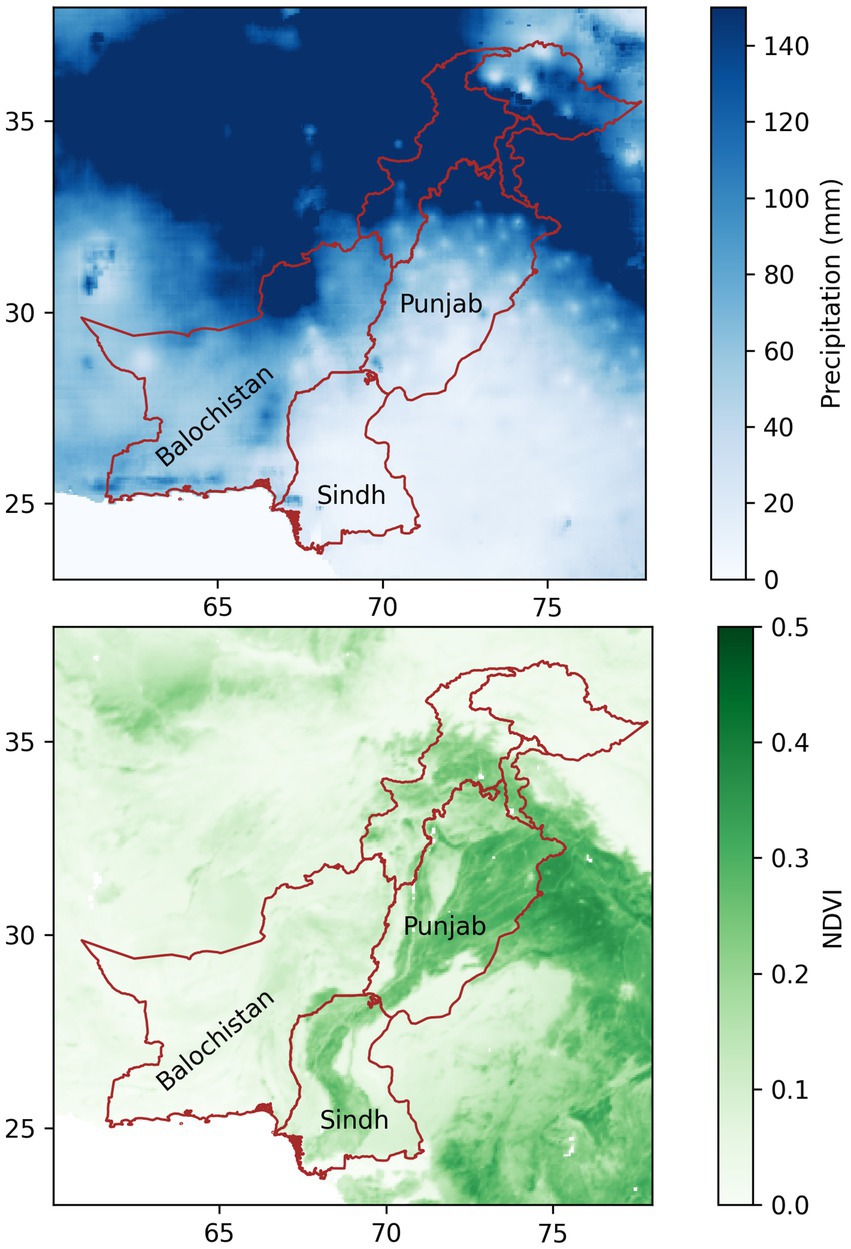
Figure 1. November – April (Rabi) precipitation total (top) and mean two-week maximum NDVI (bottom) for Pakistan and surrounding regions.
2.1.2 Agricultural data
The agricultural data required were district and province scale yield and production area. The data were obtained from several sources. Province scale production data were obtained from the Pakistan Agricultural Information Service http://www.amis.pk/. The data are available from this source for 1947–48 to 2021–22.
District scale crop yield and production area data are freely available for 1982–2018 for Punjab and for 1982–2014 for Sindh and Baluchistan. For this project, 1981/1982–2008/2009 were obtained from the Government of Pakistan, statistics division (Khan et al., 2009). More recent data were obtained from the Punjab crop reporting service: https://crs.agripunjab.gov.pk/reports and the Pakistan Agricultural Marketing Information Service (AMIS): http://www.amis.pk/Agristatistics/DistrictWise/DistrictWiseData.aspx. The later data include, not only total production and total production area, but also irrigated and unirrigated production. The district scale data are incomplete, in part because of changes to district boundaries and in part because of missing data in the archive.
2.1.3 Demographic data
The number of urban and rural households, and the total rural and urban population was recorded at the district level in the 2017–2018 census (http://www.pbs.gov.pk/content/block-wise-provisional-summary-results-6th-population-housing-census-2017-january-03-2018). Although data with greater spatial resolution are available, the drought model operates at the district level, and so the population data were aggregated at this level. The use of vulnerability metrics was explored during the 2020/2021 season. For the information of the technical working group the multi-dimensional poverty indicator index has been gathered for each district of Punjab, Sindh and Baluchistan, using UNDP data from https://www.undp.org/content/dam/pakistan/docs/MPI/MPI4pager.pdf.
2.2 Conceptual approach to drought monitoring and forecasting for the DRF
The output of the modelling process is an estimate of the provincial population at risk of drought. The scheme is operated at the provincial scale to fit in with agricultural decision making processes in Pakistan, which are governed primarily at this administrative level. The biophysical modelling and monitoring is, however, carried out at the district scale, to account for climatic and population variation and to capitalise on the high quality district yield data. The methodological approach is outlined in Figure 2.
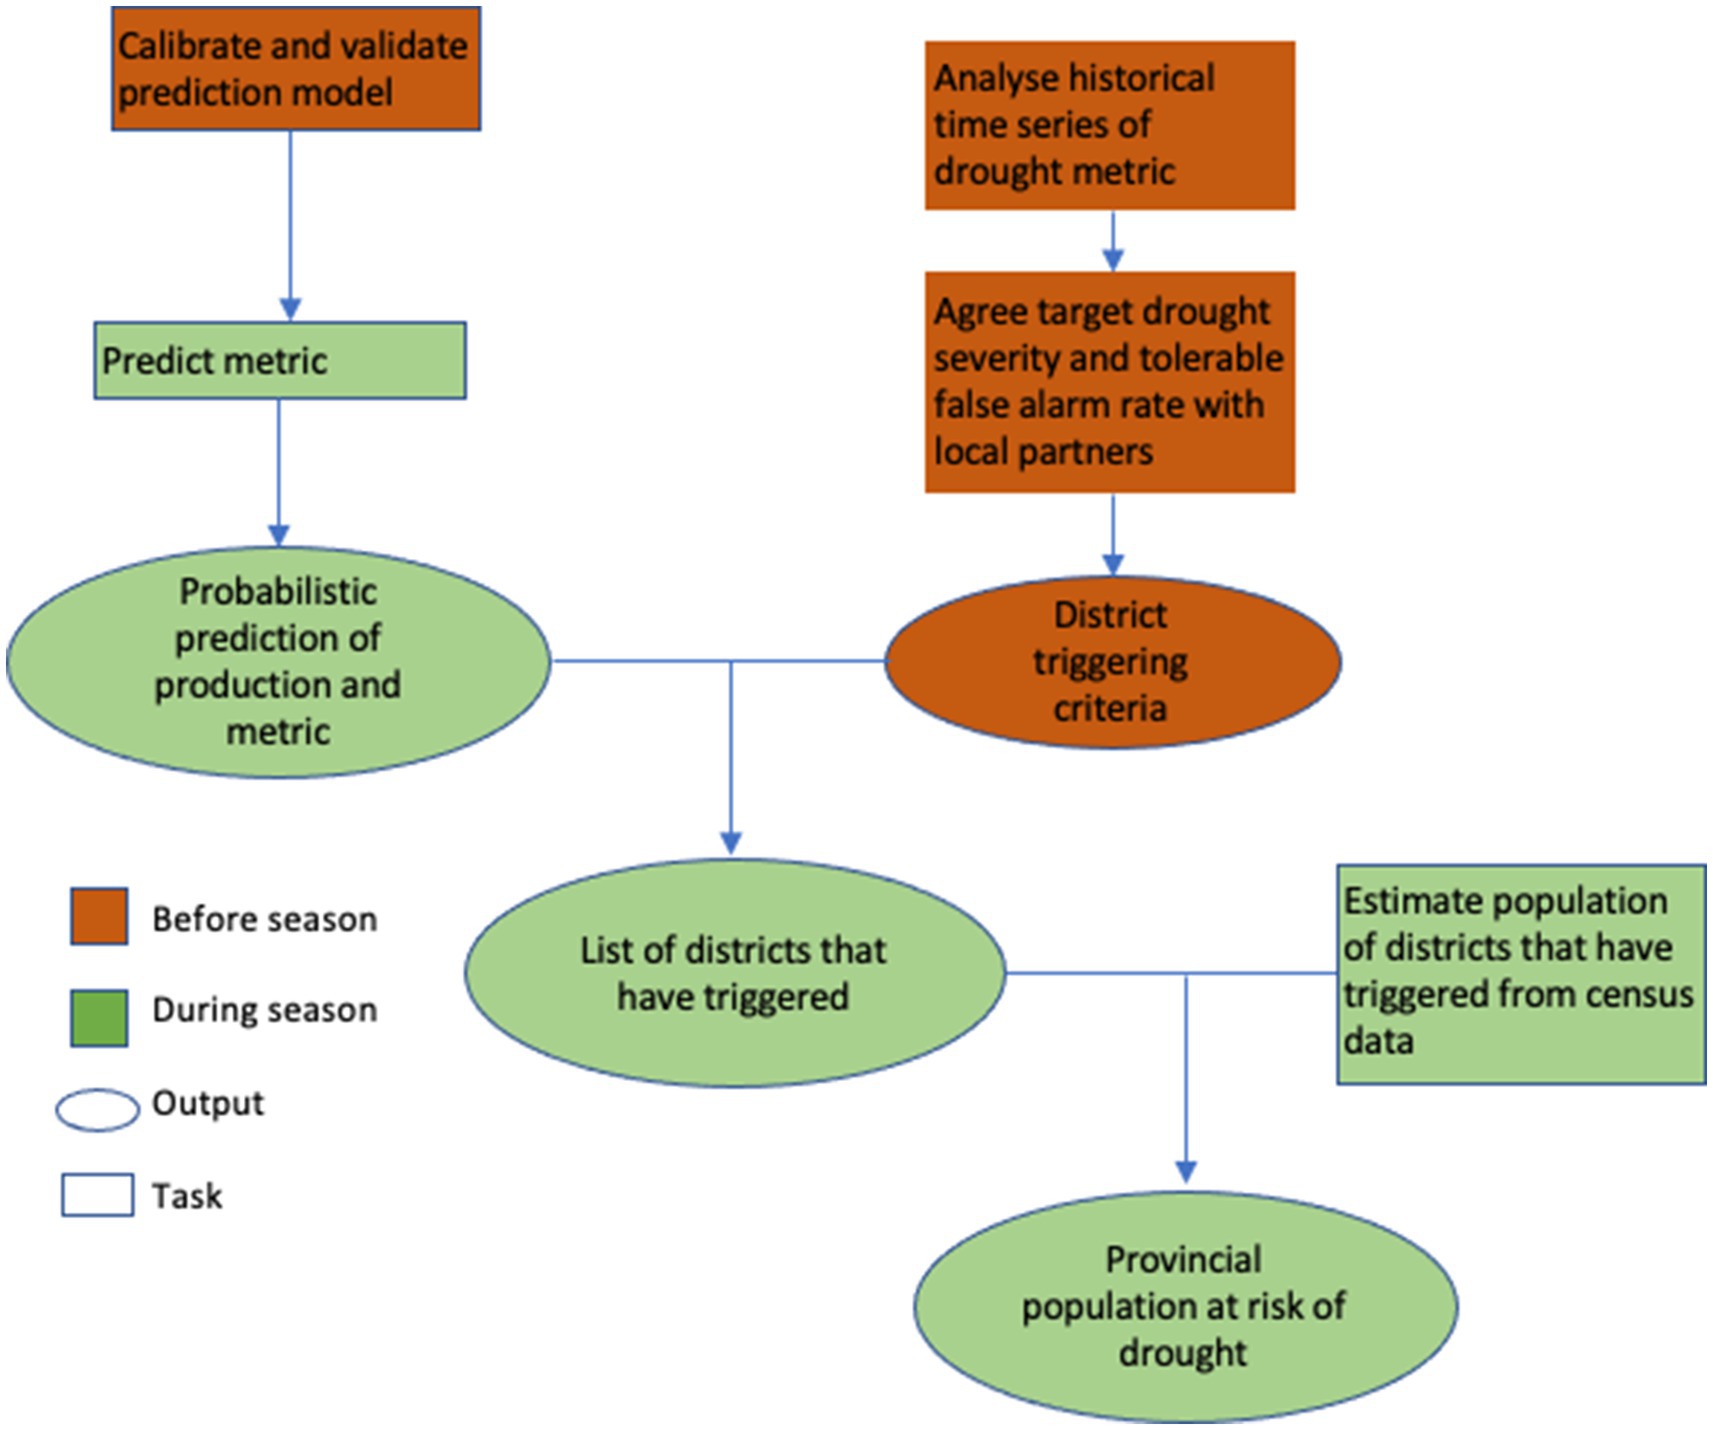
Figure 2. Summary of the modelling process for triggering the DRF.
2.3 Choice of metrics for the DRF for each province
2.3.1 Candidate drought metrics
The following candidate metrics for drought were considered:
• Modelled wheat production generated using a statistical model that relates NDVI and observed production area to district winter wheat yield and production. It was only possible to develop a skillful model for Punjab because of quality issues with the yield observations of Sindh and Baluchistan (see Section 2.4).
• Normalised Difference Vegetation Index (NDVI) is a metric of the greenness of the Earth’s surface. It is used as a proxy of vegetation health and biomass. The winter wheat crop model uses NDVI over key regions and periods to estimate district-scale yield.
• Vegetation Health Index (VHI) linearly combines the vegetation condition index (VCI) and temperature condition index (TCI) into an index of vegetative health. VCI and TCI are, respectively, indices of NDVI and temperature, normalised to location and time of year.
• Precipitation derived from satellite imagery to produce a spatially and temporally contiguous dataset from the early 1980s to the delayed present.
2.3.2 Regional agro-meteorological context and choice of drought metric
A challenge of developing a drought monitoring system for a large region is spatial variation in climate, hydrological and agricultural settings. The modelling approach needs to account for these variations, without becoming overly complex. Figure 3 shows the distribution of cropland within Pakistan. It can be seen that most cropland is found in Punjab, with cropping in Baluchistan and Sindh restricted to a few districts.
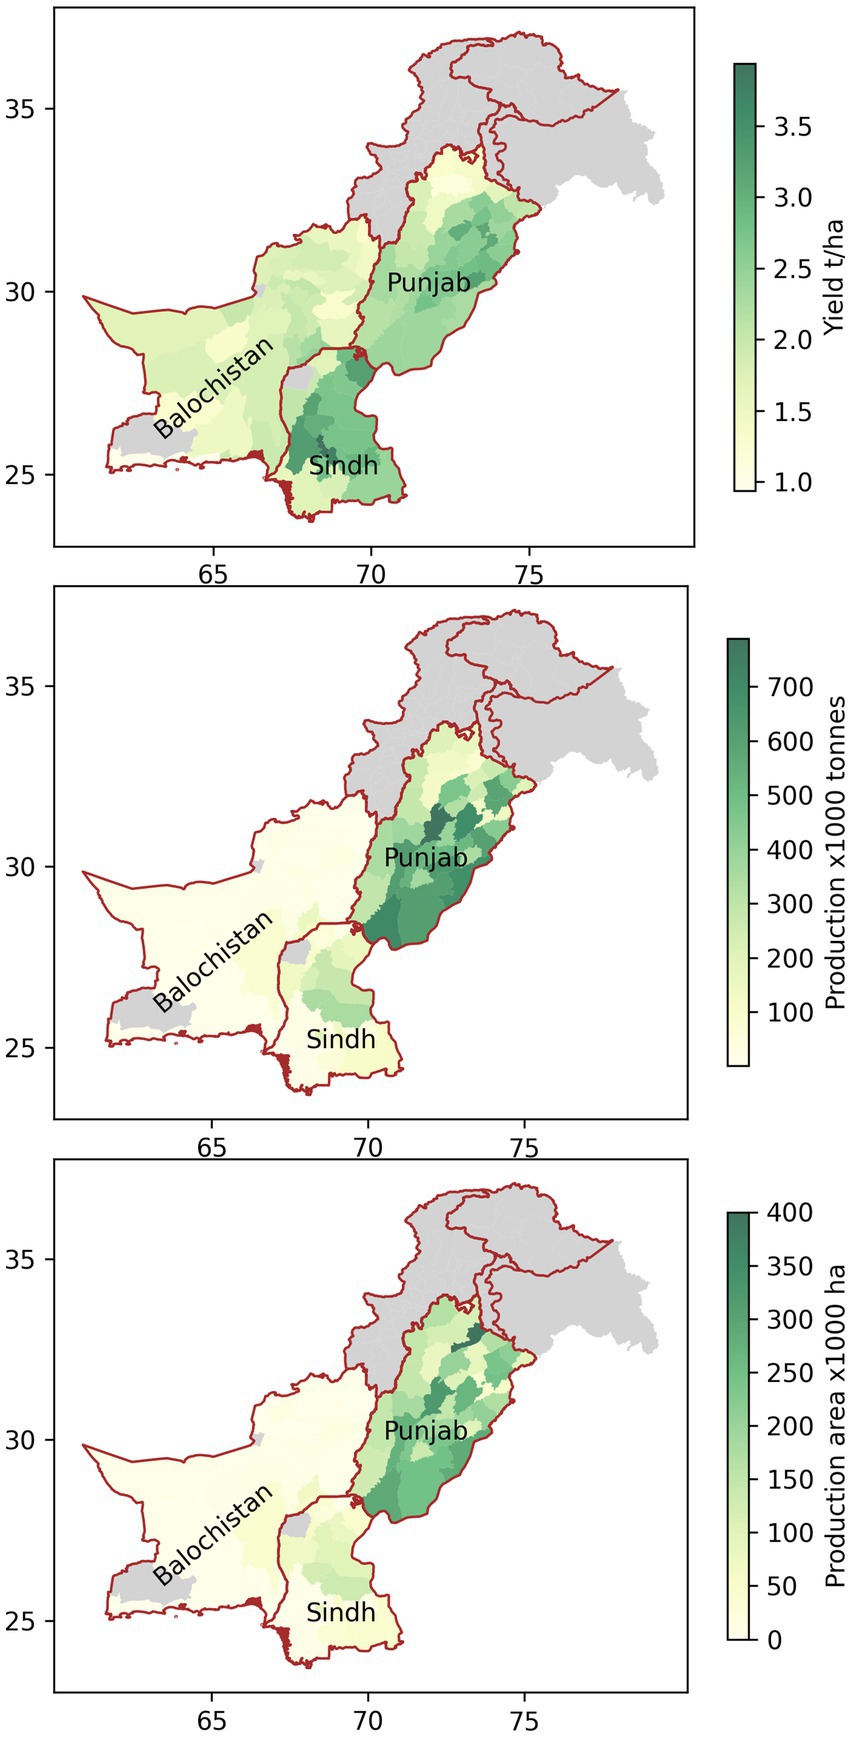
Figure 3. Observed district scale yield (top), production (middle) and production area (bottom) for the Punjab, Sindh and Baluchistan provinces of Pakistan. Grey shading denotes either provinces that were not included in the study, or districts for which no data were available.
Figure 1 shows the annual total precipitation and the annual mean NDVI for Pakistan and the surrounding regions. It can be seen that there is considerable spatial variation in precipitation, with northern regions of Punjab receiving orders of magnitude more rainfall than southern Sindh. The gross spatial pattern in NDVI does not follow the precipitation. In southern Sindh, where there is very little rainfall, NDVI is moderate. The reason for this is that vegetation in Sindh is supplied with water from the river overflow resulting from upstream glacial melt and monsoon rainfall. The discrepancy between vegetation and precipitation means that precipitation cannot, on its own, be used to monitor agricultural drought in Sindh. The mismatch between vegetation and precipitation is underlined by Figure 4, which shows the Pearson correlation coefficient (r2) for NDVI with precipitation and VHI. The correlation with precipitation is low in all regions, and the correlation with VHI is moderate – suggesting that the temperature component of VHI is driving much of its variability.
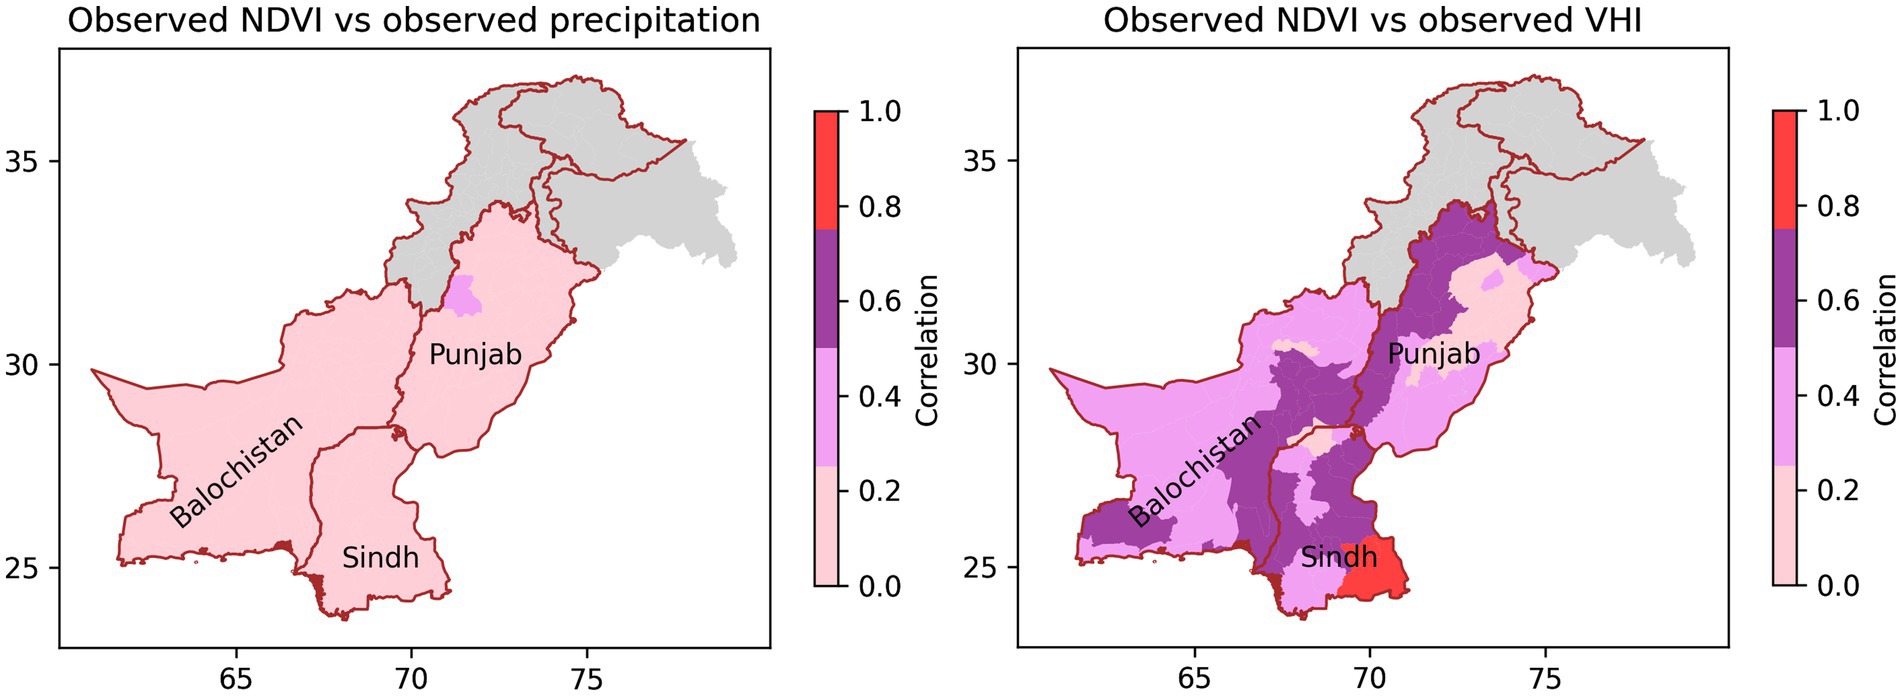
Figure 4. Correlation coefficient (Pearson r2) of interannual variability in November–April seasonal mean NDVI with seasonal cumulative precipitation (left) and seasonal mean VHI (right).
Figure 5 shows the climatological mean half month cumulative precipitation and mean NDVI for the Rabi season for each of the provinces. VHI is not shown because it is normalised to the time of year and therefore does not exhibit a seasonal cycle. In Punjab, Rabi is clearly the secondary season, and most of Sindh does not experience a Rabi rainy season. In Baluchistan, on the other hand, Rabi is the main rainy season. The seasonal cycle plots underline how little precipitation Sindh experiences during Rabi (<10 mm over the whole season). The discrepancy between NDVI and precipitation discussed above is also evident, with Sindh having a peak in NDVI during the Rabi season, in spite of the low precipitation; in Punjab, although most precipitation occurs during the summer, the greatest NDVI is during the winter. In Baluchistan, the seasonal cycle in NDVI is weak, with NDVI remaining low (< 0.05) throughout the year. Figure 3 shows that winter wheat production is dominated by Punjab, with very low amounts of production in Baluchistan, and production in Sindh ~20% of production in Punjab. There is a strong positive trend in production in Punjab, and a weaker trend in Sindh. Trends in NDVI, VHI and precipitation are insignificant. Time series for each of the candidate drought metrics are shown in Figure 6. Consistent with Figure 1 and Figure 5, the annual precipitation for Sindh is far lower than for Punjab and Baluchistan, but NDVI is higher in Sindh than in Baluchistan.

Figure 5. Seasonal cycles in two-week cumulative precipitation (top row) and two-week maximum NDVI (bottom row) for Punjab (left column), Sindh (middle column) and Baluchistan (right column). The error bars represent interannual standard deviation. The vertical green lines denote the beginning and end of the rabi season.
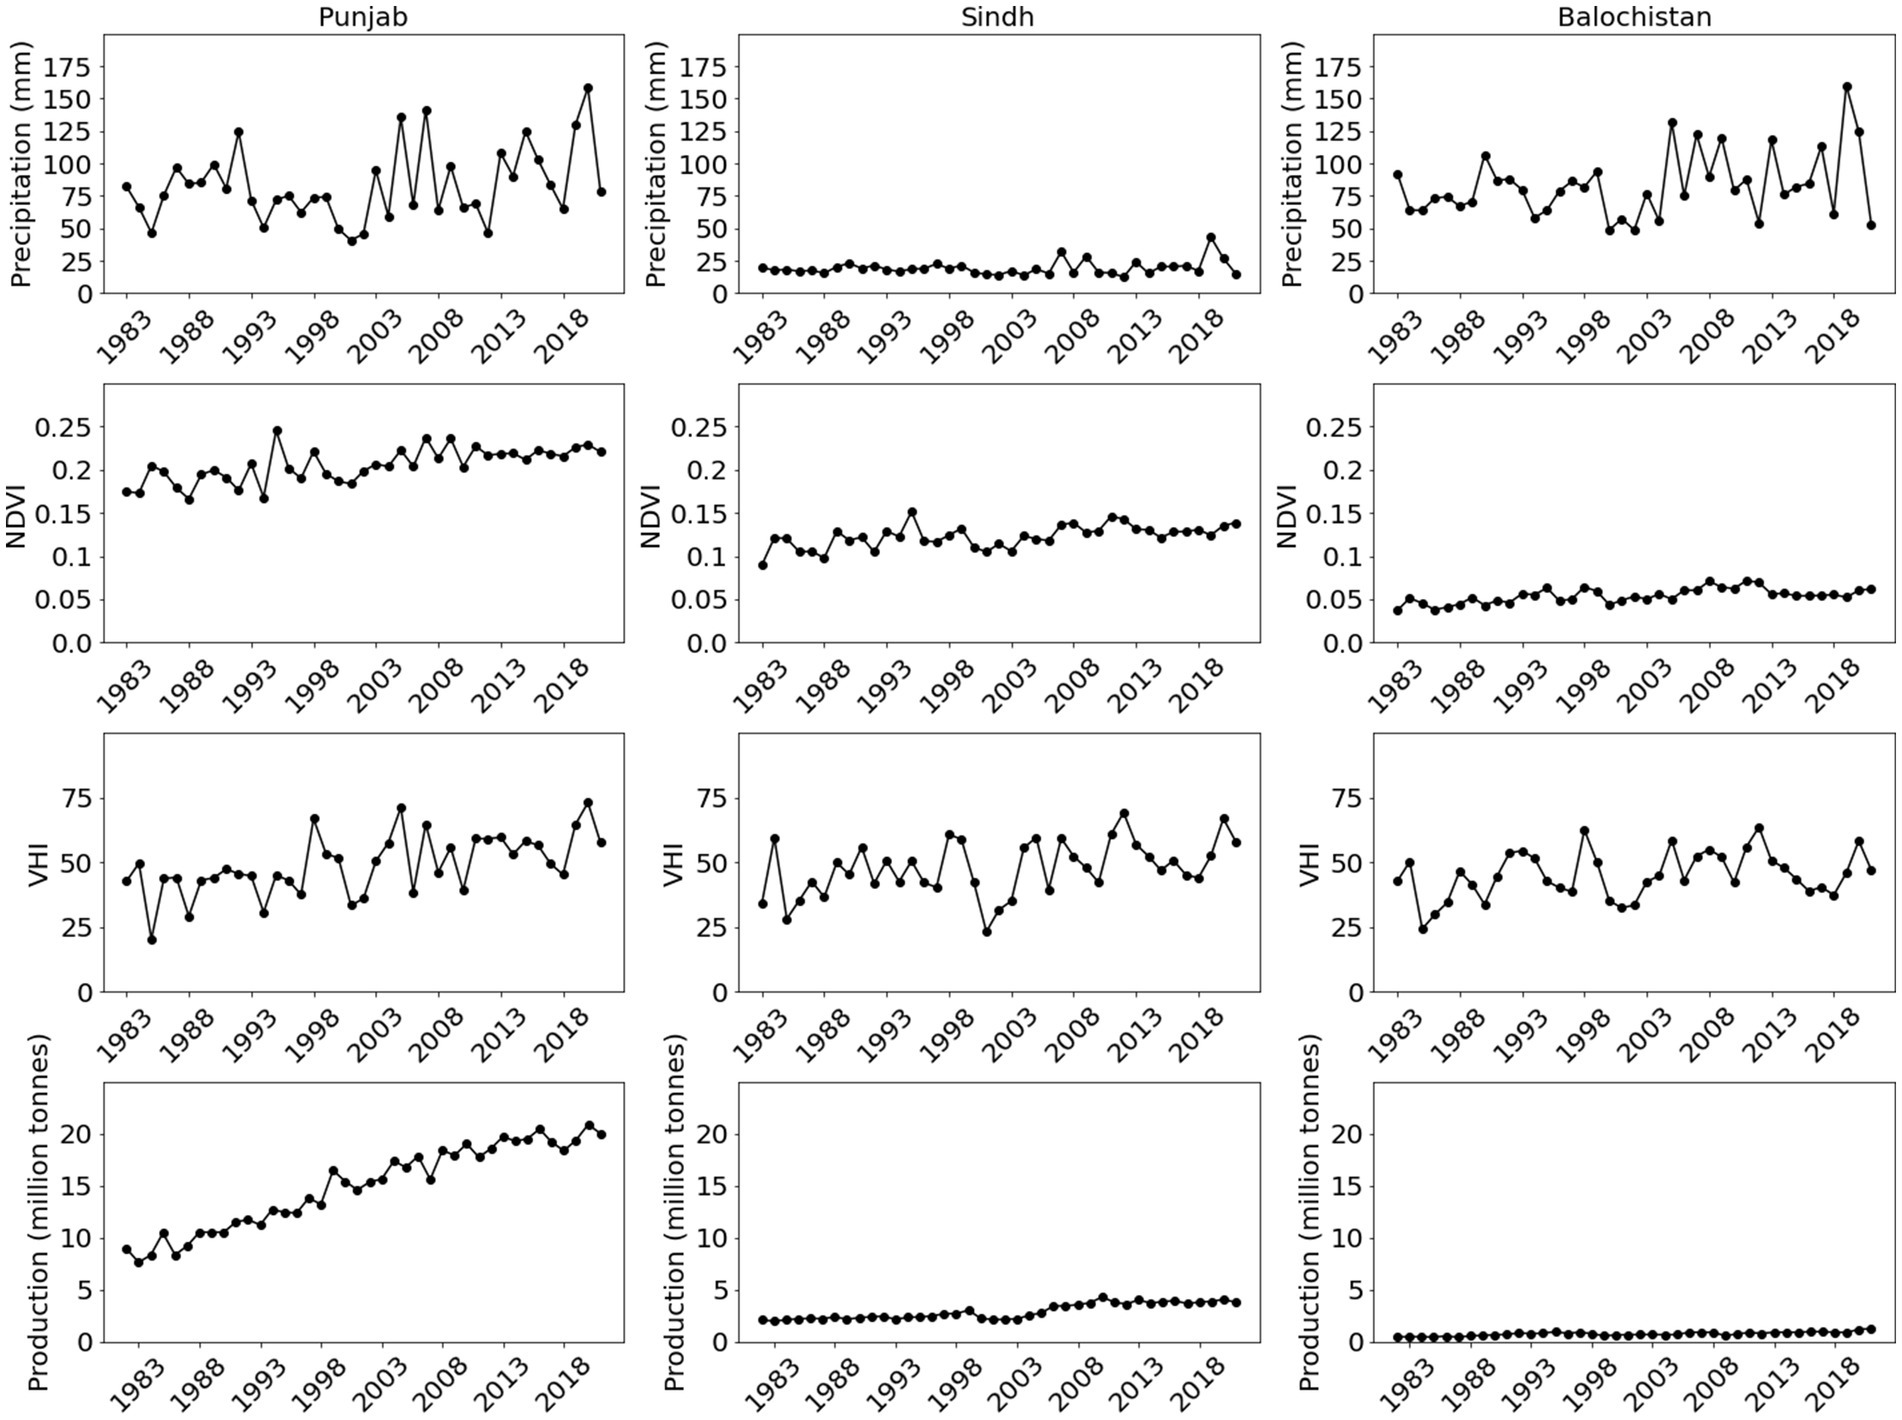
Figure 6. Time series in rabi cumulative precipitation (top row), annual mean two-week rabi maximum NDVI (second row), annual two-week rabi mean VHI and seasonal winter wheat production for Punjab (left column), Sindh (middle column) and Baluchistan (right column).
Comparison of meteorological and hydrological settings thus show clear contrasts between the three provinces. Punjab has two strong rainy seasons per year and depends on winter wheat production. Winter wheat yield can is thus a reasonable proxy for winter drought. Although agricultural production is primarily rainfed in some districts, in others it is naturally or artificially irrigated, with water provided by upstream rainfall, groundwater and glacial melt. Drought assessments based purely on precipitation are hence unlikely to reflect the true risks to agriculture. In Sindh, in contrast, production of winter wheat is highly variable with some of the most vulnerable southern provinces cultivating very little. Precipitation in much of the province is extremely low (<20 mm over the whole Rabi season), with winter vegetation dependent on natural and artificial irrigation from rivers. The low level of rainfall and the sparse cultivation mean that the DRF funds release can depend neither on precipitation-based indices nor on estimation of winter wheat yield. In contrast to Sindh and Punjab, in much of Baluchistan, Rabi is the primary rainy season, with little or no rain during Kharif. Most vegetation is rainfed, and so meteorological drought (rainfall deficit) places the region at risk of agricultural and hydrological drought.
Based on these considerations, the drought metrics chosen for each province are:
• For Punjab, the chosen metric is simulated winter wheat. This is because the wheat model is highly skillful (see Section 3) and because the economy of Punjab (and arguably all of Pakistan) is sensitive to national wheat production, which is determined primarily by production in Punjab.
• For Sindh, the chosen metric is VHI. The reason for this is that the vegetation cover in large parts of the province is not sensitive to the very low amounts of rainfall experienced. For the very low rainfall districts of Sindh, it is not possible to determine the risk of agricultural drought on the basis of rainfall deficit. VHI is chosen over NDVI to reflect the sensitivity of the small-scale cultivation in low precipitation regimes to high temperatures (Ahmed et al., 2018)
• For Baluchistan, the chosen metric is precipitation. The reason for this is that the condition of the land surface depends strongly on precipitation. In much of the province, furthermore, Rabi is the primary rainy season, which means that operational national level drought monitoring for the province reflects Rabi precipitation. Basing the DRF funds release on precipitation will thus bring Baluchistan in line with the Pakistan Meteorological Department’s drought assessments.
2.4 Wheat yield modelling methodology
Wheat yield is modelled by relating NDVI to observed district-scale yield. The first stages of the modelling process aim to identify the period of interest and spatial mask that are maximally correlated with district-scale wheat yield. This process can be considered a proxy for identifying the most critical crop development stage, and the regions in each district where wheat is grown. Note that these temporal and spatial masks are assumed to be constant in time. The assumption of a static spatial mask is justifiable, given that variations in production area will tend to result from intensification of agriculture in the regions known to be suitable for cultivation. The assumption of a static temporal mask is, moreover, a necessary simplification, given the twice monthly temporal resolution of the NDVI data and the wide range of planting times within individual districts.
The process of identifying the spatial crop mask and the period of interest are as follows:
1. Calculate the Pearson correlation coefficient (r) between district yield and each NDVI grid point for NDVI averaged over all possible periods from 1st October – 30th April. The period can be any length, from 2 weeks to 6 months
2. For each grid point select the period with the highest correlation (the grid point optimal period)
3. Calculate the Pearson correlation coefficient between district yield and grid point NDVI averaged over the grid point optimal period.
4. The crop mask consists of any points where either: r > 0.8 or r > 95th percentile in r for the district as a whole.
5. The district period of interest is the mean of the optimal start and end dates, calculated only for points included in the crop mask.
Once the district period of interest and spatial crop mask have been identified, an annual time series of winter wheat NDVI is derived by averaging over temporally and spatially masked values for each year.
The final stage in the development of the statistical yield model is to relate the annual time series of NDVI to the annual district yield. For this, a generalized linear model approach was used. To ensure independent validation, a leave-one-out cross validation was performed, in which the yield for each year was estimated, based on a model trained using all of the other years in the time series.
Figure 7 and Figure 8 illustrate the modelling process for two example districts, one with a weak observed trend in yield (Attock) and one with a strong trend (Khairpur). For Khairpur, it can be seen from the correlation map that some regions have low or negative correlation with yield, whilst others are strongly correlated. Comparison with an independent survey (USAID, 2014) confirms that the regions selected in our modelling process broadly reflect regions of more intense cultivation.
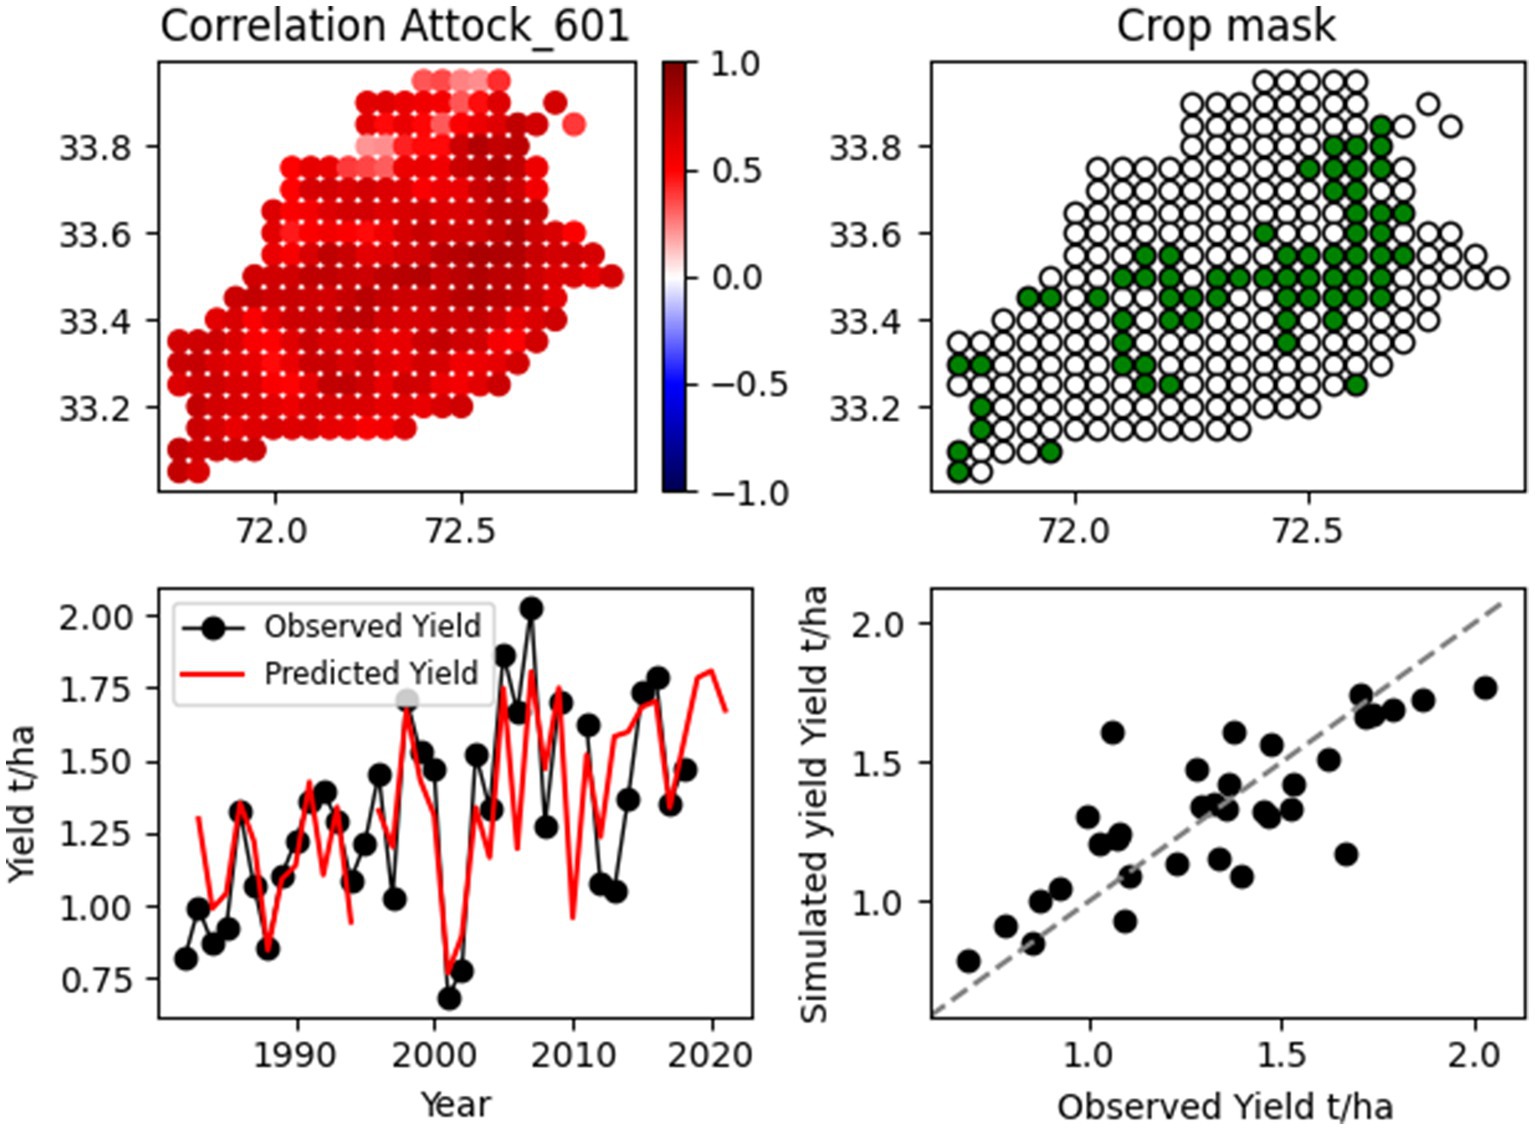
Figure 7. Modelling of interannual variability in yield at the district level for an example district in Punjab (Attock). The top left plot shows the Pearson correlation coefficient (r) between interannual NDVI at each grid point and interannual yield. The top right plot shows the selected points for the regression analysis. The bottom left plot is a time series of observed and simulated yield and the bottom right plot is a scatter plot of simulated yield plotted against observed yield (grey dashed line is a one to one line).

Figure 8. As for Figure 7 but for the Khairpur district in Sindh.
2.5 Methodological approach to forecasting drought metrics
The Tropical Applications of Meteorology using SATellite data - AgricuLtural Early WaRning sysTem (TAMSAT-ALERT) approach (Brown et al., 2017; Asfaw et al., 2018; Boult et al., 2020) has been adapted for prediction of each of the candidate metrics, including the NDVI time series used to drive the wheat model described above.
TAMSAT-ALERT treats agricultural risk as an aggregation of events over a period of time. For example, yield depends on meteorological conditions over the whole growing season. If we are to update our risk assessments during seasons of interest, it is thus necessary to combine monitoring of the past, with forecasts of future conditions. The TAMSAT-ALERT approach is to generate an ensemble, with each member consisting of an observed time series for the past, spliced together with forecasts based on multiple possible futures. The future ensemble is generated from the local historical climatology, with each member being a time series from individual year from the past. For variables, such as NDVI, that are persistent in time, the system is initiated from the model state at the end of the historical period. For metrics like soil moisture, which are not routinely observed, a model is driven with meteorological data (Asfaw et al., 2018; Boult et al., 2020); for directly observed quantities, the metric is calculated directly from the monitoring and historical data (Brown et al., 2017). The implementation for the candidate drought metrics is summarised below.
2.5.1 Seasonal cumulative precipitation
On a given day within the growing season (the initiation date), ensemble forecasts are composed of observed precipitation from the start of the season of interest (1st November) until the initiation date, with precipitation from the initiation date until the end of the season (30th April) represented by a climatological ensemble (for 1983–2020). Each ensemble member is thus historical rainfall from 1st November until the initiation date, spliced with the precipitation time series from a all years within the climatology. The ensemble mean is the November – April cumulative precipitation, calculated for each member, averaged over the whole ensemble. Analogously, the ensemble standard deviation is the standard deviation of the November–April cumulative precipitation, derived for the whole ensemble. The probability of the cumulative precipitation being lower than a user-defined threshold is calculated from the ensemble mean and standard deviation, assuming a Gaussian distribution. In this implementation, precipitation is assumed not to be persistent in time, and so the ensemble forecast is not initiated from the model state on the day of initiation. All skill in the forecasts thus arises from the inclusion of observed precipitation as the season progresses. On the first day of the season (November 1st), the skill is equivalent to a purely climatological forecast.
2.5.2 NDVI and VHI
Seasonal mean NDVI and VHI are predicted in an analogous fashion to cumulative precipitation. The only difference is that the ensemble forecasts on the initiation date are initialised from the NDVI/VHI on that day, with the climatology composed of time series of NDVI/VHI increments from the previous time-step. We expect, therefore, that even on the first day of the season (November 1st), skill may be better than climatology in regions where NDVI and VHI are strongly persistent in time.
2.5.3 Wheat yield
Wheat yield is predicted by running the yield model described in the previous section with an ensemble of predicted NDVI, in place of observations. The regression model is driven with each ensemble member, and the ensemble mean and standard deviation yield/production is derived from in the same way as for the other variables. It should be noted that once the locally determined period of interest for yield estimation has passed, the yield predictions are based only on the observation part of each ensemble member time series, and so the ensemble standard deviation will be zero. At this stage, the probabilities of the yield being lower than a user defined threshold will thus collapse to 0 or 1.
2.5.4 Example forecasts
Formal skill evaluations are included later in the paper, but to illustrate the principals of the method, example NDVI forecasts for 5 and 2 month lead times are shown in Figure 9 for the drought-affected 1999–2000 season (equivalent VHI and precipitation forecasts are provided in Supplementary Figures S1, S2). The persistence of NDVI means that, even near the beginning of the season (lead time 5 months), there are strong negative anomalies – and in the northern part of the region, these anomalies persist. Comparison between the 5- and 2-month leads indicates that the bias of the forecasts compared to the observations reduces strongly as the season progresses and additional observations are included.
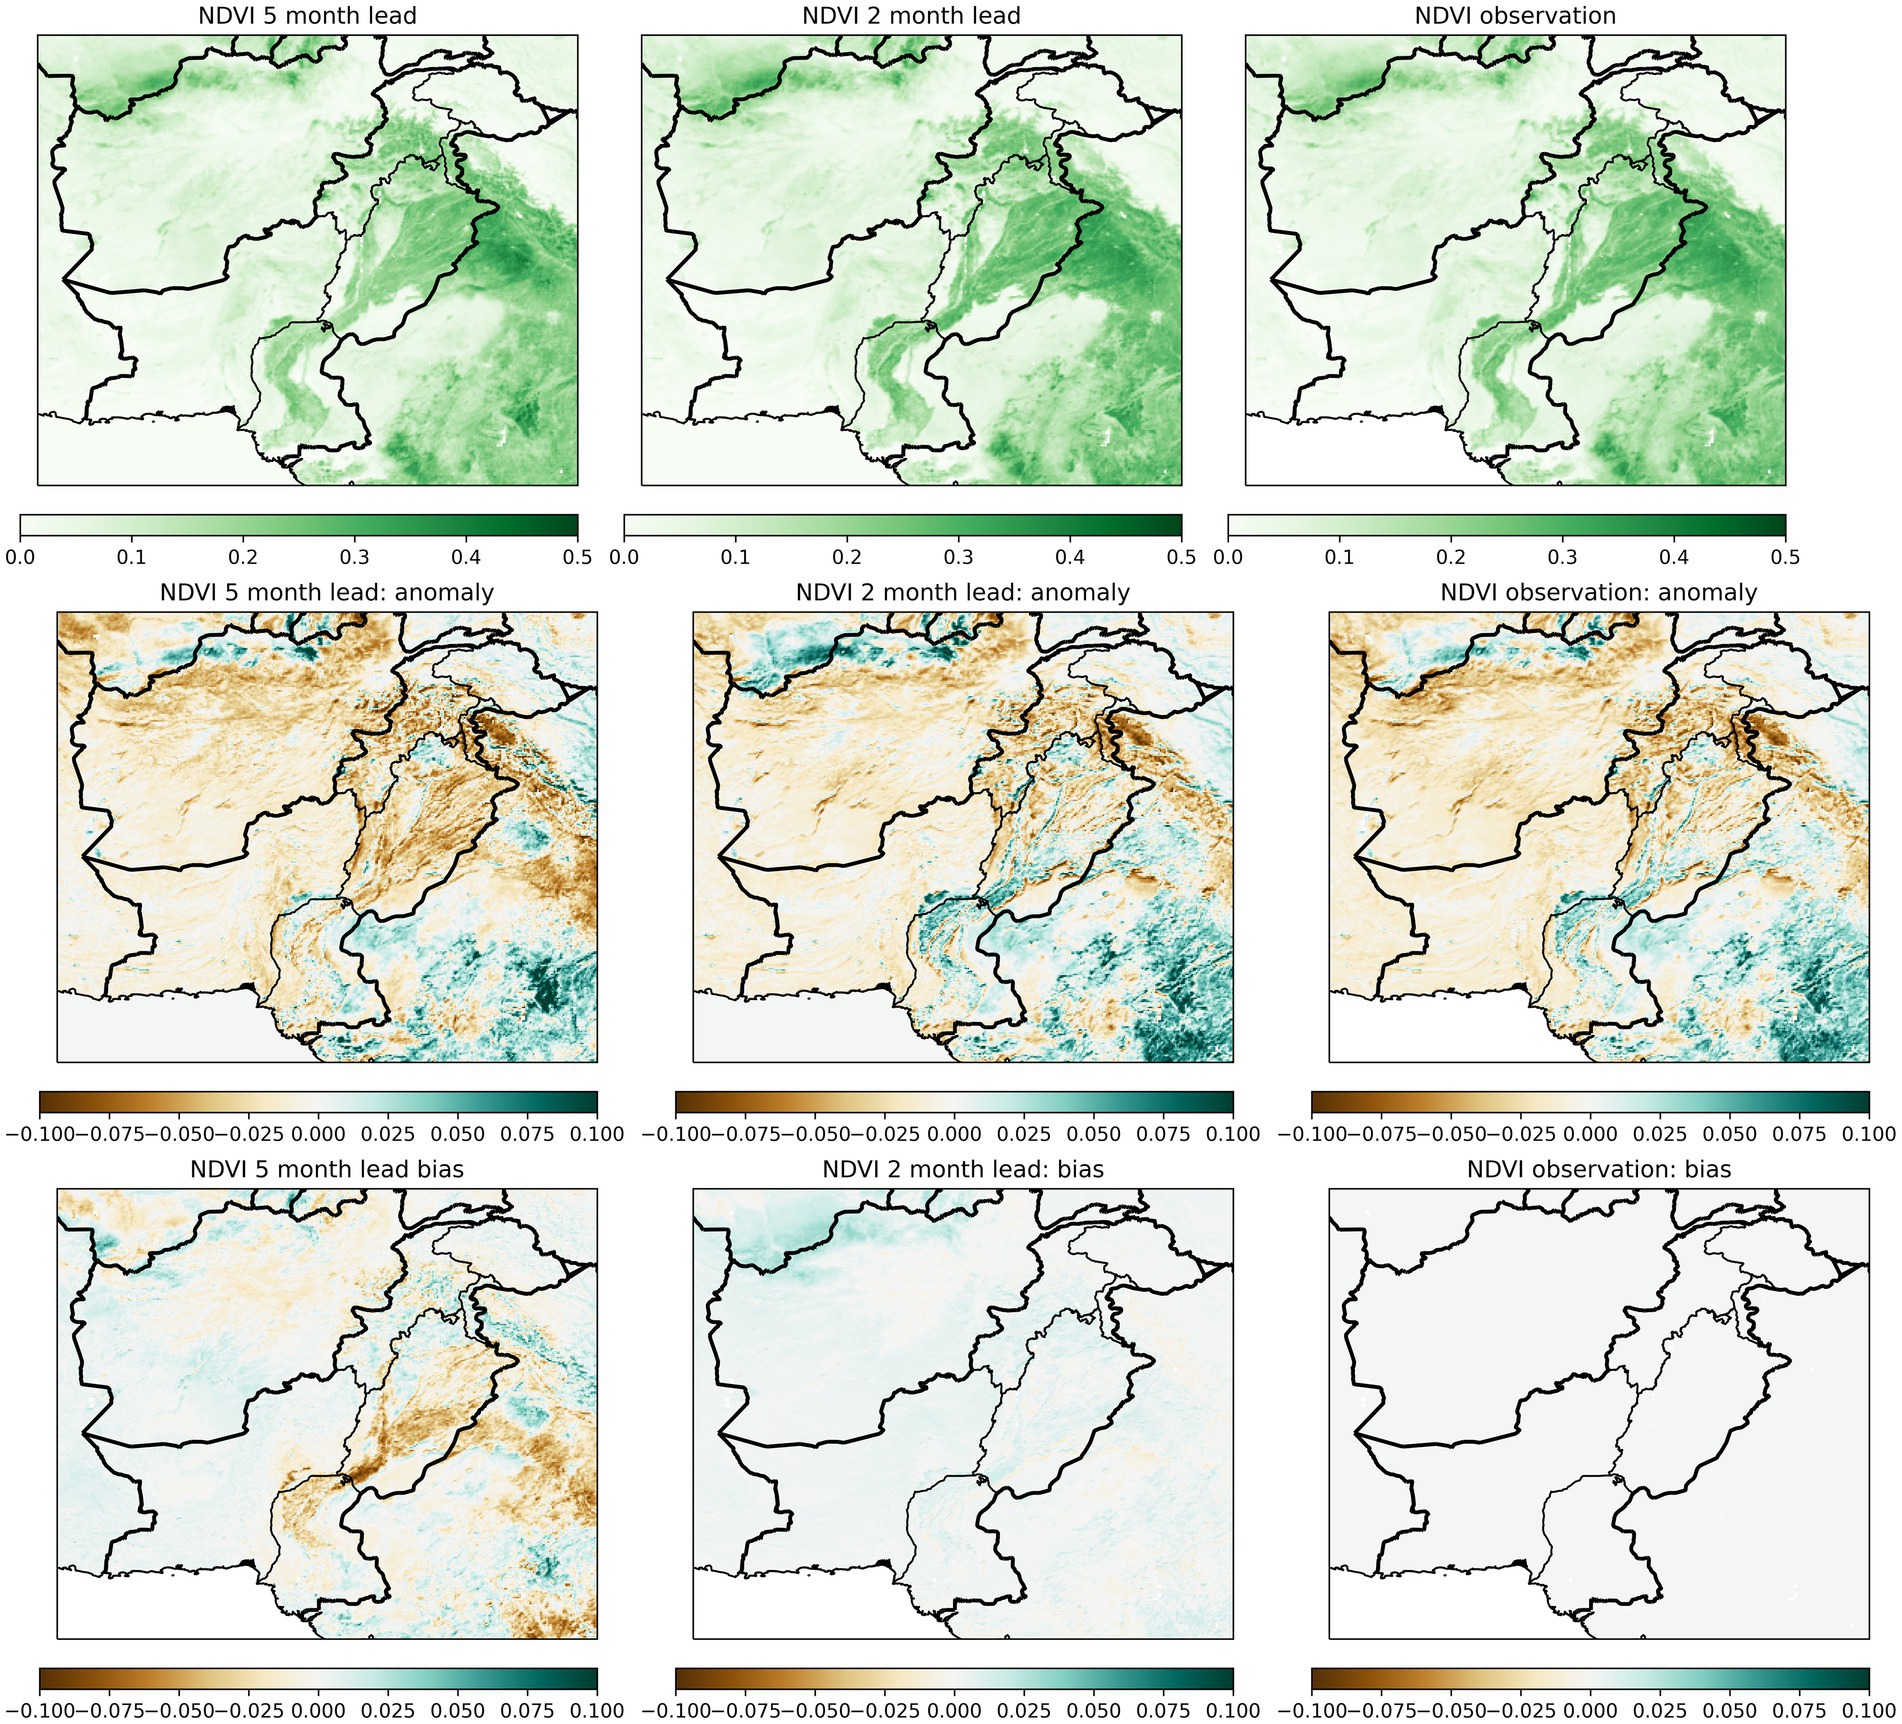
Figure 9. Example forecasts for year 2000 November–April seasonal mean NDVI seasonal for lead times of 5 months (left) and 2 months (middle) compared with observations (right). The rows are, from top to bottom: mean/ensemble mean NDVI; NDVI anomaly compared to a long term climatology; and bias compared to observations. Equivalent plots for precipitation and VHI are provided in the supplementary materials.
As was described above, in contrast to the NDVI and VHI forecasts, the precipitation forecasts are not initialised from the model state at the end of the historical period. The predictive power of the precipitation forecasts thus depends solely on inclusion of observations as the season progresses. This means that near the beginning of the season (5 month lead), the forecast precipitation is close to climatology. The observed dry anomalies only become evident as the end of the season approaches, at which point the forecast is dominated by observations.
3 Results
3.1 Skill of the wheat crop model in representing district scale yield
The skill of the wheat crop model is assessed by running the model for all districts for 1983–2015 and comparing the simulated crop yields against observations for all districts in Punjab, Sindh and Baluchistan, for which sufficient observational data were available for calibration. Figure 10 shows that the correlation (Pearson r2) between observed and simulated yield is generally >0.8 in the high production districts of Punjab, but is significantly lower in some districts of Sindh. In Baluchistan, all correlations are lower than 0.5 – reflecting the low quality of the observed yield data throughout the province. Furthermore, in many districts in Baluchistan, there was not enough observational yield data to implement the yield model, and in any case, wheat production is low (Figure 3). Figure 10 also shows the correlation between observed winter wheat yield and the other candidate metrics (seasonal mean NDVI, seasonal mean VHI, and seasonal cumulative precipitation). Observed wheat yield correlates more closely with simulated yield than with seasonal mean NDVI, confirming that the optimization process of identifying critical regions and crop development periods improves the skill of the yield predictions. Correlation between observed yield and precipitation is weak – even in the high production and relatively high rainfall regions of Punjab (Figures 1, 3). This is because cultivation relies on natural and artificial irrigation rather than precipitation. Furthermore, the lack of correlation between precipitation and the principal crop grown in Punjab supports our approach of considering a range of drought metrics for all regions of Pakistan.
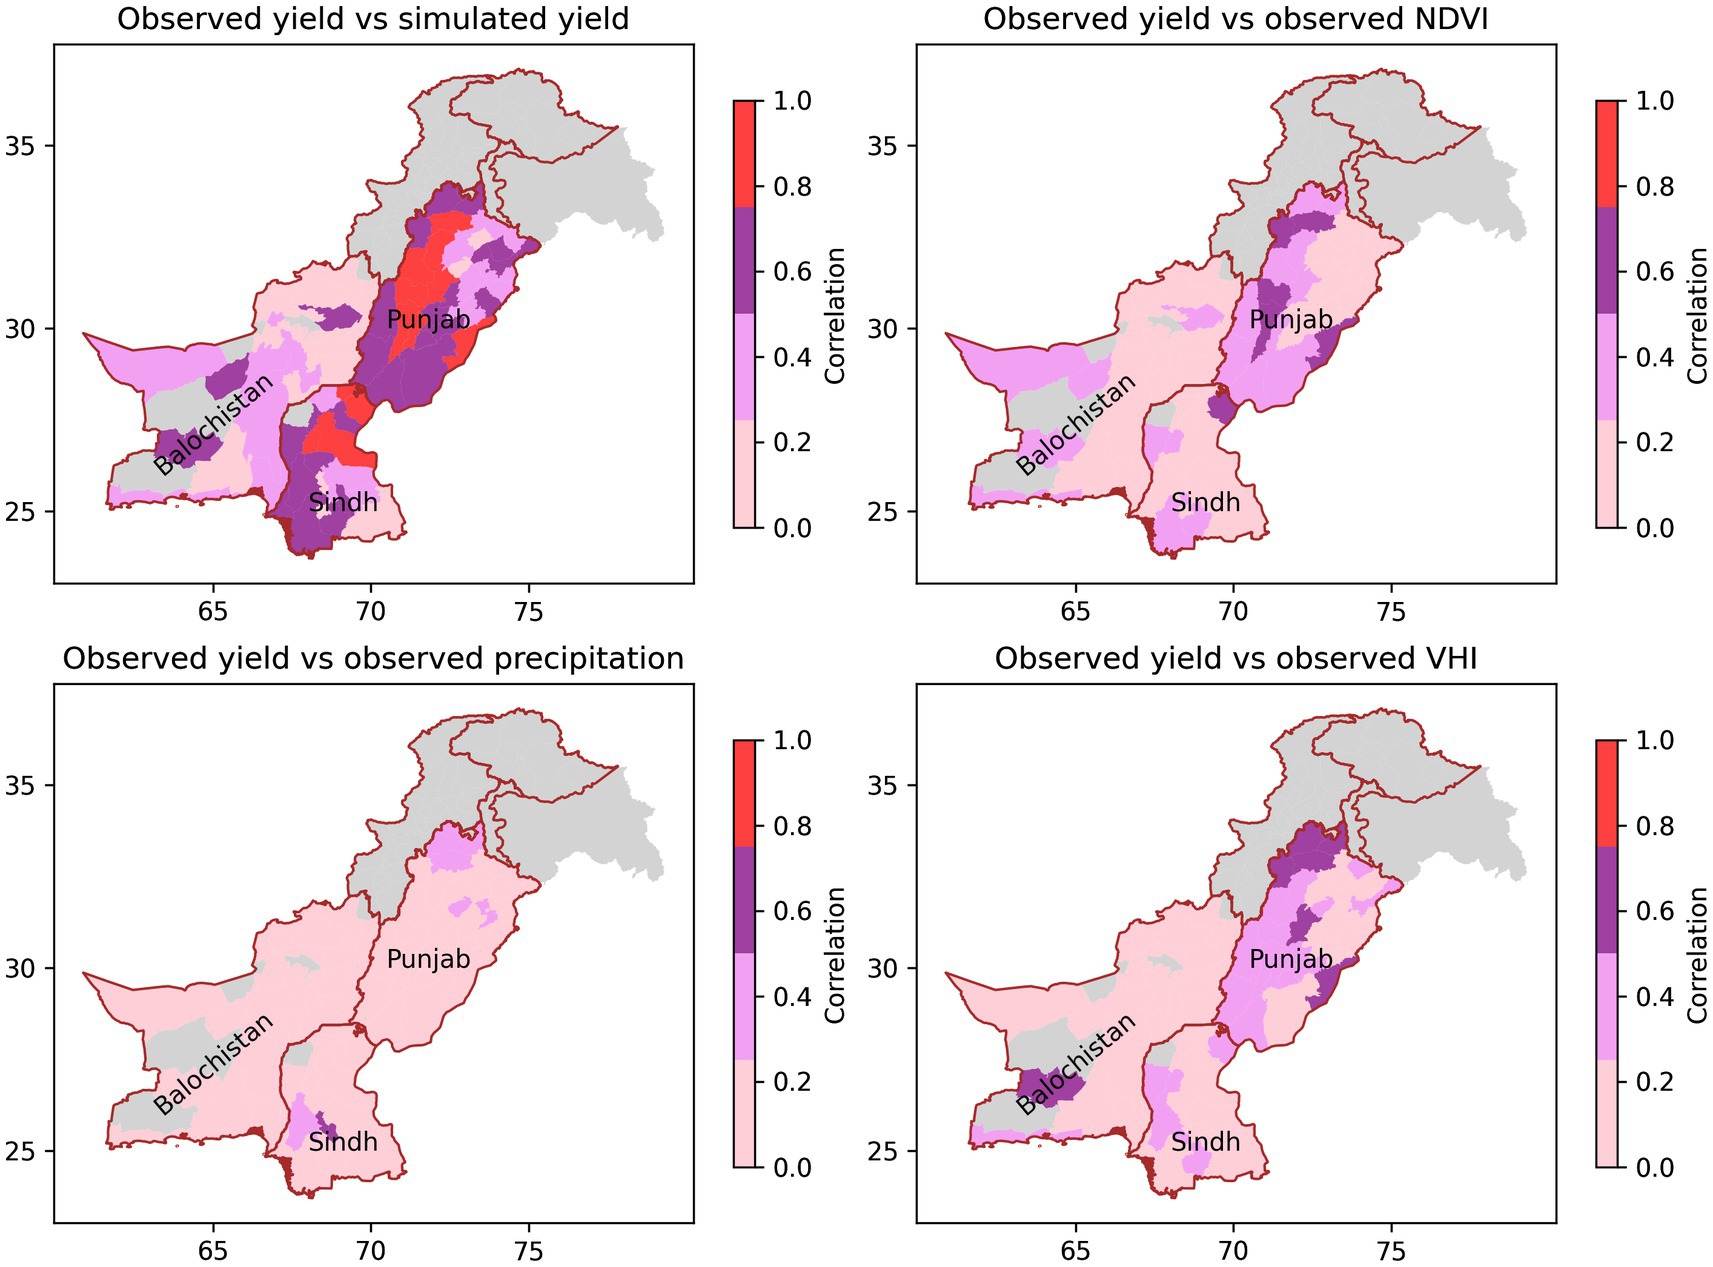
Figure 10. Correlations of observed yield with: (top left) simulated yield; (top right) observed NDVI, (bottom left) observed precipitation and (bottom right) observed VHI.
3.2 Prediction skill at the district scale
Although the DRF is implemented at the province scale, it is relevant to evaluate the prediction model at the scale it is run. Hindcasts of NDVI, VHI and precipitation were carried out on the gridded dataset for 1983–2021, and then aggregated to the district scale. For yield, where gridded data are unavailable, the hindcasts were carried out at the district scale. The hindcasts were run for lead times of 6 months – 1 month, with lead time defined as the length of time before the end of the season (i.e., the length of time before April 30th). A leave-one-out cross-validation approach was used, with the model re-calibrated to exclude data from each target year.
The metrics forecast were: observed yield, simulated yield, November–April seasonal mean NDVI, seasonal mean VHI and seasonal cumulative precipitation. By the end of the season, (lead time 0), the forecasts of simulated yield, precipitation, VHI and NDVI are by design perfect because the prediction is based entirely on observations. This is not, however, the case for observed yield because of the residual error in the wheat yield model (Figure 10). To allow fair comparison between the metrics, the skill scores shown in Figures 11, 12 thus compare predicted yield with simulated yield at the end of the season. Equivalent correlation plots for each of the predicted metrics compared to observed yield are provided in the supplementary materials (Supplementary Figures S3, S4). Note that yield hindcasts for Baluchistan were not produced because of the poor performance of the wheat model for observed data.
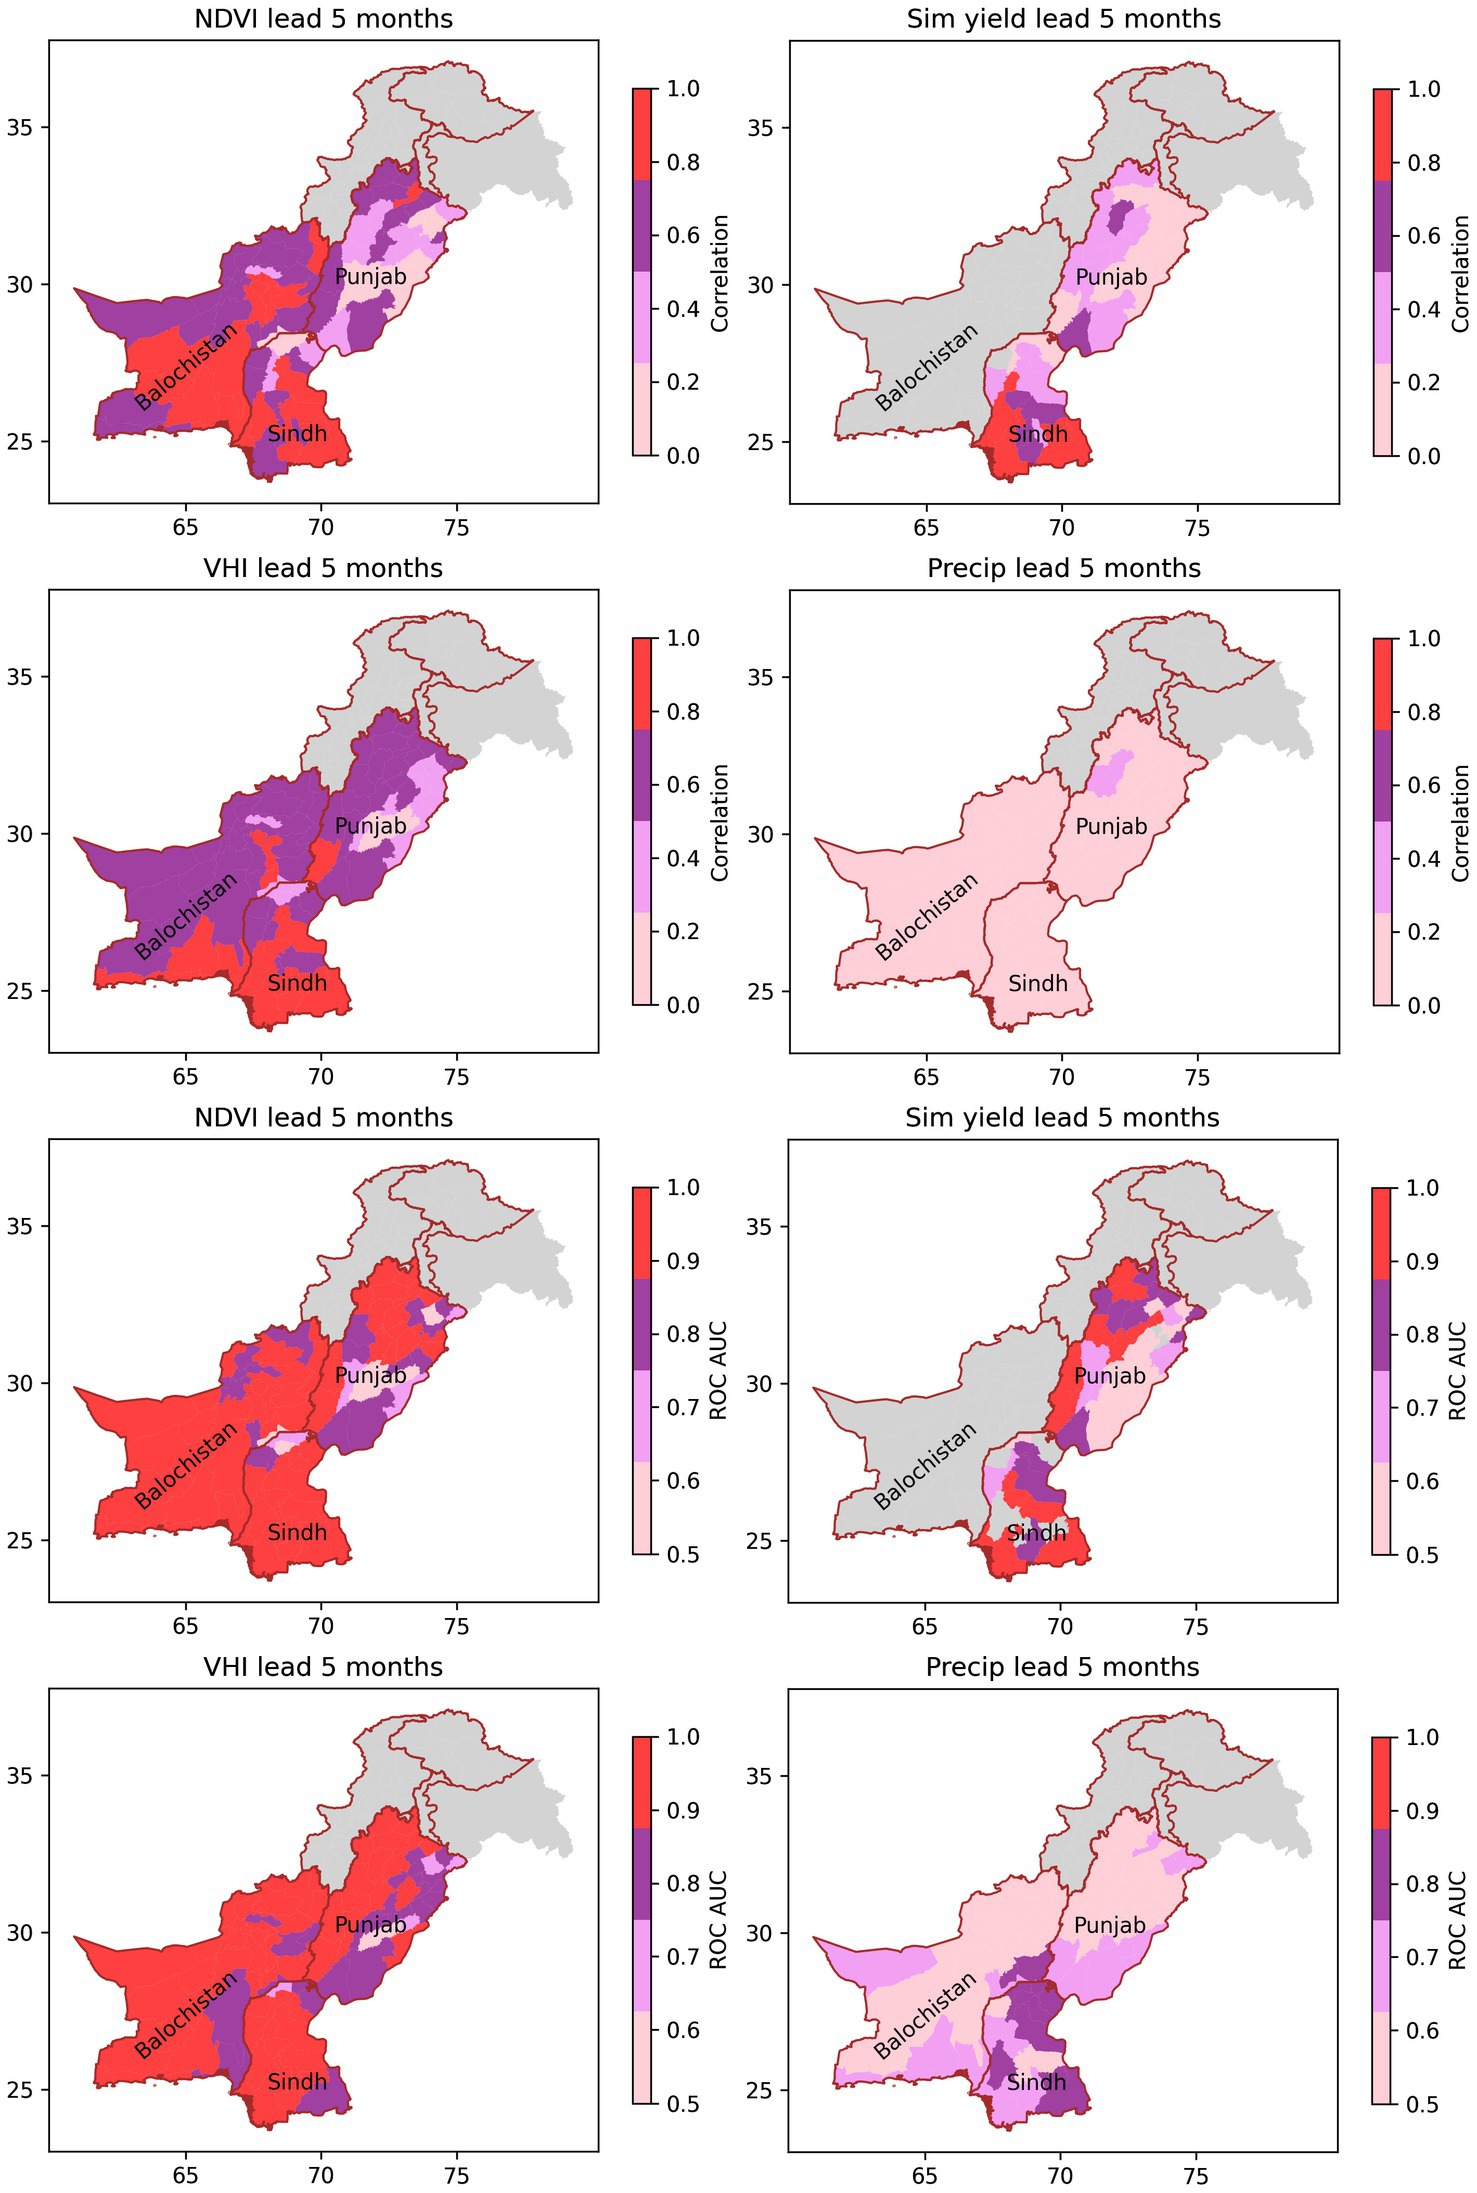
Figure 11. Correlation (top set of plots) and ROC-AUC (bottom set of plots) showing the skill of the system for forecasting observed NDVI, simulated yield, observed VHI and observed Precipitation 5 months in advance of the end of the season. The plots include data for the districts in the Punjab, Sindh and Baluchistan provinces of Pakistan. The ROC-AUC is calculated for a 20th percentile event.
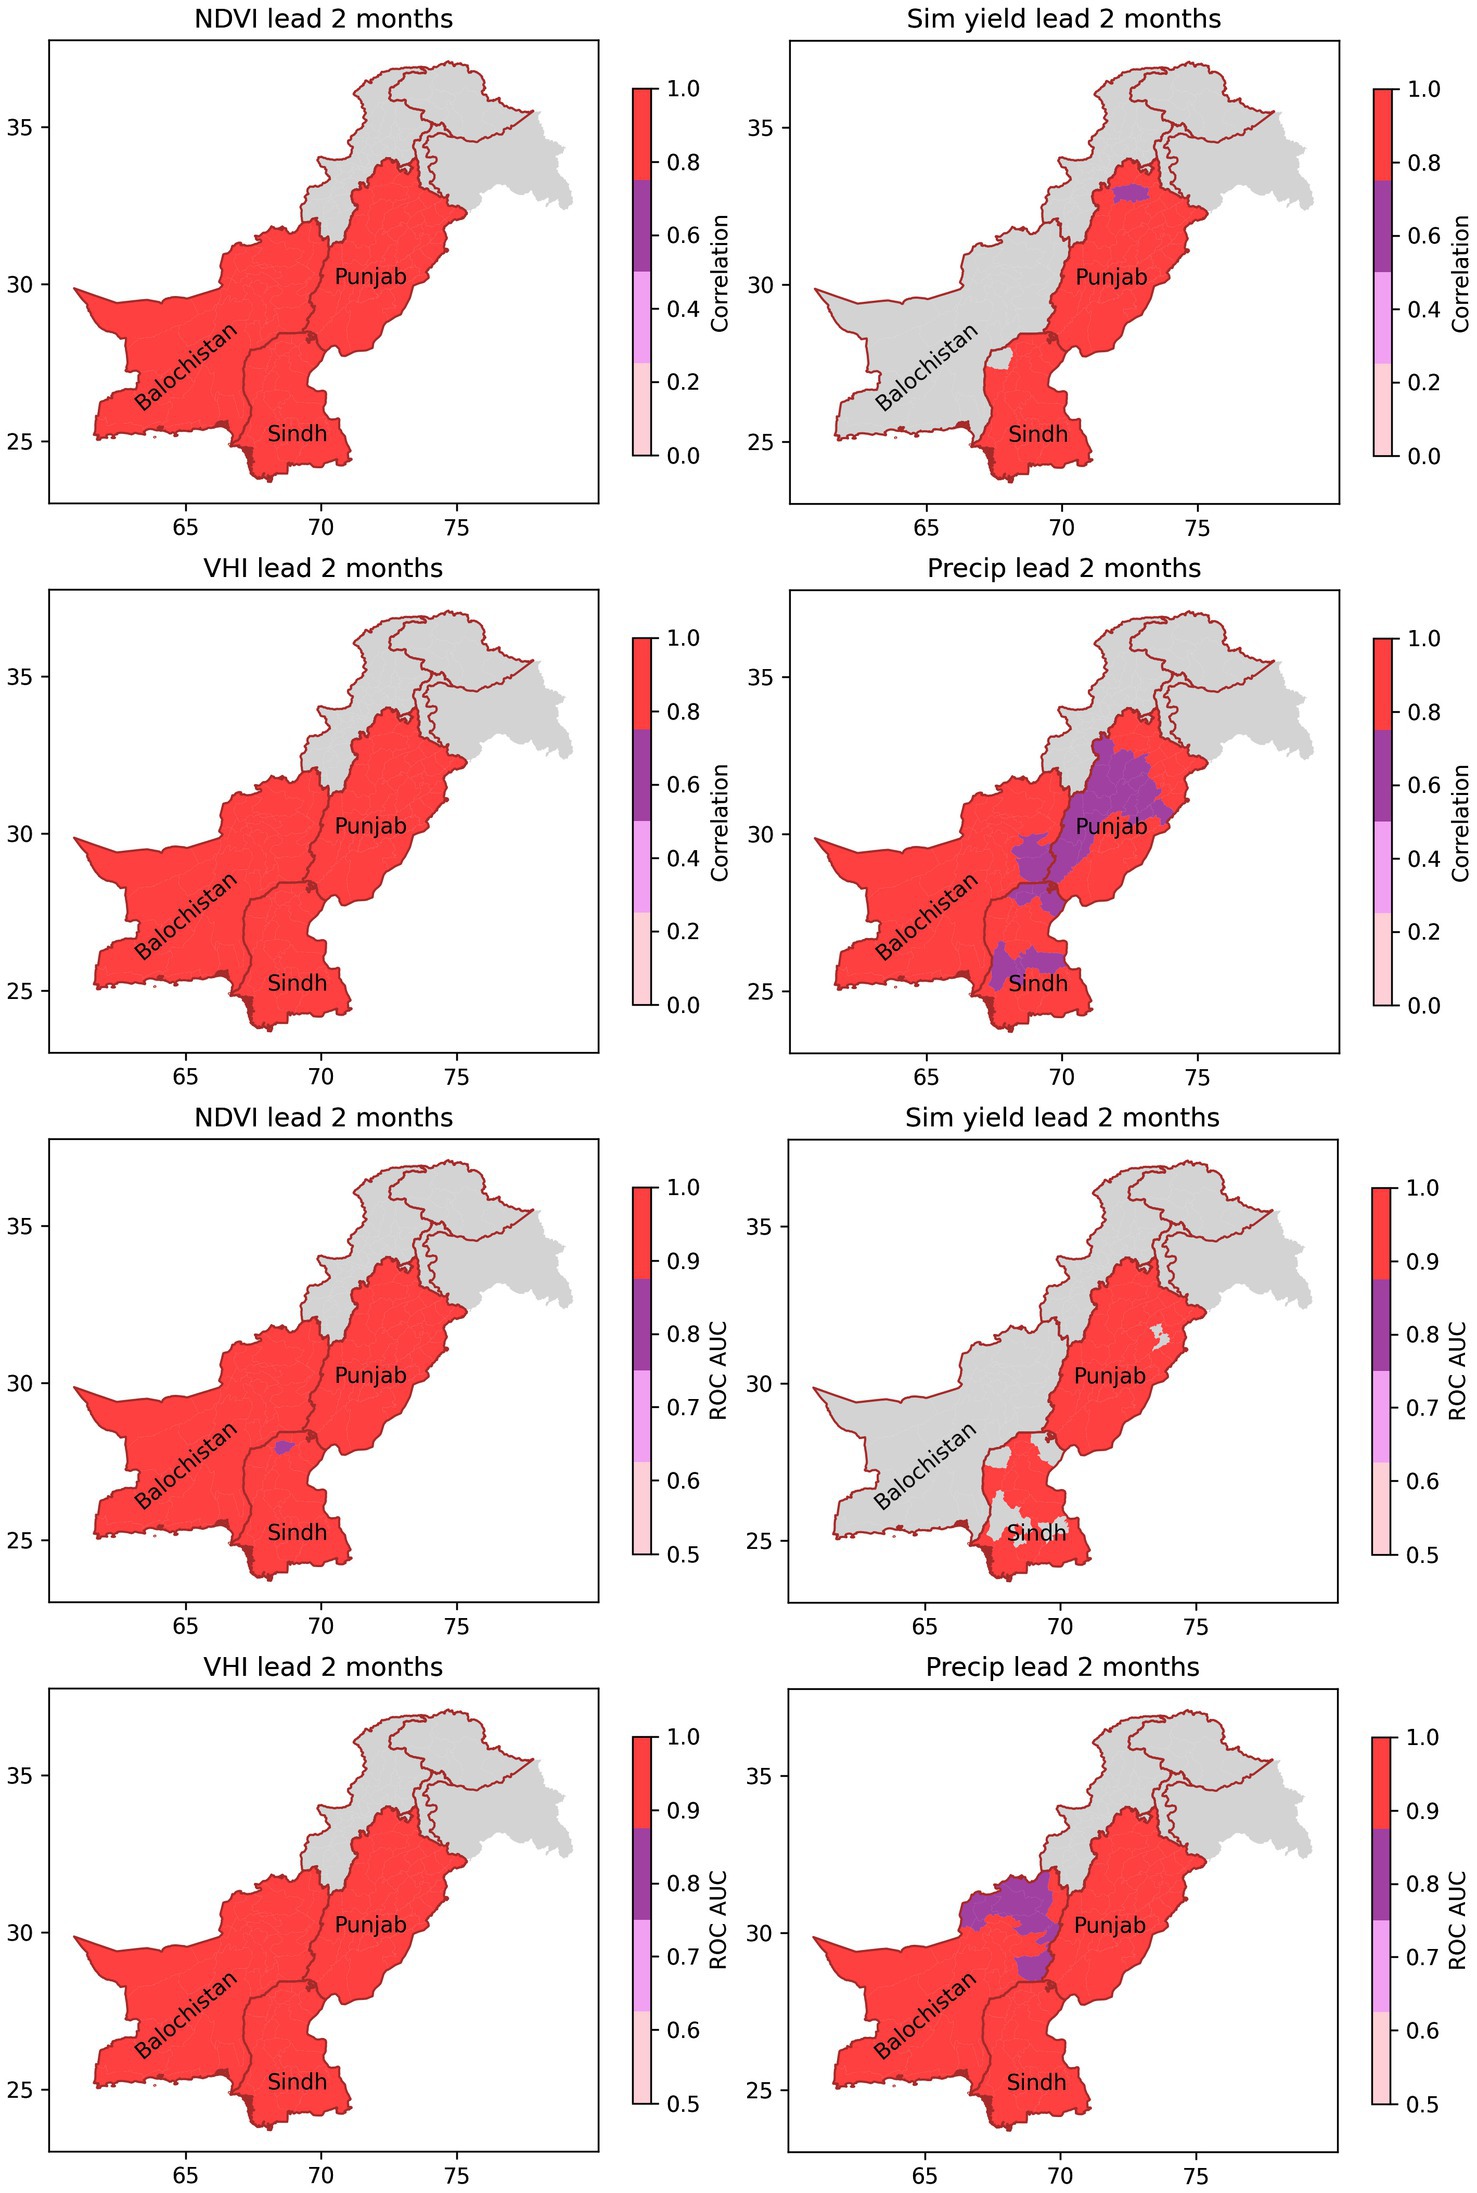
Figure 12. As for Figure 11, but with a 2-month lead.
Hindcasts are displayed for lead times of 5 months and 2 months in Figure 11 and Figure 12 respectively (other lead times not shown). Two metrics of skill were derived: Pearson correlation coefficient (r2) and receiver operating characteristic area under curve (ROC-AUC) for a 25th percentile event3. It can be seen that for NDVI, simulated yield and VHI, there is significant skill at a 5 month lead (Figure 11). For precipitation, correlations are low, reflecting the concentration of precipitation in March and April (Figure 5), although in the low precipitation regions of Sindh, ROC-AUC scores are >0.5. The prediction skill for all metrics is markedly higher at a 2-month lead (Figure 12), with correlations >0.9 and near perfect ROC-AUC scores in most districts. From these results, it can be surmised that at a 2-month lead, the primary issue is not with prediction of any particular metric, but of the relevance of that metric for impactful drought. This is illustrated by the comparisons with observed wheat yield (Supplementary Figures S3, S4), which show lower skill at both 5- and 2- months lead. Further error is introduced in the scaling up of the district predictions to the province scale. The rest of this paper therefore focuses on the implementation of the DRF at the province scale.
3.3 What is the appropriate threshold for triggering the DRF?
The trigger threshold is determined at the district level for a given return period and for each metric as follows:
• District level data are extracted for 2002–2021 (i.e., the last 20 years)
• The data are linearly detrended
• The triggering threshold in the detrended data is determined using an empirical method to calculate the user specified percentile
The return period is the interval – generally measured in years – between events of a particular magnitude. It can be approximated as:
The return period can be adjusted in two ways: by changing the metric threshold at which individual districts trigger (i.e., drought intensity); or by changing the population threshold at which the scheme is triggered at the province level (i.e., how many people affected). Figure 13 illustrates the estimated return periods for a range of combinations of individual district drought thresholds and province population threshold for the chosen province-scale metrics [all metrics are displayed in the supplementary materials (Supplementary Figure S5)].
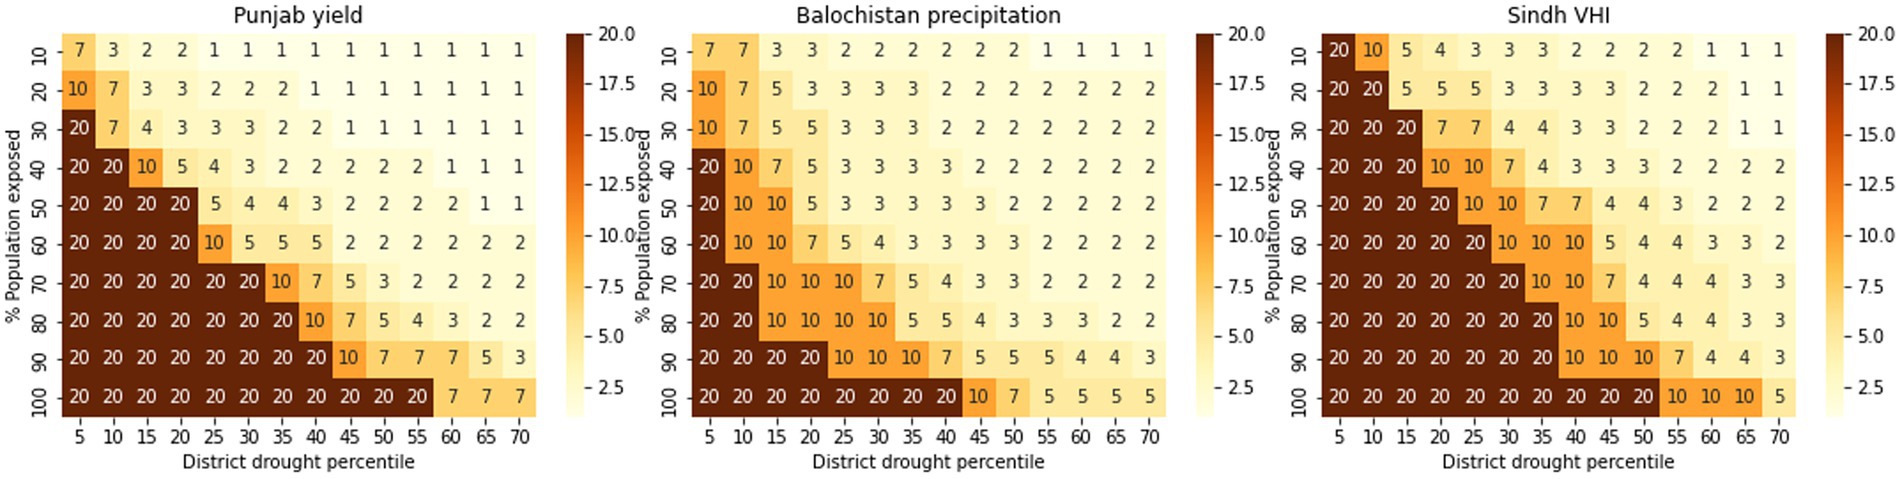
Figure 13. Heat maps of return period for droughts for each province, based on the selected drought metrics (Punjab wheat production; Baluchistan precipitation; Sindh VHI). The heat maps show the relationship between the % population exposed (how widespread the drought is), and the district scale triggering threshold (how intense the drought is). The colours and numbers show return period, with high return periods (rare events) shaded in darker colours than low return periods (common events).
Comparison between the regions shows that there is some variation between regions and metrics in return period for a given intensity and exposure. For example, for the parameters set for the 2020/2021 model, the return period would be 3 years for precipitation in Punjab, 5 years for VHI in Sindh and 5 years for NDVI in Baluchistan. These values should be treated with caution, however, since the data are noisy, and the time span of the dataset is short. The trigger values chosen will depend on the desired trade-off between exposure and intensity and the severity of event targeted by the DRF. For the purposes of the evaluations reported here, we will use 20th percentile drought; >25% of the population exposed.
It is possible to incorporate some notion of vulnerability into the DRF by adjusting the return period for triggering, or by adjusting the probability threshold for a pay out. For example, we know that the model has skill at detecting drought events well when the probability threshold is set to ≥0.5. However, it’s possible to adjust the probability threshold so that there are fewer false negatives (missing an event) for the vulnerable districts (albeit at the cost of more false alarms). This would mean that the most vulnerable districts trigger more often than the more prosperous regions (Boult et al., 2022).
To account for district-to-district variation in vulnerability, the system offers the facility to vary the probability threshold for identifying a district-scale drought. To identify which districts are classed as vulnerable, the decision was made to use the NDMA classification of vulnerable districts. By using the NDMA classification we are aligning with the government’s view of drought risk. The districts classed as ‘severely vulnerable’ to drought, had their probability thresholds lowered to 0.4 – meaning that a drought affecting a vulnerable district was less likely to be missed.
3.4 Informal comparison against historical accounts
As was highlighted in the introduction, evaluation of drought metrics is highly challenging for the Rabi season for Pakistan because of the lack of reliable on-the-ground information on historical drought. It is nevertheless important to consider how the DRF would have triggered in the past. Figure 14 shows a time series of the percentage of the population affected by a worse than 20th percentile drought, as defined by VHI, NDVI, precipitation, observed wheat production and simulated wheat production. Supplementary Table S1 summarises anecdotally reported incidences of drought. Maps showing which districts triggered in each year are provided in the Supplementary Materials (Supplementary Figures S6, S7). All the metrics, apart from NDVI triggered at the province scale during the catastrophic drought that affected Pakistan during 2001–2002. The continued impact on production for the 2002–2003, in spite of normal precipitation, was captured by the production observations (as would be expected), and also by the production simulations. Anecdotal reports of moderate and mild Rabi droughts were less consistent, and it was often difficult to ascertain which season was being described – especially from earlier accounts.
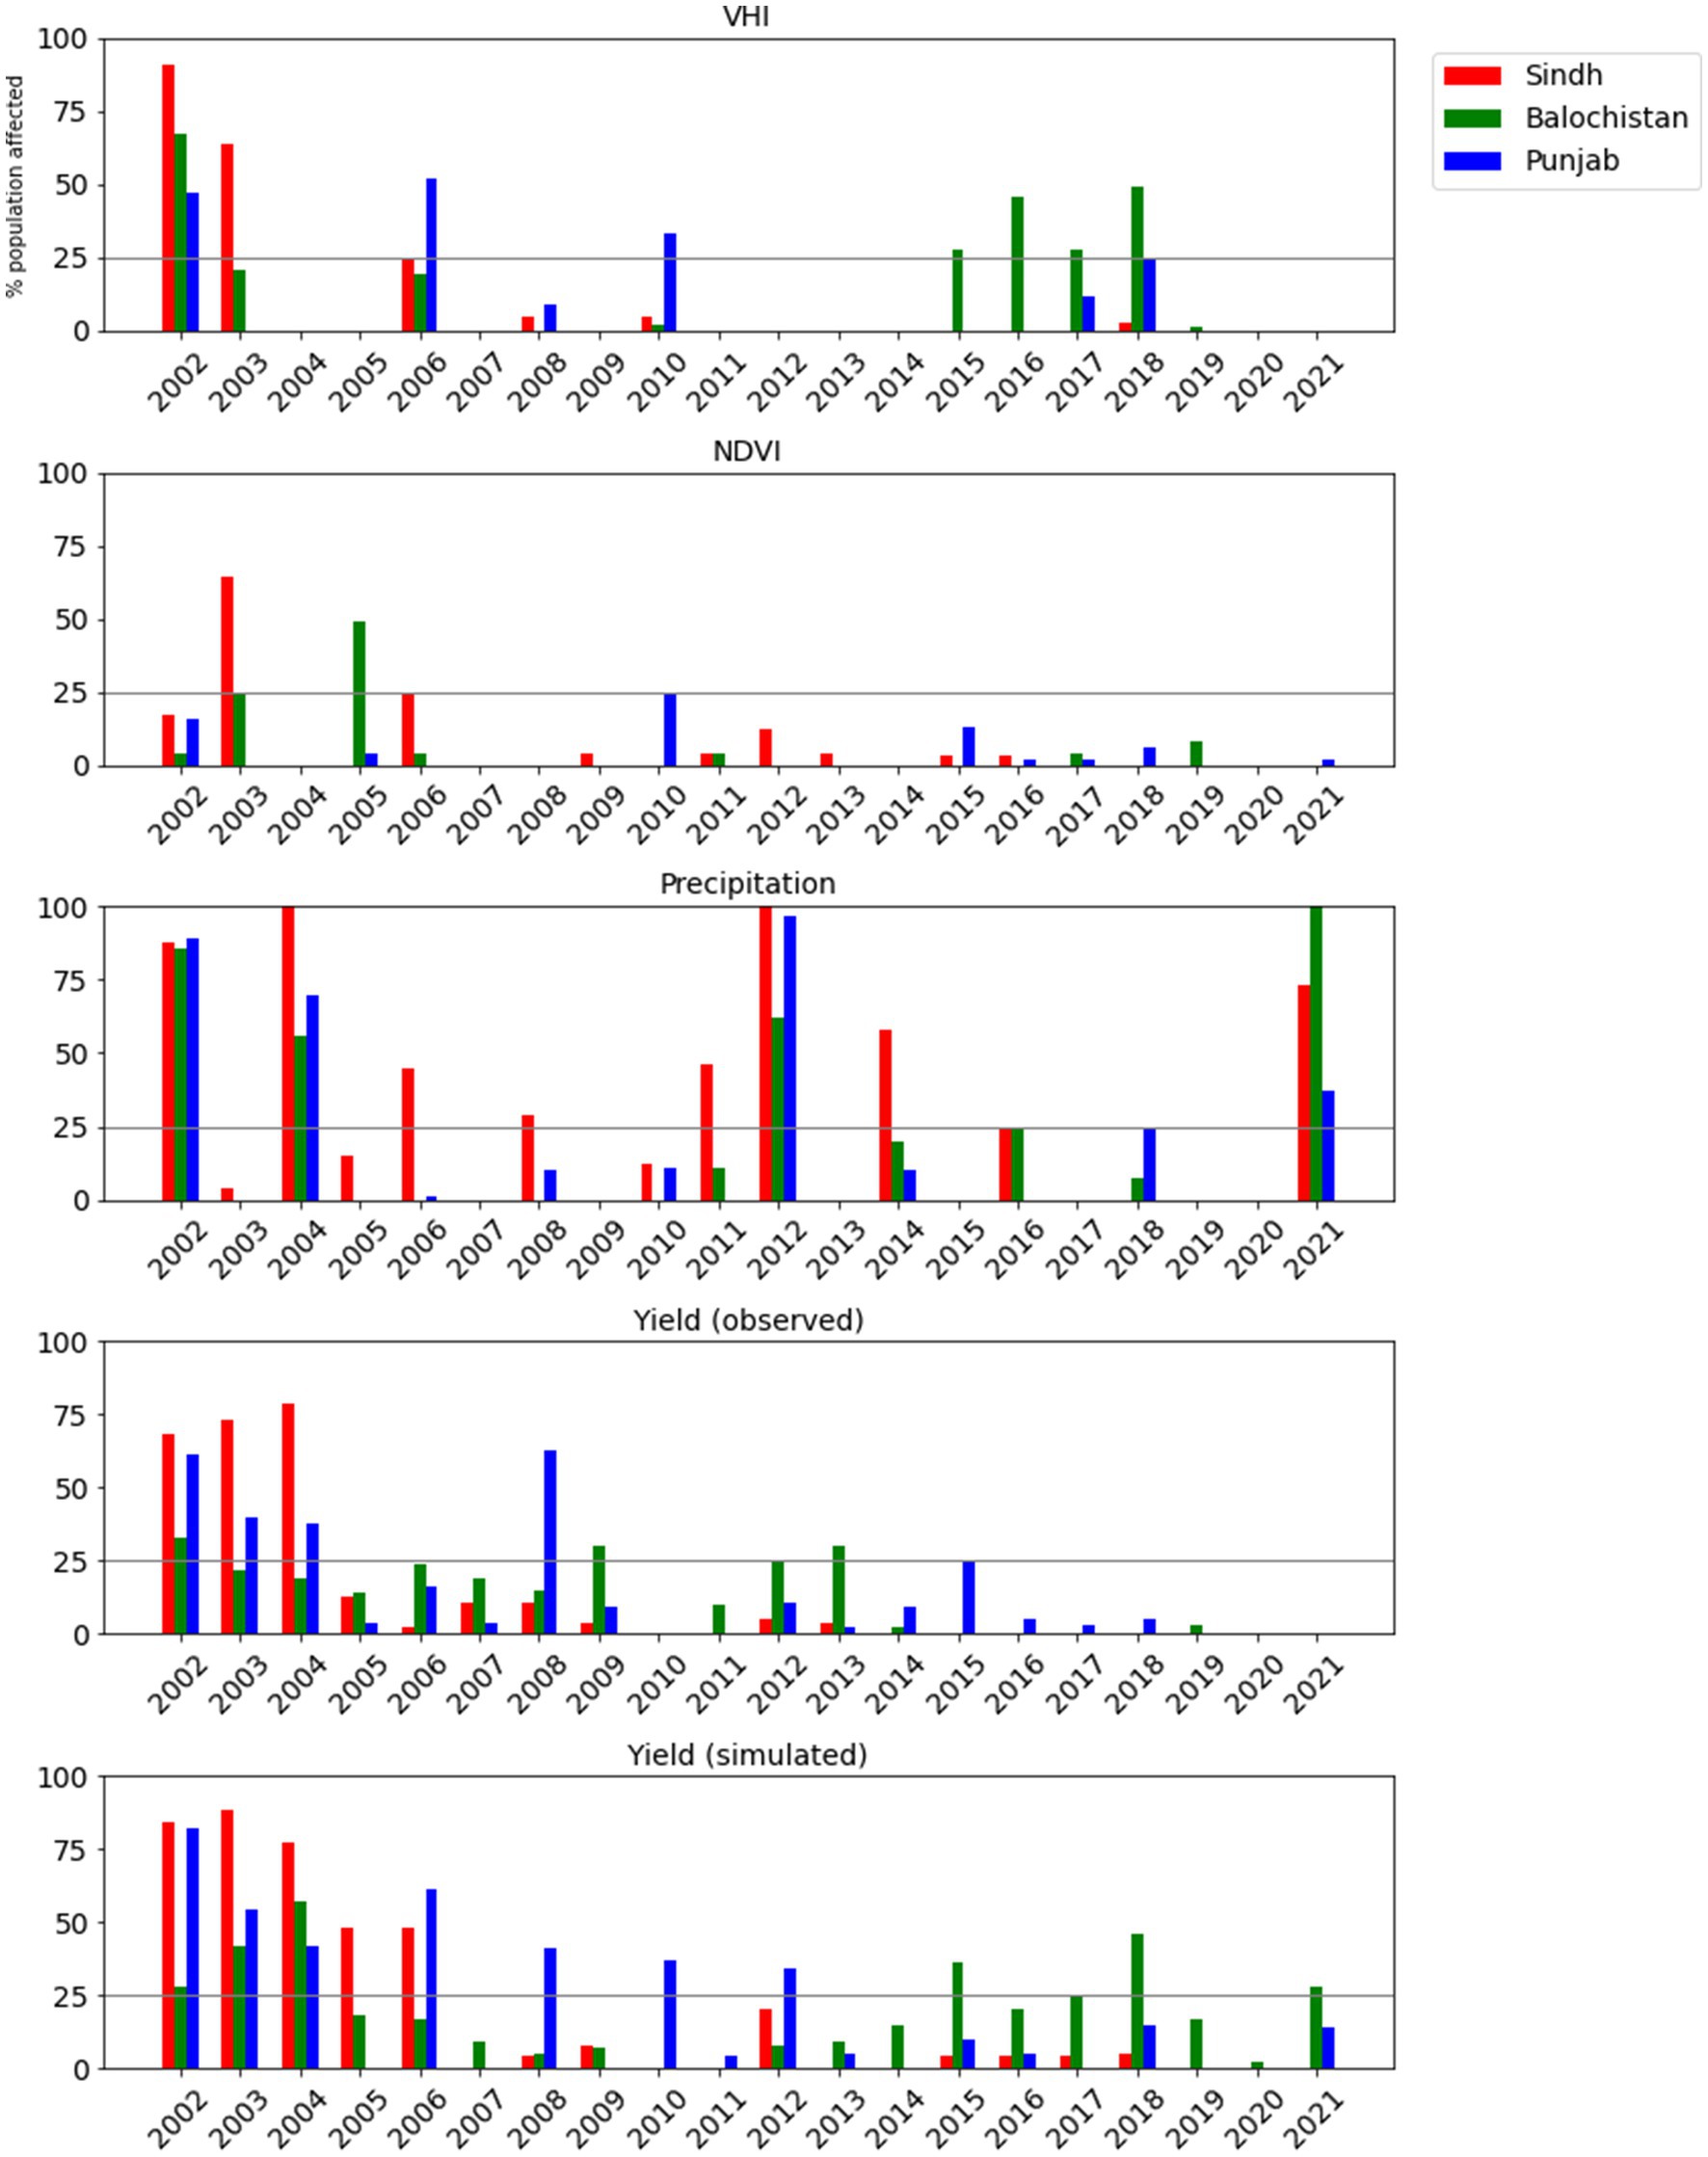
Figure 14. Time series of the percentage of the population of Punjab, Sindh and Baluchistan (shown as different coloured bars) living in districts where there is a drought event. Drought is defined as a district-scale mean < 25th percentile of, from top to bottom: VHI, NDVI, precipitation, observed production of wheat, simulated production of wheat.
Comparison between the variables confirms the sensitivity of the drought assessments to the choice of metric. For example, in 2012, there was widespread low precipitation and low yield in Punjab, but VHI-defined drought did not affect any of the three provinces. Interestingly, although the simulated production was based on NDVI, the correspondence between NDVI- and simulated production-defined droughts is low, reflecting the importance of defining the cropping area in the production simulation process (see Section 2.4). On the other hand, the correspondence between droughts defined by simulated and observed production is high, reflecting the good skill of the model, especially for Punjab. As would be expected from the previous comparisons between NDVI, precipitation, VHI and precipitation, the proportion of the population affected by a 20th percentile event also varies between drought metrics, with widespread low yield occurring more frequently than widespread low VHI, for example.
3.5 How far ahead of the end of the season can we be confident that the DRF will be triggered?
The key factor for the DRF is not skill at a district scale (as described in Sections 3.1 and 3.2) but rather accurate triggering at the province level. The following discussion therefore analyses the drought model’s skill at triggering at the province level. A simulated or observed ‘event’ is a province level trigger of the scheme. For the sake of brevity, we only consider the following parameters:
• Districts experience drought if the metric is predicted to be less than the 20th percentile
• Provinces experience drought if more than 25% of the population are living in drought affected districts
• An event is said to be predicted to occur if the probability is greater than 0.5
The results of the analysis are summarised in Figure 15 for each of the provinces. The skill metric shown is accuracy, which is simply the proportion of correctly forecast events, either true negatives or hits. Additional metrics of skill are supplied in Supplementary Figures S8–S10 in the supplementary materials. Because this set up of the TAMSAT-ALERT system does not include any meteorological forecasts, as was described in Section 3.2, for precipitation, there will be no skill until most of the climatological rainy season has passed. For NDVI and VHI, there will be some skill at the outset because of the persistence of antecedent conditions, and the model will peak in skill as incrementation of land surface greenness slows. The skill in the yield forecasts depends both on the predictability of NDVI and on the timing of the critical development period identified by the modelling system. Interestingly, there is some variation between the three provinces, reflecting the variation in the climatological seasonal cycles of the metrics. For all three metrics, the accuracy improves only slightly after February (2 months in advance of the season end), suggesting that robust assessments of drought can be made from February onwards.

Figure 15. Accuracy of forecasts (% correct forecasts) of province-scale triggering for NDVI, VHI, precipitation and modelled yield (shown as different colours) for forecasts initiated in successive months from November – April. From left – right: Punjab, Sindh and Baluchistan. The bold lines show the selected metric for the provinces.
4 Operational implementation of the DRF
The DRF was developed jointly by the Start Network (UK and Pakistan offices) and the University of Reading. During the first year of operation, the system was entirely run at the University of Reading, and since then responsibility for the DRF has gradually been devolved to the Start Network technical team. All decisions on payouts are made by the Start Network, in consultation with local stakeholders.
Throughout the year, the variables that drive the system (see section 2) are automatically downloaded and subsetted for Pakistan. November–April forecasts for each variable are generated automatically whenever new data are available. Summary outputs, consisting of the number of districts triggering and the population affected, are shared via a dashboard http://192.248.167.129/pakistan_drought_data/model_output/drought_model_output_summary.html.
From ~December/January onwards, the dashboard outputs are regularly reviewed and informally evaluated by the Start Network UK and Pakistan offices – as well as by the University of Reading. The final output is made available at the end of February. At this stage, the results are reviewed to ascertain whether a basis risk event may have occurred. Payouts are made at the province level, based on the donor funding available. If there is strong evidence for a basis risk event, further evaluations are conducted, and additional payments may be made.
5 Reflections and conclusions
Despite the potential value of seasonal forecasts for anticipatory action (for example Mwangi et al., 2022), their use in drought DRFs has historically been limited. The statistical observational/forecasting approach utilised in the Pakistan DRF enables quantitative assessment of the probability of drought in advance of the season end. As such, it differs from previous approaches to large-scale drought disaster risk financing and weather index insurance, which rely on monitoring of past and current conditions (for example, Black et al., 2016a,b; Fava and Vrieling, 2021). Developing a novel modelling approach and then immediately operationalising it proved highly challenging, and the process of supporting the DRF has taught us a number of lessons.
Firstly, although during the most severe events, most drought metrics agree, for mild and moderate events, agreement is poor. For example, in some years, low precipitation was not associated with low NDVI or low VHI, and vice versa. Given these findings, it might seem sensible to select the most ‘impact-relevant’ metric for each province. However, selecting metrics this way requires a systematic comparison against agreed occurrence of impactful drought. For the secondary growing season, such data are inconsistent and unreliable. The exception is winter wheat production in Punjab, which is undoubtedly impactful on both a province and national scale and which has been carefully recorded at district level since the 1980s. The development and operational implementation of an NDVI-based winter wheat forecasting model for Punjab represents a significant technological advance. For the other provinces, the only option was to base the drought metric selection on an informal assessment of the hydrometeorological setting.
Secondly, the predictive power of the drought monitoring and forecasting system facilitates decision-making, especially if there is a basis risk event. For example, during the 2021–2022 season, drought conditions in Sindh were not identified by our system. Having warning 2 months in advance of the season end that the DRF was unlikely to trigger enabled measures to be put into place for an ex gracia pay out, totalling ~300 K GBP.
Thirdly, the challenges we have had developing and validating our drought monitoring and prediction model for Sindh and Baluchistan are largely due to a lack of data on historical impactful drought. This contrasts with the high quality crop monitoring for Punjab, which enabled us (and others) to develop skillful wheat yield models. A key lesson from this study is the value of both historical observations and anecdotal accounts of drought (see also Mauerman et al., 2022). There is an urgent need for a systematic approach to collecting, curating and rescuing such data.
Finally, for technical and administrative reasons, during the pilot phase of the DRF, it has not been possible to implement a process by which precipitation forecasts are automatically downloaded from the Pakistan Meteorological Department (PMD) and assimilated into the TAMSAT-ALERT system. The skill of the predictions might, however, be improved by the integration of meteorological forecasts (Boult et al., 2020). Importantly, using meteorological forecasts would ensure consistency between the meteorological drought warnings issued by the Pakistan Meteorological Department and the Start DRF – especially for Baluchistan, where the DRF is based on precipitation. A key lesson learnt is therefore the importance of strong engagement with national hydrometeorological services from the outset. Further collaboration with PMD, leading toward incorporation of meteorological forecasts would be a valuable future development.
In spite of the challenges described above, the DRF developed in this study represents a significant advance on the previous approaches for the region. In a hydrologically complex region like Pakistan, precipitation is not an adequate metric of drought – especially during the secondary growing season, when precipitation tends to be low. The use of a range of metrics including precipitation, wheat yield, NDVI and VHI, provides a holistic picture of agricultural drought. In the future, composite indices might provide a more precise metric. Another advance is the use of a computationally light-weight forecasting system. The forecasts enable the DRF to be truly anticipatory – facilitating prompt release of funds, and advance warning of basis risk events.
In conclusion, this paper has presented an account of the development of a drought monitoring and forecasting system for the Start Disaster Risk Finance (DRF) programme in three provinces of Pakistan. Implementing the DRF in such an environmentally diverse region has been a challenge, both scientifically and operationally. It is too early for robust evaluation, but it is hoped that the demonstration of the utility of Earth Observation data for prediction as well as monitoring, together with the development of a computationally light-weight yield forecasting model will have wide application in Pakistan and beyond.
Data availability statement
Publicly available datasets were analyzed in this study. This data can be found here: https://www.undp.org/sites/g/files/zskgke326/files/migration/pk/MPI-4pager.pdf; http://www.amis.pk/Agristatistics/DistrictWise/DistrictWiseData.aspx; https://crs.agripunjab.gov.pk/reports; http://www.amis.pk/agristatistics/statistics.aspx; https://www.star.nesdis.noaa.gov/smcd/emb/vci/VH/vh_ftp.php. Data from the Pakistan census is publicly released by the Pakistan Bureau of Statistics (https://www.pbs.gov.pk).
Author contributions
EB: Conceptualization, Data curation, Methodology, Validation, Writing – original draft, Writing – review & editing. RM: Data curation, Writing – review & editing. ER: Project administration, Supervision, Writing – review & editing. EN: Project administration, Writing – review & editing.
Funding
The author(s) declare that financial support was received for the research, authorship, and/or publication of this article. This work was supported by the National Centre for Atmospheric Science through the NERC National Capability International Programmes Award (NC/X006263/1). It was also supported by the START Network via the following donors: Foreign Commonwealth and Development Office (FCDO), The German Federal Foreign Office (GFFO) and the Ministry of Foreign Affairs of the Netherlands.
Acknowledgments
The Drought Technical working group (DTWG) has been a key partner in this initiative. The DTWG have helped design and provide feedback on the implementation of the formal contingency plans and threshold settings decisions. The DTWG also perform critical technical, operational and coordination functions of the DRF system in Pakistan. We are particularly grateful for the contribution of Syed Sulaiman, the Chair of the DTWG. We also acknowledge the valuable advice and support we received from the Ready Pakistan Hub. The authors are grateful to John Ellis for his help with the additional hindcasts and skill assessments included at the revision stage of the manuscript.
Conflict of interest
The authors declare that the research was conducted in the absence of any commercial or financial relationships that could be construed as a potential conflict of interest.
The author(s) declared that they were an editorial board member of Frontiers, at the time of submission. This had no impact on the peer review process and the final decision.
Publisher’s note
All claims expressed in this article are solely those of the authors and do not necessarily represent those of their affiliated organizations, or those of the publisher, the editors and the reviewers. Any product that may be evaluated in this article, or claim that may be made by its manufacturer, is not guaranteed or endorsed by the publisher.
Supplementary material
The Supplementary material for this article can be found online at: https://www.frontiersin.org/articles/10.3389/fclim.2024.1332233/full#supplementary-material
Footnotes
3. ^The Pearson correlation coefficient quantifies the linear relationship between two quantities. An ‘r’ value of 1 indicates a perfect linear relationship, and an ‘r’ value of −1 indicates a perfect inverse linear relationship. r2 is equivalent to the amount of variance of the independent variable explained by the dependent variable A statistically significant correlation at the 95% level for a 40 year time series of hindcasts is r = ~0.3 or r2 = 0.1. For a DRF, which targets droughts, it is necessary to assess the system’s ability to identify severe events. The ROC score accomplishes this by comparing false alarm rates (FAR) against true positive rates (TPR), with an event defined as having been predicted if a user-defined probability threshold is breached. If the FAR and TPR are plotted against each other for a range of probability thresholds, the area under the curve is known as the ROC-AUC. A ROC-AUC of 0.5 indicates climatological skill with a perfect score being 1 (see https://www.swpc.noaa.gov/content/roc-receiver-operating-characteristic-curves for an introduction to the ROC-AUC).
References
Ahmed, K., Shahid, S., and Nawaz, N. (2018). Impacts of climate variability and change on seasonal drought characteristics of Pakistan. Atmos. Res. 214, 364–374. doi: 10.1016/j.atmosres.2018.08.020
Asfaw, D., Black, E., Brown, M., Nicklin, K. J., Otu-Larbi, F., Pinnington, E., et al. (2018). TAMSAT-ALERT v1: a new framework for agricultural decision support. Geosci. Model Dev. 11, 2353–2371. doi: 10.5194/gmd-11-2353-2018
Badruddin, M . (1993) An overview of irrigation in Pakistan IIMI working paper. Availableat: https://publications.iwmi.org/pdf/H_12516.pdf
Bastiaanssen, W. G., and Ali, S. (2003). A new crop yield forecasting model based on satellite measurements applied across the Indus Basin, Pakistan. Agric. Ecosyst. Environ. 94, 321–340. doi: 10.1016/S0167-8809(02)00034-8
Bastiaanssen, W. G., Molden, D. J., and Makin, I. W. (2000). Remote sensing for irrigated agriculture: examples from research and possible applications. Agric. Water Manag. 46, 137–155. doi: 10.1016/S0378-3774(00)00080-9
Biemans, H., Siderius, C., Mishra, A., and Ahmad, B. (2016). Crop-specific seasonal estimates of irrigation-water demand in South Asia. Hydrol. Earth Syst. Sci. 20, 1971–1982. doi: 10.5194/hess-20-1971-2016
Black, E., Greatrex, H., Young, M., and Maidment, R. (2016a). Incorporating satellite data into weather index insurance. Bull. Am. Meteorol. Soc. 97, ES203–ES206. doi: 10.1175/BAMS-D-16-0148.1
Black, E., Tarnavsky, E., Maidment, R., Greatrex, H., Mookerjee, A., Quaife, T., et al. (2016b). The use of remotely sensed rainfall for managing drought risk: a case study of weather index insurance in Zambia. Remote Sens. 8:342. doi: 10.3390/rs8040342
Bokusheva, R., Kogan, F., Vitkovskaya, I., Conradt, S., and Batyrbayeva, M. (2016). Satellite-based vegetation health indices as a criteria for insuring against drought-related yield losses. Agric. For. Meteorol. 220, 200–206. doi: 10.1016/j.agrformet.2015.12.066
Boult, V. L., Asfaw, D. T., Young, M., Maidment, R., Mwangi, E., Ambani, M., et al. (2020). Evaluation and validation of TAMSAT-ALERT soil moisture and WRSI for use in drought anticipatory action. Meteorol. Appl. 27:e 1959. doi: 10.1002/met.1959
Boult, V. L., Black, E., Abdillahi, H. S., Bailey, M., Harris, C., Kilavi, M., et al. (2022). Towards drought impact-based forecasting in a multi-hazard context. Clim. Risk Manag. 35:100402.
Brown, M., Black, E., Asfaw, D., and Otu-Larbi, F. (2017). Monitoring drought in Ghana using TAMSAT-ALERT: a new decision support system. Weather 72, 201–205. doi: 10.1002/wea.3033
Chaves-Gonzalez, J., Milano, L., Omtzigt, D. J., Pfister, D., Poirier, J., Pople, A., et al. (2022). Anticipatory action: lessons for the future. Front. Clim. 4:932336. doi: 10.3389/fclim.2022.932336
Coughlan de Perez, E., Van den Hurk, B., Van Aalst, M. K., Amuron, I., Bamanya, D., Hauser, T., et al. (2016). Action-based flood forecasting for triggering humanitarian action. Hydrol. Earth Syst. Sci. 20, 3549–3560. doi: 10.5194/hess-20-3549-2016
Coughlan de Perez, E., van den Hurk, B. J., Van Aalst, M. K., Jongman, B., Klose, T., and Suarez, P. (2015). Forecast-based financing: an approach for catalyzing humanitarian action based on extreme weather and climate forecasts. Nat. Hazards Earth Syst. Sci. 15, 895–904. doi: 10.5194/nhess-15-895-2015
Emerton, R., Cloke, H., Ficchi, A., Hawker, L., de Wit, S., Speight, L., et al. (2020). Emergency flood bulletins for cyclones Idai and Kenneth: a critical evaluation of the use of global flood forecasts for international humanitarian preparedness and response. Int. J. Disaster Risk Reduct. 50:101811. doi: 10.1016/j.ijdrr.2020.101811
Fava, F., and Vrieling, A. (2021). Earth observation for drought risk financing in pastoral systems of sub-Saharan Africa. Curr. Opin. Environ. Sustain. 48, 44–52. doi: 10.1016/j.cosust.2020.09.006
Funk, C., Peterson, P., Landsfeld, M., Pedreros, D., Verdin, J., Shukla, S., et al. (2015). The climate hazards infrared precipitation with stations—a new environmental record for monitoring extremes. Sci. Data 2, 1–21. doi: 10.1038/sdata.2015.66
Grunewald, F., Leon, V., and Levine, S., (2019). Comprehensive review of the 2016–17 ECHO horn of Africa drought response. GroupeURD, Paris
Jones, J. W., Hoogenboom, G., Porter, C. H., Boote, K. J., Batchelor, W. D., Hunt, L. A., et al. (2003). The DSSAT cropping system model. Eur. J. Agron. 18, 235–265. doi: 10.1016/S1161-0301(02)00107-7
Keating, B. A., Carberry, P. S., Hammer, G. L., Probert, M. E., Robertson, M. J., Holzworth, D., et al. (2003). An overview of APSIM, a model designed for farming systems simulation. Eur. J. Agron. 18, 267–288. doi: 10.1016/S1161-0301(02)00108-9
Khan, S., Ahmad, F., Sadaf, S., and Kashif, R. (2009), Crops areaand production (by districts) 1981–82 to 2008–09 volume 1 food and cash crops Bureau of Statistics (Economic Wing), Statistics Division, Government of Pakistan, Islamabad.)
Kogan, F., Guo, W., Yang, W., and Shannon, H. (2018). Space-based vegetation health for wheat yield modeling and prediction in Australia. J. Appl. Remote. Sens. 12:026002. doi: 10.1117/1.JRS.12.026002
Kogan, F., Yang, B., Wei, G., Zhiyuan, P., and Xianfeng, J. (2005). Modelling corn production in China using AVHRR-based vegetation health indices. Int. J. Remote Sens. 26, 2325–2336. doi: 10.1080/01431160500034235
Levine, S., Wilkinson, E., Weingärtner, L., and Mall, P., (2020). Anticipatory action for livelihood protection. Overseas Development Institute. Available at: https://www.anticipation-hub.org/Documents/Policy_Papers/Anticipatory_action_for_livelihood_protection_a_collective_endeavour.pdf
Li, Z., Zhang, Z., and Zhang, L. (2021). Improving regional wheat drought risk assessment for insurance application by integrating scenario-driven crop model, machine learning, and satellite data. Agric. Syst. 191:103141. doi: 10.1016/j.agsy.2021.103141
Mauerman, M., Black, E., Boult, V. L., Diro, R., Osgood, D., Greatrex, H., et al. (2022). An information-theoretic approach to reconciling historical climate observations and impacts on agriculture. Weather, Clim. Soc. 14, 1321–1337. doi: 10.1175/WCAS-D-22-0019.1
Murthy, C. S., Poddar, M. K., Choudhary, K. K., Pandey, V., Srikanth, P., Ramasubramanian, S., et al. (2022). Paddy crop insurance using satellite-based composite index of crop performance. Geomat. Nat. Haz. Risk 13, 310–336. doi: 10.1080/19475705.2021.2025155
Mwangi, E., Taylor, O., Todd, M. C., Visman, E., Kniveton, D., Kilavi, M., et al. (2022). Mainstreaming forecast based action into national disaster risk management systems: experience from drought risk management in Kenya. Clim. Dev. 14, 741–756. doi: 10.1080/17565529.2021.1984194
Nawaz, M., Iqbal, M. F., and Mahmood, I. (2021). Validation of CHIRPS satellite-based precipitation dataset over Pakistan. Atmos. Res. 248:105289. doi: 10.1016/j.atmosres.2020.105289
Portmann, F. T., Siebert, S., and Döll, P. (2010). MIRCA2000—global monthly irrigated and rainfed crop areas around the year 2000: a new high-resolution data set for agricultural and hydrological modeling. Glob. Biogeochem. Cycles 24, 1–24. doi: 10.1029/2008GB003435
Rafi, Z., and Ahmad, R. (2005). Wheat crop model based on water balance for agrometeorological crop monitoring. Pak. J. Sci. 2, 22–33.
Salakpi, E. E., Hurley, P. D., Muthoka, J. M., Bowell, A., Oliver, S., and Rowhani, P. (2022). A dynamic hierarchical Bayesian approach for forecasting vegetation condition. Nat. Hazards Earth Syst. Sci. 22, 2725–2749. doi: 10.5194/nhess-22-2725-2022
Speight, L., Stephens, E., Hawker, L., Baugh, C., Neal, J., Cloke, H., et al. (2023). Recommendations to improve the interpretation of global flood forecasts to support international humanitarian operations for tropical cyclones. J. Flood Risk Manag. :e12952. doi: 10.1111/jfr3.12952
Steduto, P., Hsiao, T. C., Raes, D., and Fereres, E. (2009). Aqua crop—the FAO crop model to simulate yield response to water: I. Concepts and underlying principles. Agron. J 101, 426–437. doi: 10.2134/agronj2008.0139s
USAID (2014) Pakistan emergency situational analysis: District Khairpur Available at:https://reliefweb.int/report/pakistan/pakistan-emergency-situational-analysis-district-khairpur-june-2014
Wilkinson, E., Pforr, T., and Weingärtner, L., (2020). Integrating ‘anticipatory action’in disaster risk management. Overseas Development Institute, London.
Williams, J. R., Jones, C. A., Kiniry, J. R., and Spanel, D. A. (1989). The EPIC crop growth model. ASAE 32, 497–0511. doi: 10.13031/2013.31032
Wu, Y., Guo, H., Zhang, A., and Wang, J. A. (2021). Establishment and characteristics analysis of a crop–drought vulnerability curve: a case study of European winter wheat. Nat. Hazards Earth Syst. Sci. 21, 1209–1228. doi: 10.5194/nhess-21-1209-2021
Yang, W., Kogan, F., Guo, W., and Chen, Y. (2021). A novel re-compositing approach to create continuous and consistent cross-sensor/cross-production global NDVI datasets. Int. J. Remote Sens. 42, 6023–6047. doi: 10.1080/01431161.2021.1934597
Keywords: Pakistan, drought, Disaster Risk Finance, anticipatory action, forecasting
Citation: Black E, Maidment RI, Rees E and Nderitu E (2024) A new drought model for disaster risk management in the Punjab, Sindh and Baluchistan provinces of Pakistan. Front. Clim. 6:1332233. doi: 10.3389/fclim.2024.1332233
Edited by:
Clare Harris, Independent Researcher, London, United KingdomReviewed by:
Beatrice Monteleone, University Institute of Higher Studies in Pavia, ItalyTufa Dinku, Columbia University, United States
Copyright © 2024 Black, Maidment, Rees and Nderitu. This is an open-access article distributed under the terms of the Creative Commons Attribution License (CC BY). The use, distribution or reproduction in other forums is permitted, provided the original author(s) and the copyright owner(s) are credited and that the original publication in this journal is cited, in accordance with accepted academic practice. No use, distribution or reproduction is permitted which does not comply with these terms.
*Correspondence: Emily Black, ZS5jLmwuYmxhY2tAcmVhZGluZy5hYy51aw==